Daily Market Analysis
Market Focus
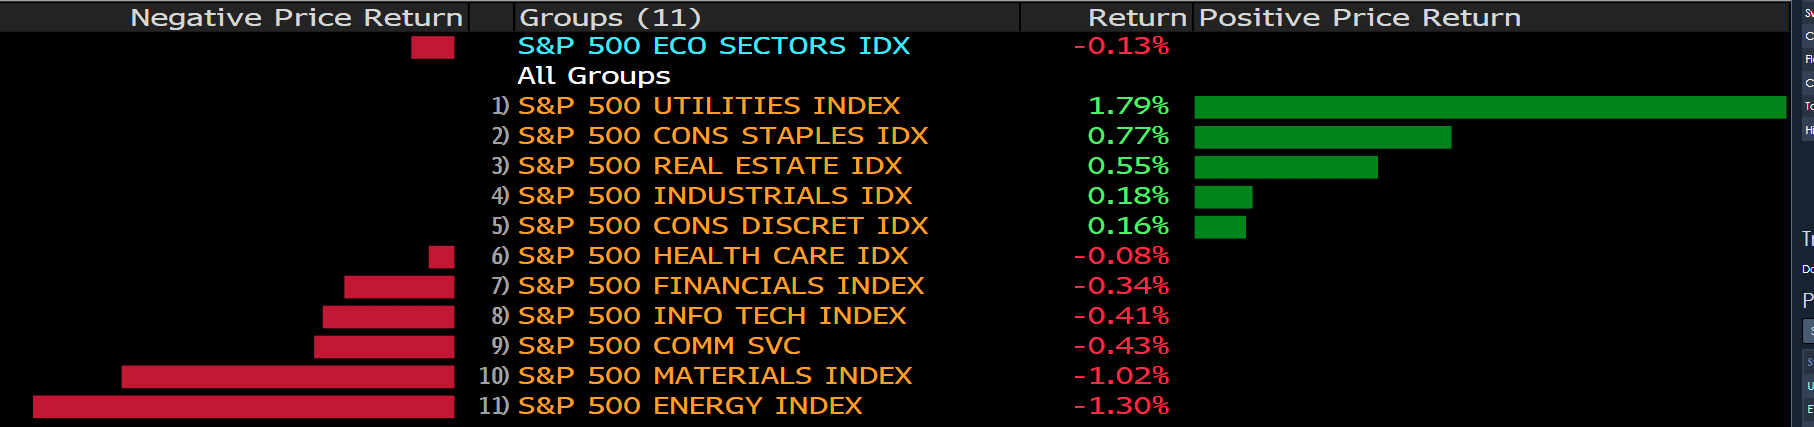
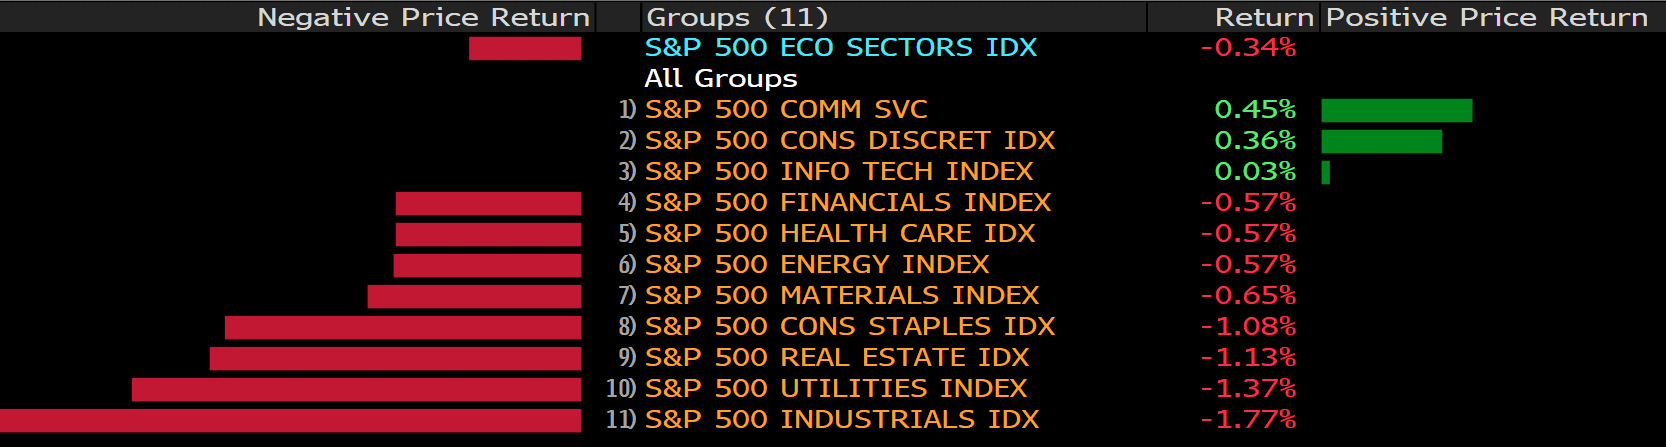
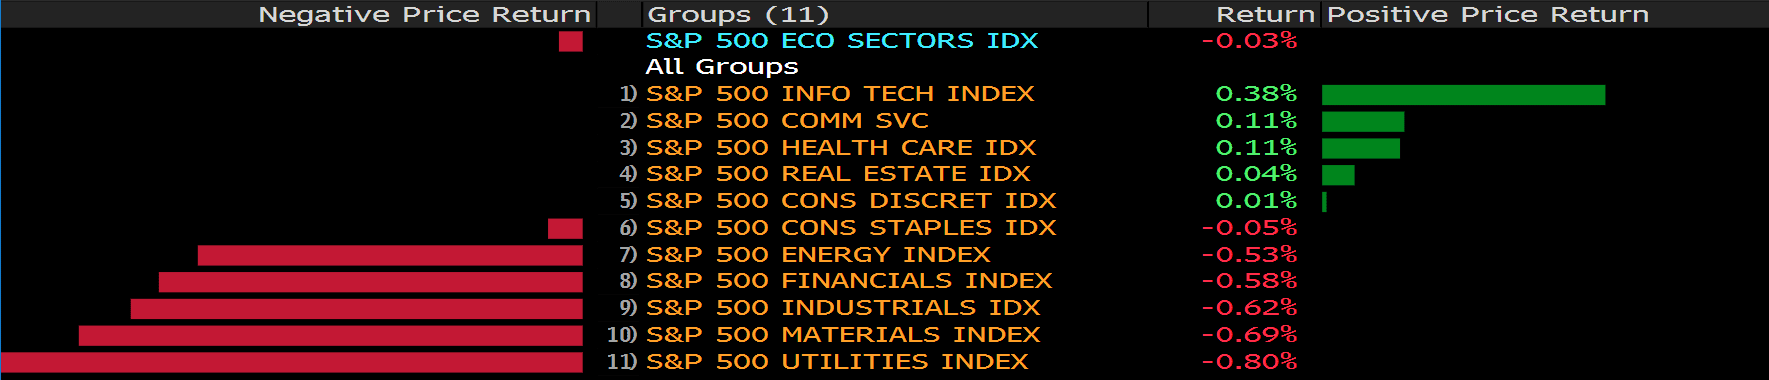
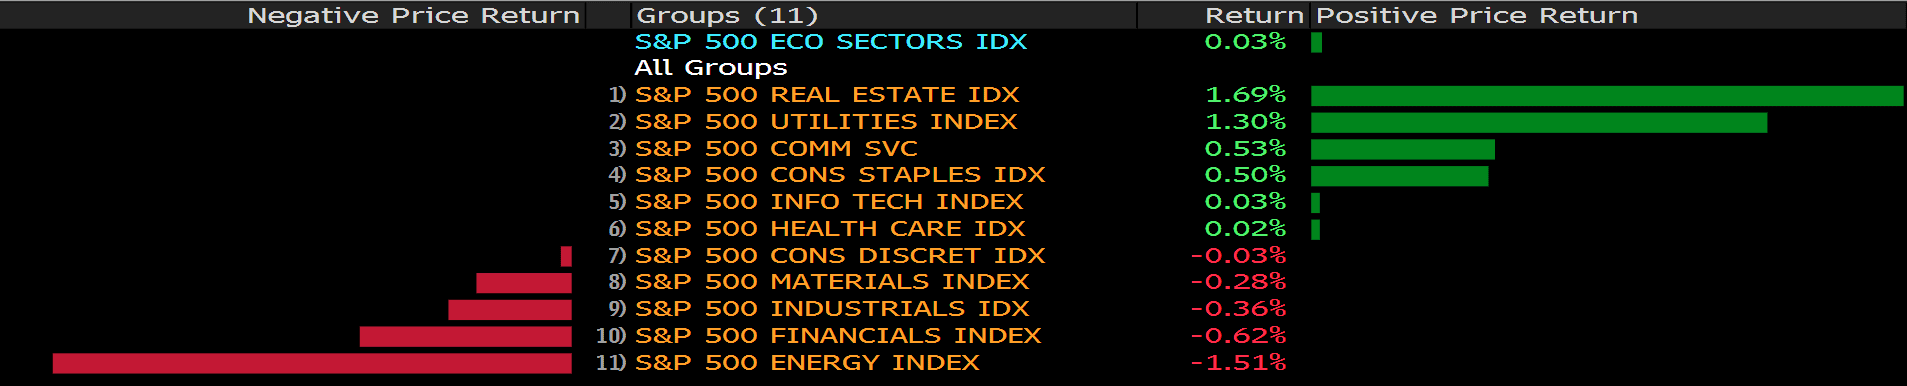
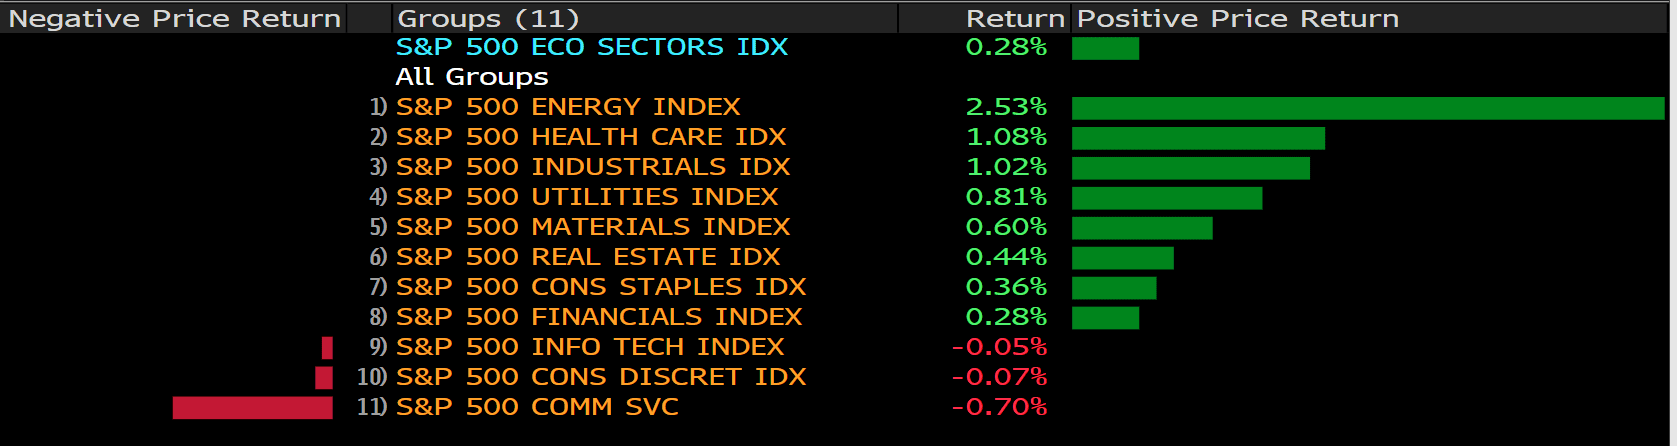
Stocks rose ahead of a key jobs report that will shape bets on the path of interest rates and the Federal Reserve’s massive bond-buying program. The S&P 500 closed at a fresh record, with energy and industrial shares among the biggest gainers. Technology underperformed. The U.S. probably added 725,000 jobs in August — a more moderate pace compared to each of the prior two months, but stronger than gains seen early this year. Atlanta Fed President Raphael Bostic said “we’re going to let the economy continue to run until we see signs of inflation,” before stepping in on rates.
Democrat senator Joe Manchin is demanding a “strategic pause” in action on President Joe Biden’s economic agenda, potentially imperiling the $3.5 trillion tax and spending package that Democratic leaders plan to push through Congress this fall.
“By placing a strategic pause on this budgetary proposal, by significantly reducing the size of any possible reconciliation bill to only what America can afford and needs to spend, we can and will build a better and stronger nation for all our families,” Manchin said in the op-ed.
Manchin’s resistance to the core of Biden’s economic plan caps a politically painful month for a White House that has grappled with a chaotic withdrawal from Afghanistan, a resurgent pandemic and a massive hurricane that cut a path of death and damage from Louisiana to New York.
In comments Wednesday at an event hosted by the West Virginia Chamber of Commerce, the moderate Democrat said his party should “hit the pause button.” Lawmakers, he said, have too many other pressing issues before them, including heightening national security concerns after the Taliban takeover of Afghanistan.
“Let’s sit back. Let’s see what happens. We have so much on our plate,” he said.
Main Pairs Movement:
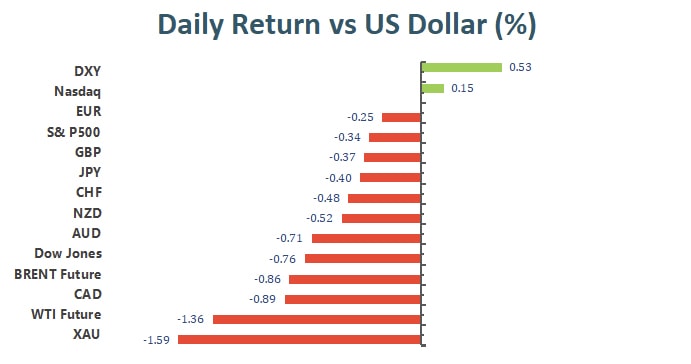
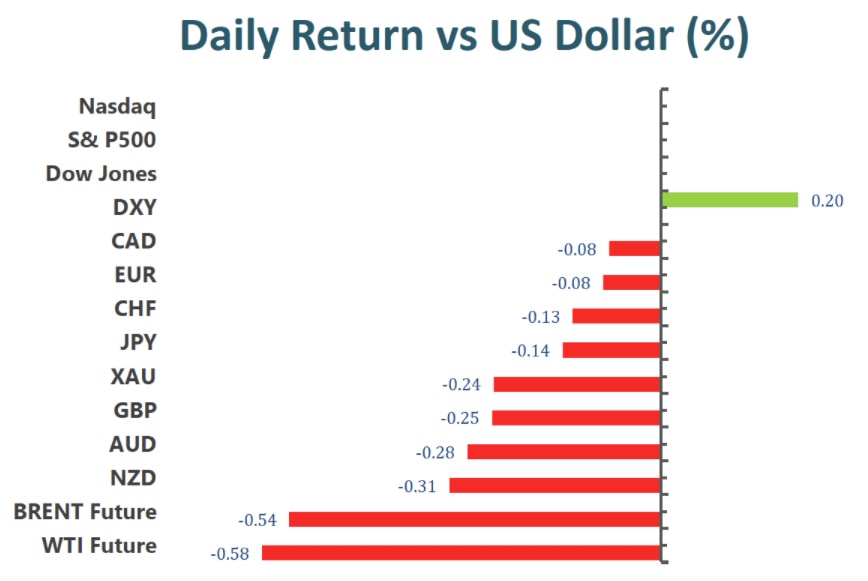
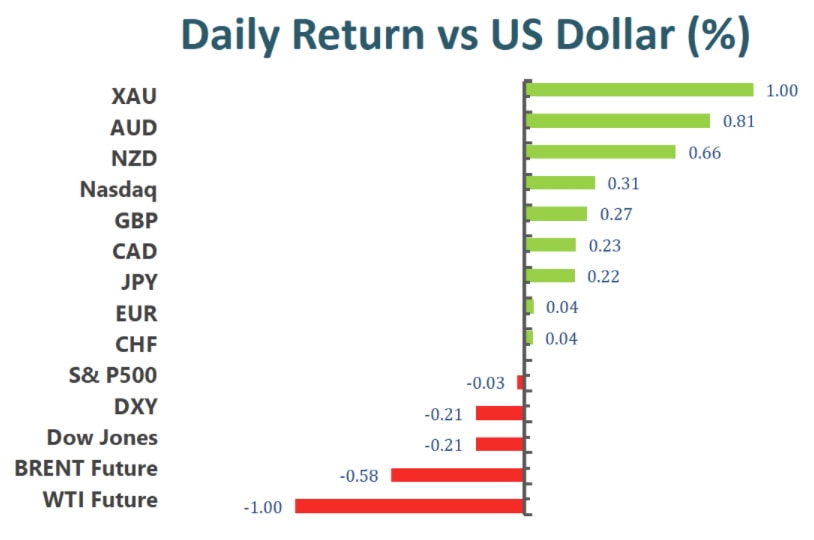
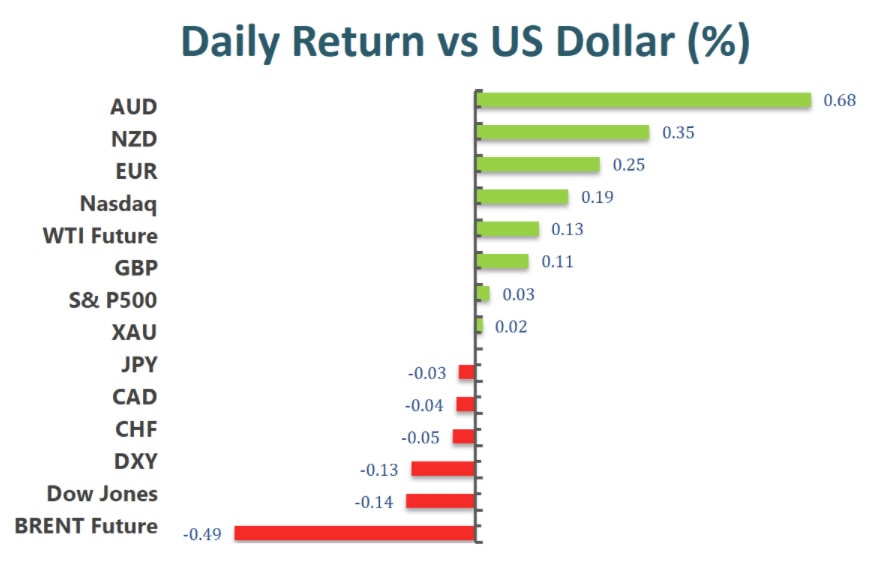
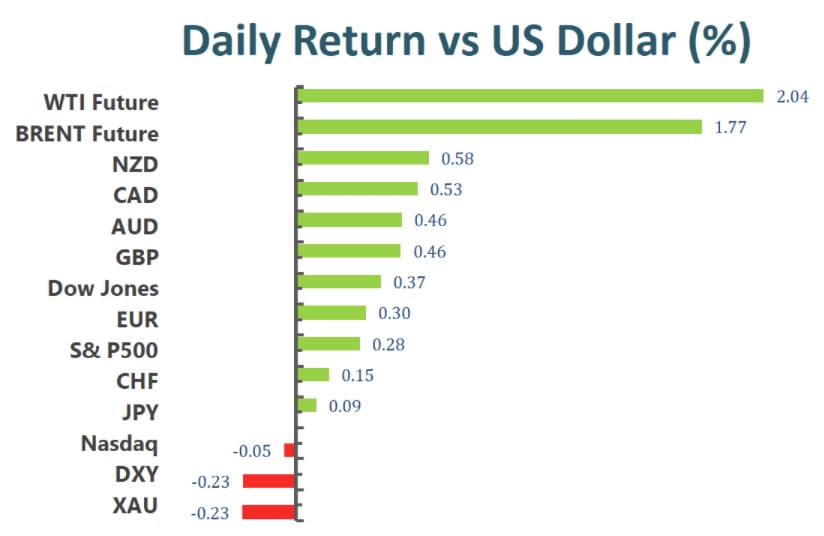
The US dollar declined and gave a poor performance on Thursday, dropping to the lowest level since August 6 during American trading hours. The DXY index is at 92.226 as of writing, losing 0.29% on a daily basis. The greenback continues its bearish traction ever since Fed Chair Jerome Powell’s dovish speech last week. Market worries about that the rising US COVID-19 cases in recent weeks will stall the US economic recovery, therefore, postponed Fed’s bond tapering plan. Despite better-than-expected US economic data released today, as Initial Jobless Claims reduced to 340K, the reports failed to help the US dollar gather strength. Investor now wait for the critical US Nonfarm Payrolls this Friday, which reflects the recovery condition of US economy.
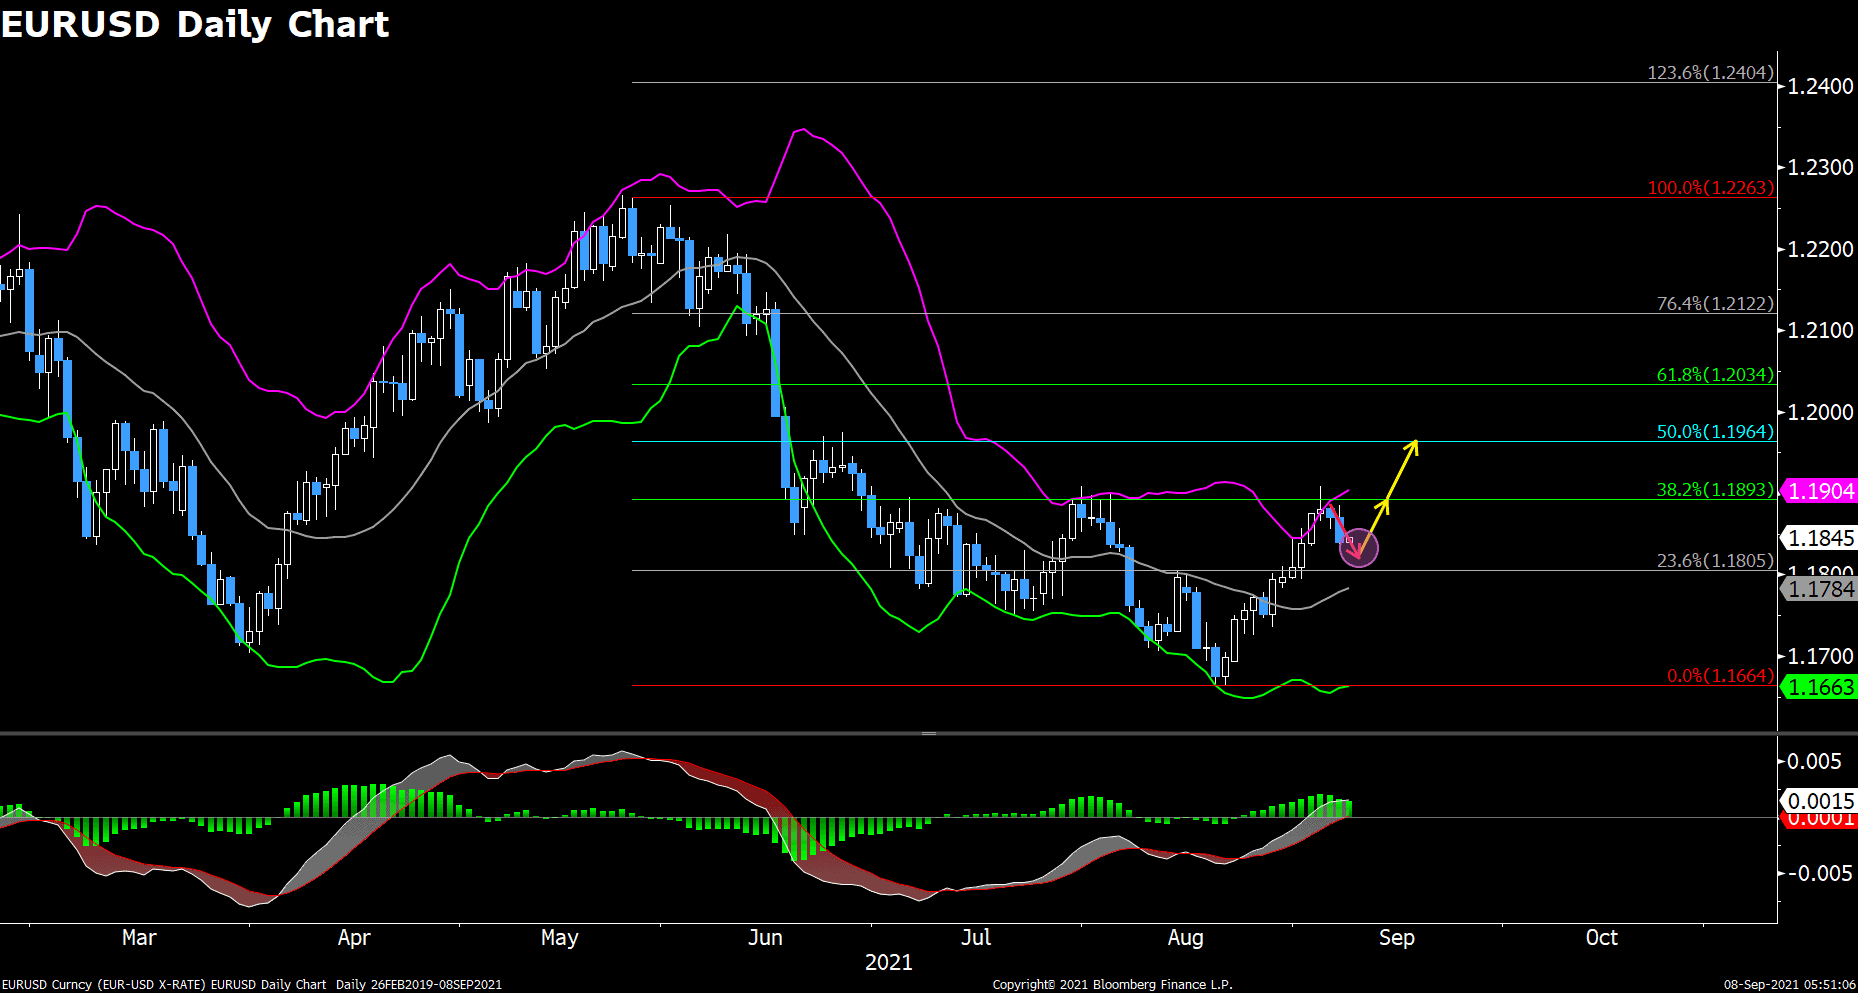
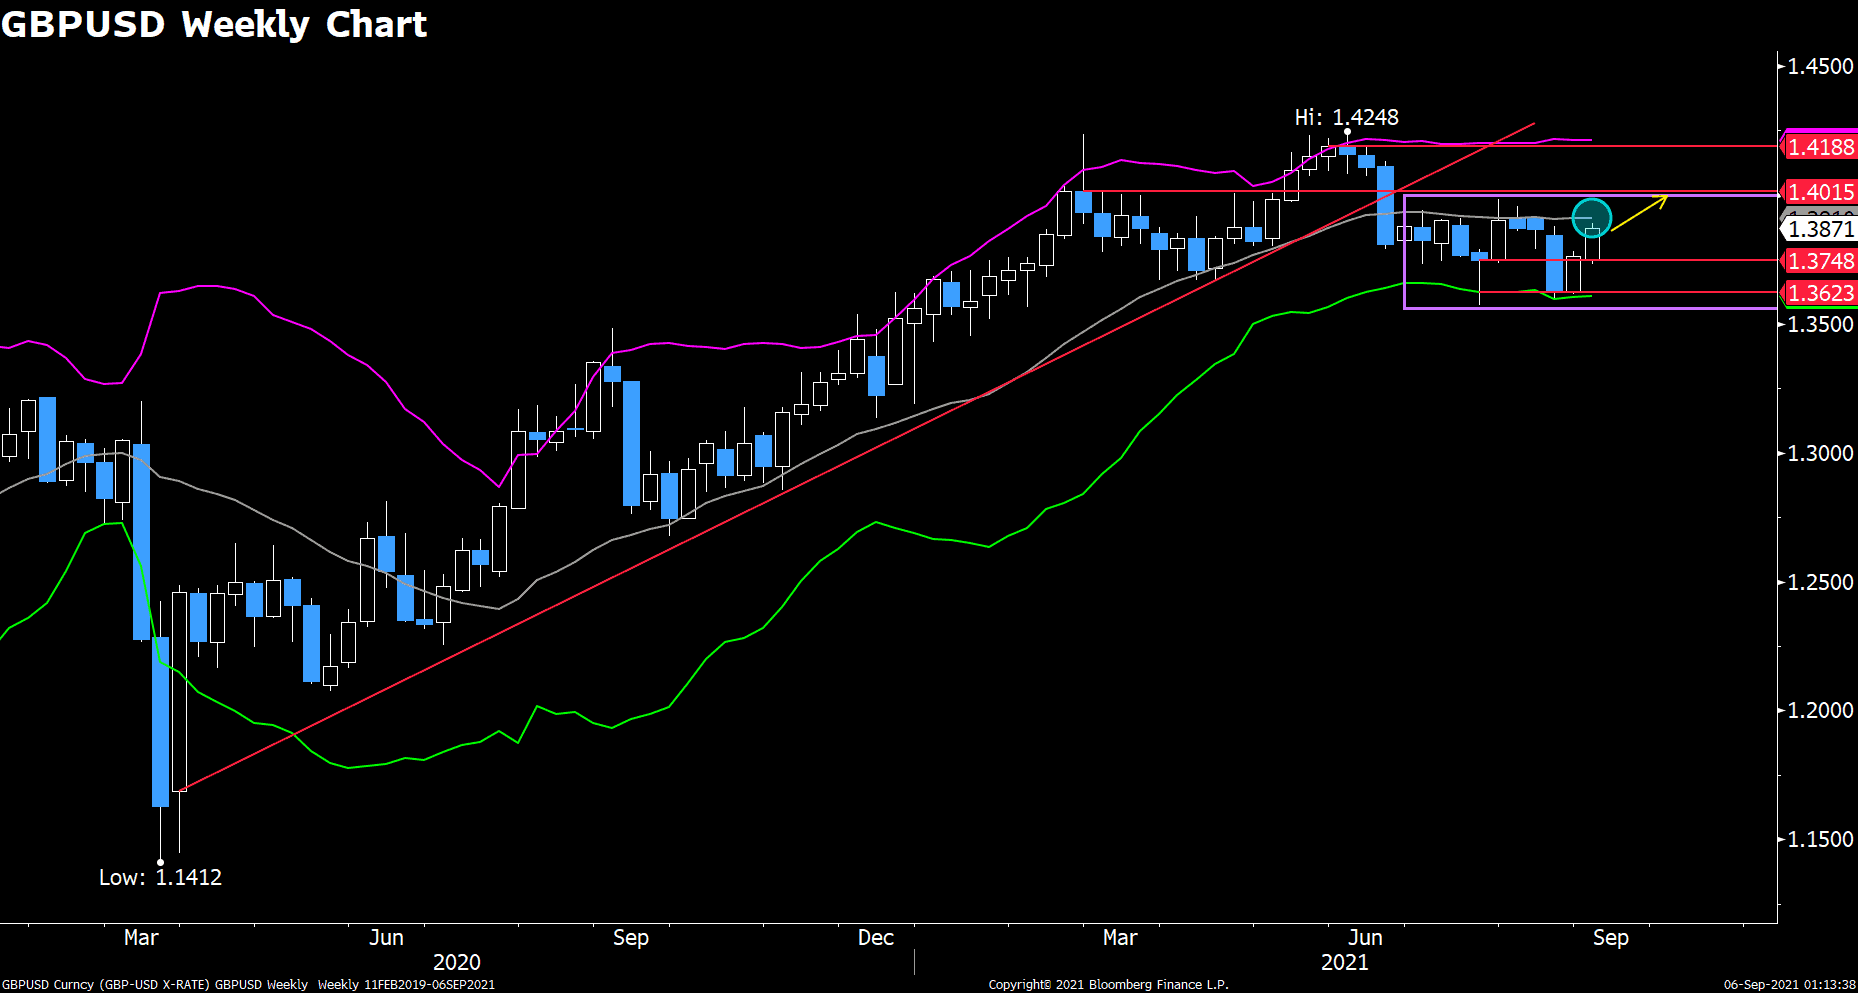
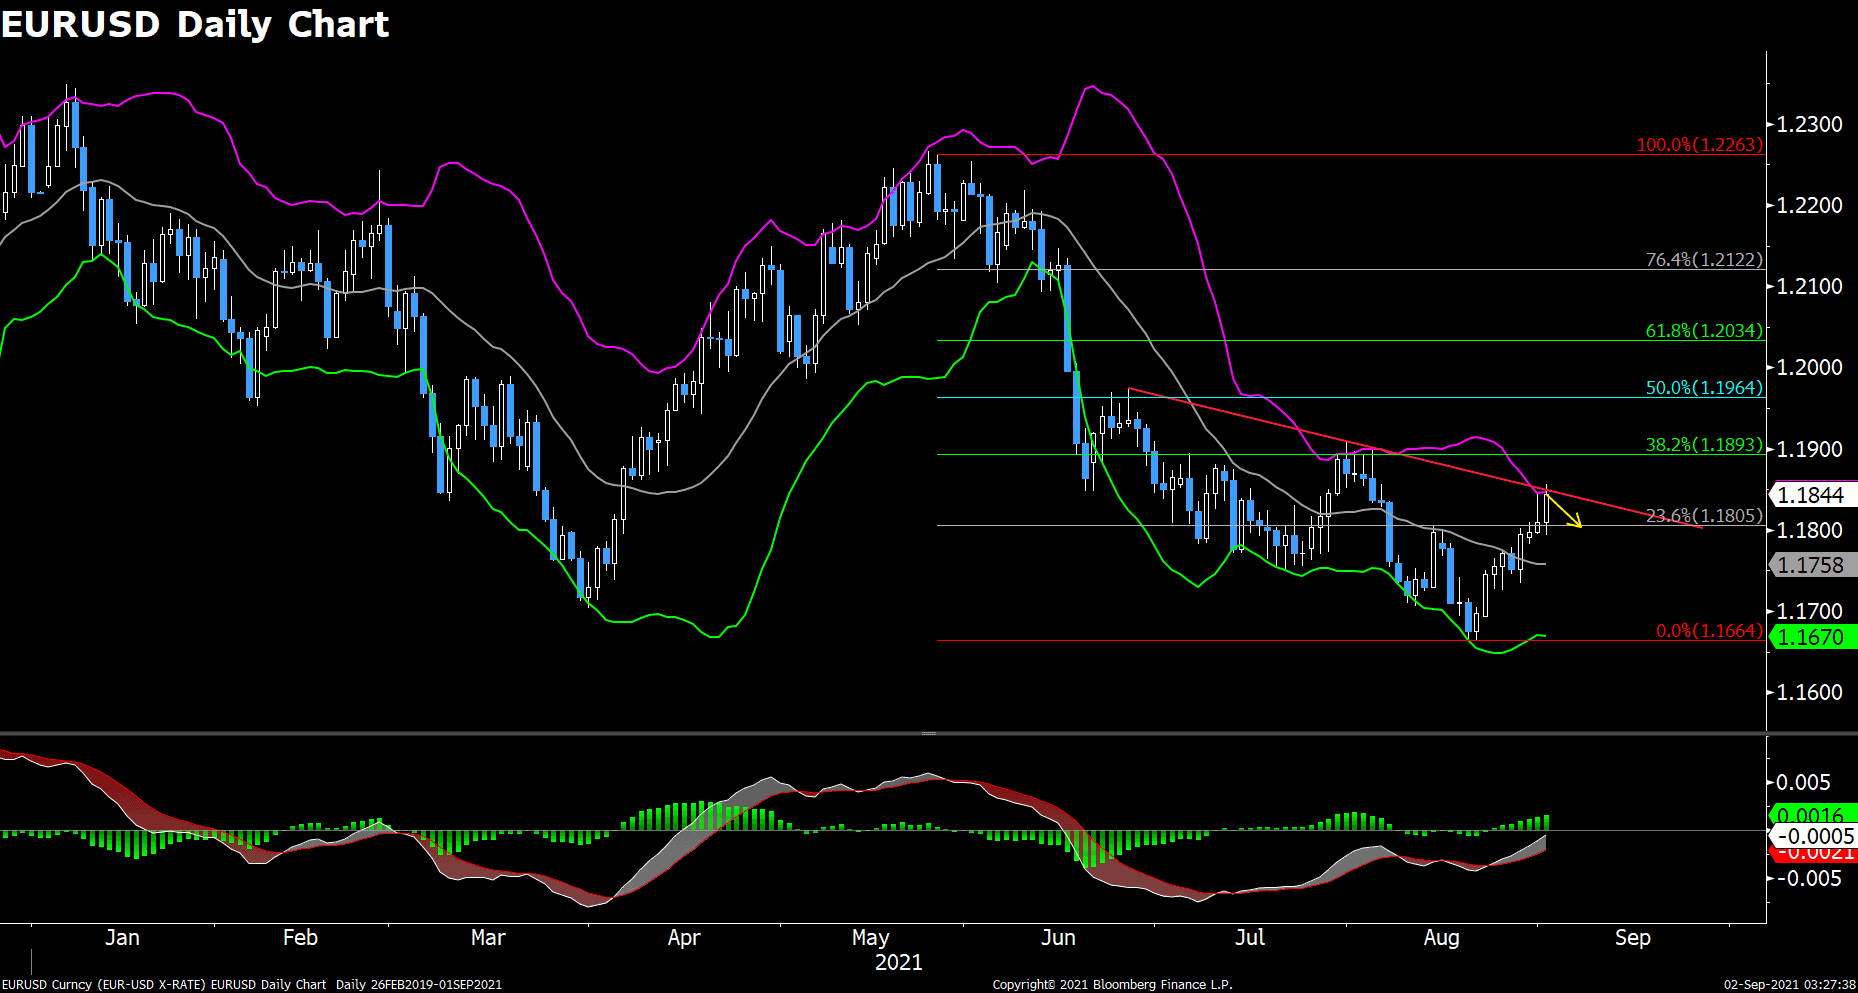
EUR/USD and GBP/USD both advanced on Thursday amid weaker US dollar across the board, trading at 1.1875 and 1.1833, respectively. EUR/USD recorded a fresh four-week high during American trading hours, climbing above the 1.1874 level and posting a 0.31% gain on the day as of writing.
USD/JPY edged lower today, hovering around 110 level most of the time. The pair is trading at 109.93 and posted a 0.04% loss on the day as of writing.
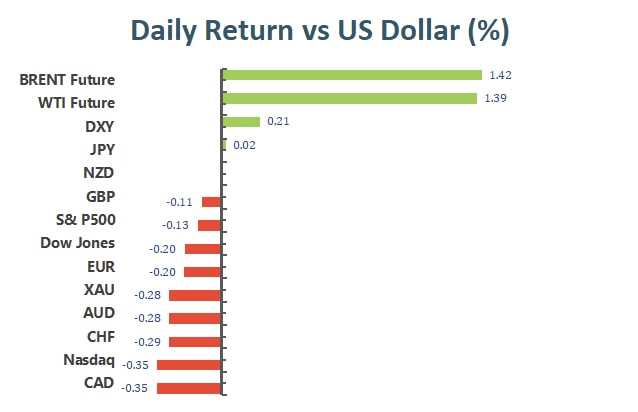
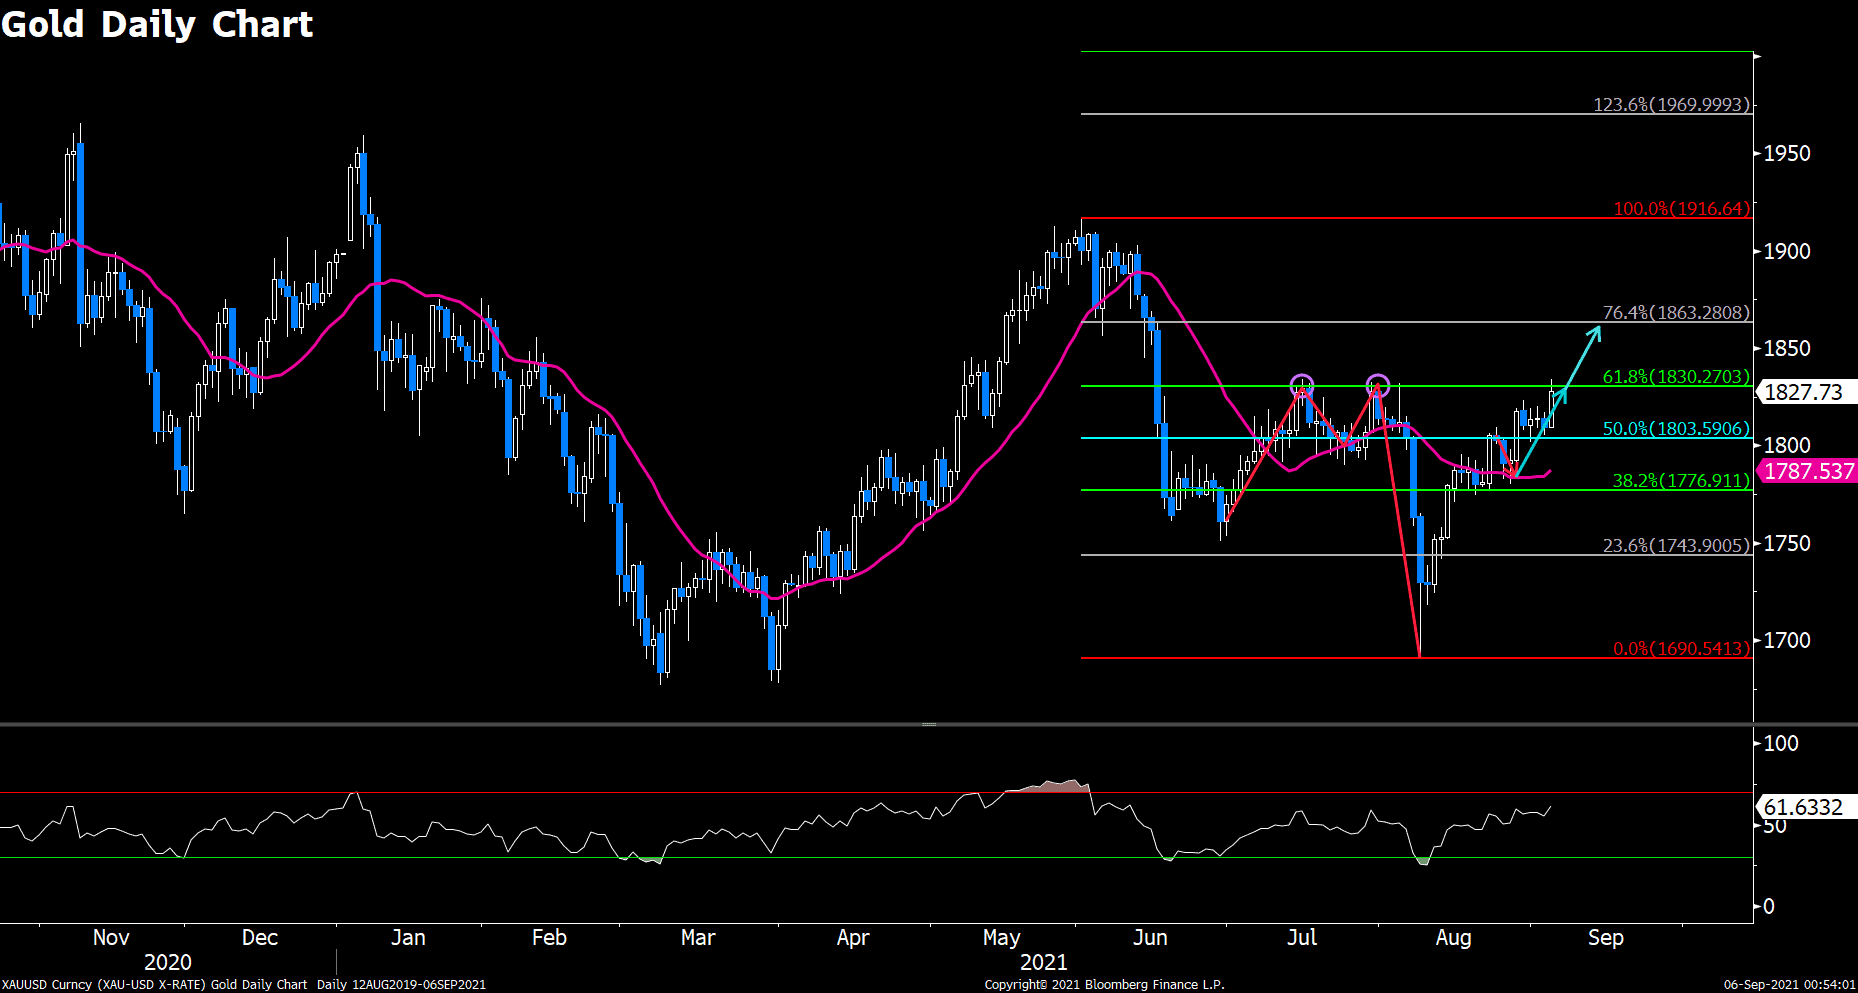
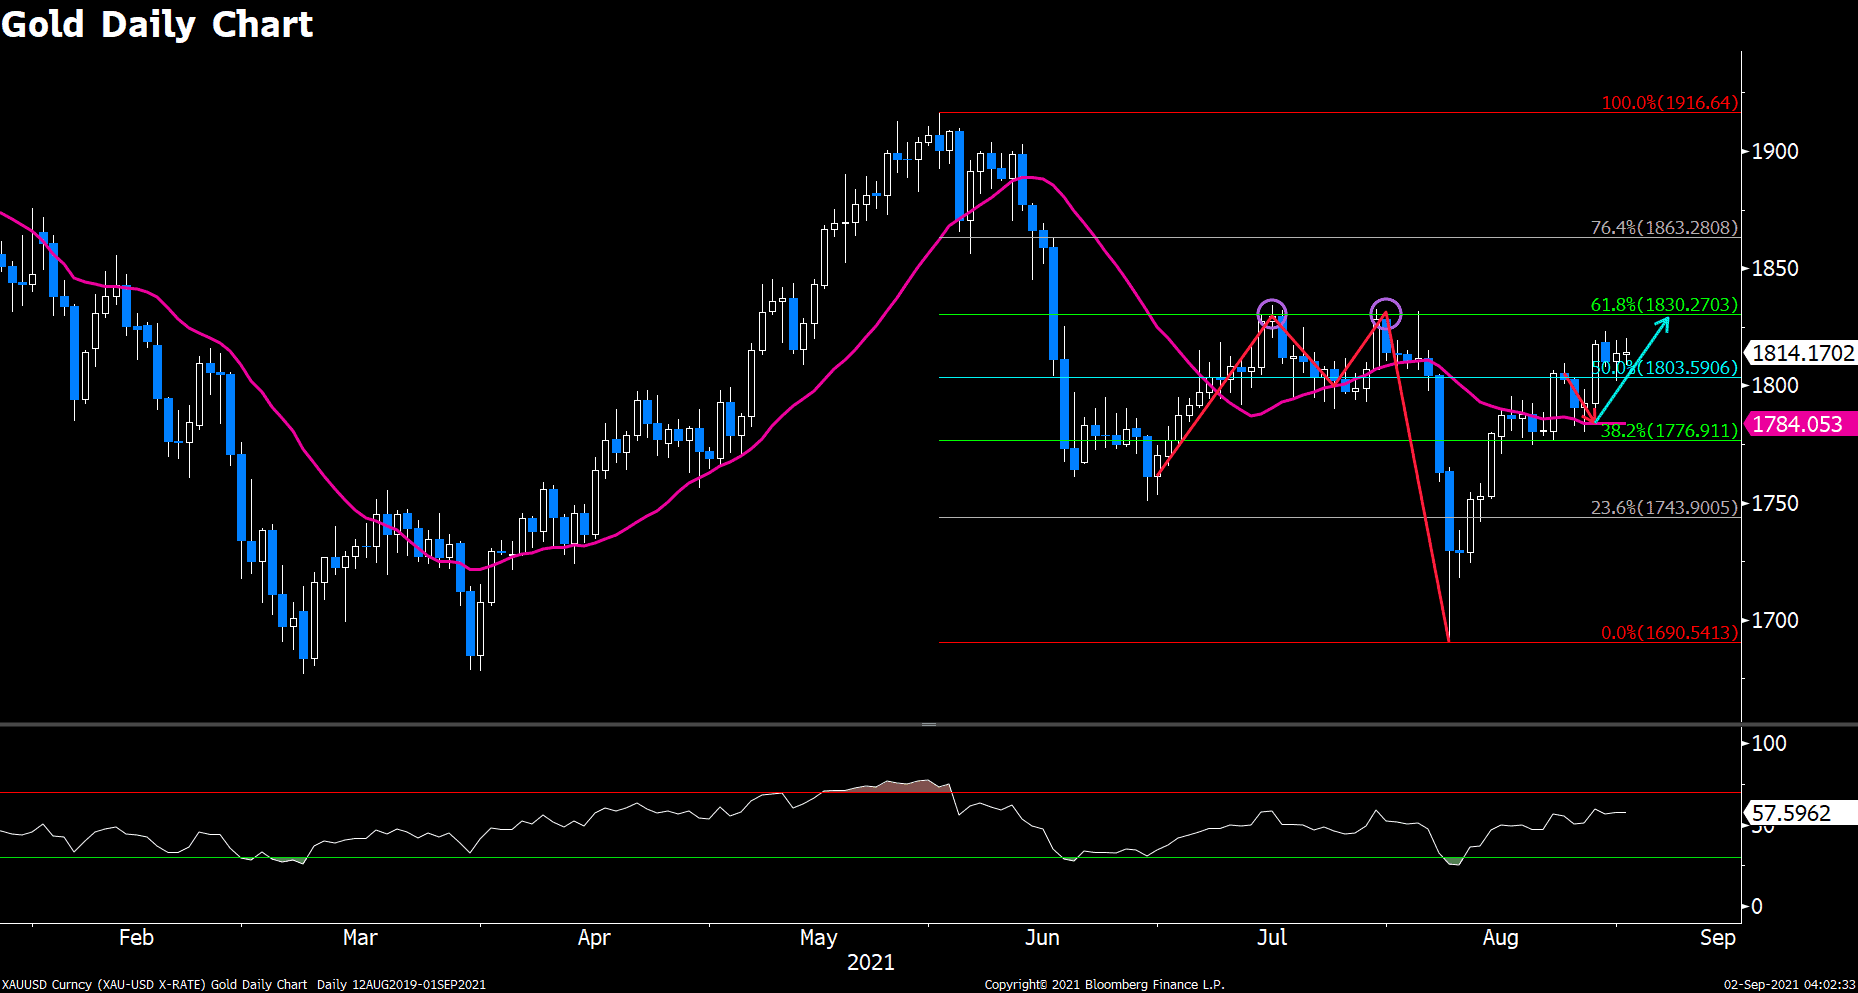
Gold slipped on Thursday, touching a two-day low during American session. The recent strong bullish momentum witnessed in the global equity markets continued to weigh on traditional safe-haven assets like gold. The precious metal is now trading at 1810.24, losing 0.17% on a daily basis. WTI Crude Oil, on the contrary, soared more than 2.1% on Thursday.
Technical Analysis:
GBPUSD (4-hour Chart)
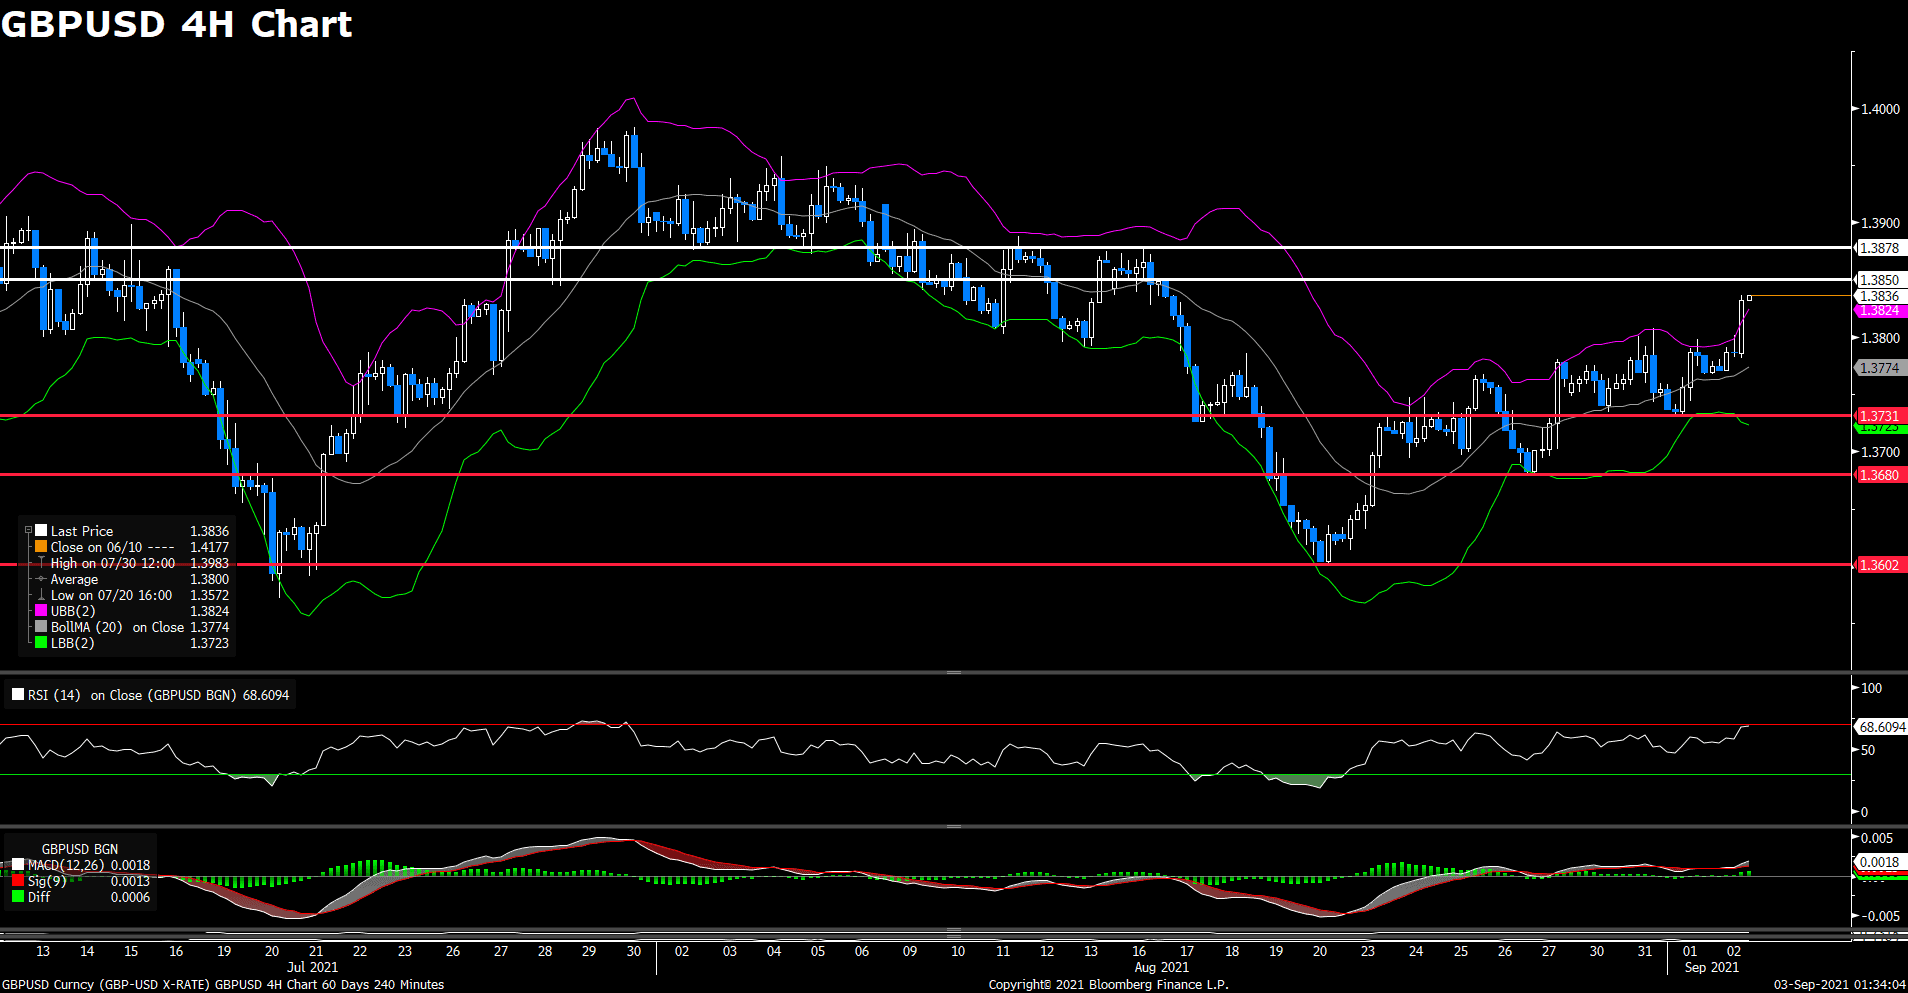
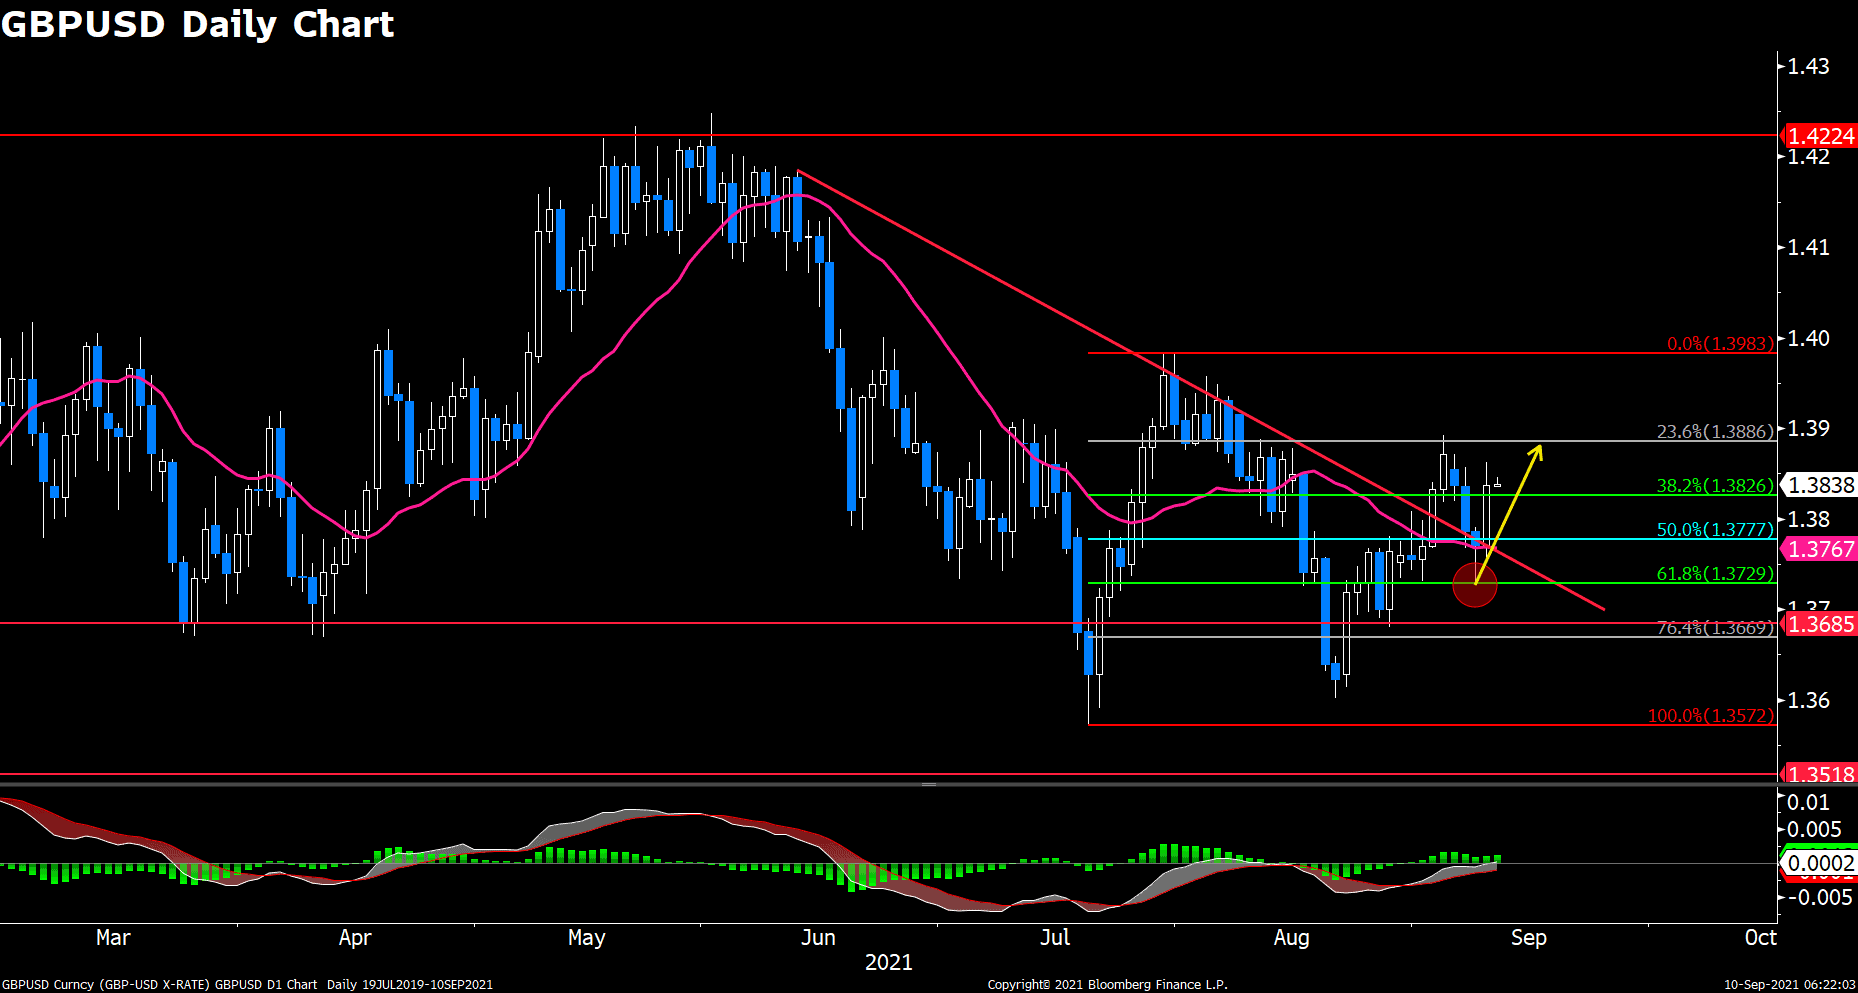
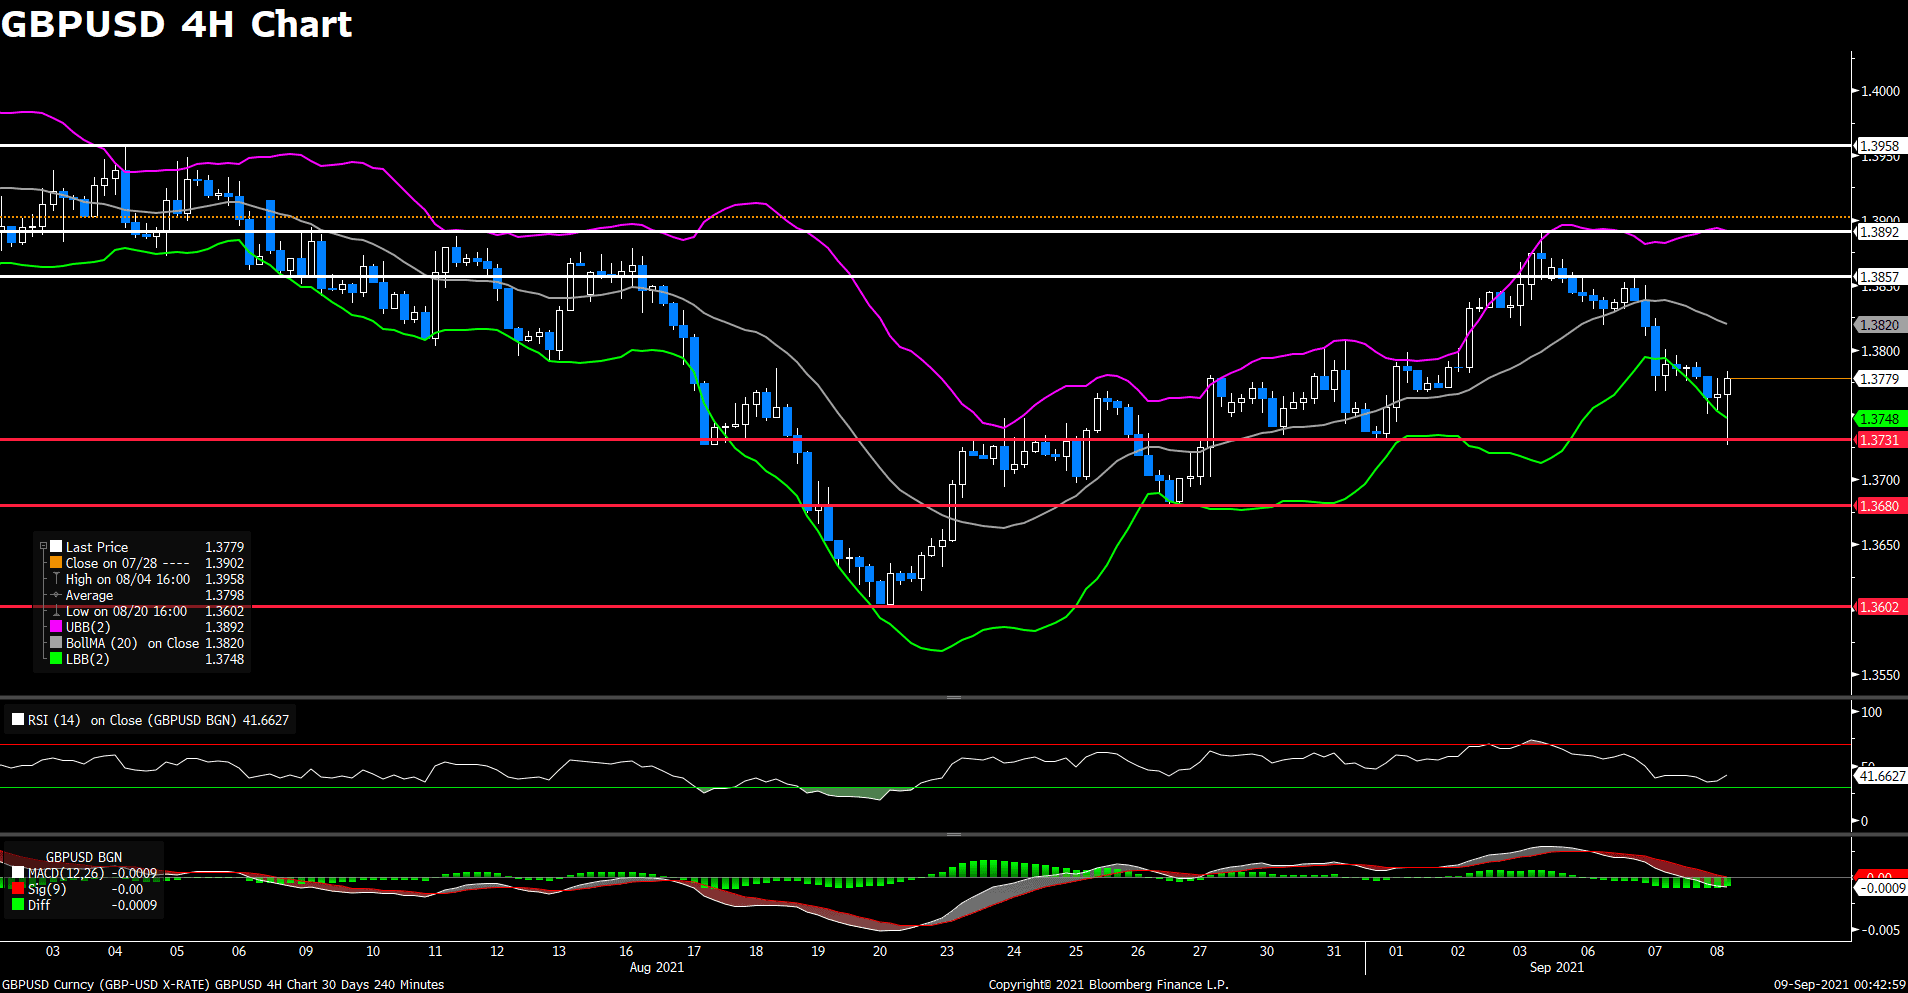
The GBP/USD pair made a good showing on Thursday, as the pair gained bullish momentum and climbed above 1.3800 level during American trading hours. The cable was last seen trading at 1.3835, rising 0.48% on the day as of writing. The bullish movement witnessed in GBP/USD is result from the diminishing demand of US dollar, meanwhile the improving market mood pushs Wall Street’s main indexes higher. For technical aspect, RSI indicator 68 figures as of writing, suggesting that the market is bullish, and the buying pressure is relatively higher. As for the Bollinger Bands, the price moves out of the upper band, indicates that a strong upward trend continuation can be expected.
In conclusion, we think market will be bullish as the pair heads to test the 1.3850 resistance. A break above that level will open the door for additional near-term profits. And the next resistance is at 1.3878. On top of that, UK Services PMI will be released on Friday, which is a leading indicator of UK overall economic performance.
Resistance: 1.3850, 1.3878
Support: 1.3731, 1.3680, 1.3602
USDCAD (4- Hour Chart)
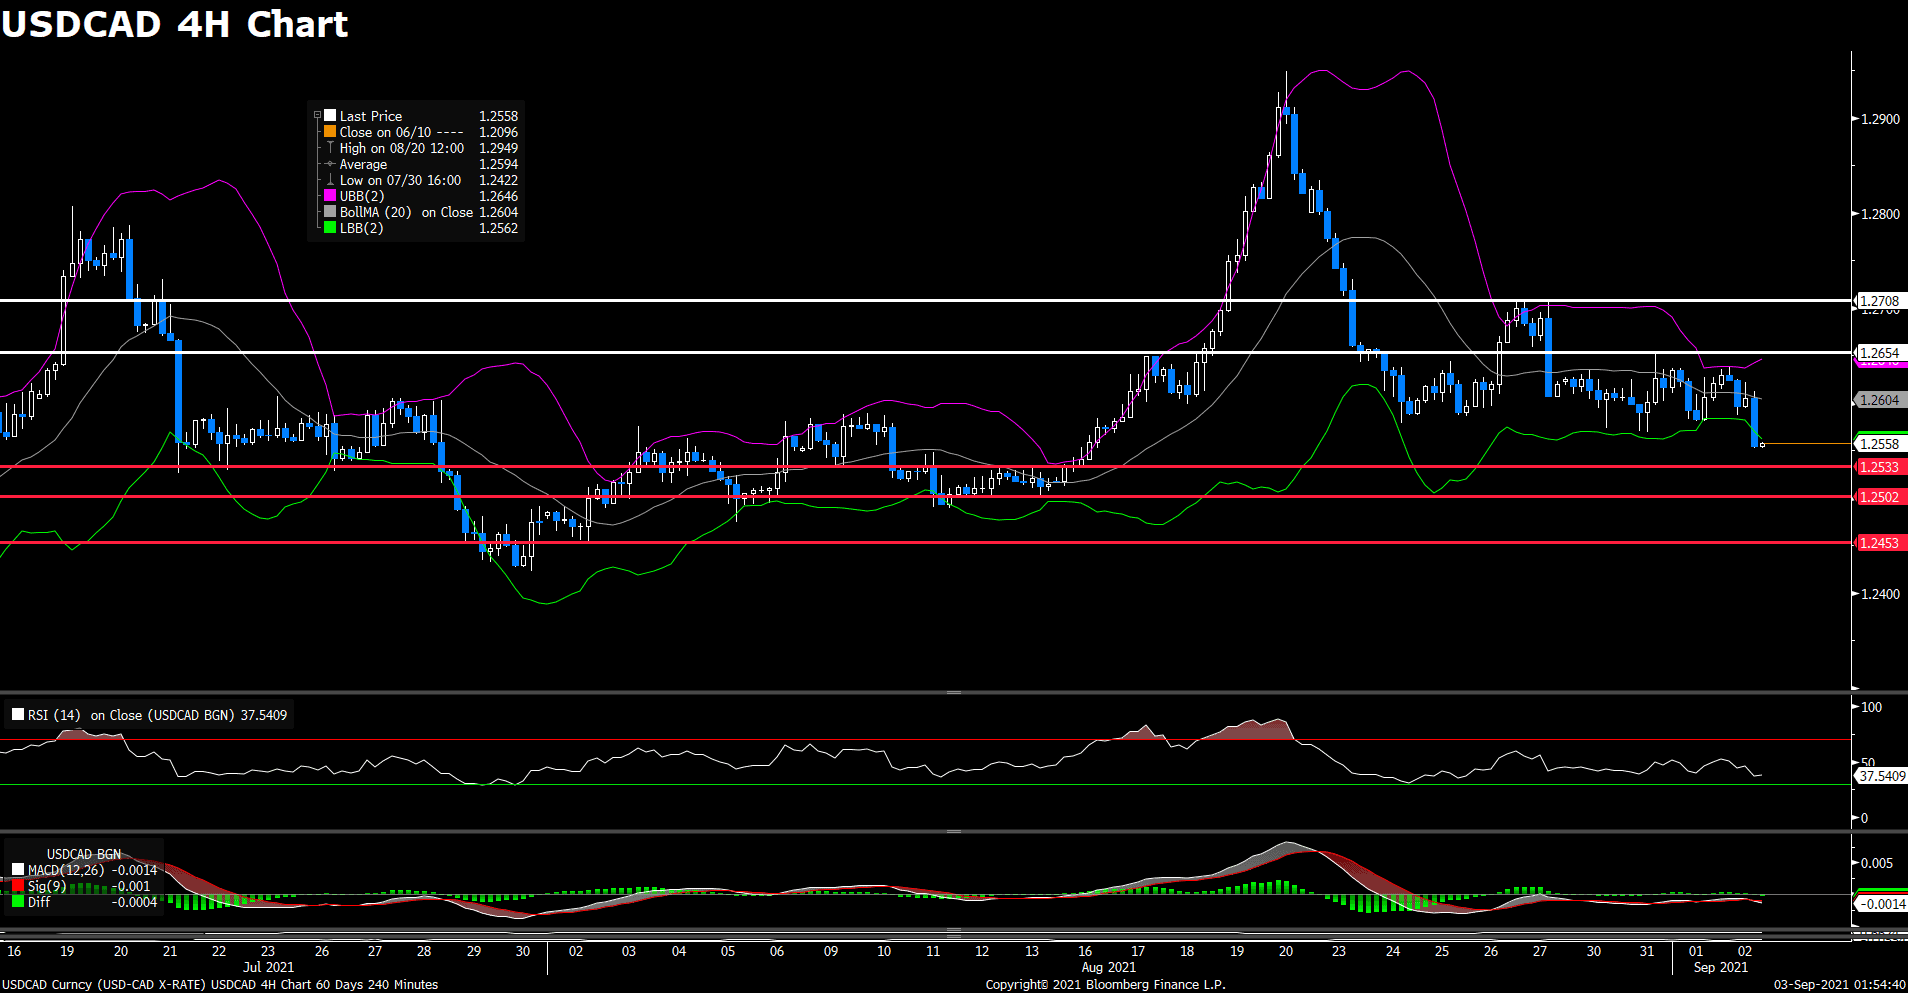
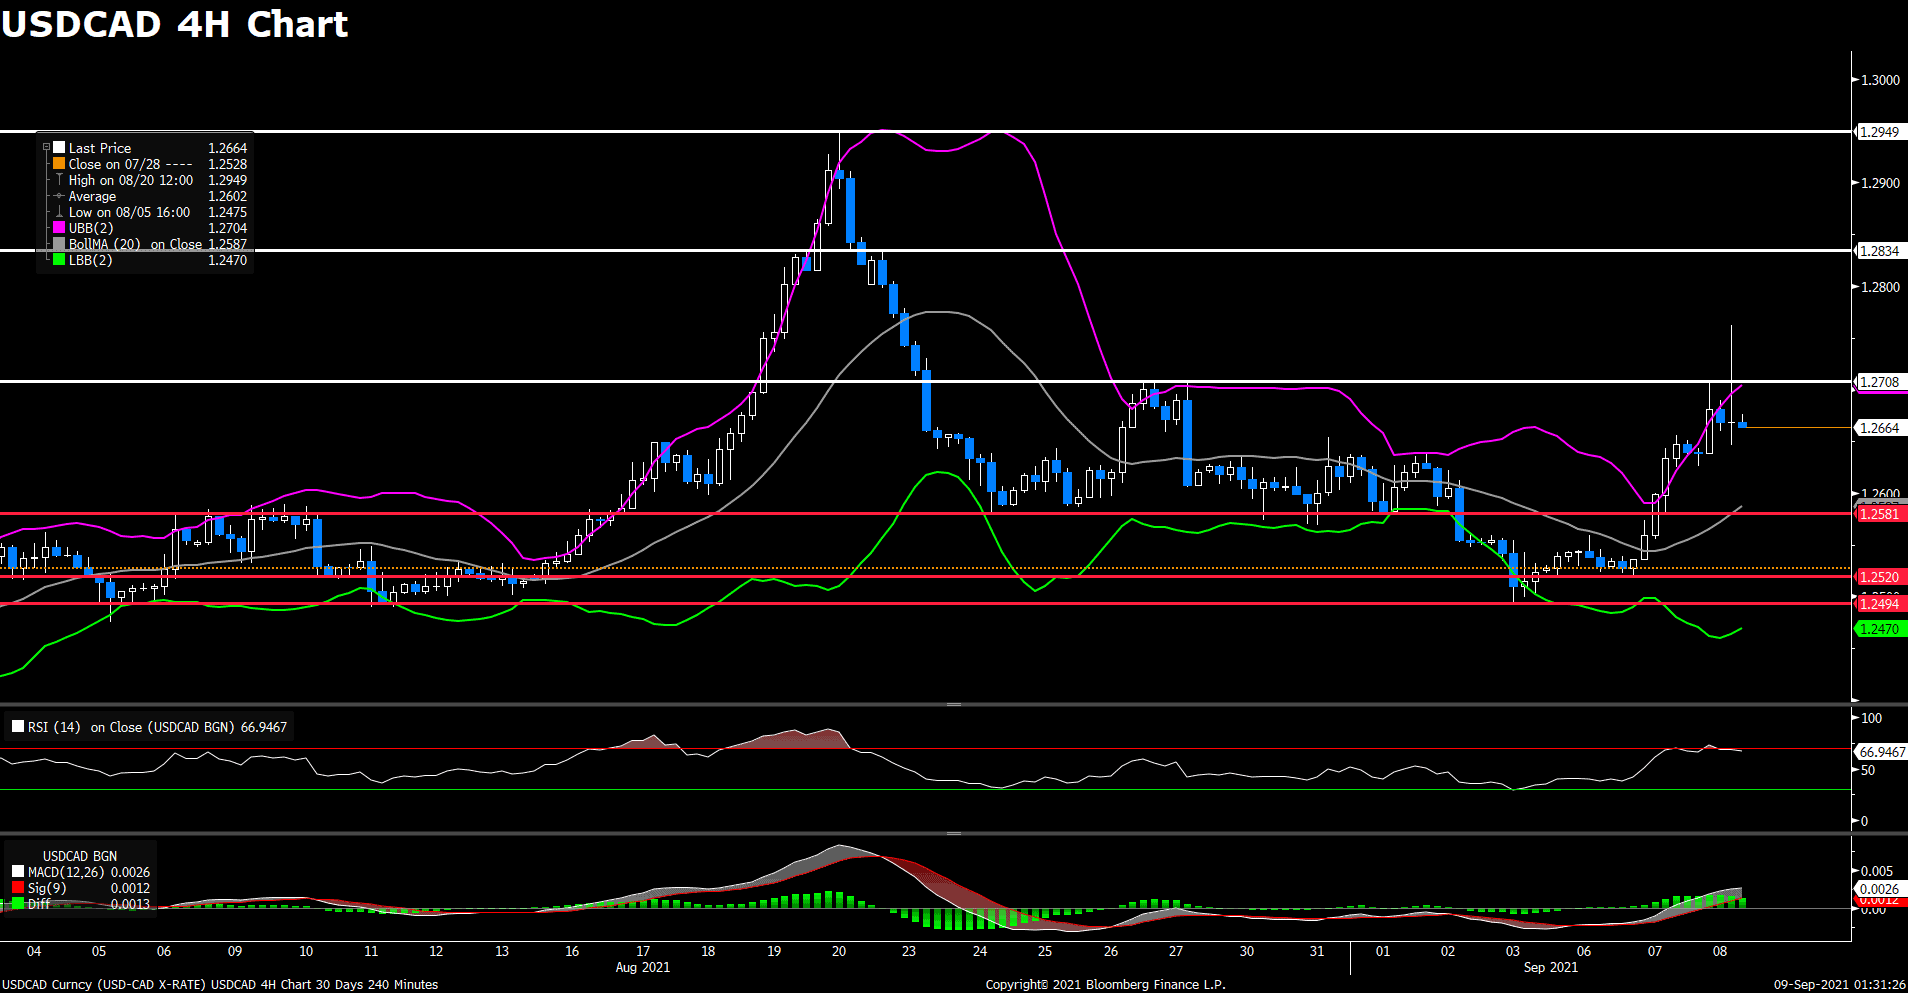
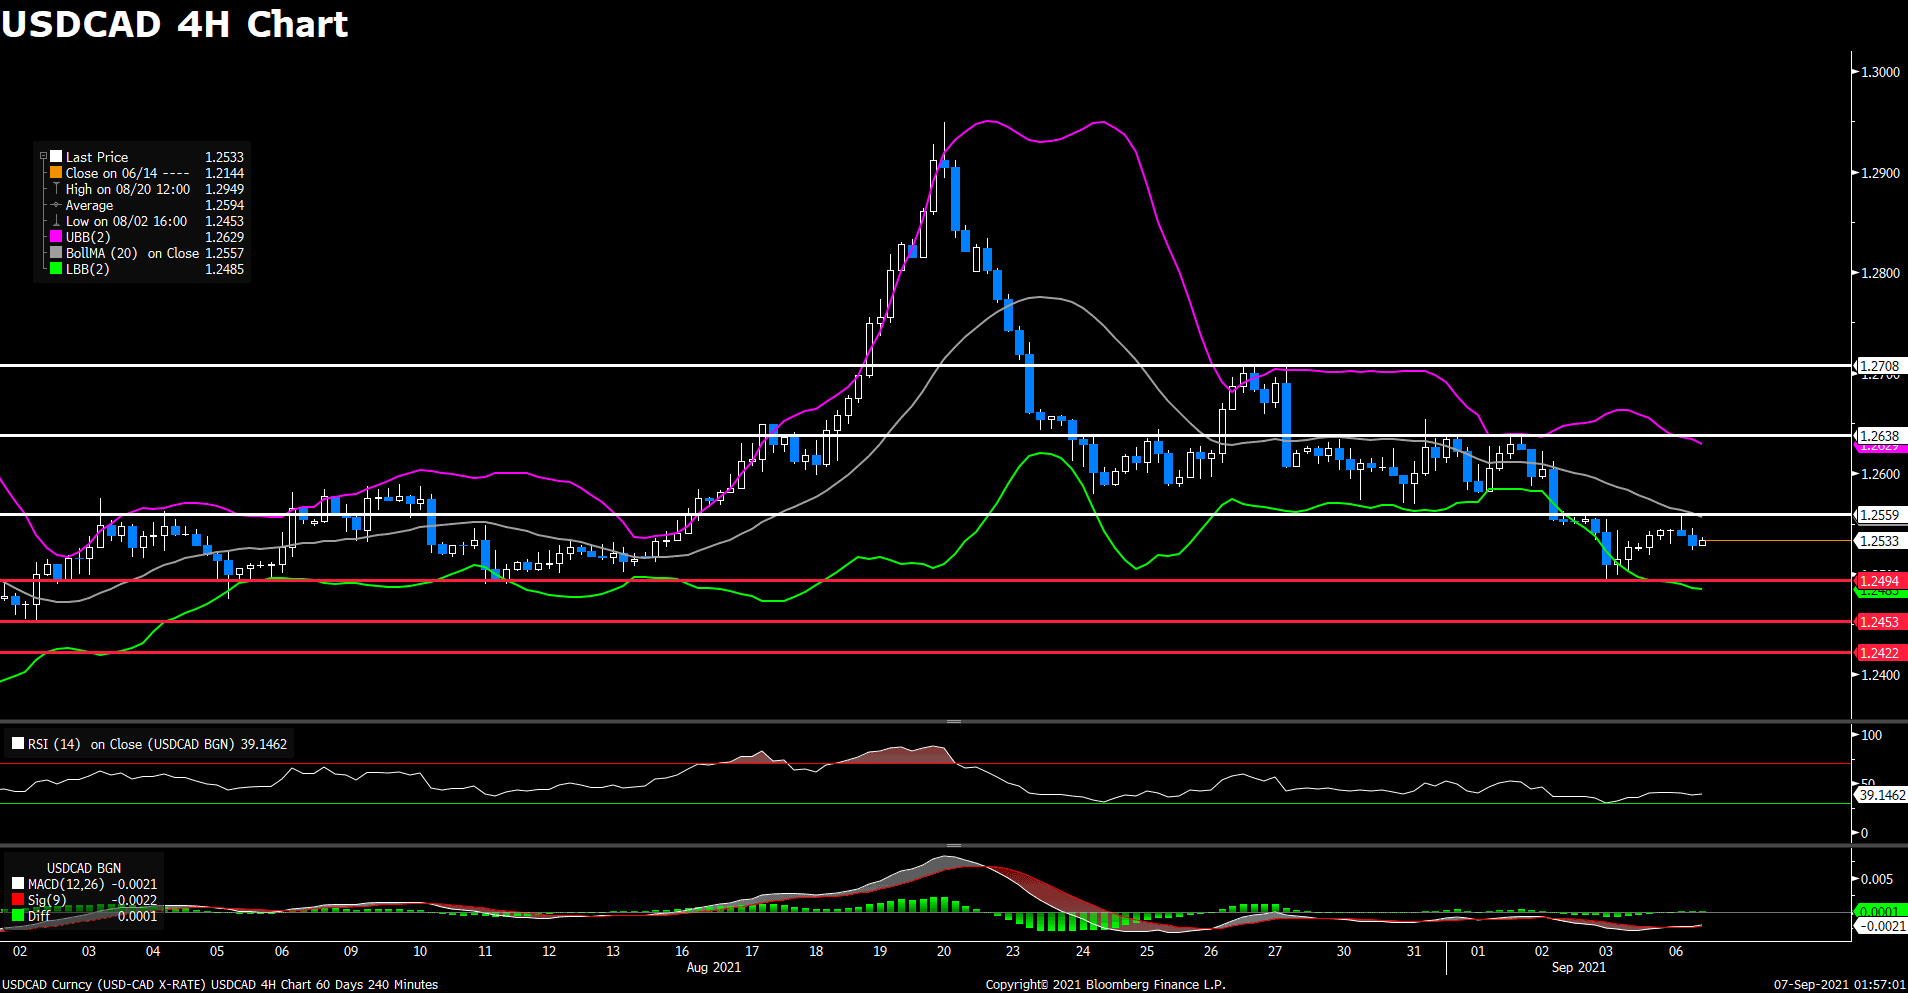
The USD/CAD pair tumbled on Thursday, touching the lowest level since August 16 during American session. The pair is trading at 1.2557 at the time of writing, posting a 0.49% loss on a daily basis. The surging oil prices and a weaker US dollar across the board both weighed on the USD/CAD pair, as it surrounded by heavy selling pressure. For technical aspect, RSI indicator 37 figures as of writing, suggesting bear-movement ahead. If we take a look at MACD indicator, a death cross should be taken as a selling signal.
In conclusion, we think market will be bearish as the pair failed to break the 1.2654 resistance, now heading to test the 1.2533 support. For the Bollinger Bands, the price is now at the outside of the lower band so a strong downward trend continuation can be expected. But if the price starts to move back inside the band, investors should pay attention to trend reversal. In addition to that, the risk flows keep pushing oil prices higher, therefore benefits the commodity-linked loonie.
Resistance: 1.2654, 1.2708
Support: 1.2533, 1.2502, 1.2453
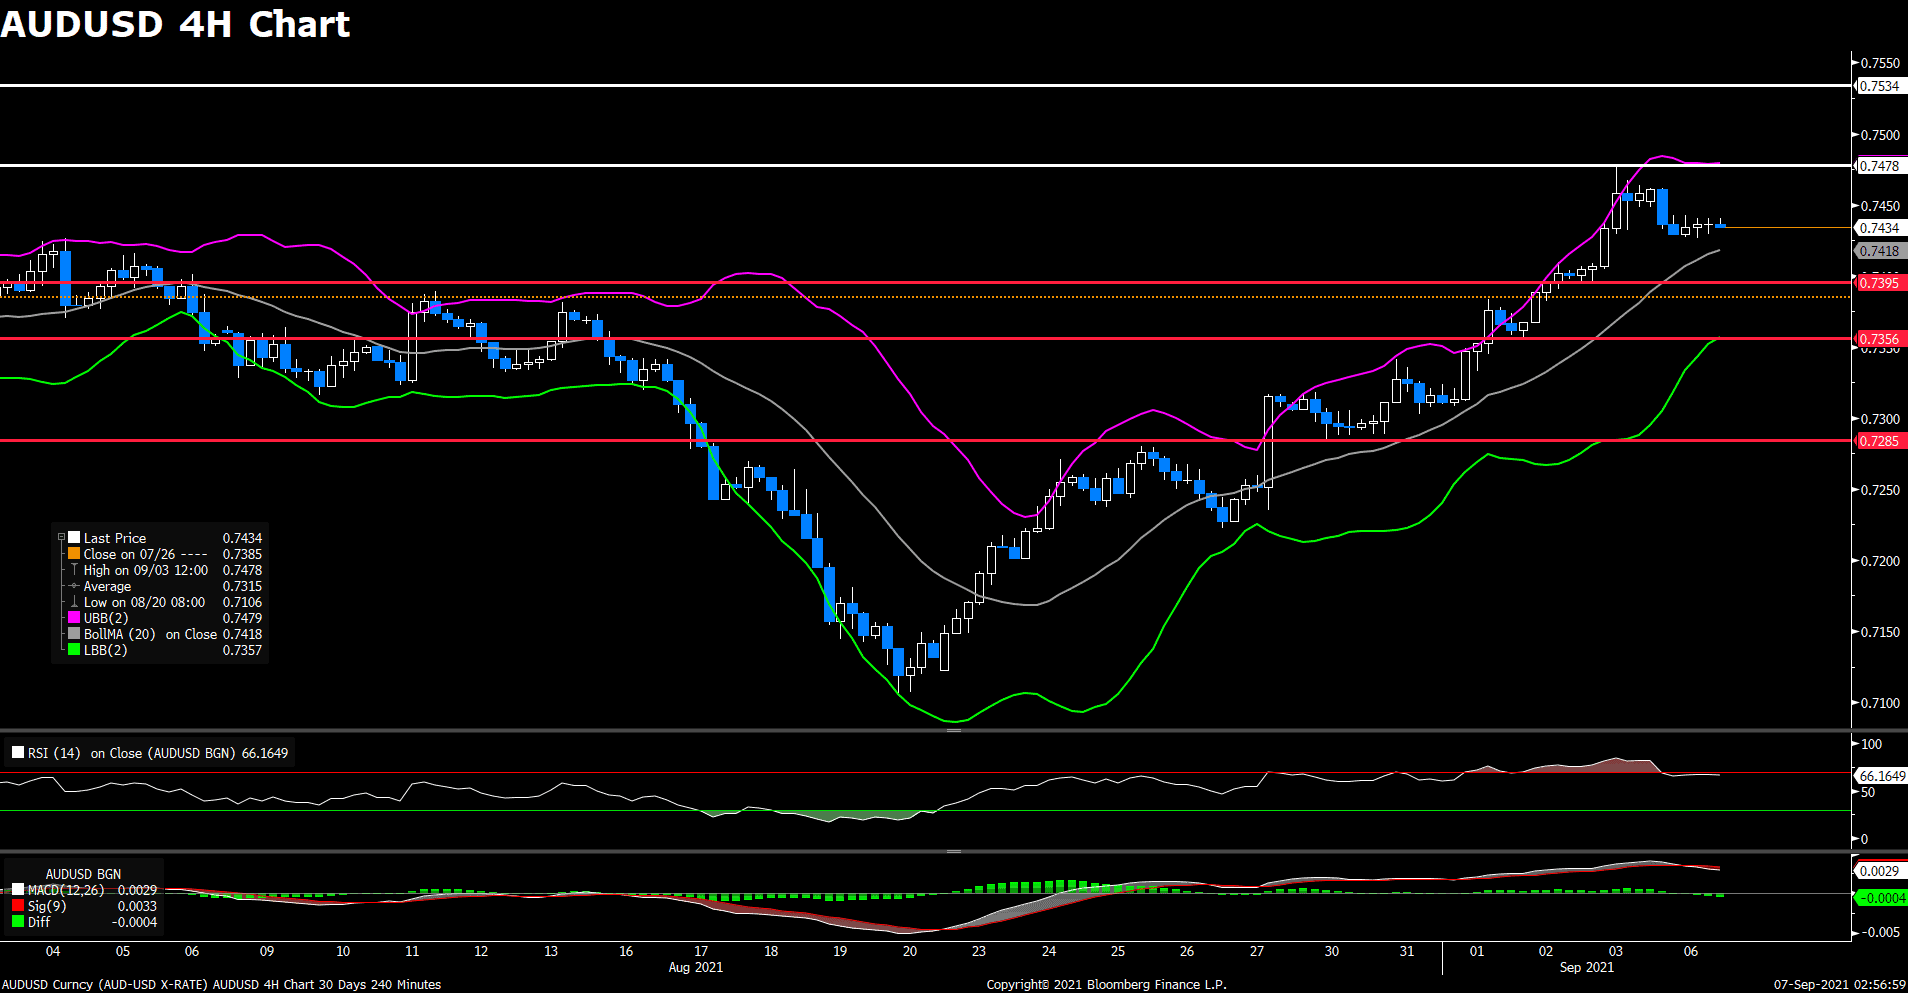
AUDUSD (4- Hour Chart)
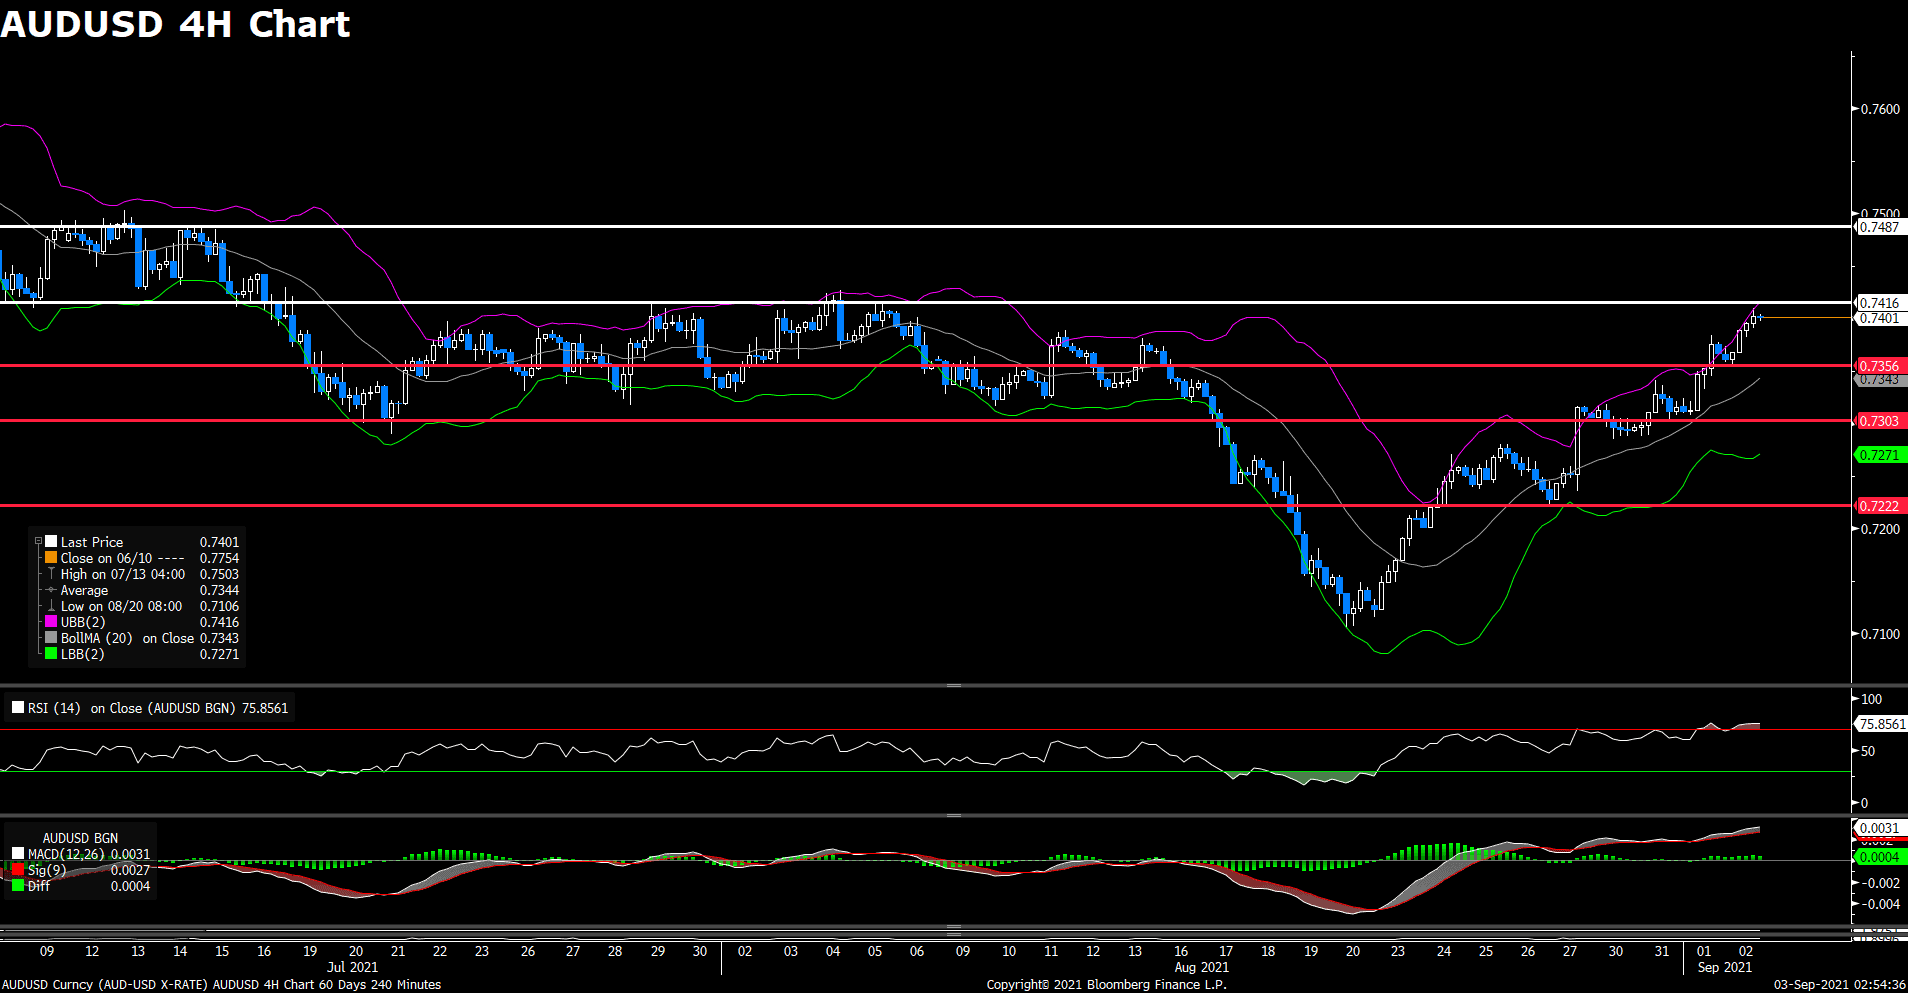
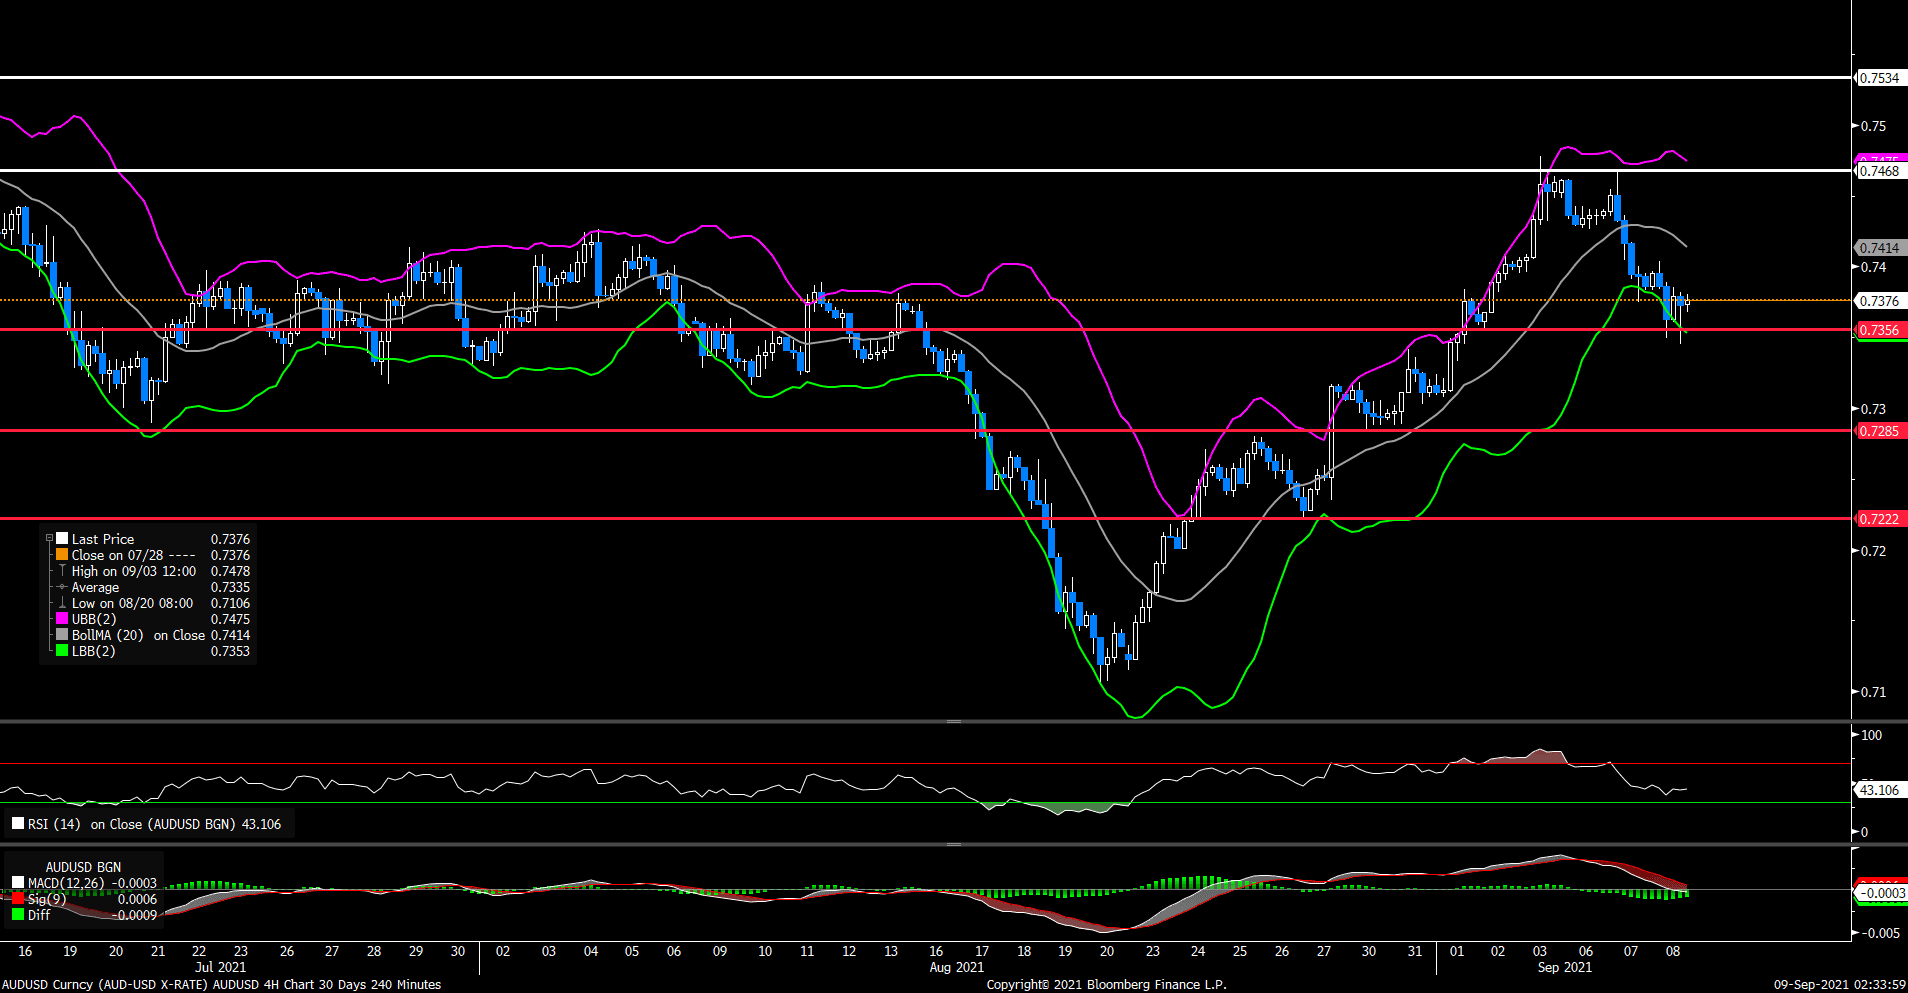
The AUD/USD pair was trading higher on Thursday and pushed higher during American session. AUD/USD gave a remarkable performance amid US dollar’s weakness and reached the highest level since August 5. The US economic data released today failed to support the greenback. At the time of writing, thr pair is trading at 0.7401, rising 0.50% on the day. For technical aspect, RSI indicator 75 figures as of writing, suggesting that the market is in overbought zone, which is an obvious selling signals for investors.
In conclusion, we think market will be bearish as long as the 0.7416 resistance line holds. For Bollinger Bands, the pair is now falling from the upper band after touching it, which indicates a bear market. Furthermore, Australia Retail Sales will be released on Friday, this is the foremost indicator of consumer spending.
Resistance: 0.7416, 0.7487
Support: 0.7356, 0.7303, 0.7222
Economic Data
|
Currency
|
Data
|
Time (GMT + 8)
|
Forecast
|
|
AUD
|
Retail Sales (MoM)
|
09:30
|
0.5%
|
|
GBP
|
Composite PMI (Aug)
|
16:30
|
55.3
|
|
GBP
|
Services PMI (Aug)
|
16:30
|
55.5
|
|
USD
|
Nonfarm Payrolls (Aug)
|
20:30
|
750K
|
|
USD
|
Unemployment Rate (Aug)
|
20:30
|
5.2%
|
|
USD
|
ISM Non-Manufacturing PMI (Aug)
|
22:00
|
61.5
|
| |
|
|
|
| |
|
|
|
|
|
|
|
| |
|
|
|
|
|
|
|
| |
|
|
|
|
|
|
|