Daily Market Analysis
Market Focus
US stock declined on Monday, which was also the biggest fall in about four months. Concerns about China’s real-estate sector and a possible Fed bond tapering caused a plummet in global stock market. However, the S&P 500 index pared some losses in the last hour of trading, as traders started to buy the dip again. The bearish movement witnessed in S&P 500 was an opportunity to buy stocks amid improved global economic recovery.
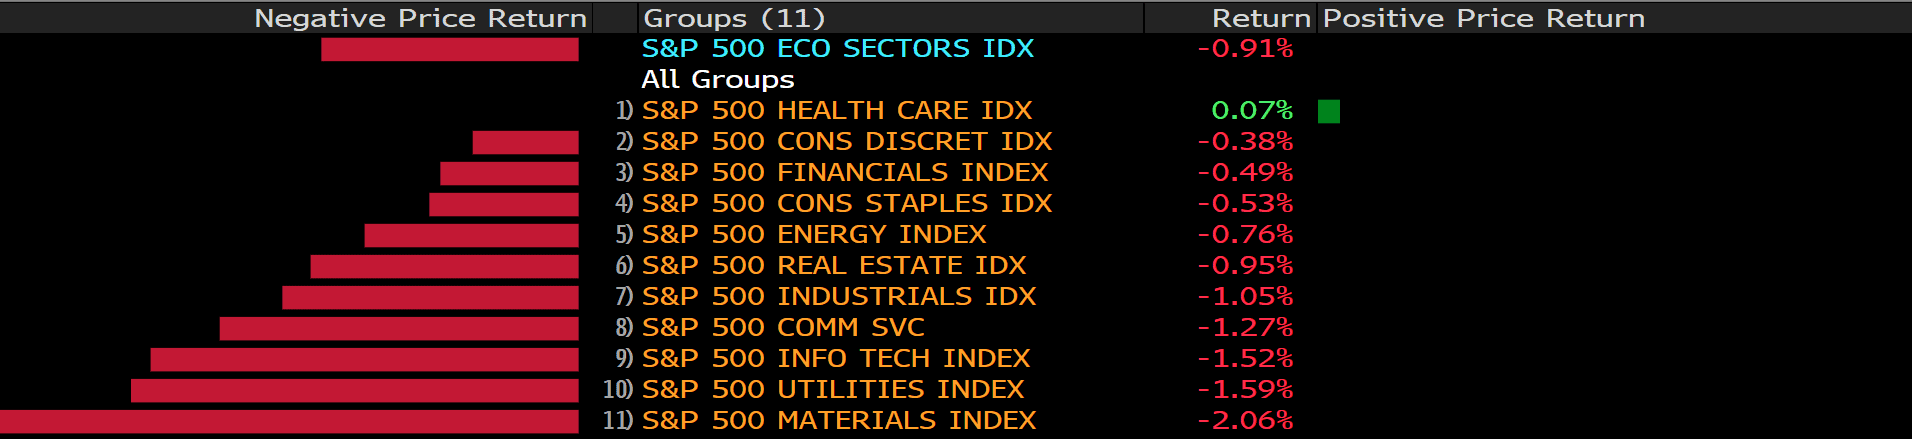
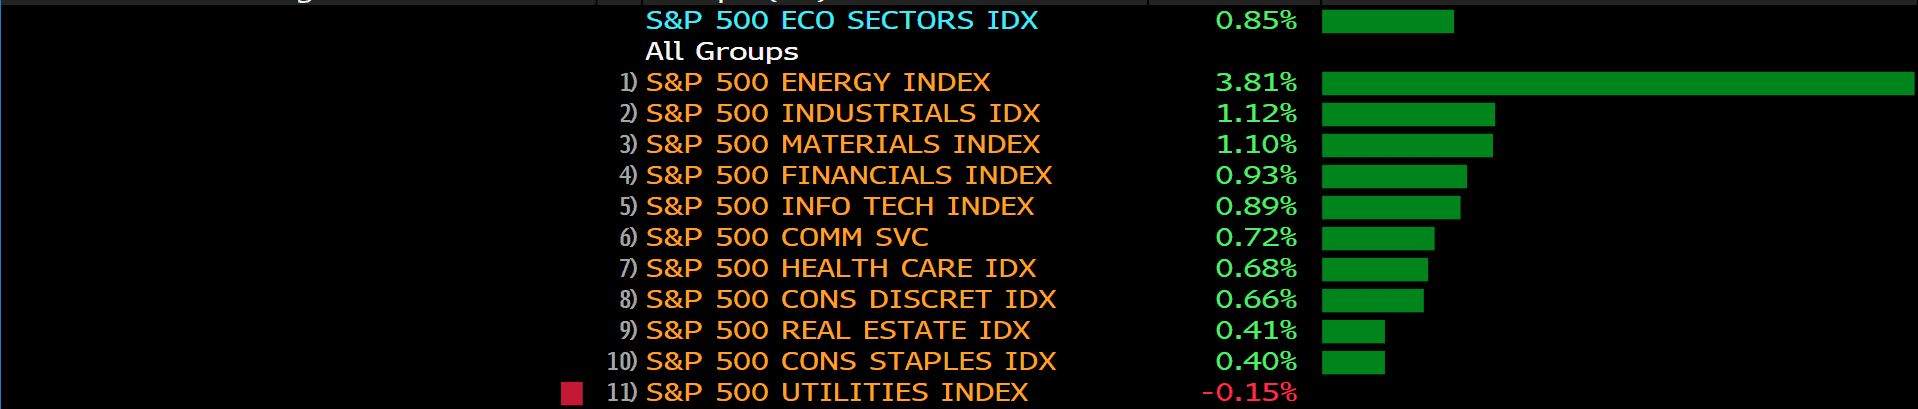
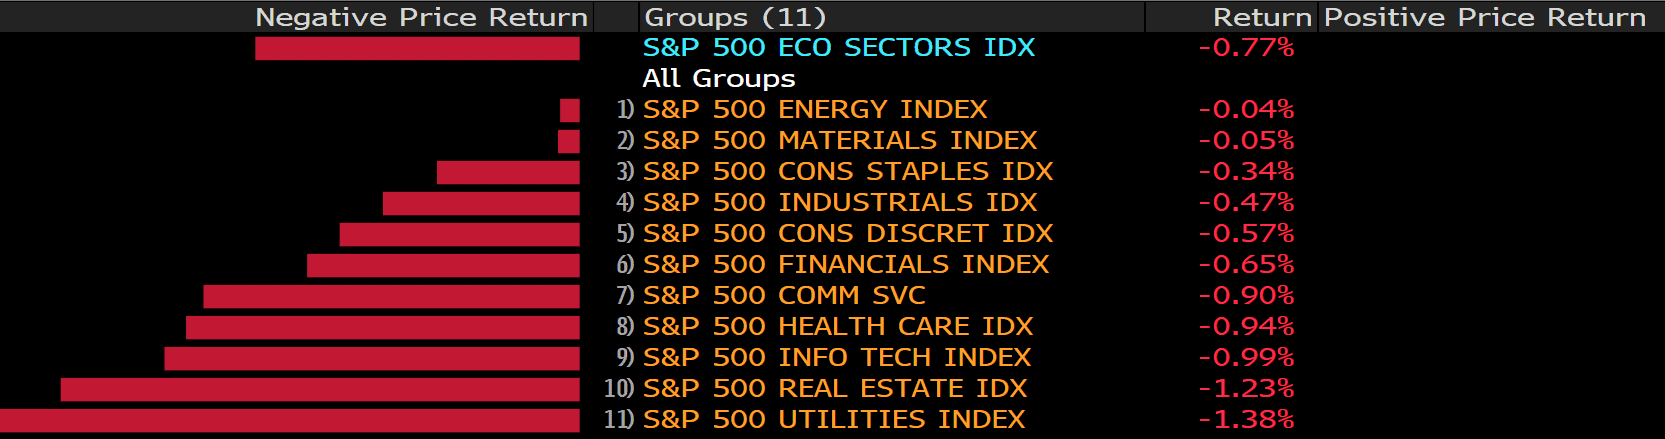
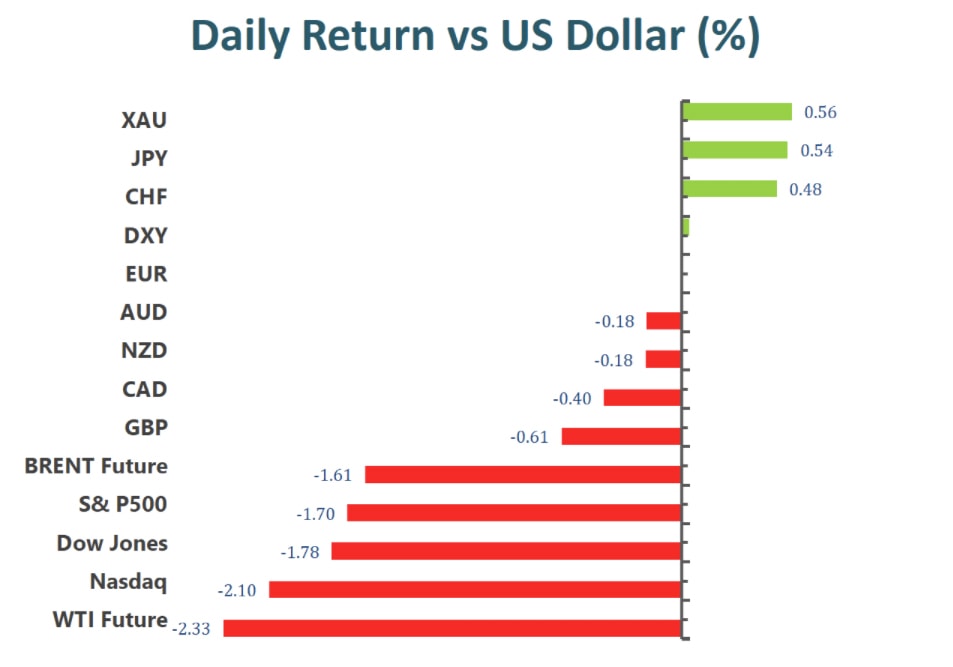
The benchmarks, S&P 500, Dow Jones and Nasdaq both dropped on Monday. S&P 500 was down 1.7% on a daily basis, the index finished in the negative territory for a third day and erased its gains from earlier in the week. The energy, cons discret and financials sectors are the worst performing among all groups, dropped 3.04%, 2.37% and 2.22%, respectively. The Nasdaq fell to its lowest level in about a month.

US dollar and Treasuries both gained before Wednesday’s Fed meeting, as investors expect Fed to give more hints about the timetable of tapering. Strong US Retail Sales data also supported prospects of early Fed tapering, which would eventually be seen to take away the punch bowl for Wall Street.
In Asia, Hong Kong stocks slumped as investors tracked the risk of contagion from the debt crisis at China Evergrande Group. Evergrande executives are working to remedy its business prospects but a messy meltdown at worst or a managed collapse are feared. Therefore, a bailout by Beijing can be hoped as a best scenario for financial markets.
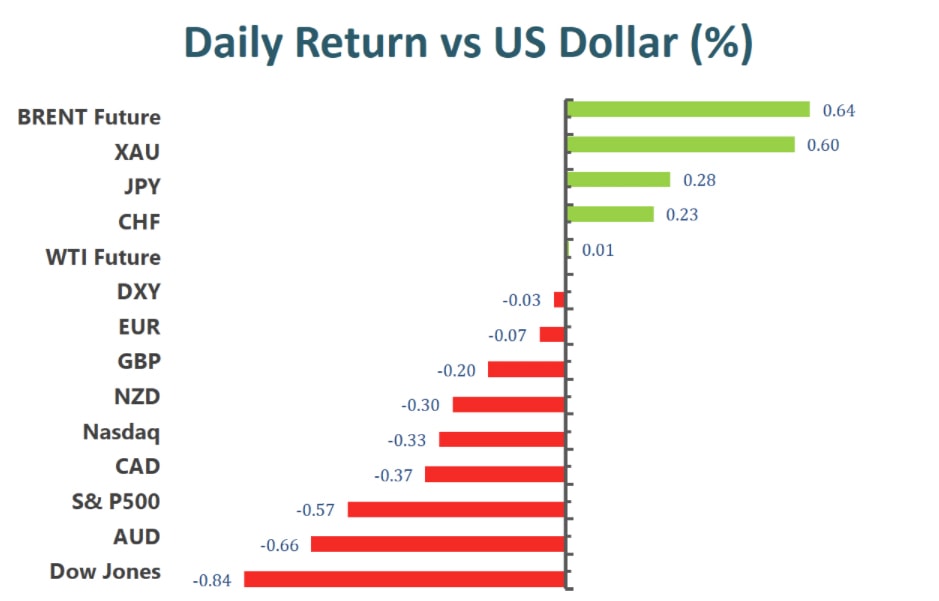
Main Pairs Movement:
Monday’s trading was marked by a broad market price correction and fears over the possible default of China’s property developer giant, Evergrande Group, which has one of the world’s largest debt burdens for any publicly traded real estate management or development company. Analysts have also pointed out that a price correction was due because of the long bull run that U.S. indices have enjoyed over much of 2021. The Hang Sheng Index dropped 3.3% to its lowest close since October.
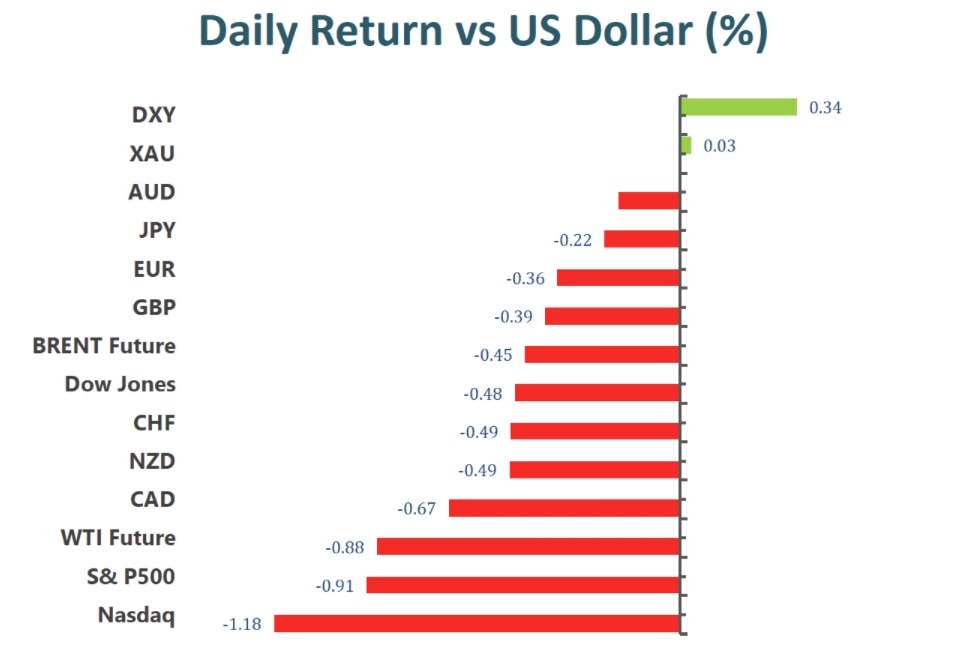
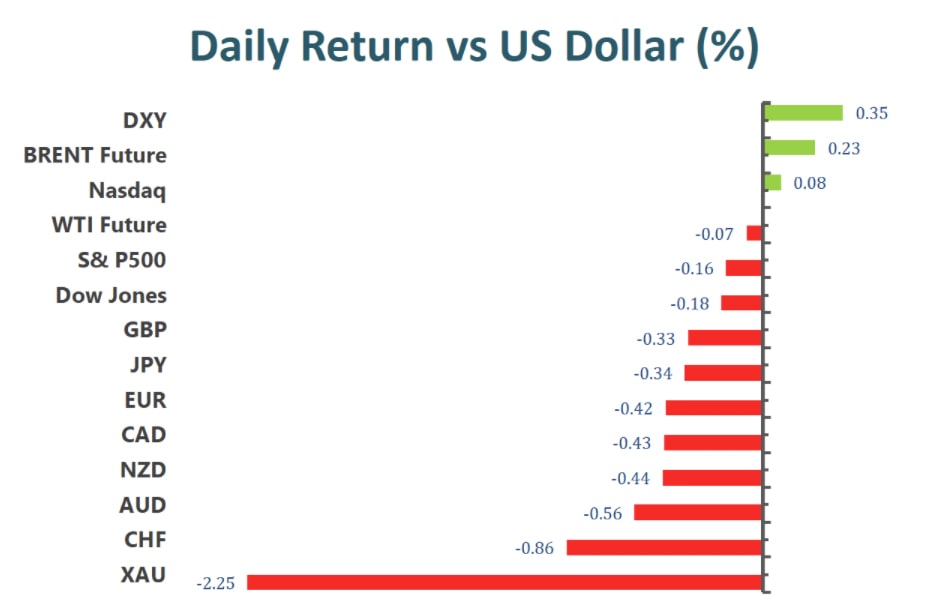
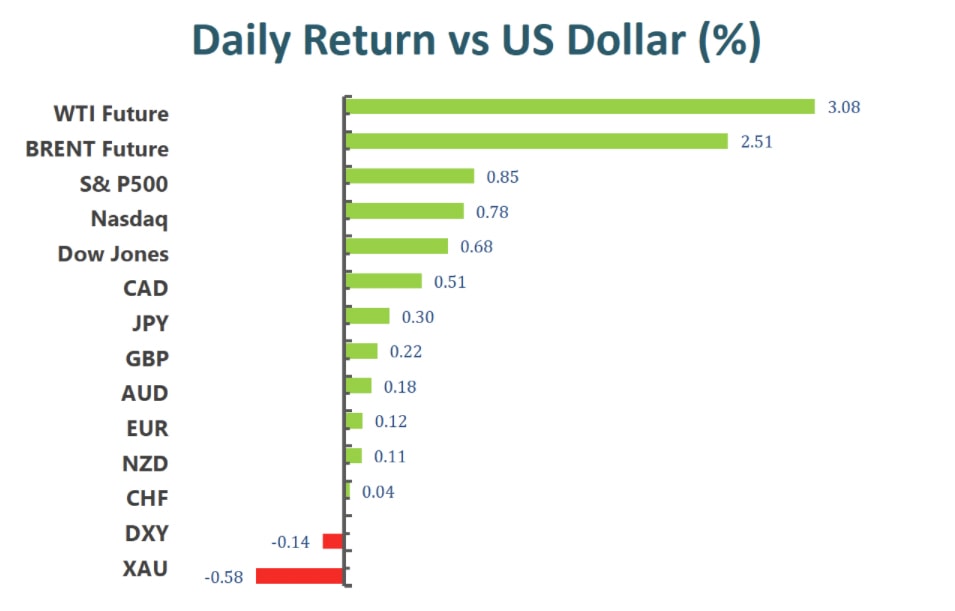
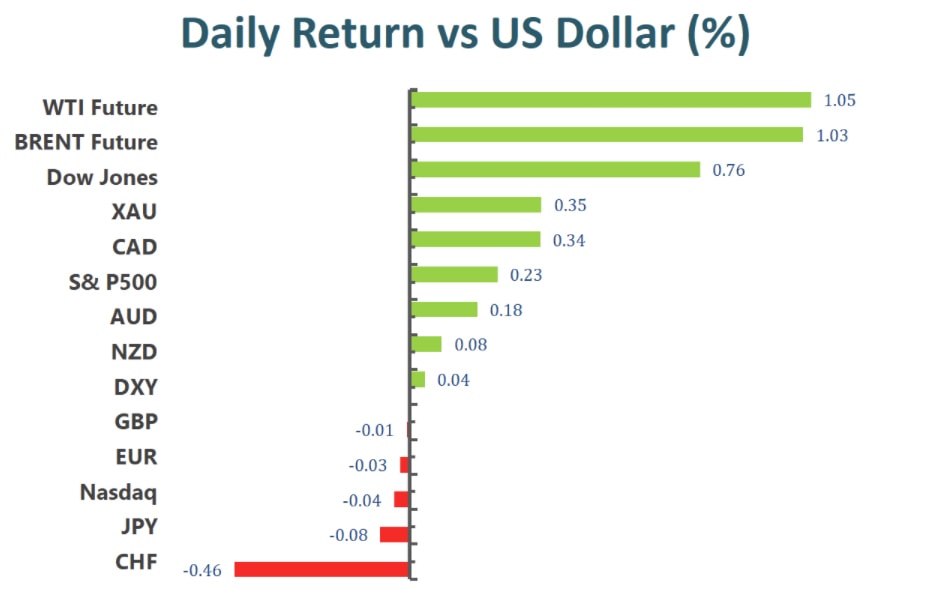
All U.S. dollar based foreign exchange pairs fell as demand for the safe haven dollar increased amid concerns over China’s credit issue. Cable saw strong selling pressure at the beginning of Monday’s trading and is struggling to find support as trading continues through the day. USD/CAD rallied on the back of strong demand in the U.S. dollar. AUD/USD struggled, as well, on the dollar’s rally. Investors will be paying attention to the RBA minutes, which is scheduled to release on the 21st.
Technical Analysis:
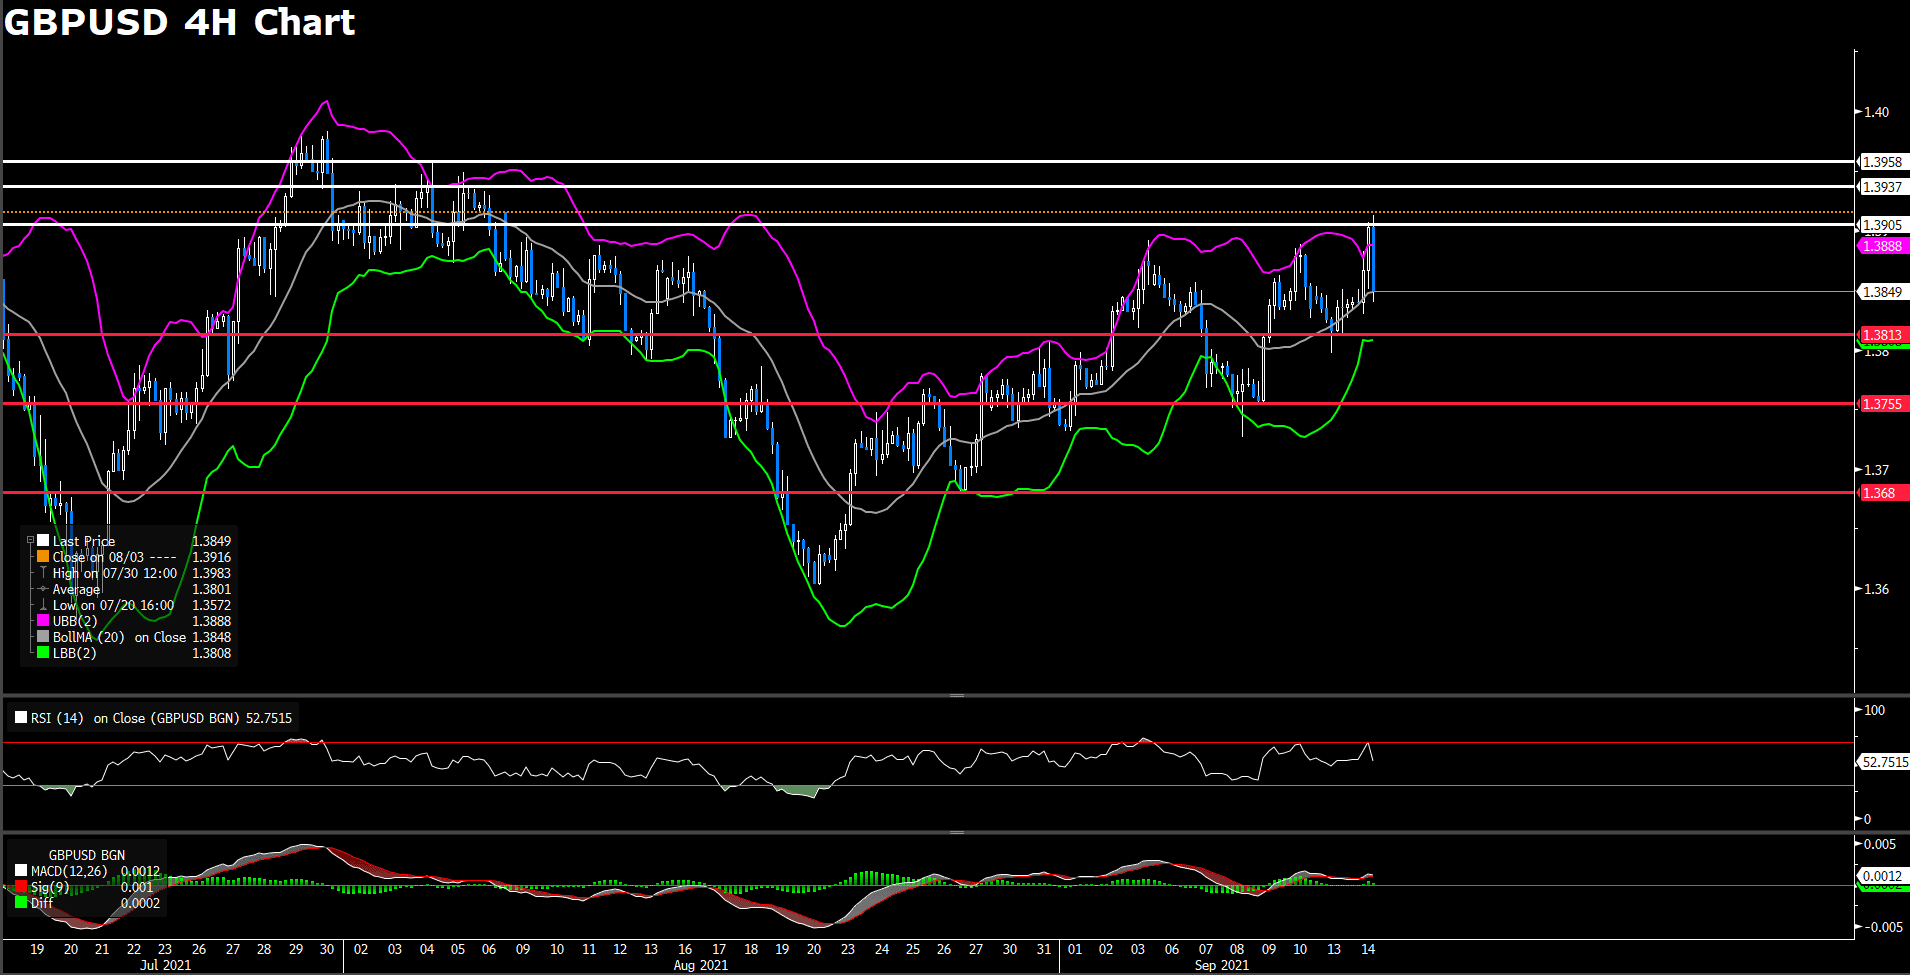
GBPUSD (4-hour Chart)
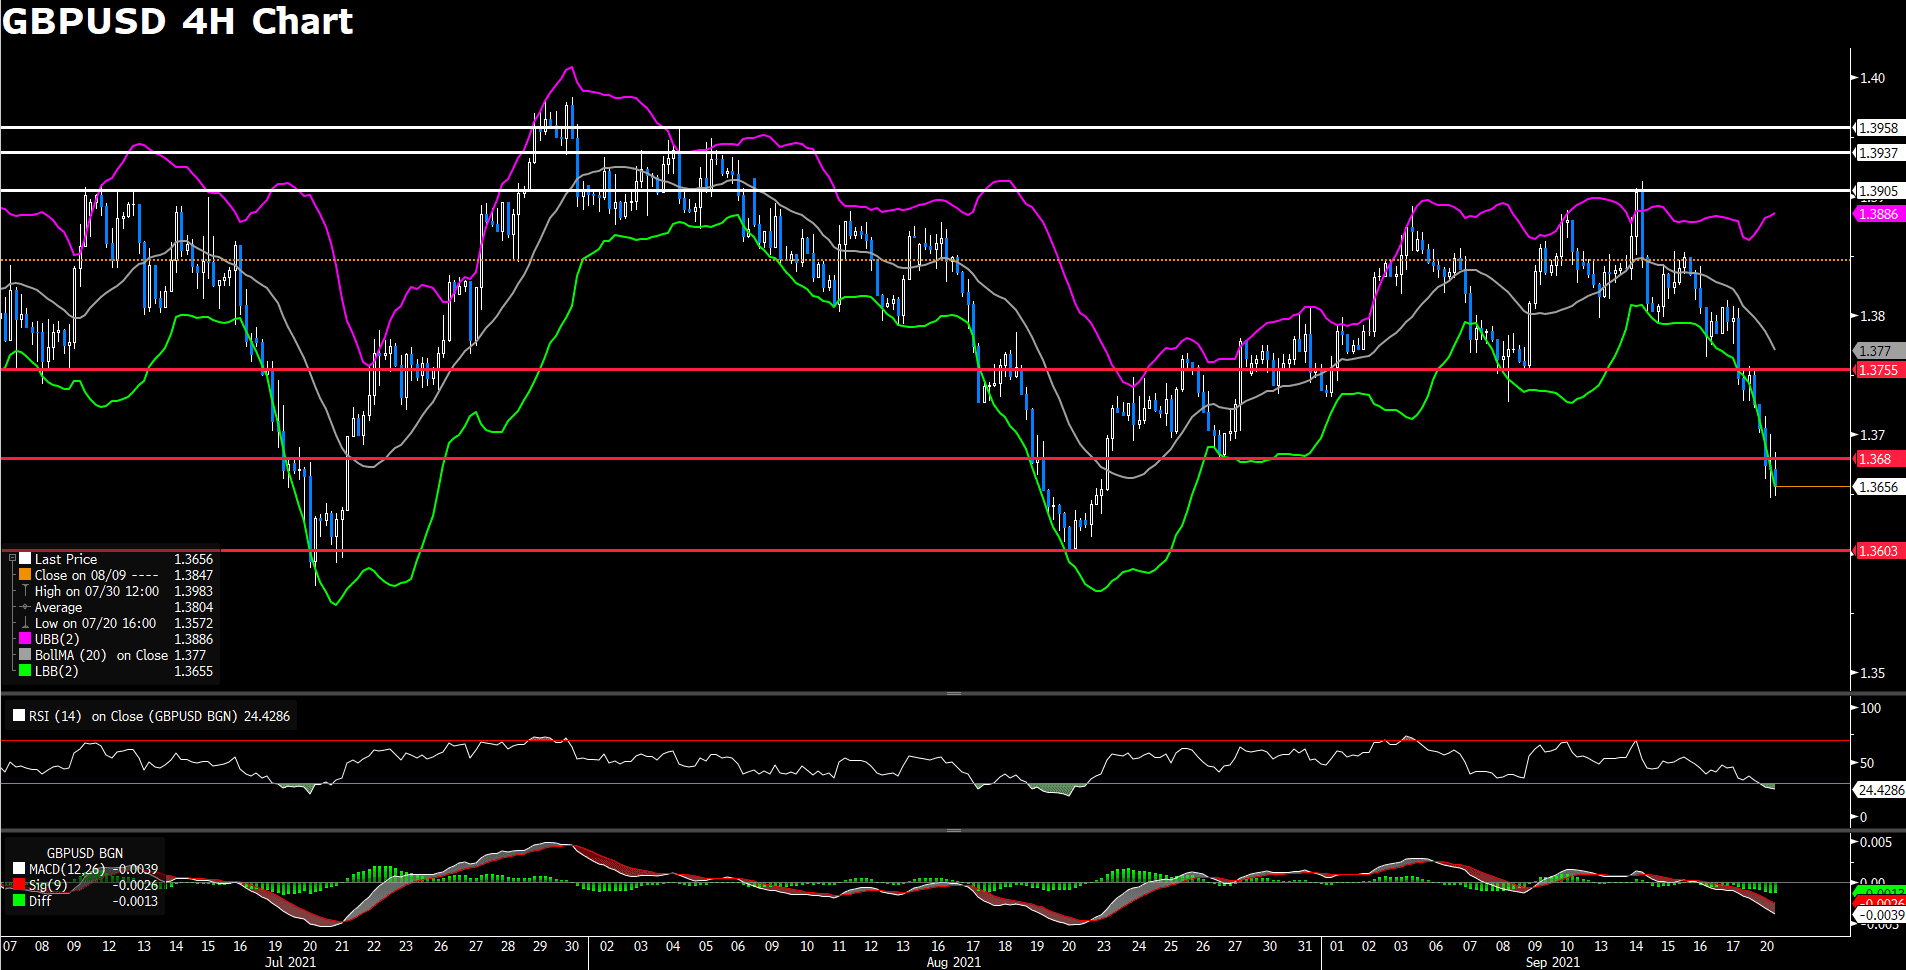
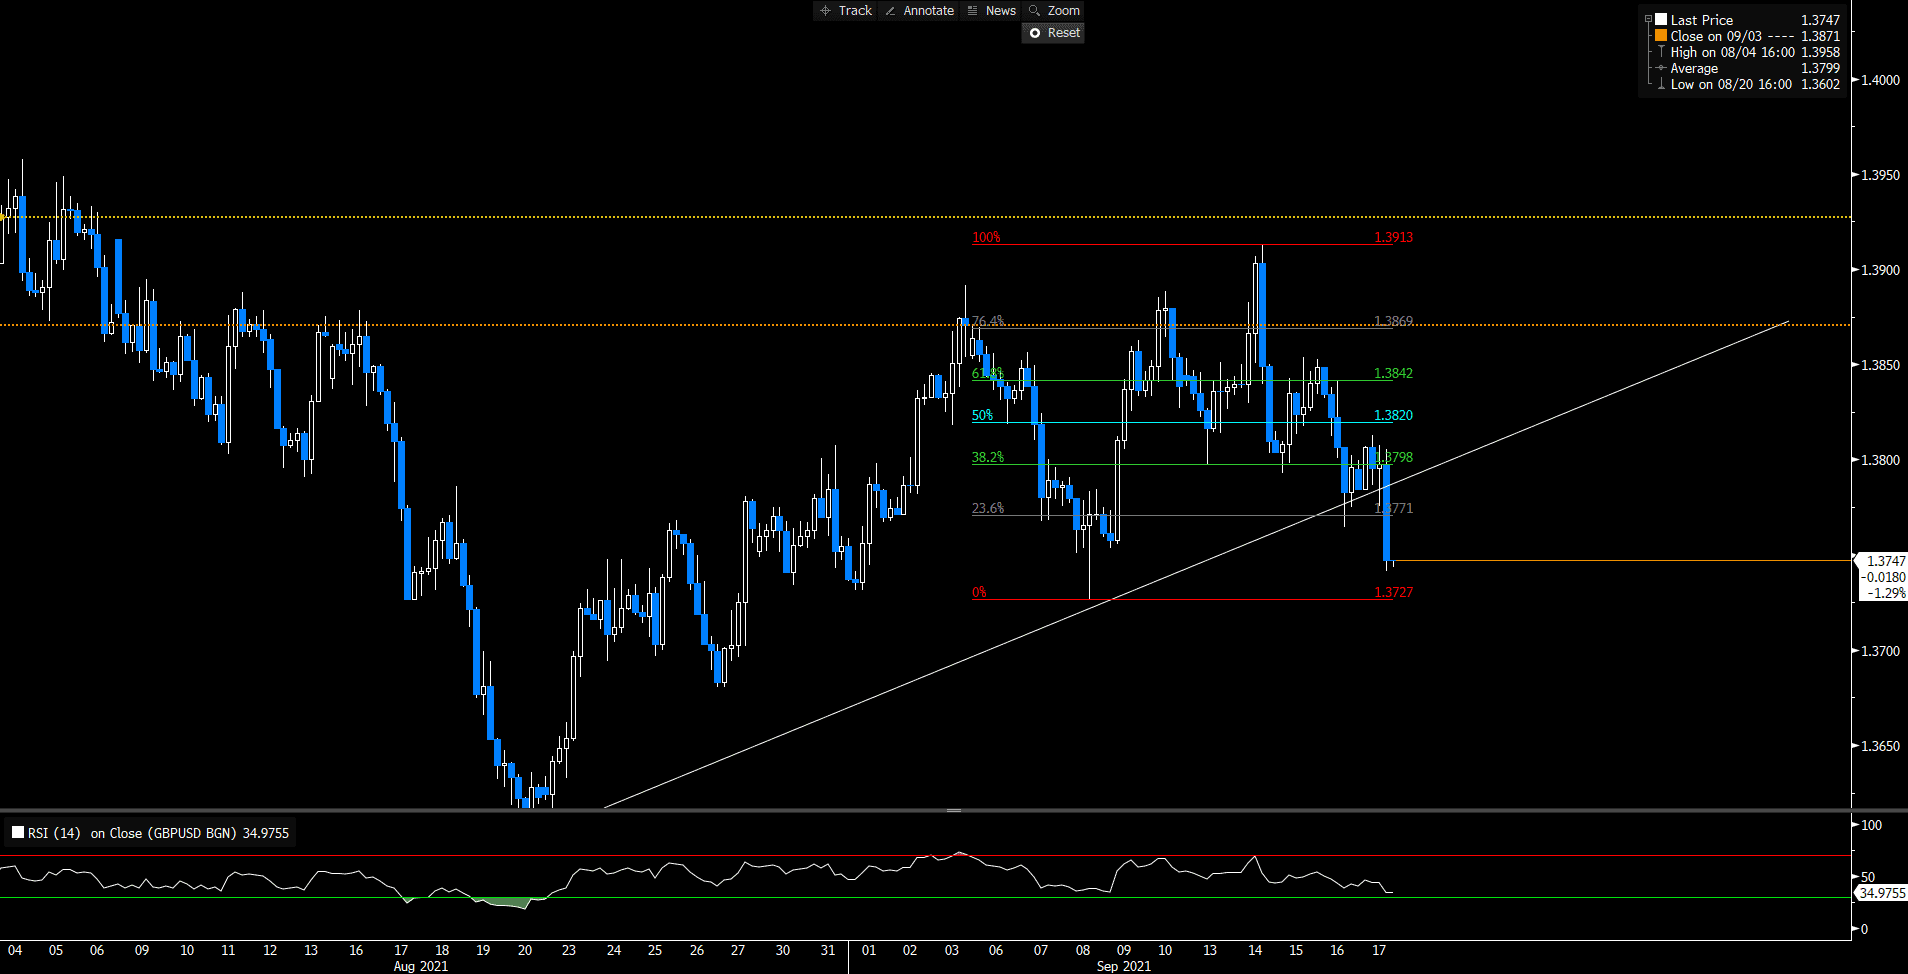
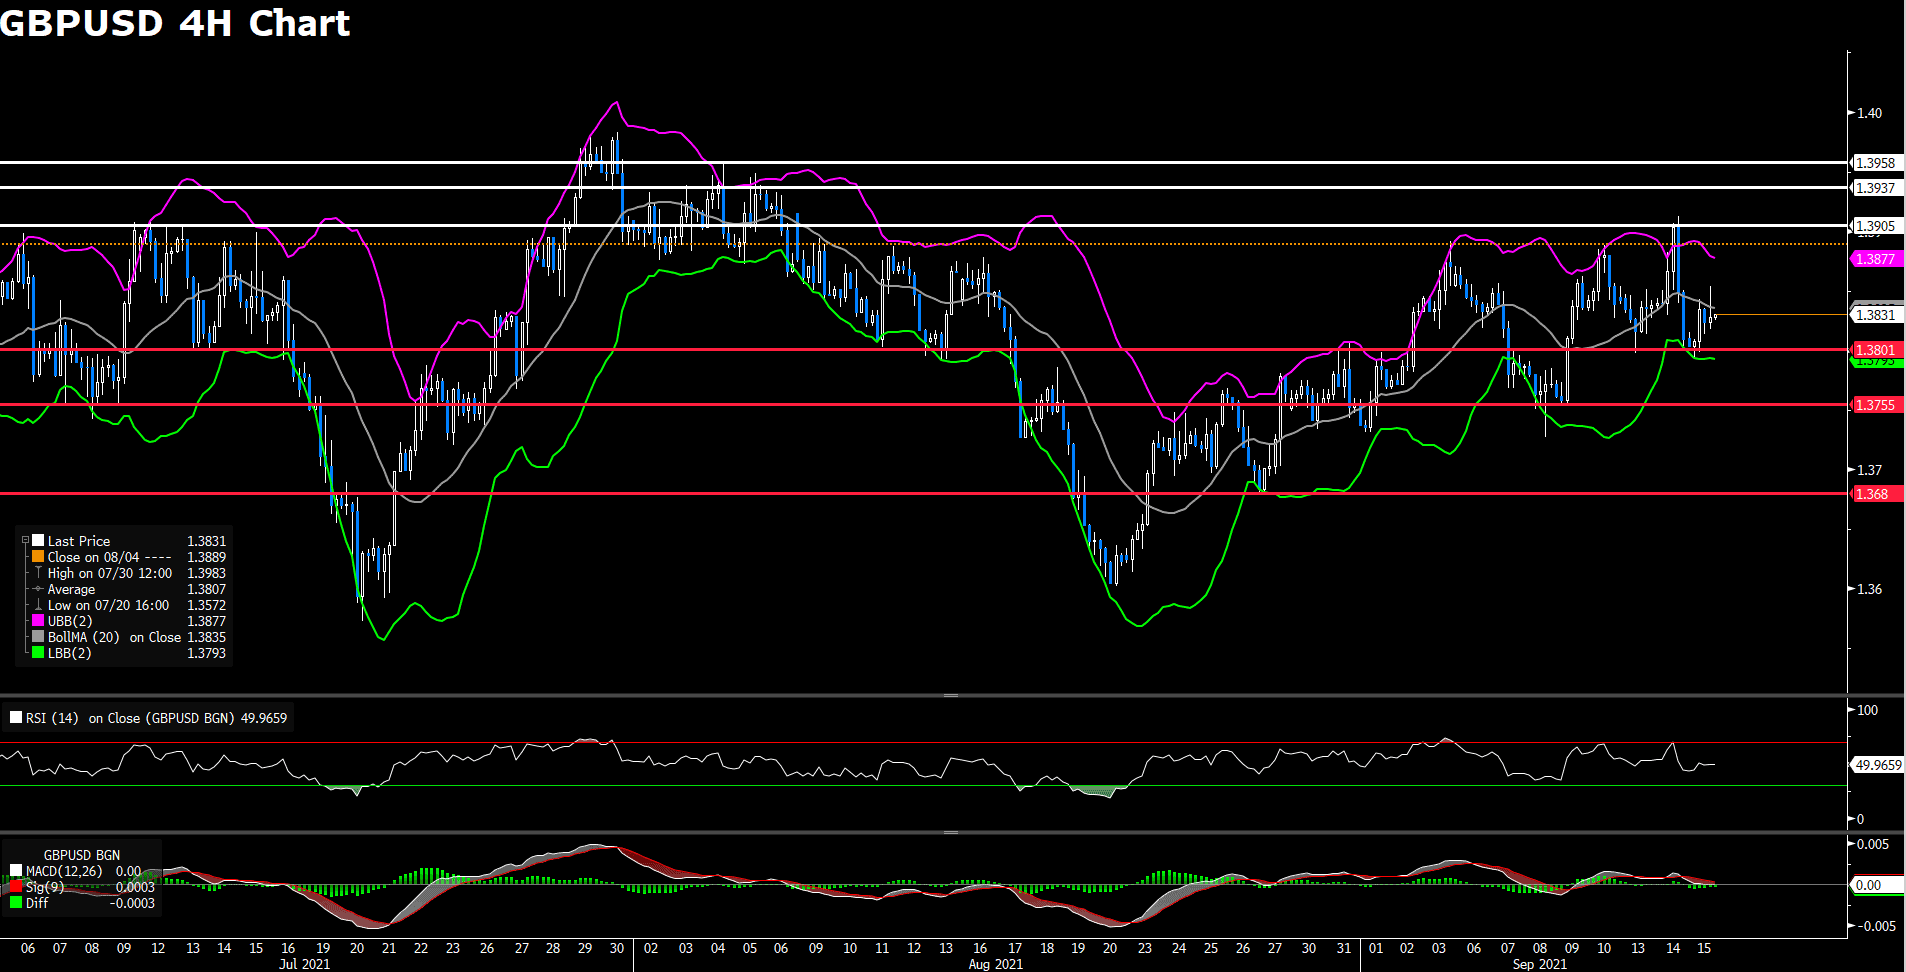
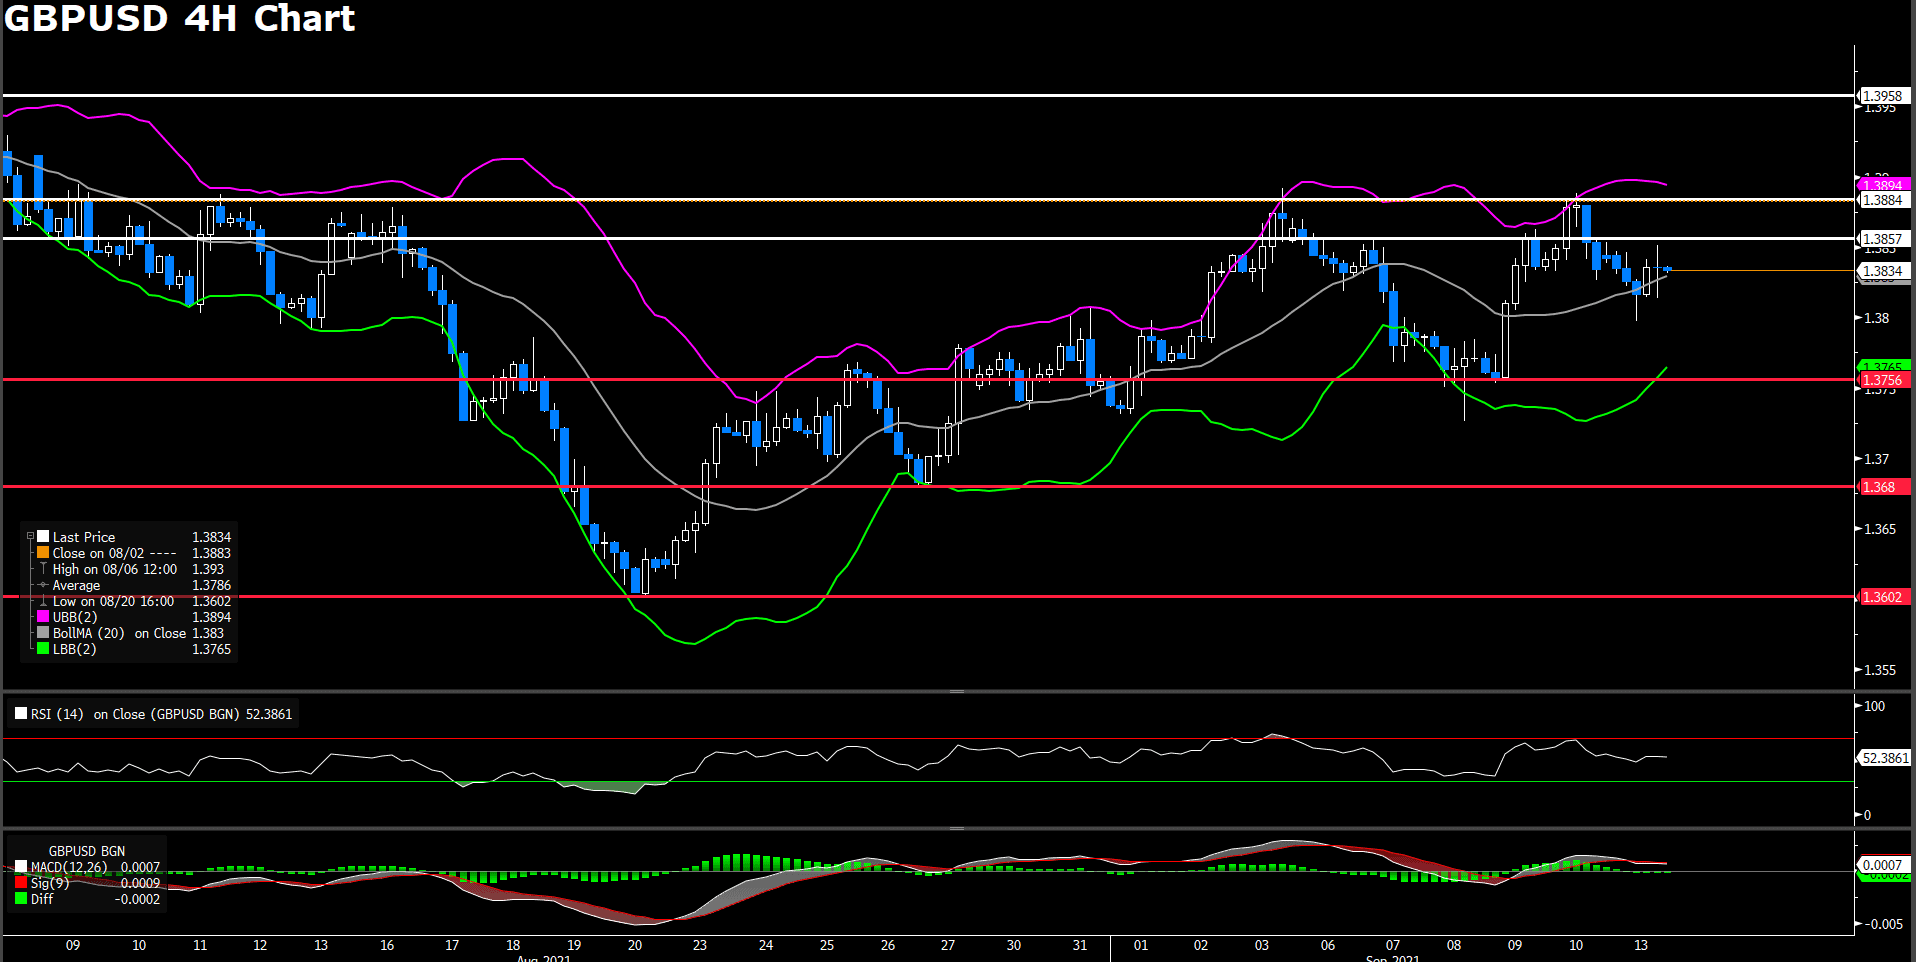
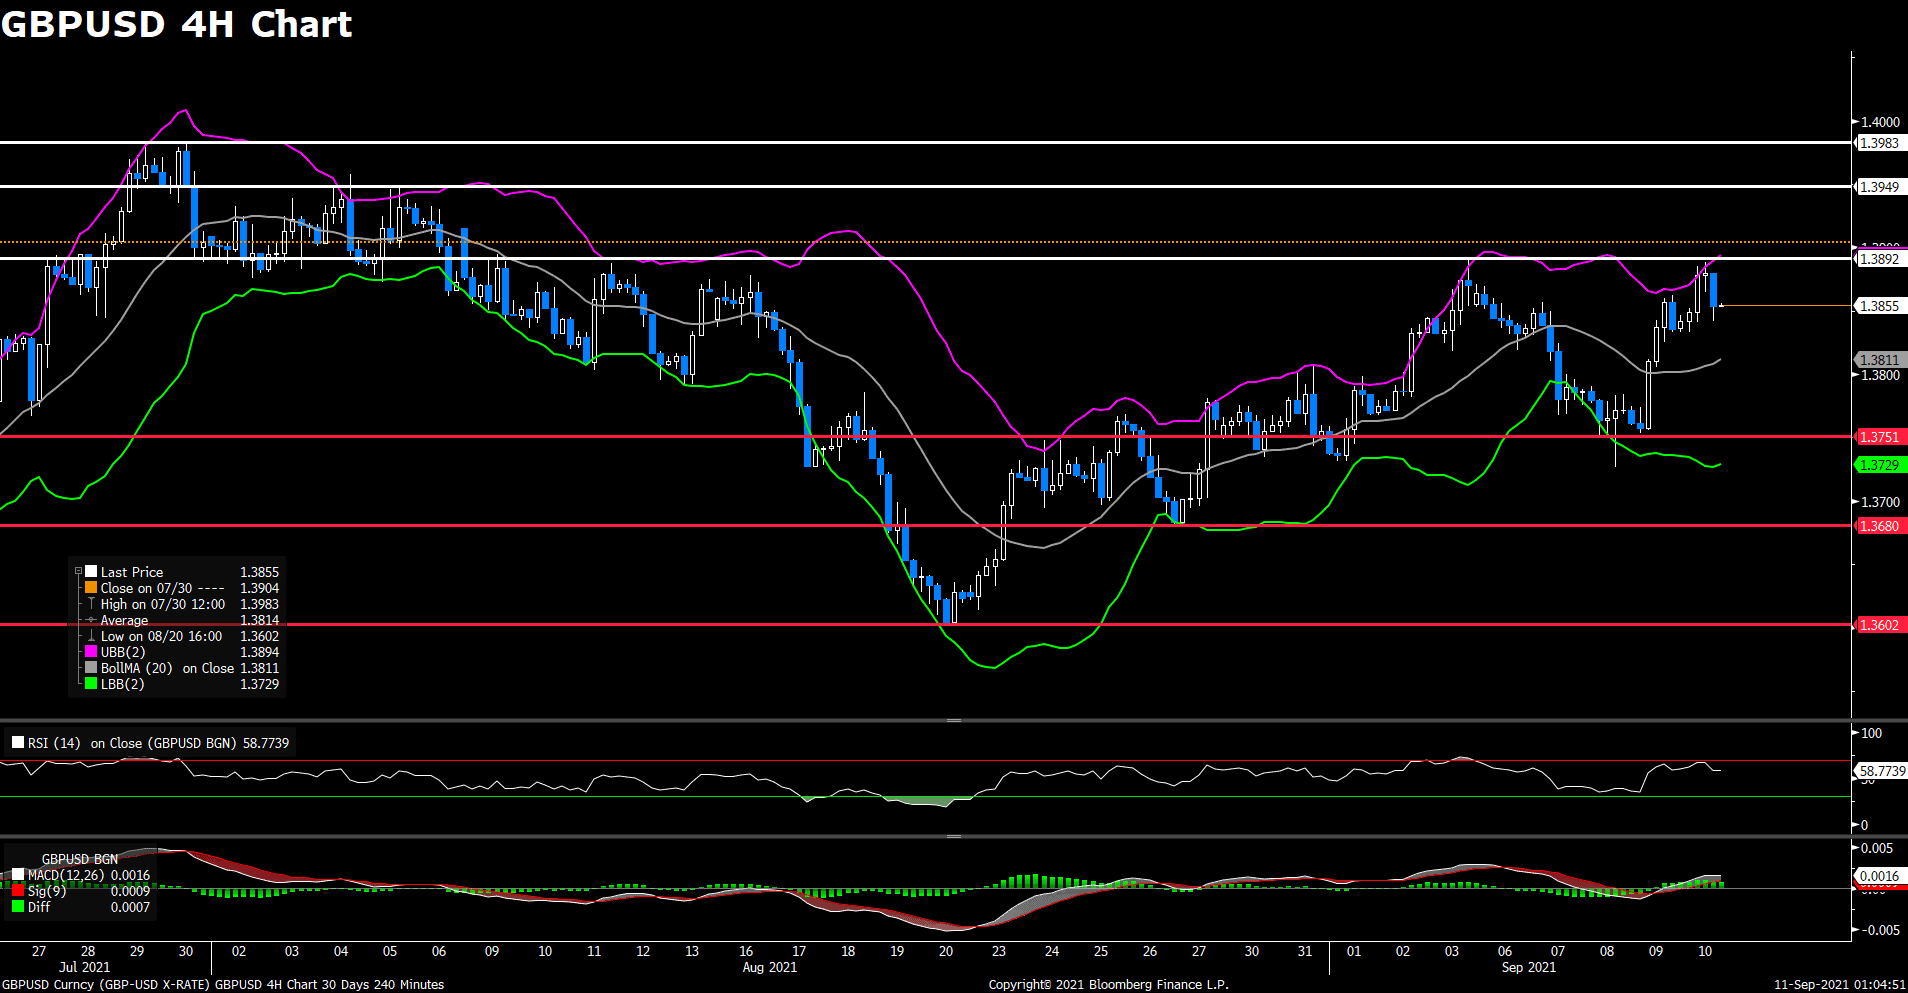
Cable fell sharply on Monday as money flowed to the safe haven asset—the Greenback. After sliding around 0.2% on the previous trading day, Cable began today’s trading even lower. Losing north of 0.6% during the European trading session, GBPUSD was able to find some breathing room around the 1.3669 price level before the American trading session brought the pair to even lower territory. As of writing, Cable is trading at 1.3653, which is lower than our previously estimated support level of 1.3727.
From the technical aspect, Cable is trading at the lower bound of the bollinger bands and is currently trending towards the immediate support level of 1.3603. Cable has failed to defend the previously estimated support level of 1.368. Cable has fell below the 50, 100, and 200 day SMA. RSI for Cable sits at 31.90, suggesting some overselling in the market.
Resistance: 1.381, 1.3849, 1.3905
Support: 1.3603
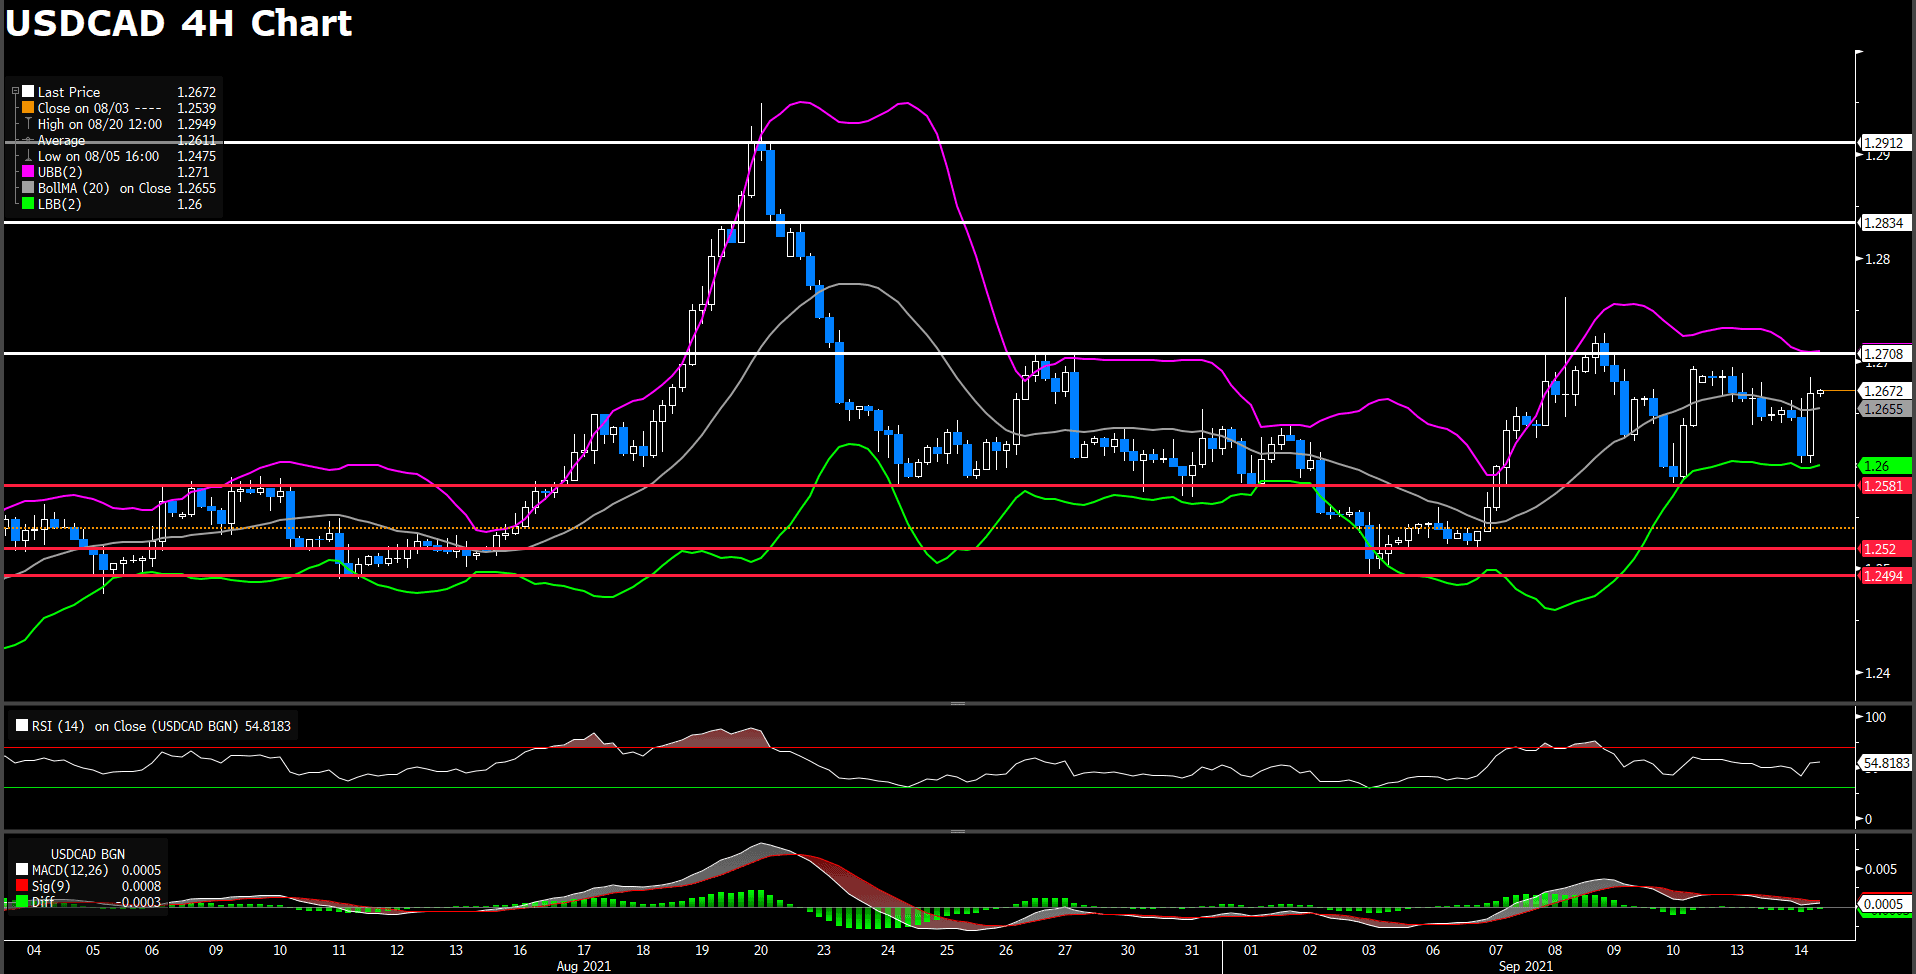
USDCAD (4- Hour Chart)

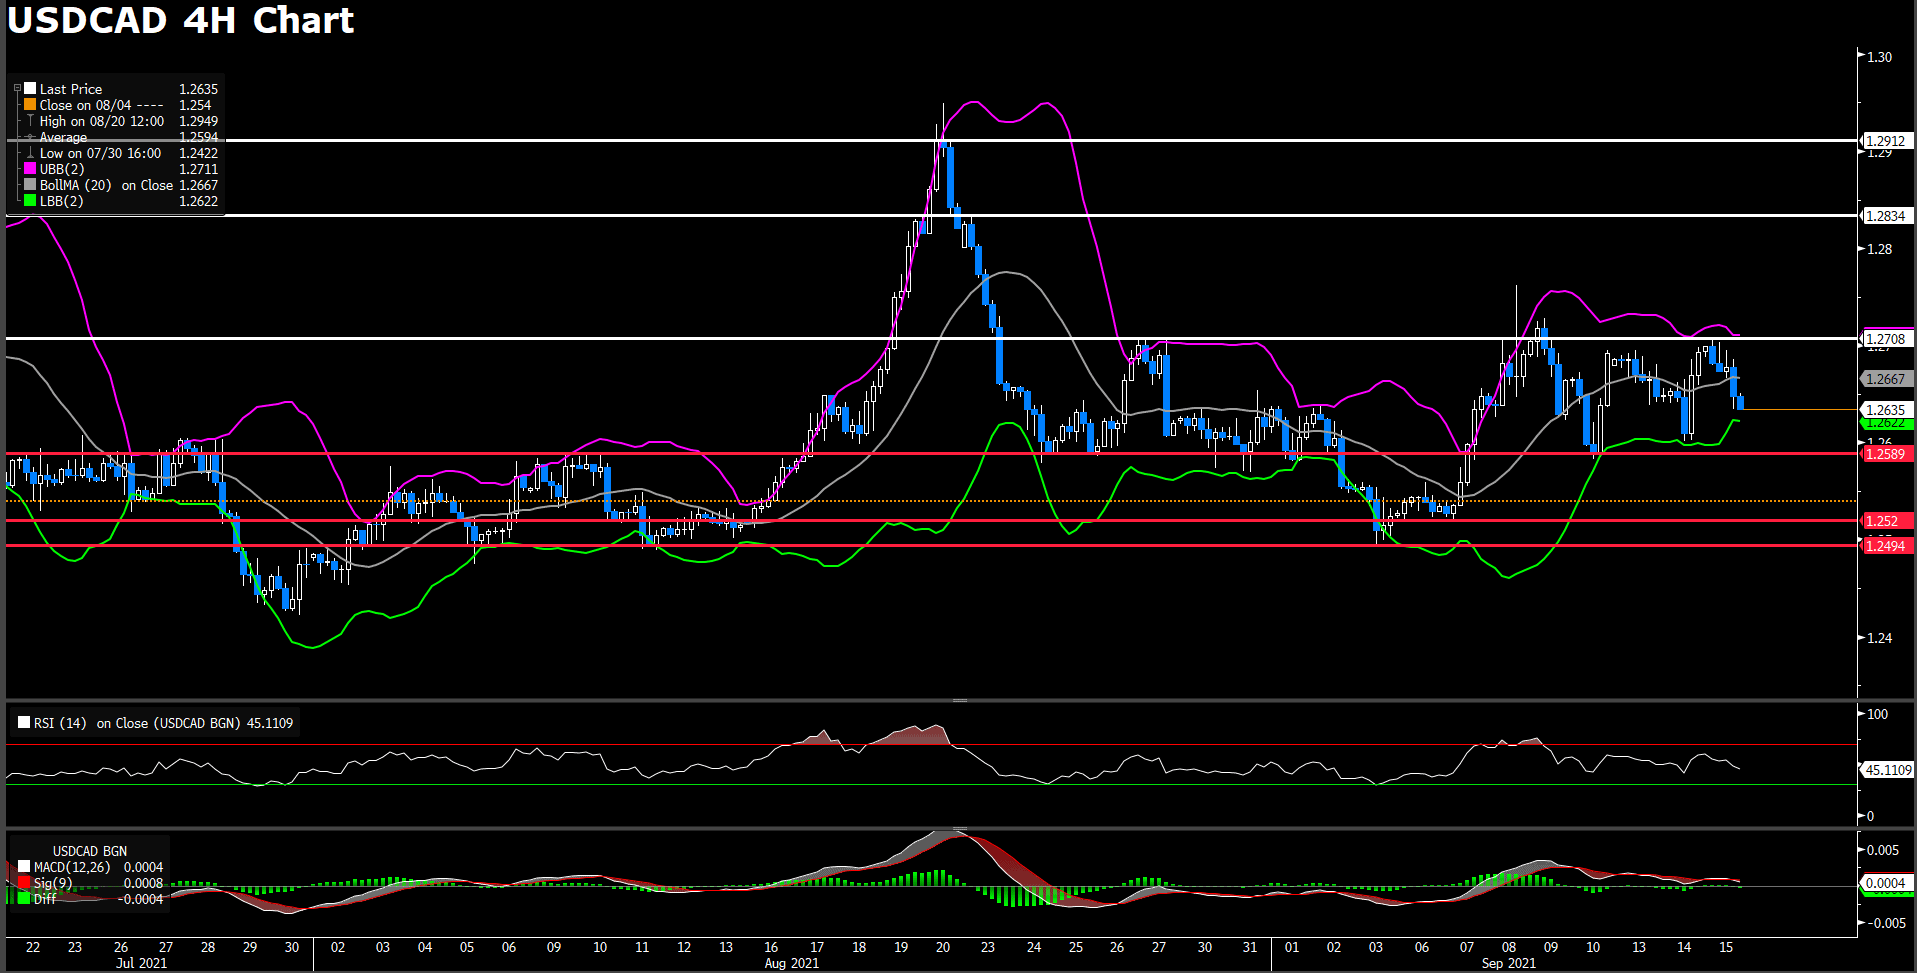
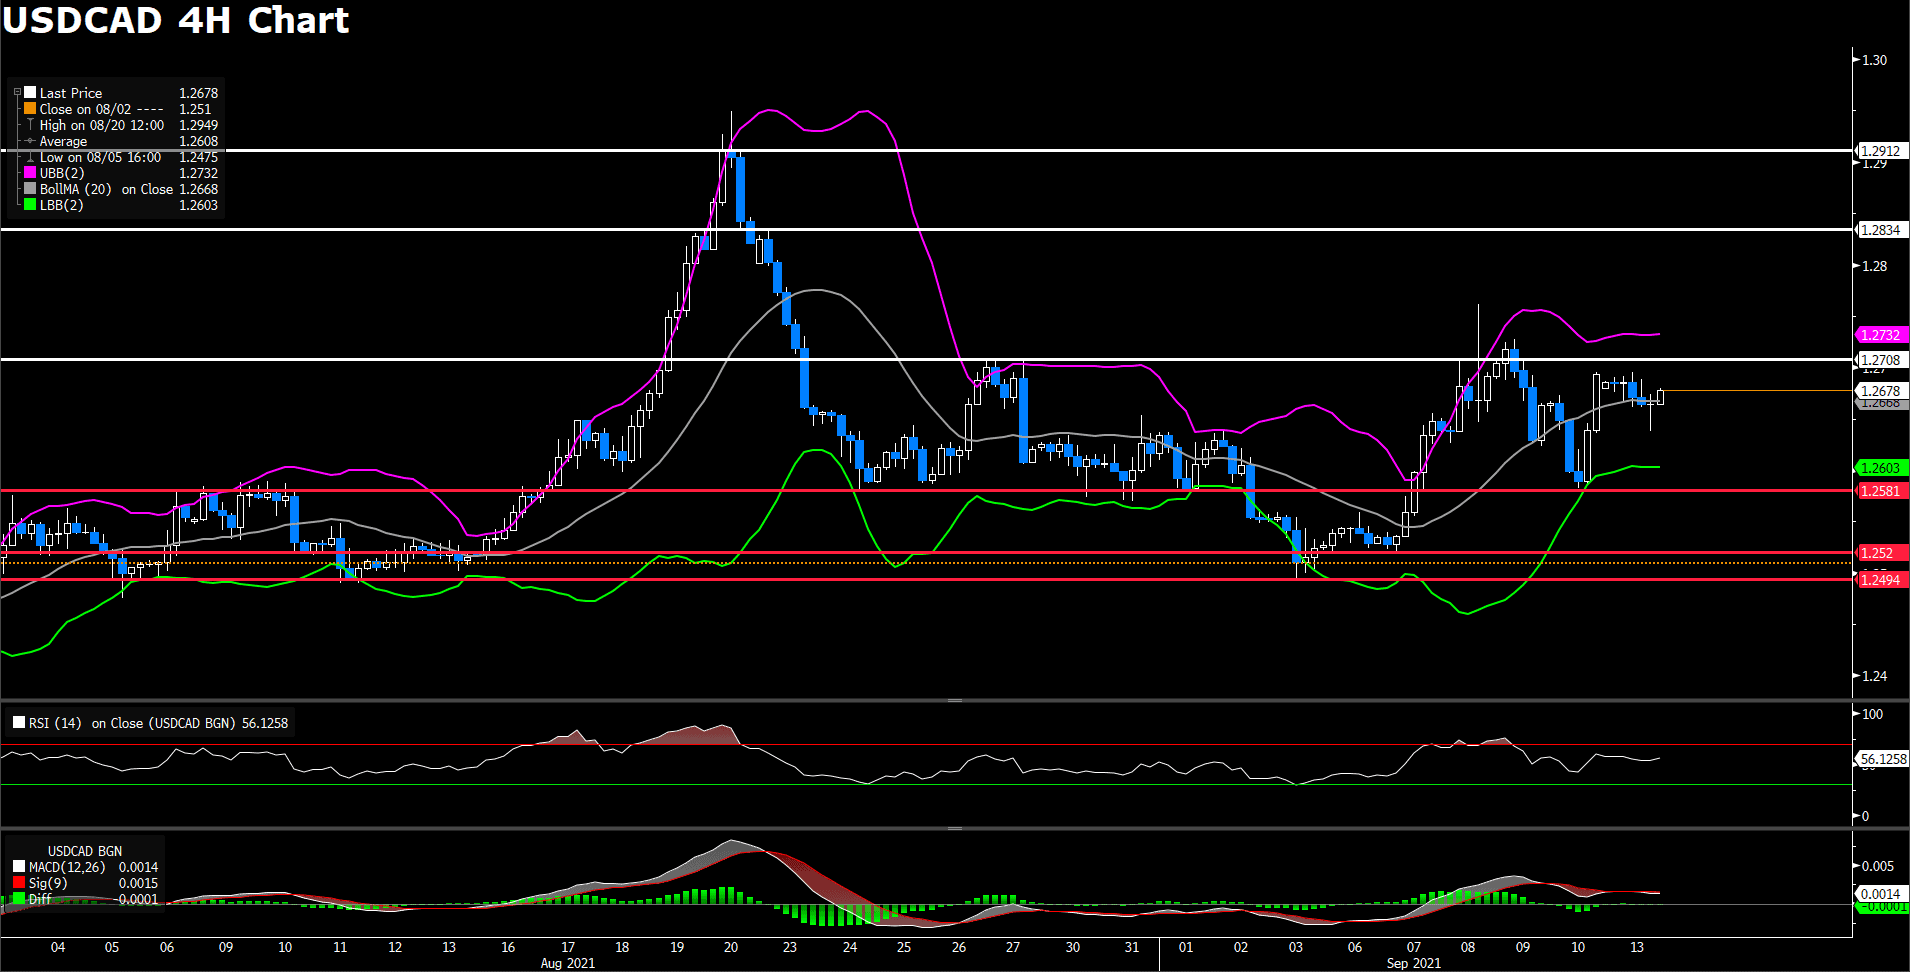
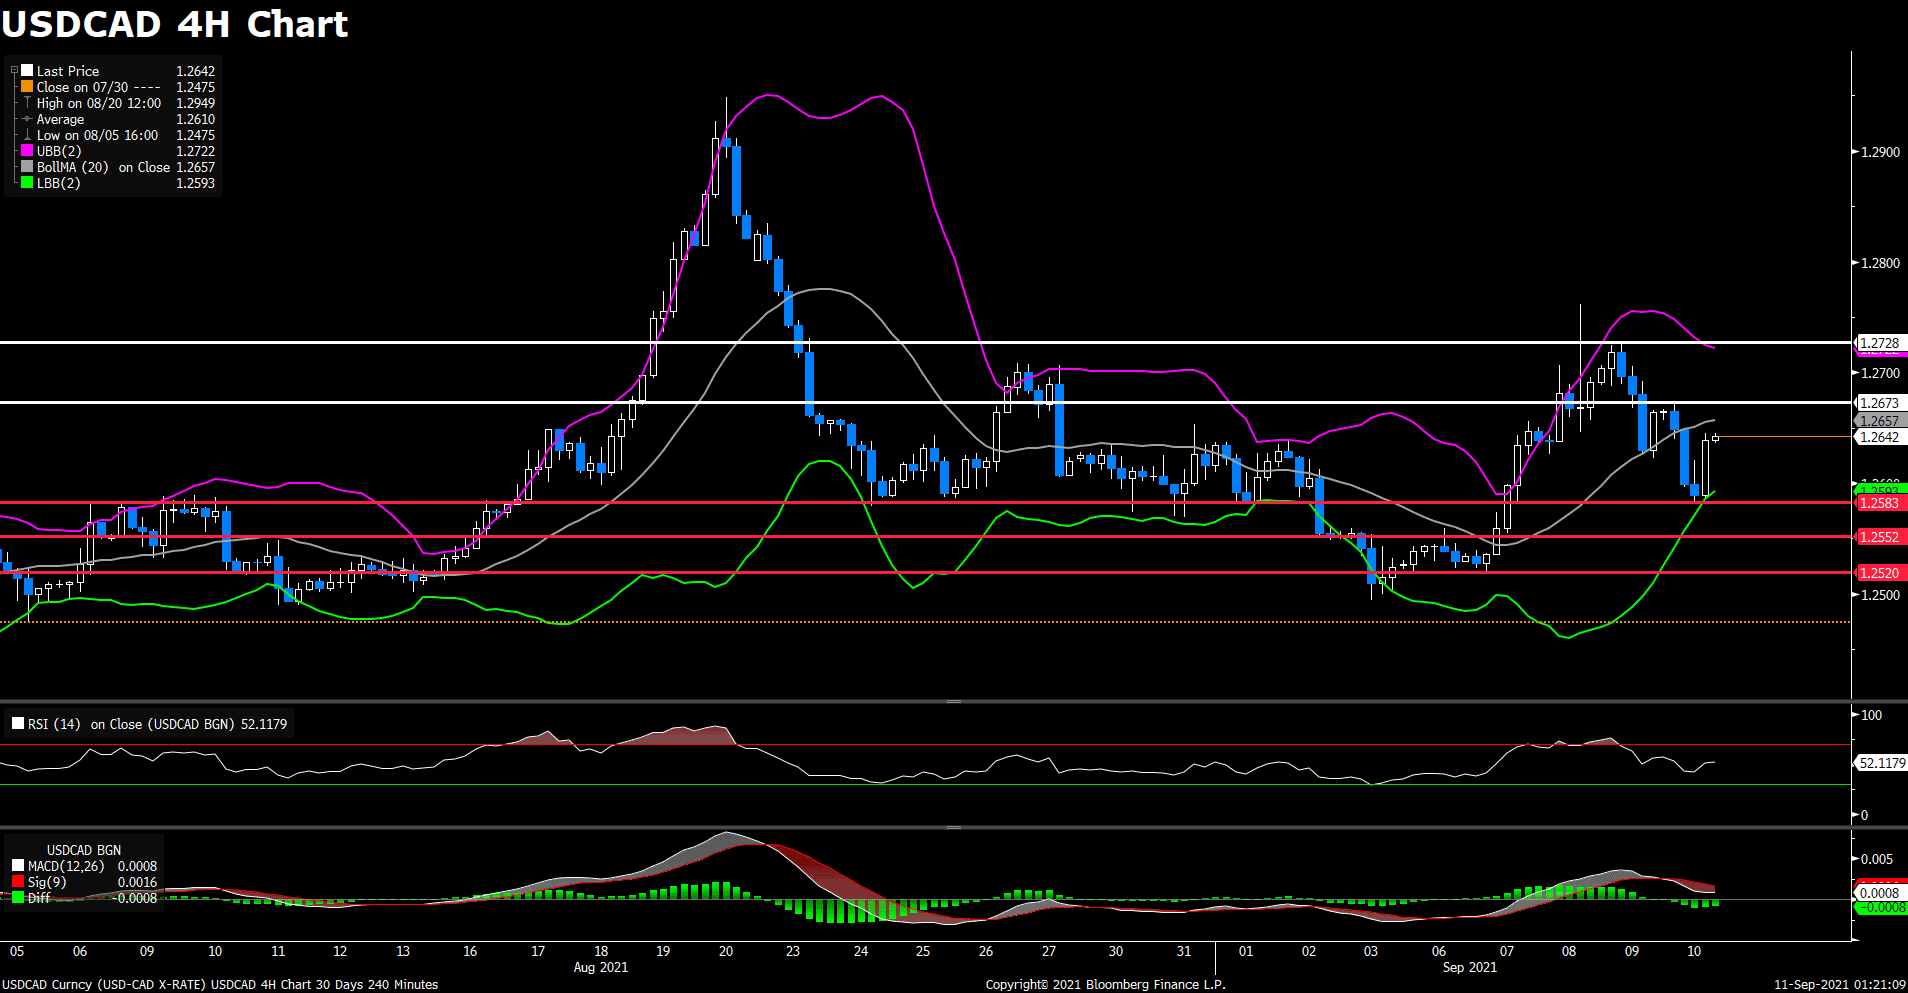
During the American trading session, USD/CAD climbed to a one-month high of 1.2895. The pair has since settled back down to near the 1.28 price level, which is our previously estimated resistance level for USD/CAD. Rally for the pair was fueled by investors pouring money into the safe haven dollar as concerns over China has boiled over into the foreign exchange market. However, looking ahead into the week, there are significant events that could sway the pair in either direction. On the one hand, the election for the House of Commons is set to take place on Monday; on the other hand, the FED FOMC press conference is set to take place this Wednesday.
From the technical aspect, USD/CAD has broken through the 1.28 resistance level and came close to 1.29 during today’s trading. RSI for the pair sits at 72, as of writing, suggesting some over buying in the market. USD/CAD is trading above the 50, 100, and 200 day SMA and the pair is trading at the upper bound of the bollinger bands.
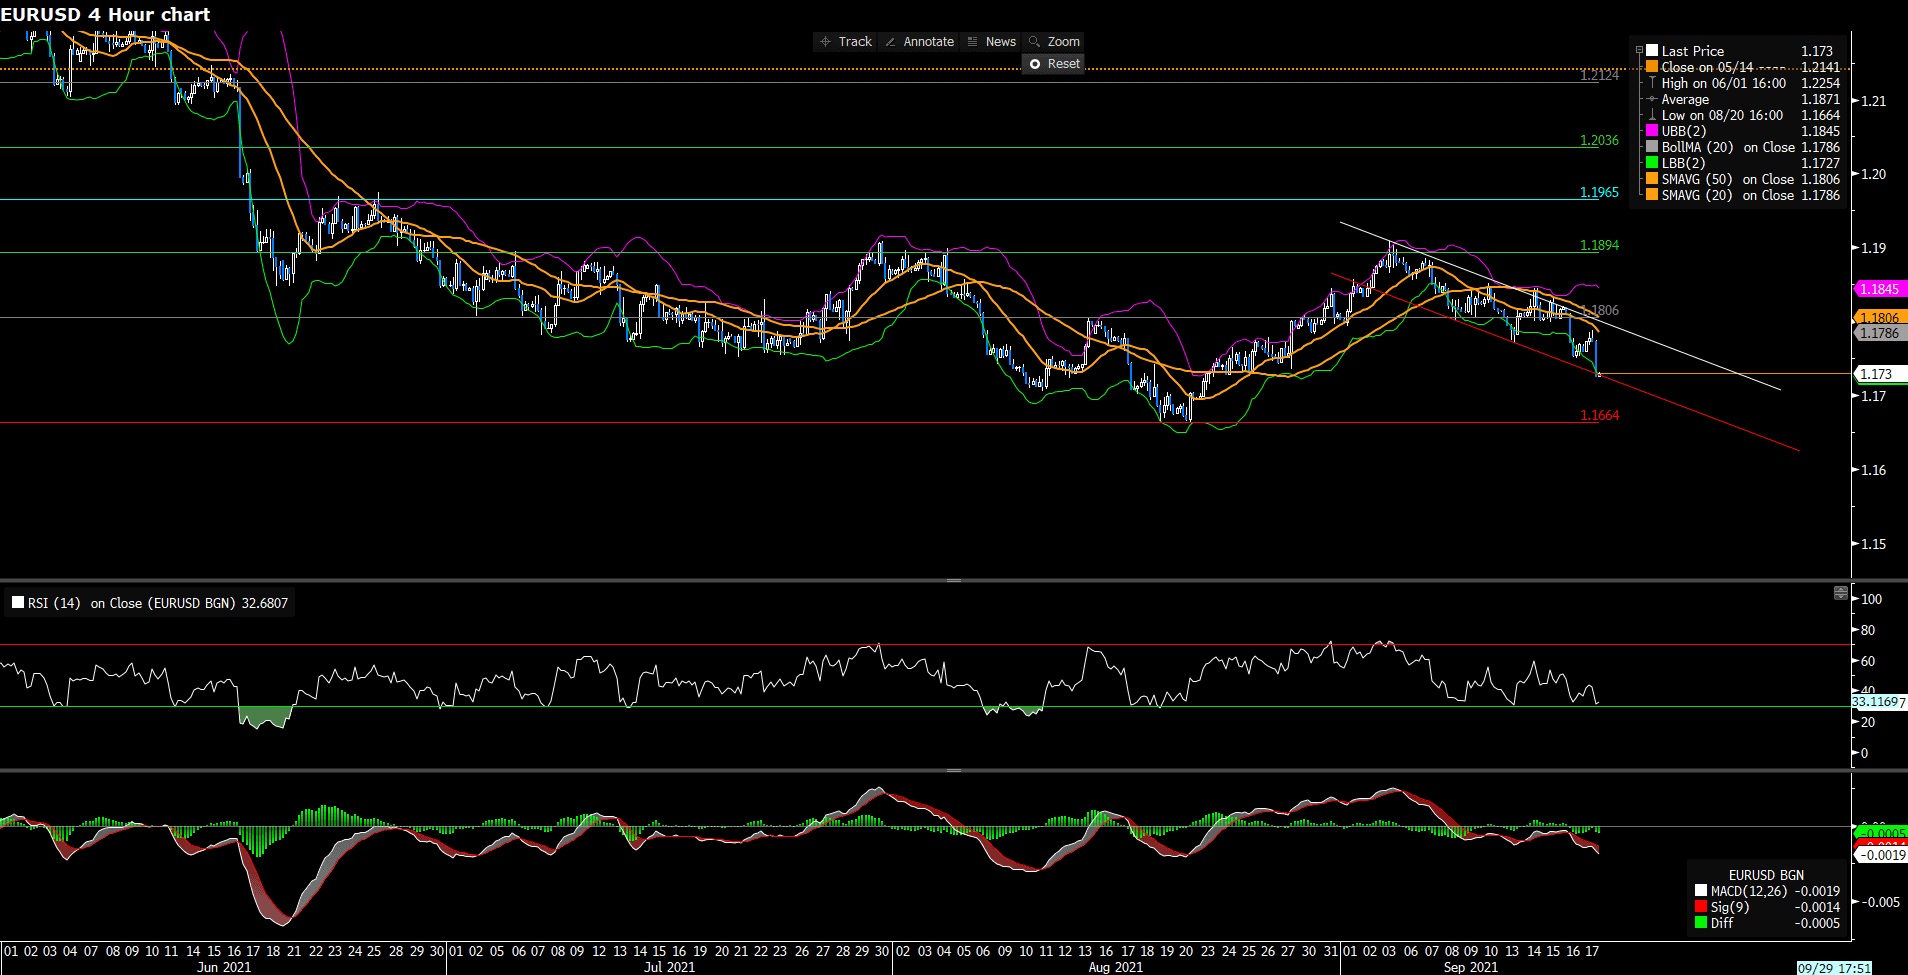
Resistance: 1.1806, 1.1894, 1.1965
Support: 1.1664
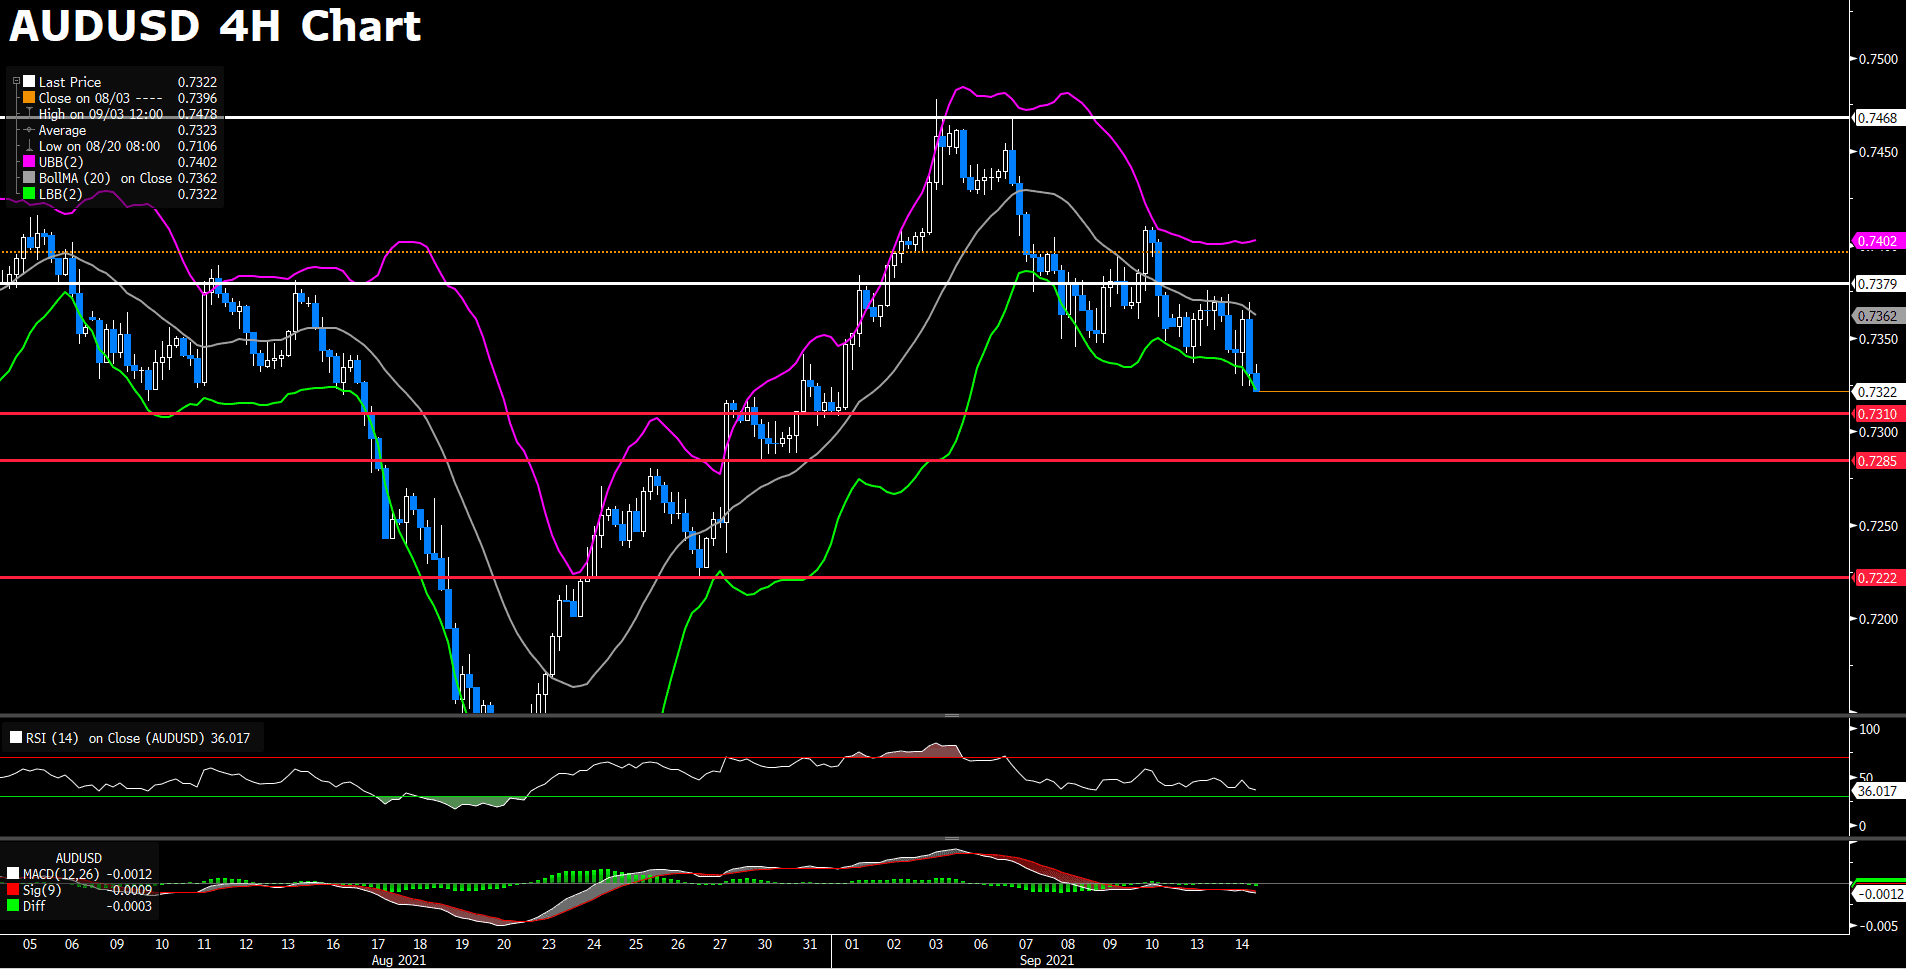
AUDUSD (Daily Chart)
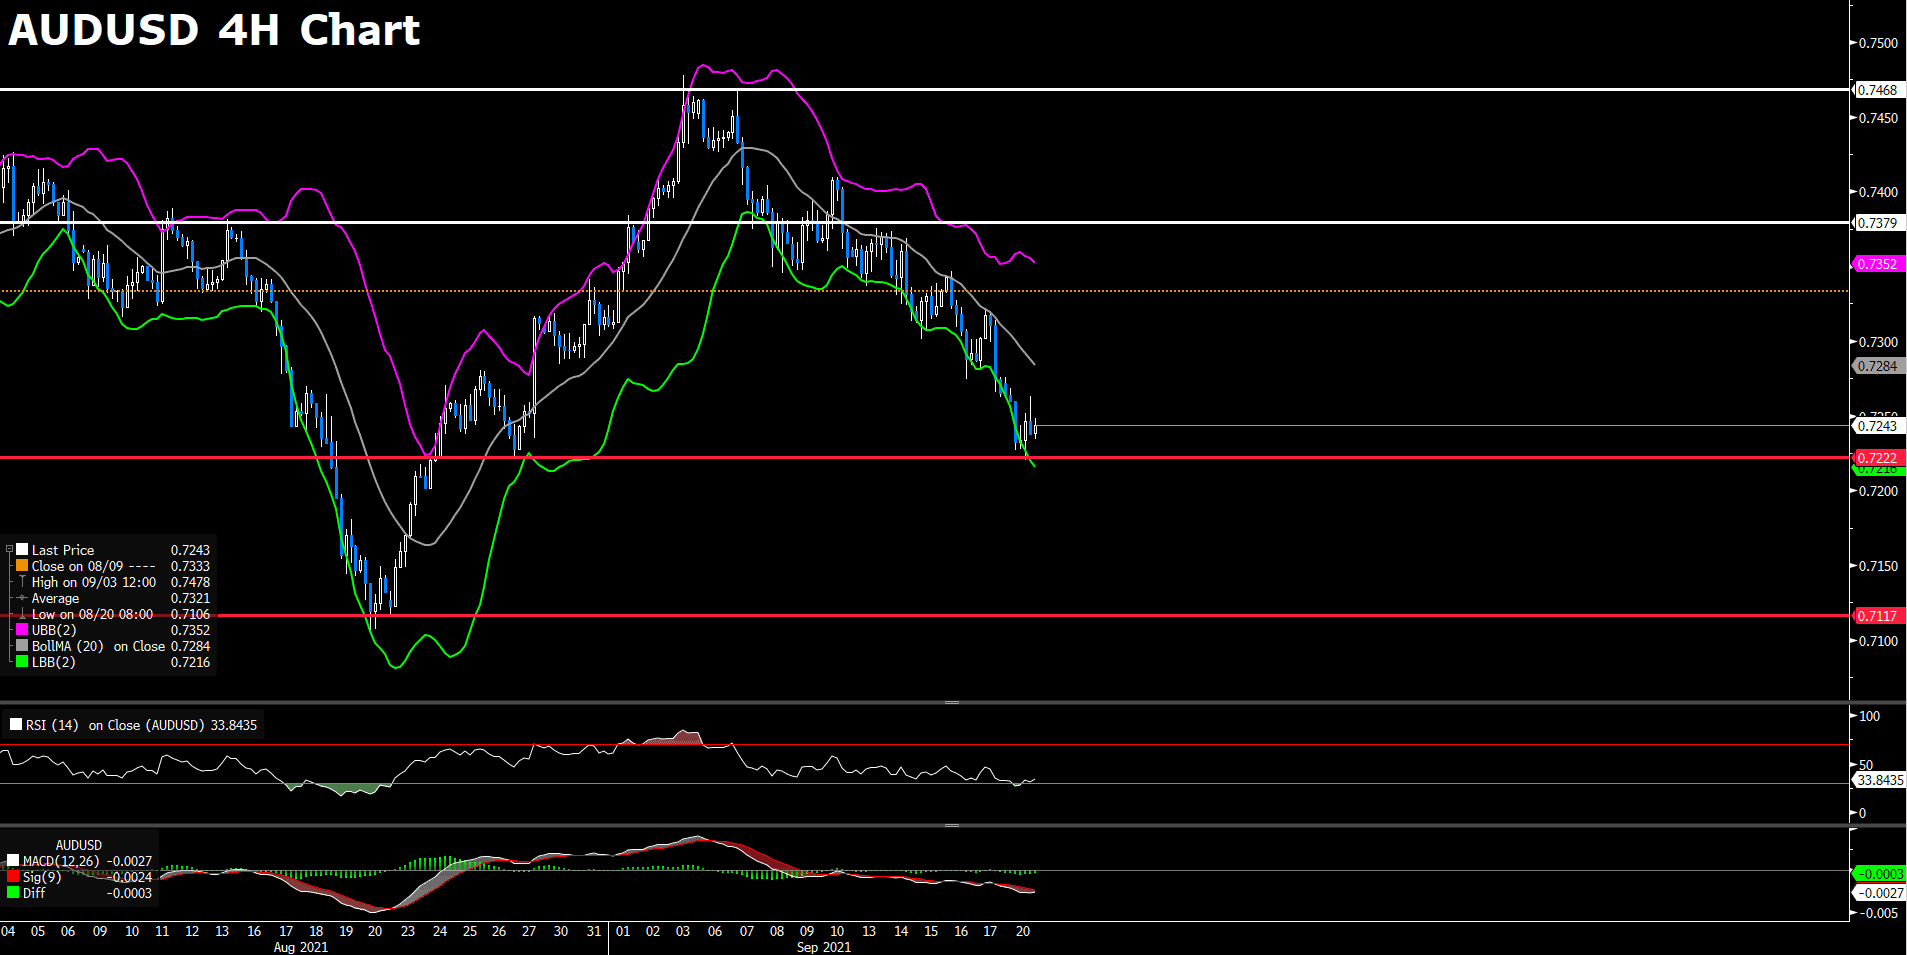
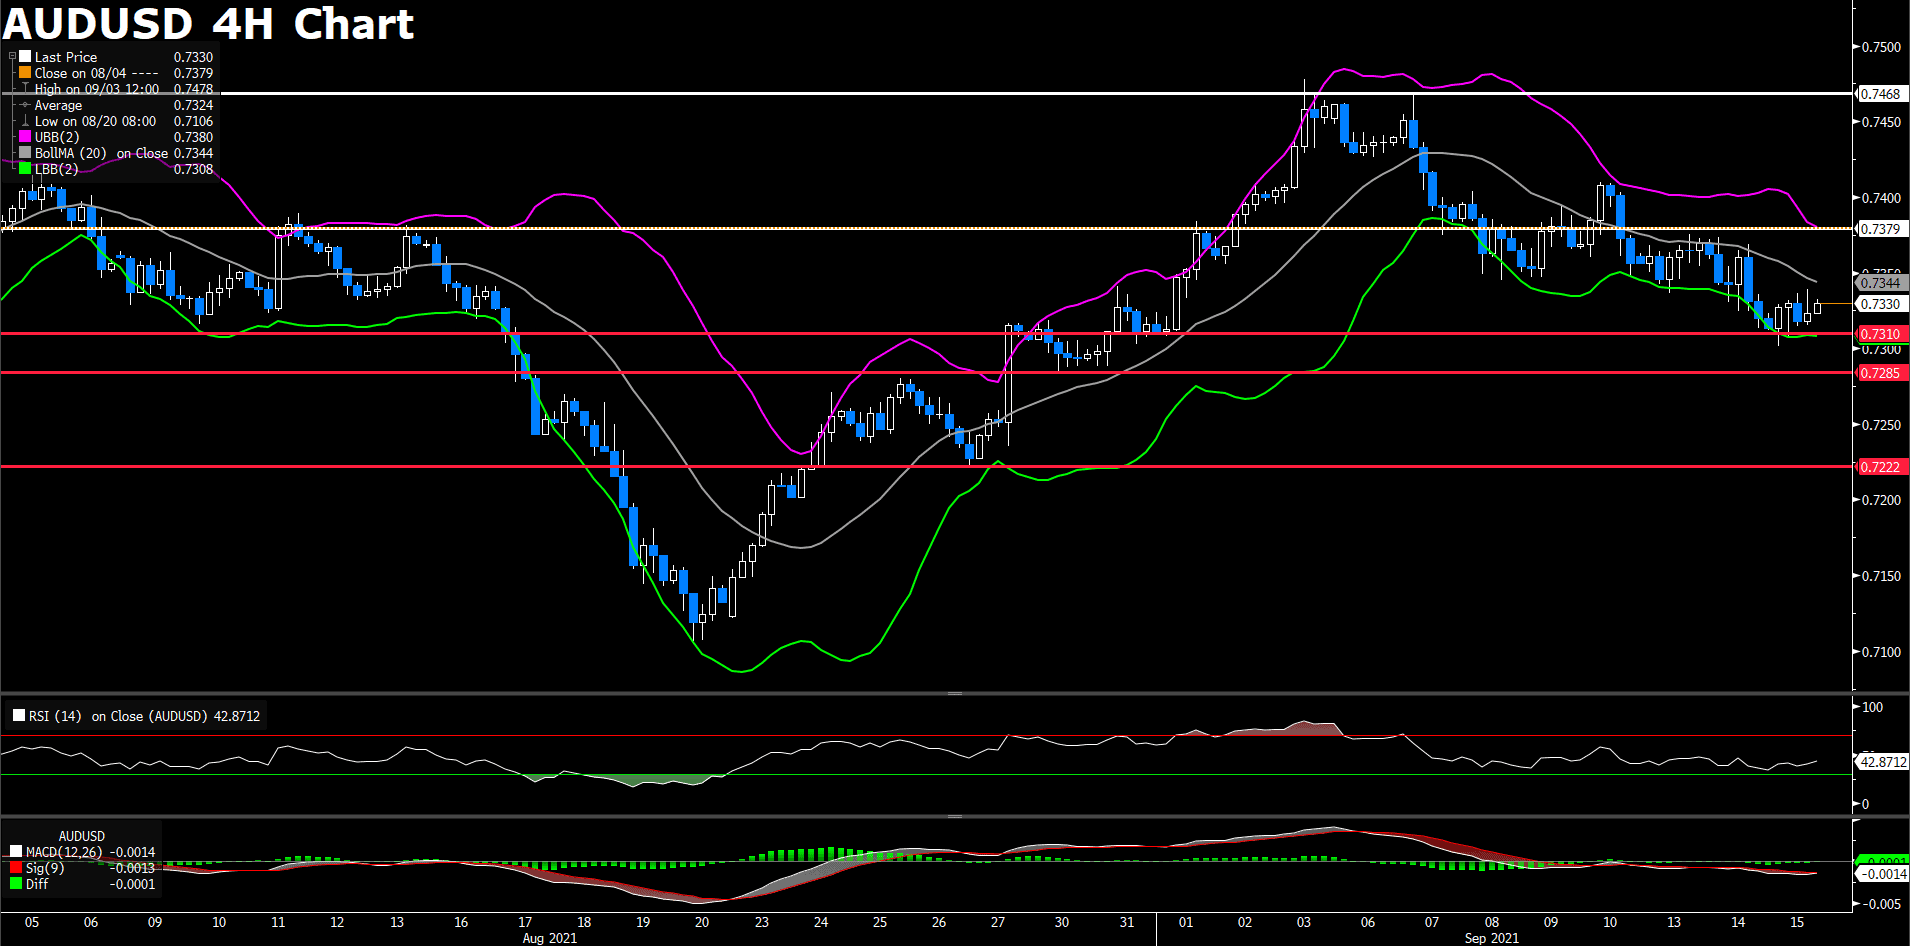
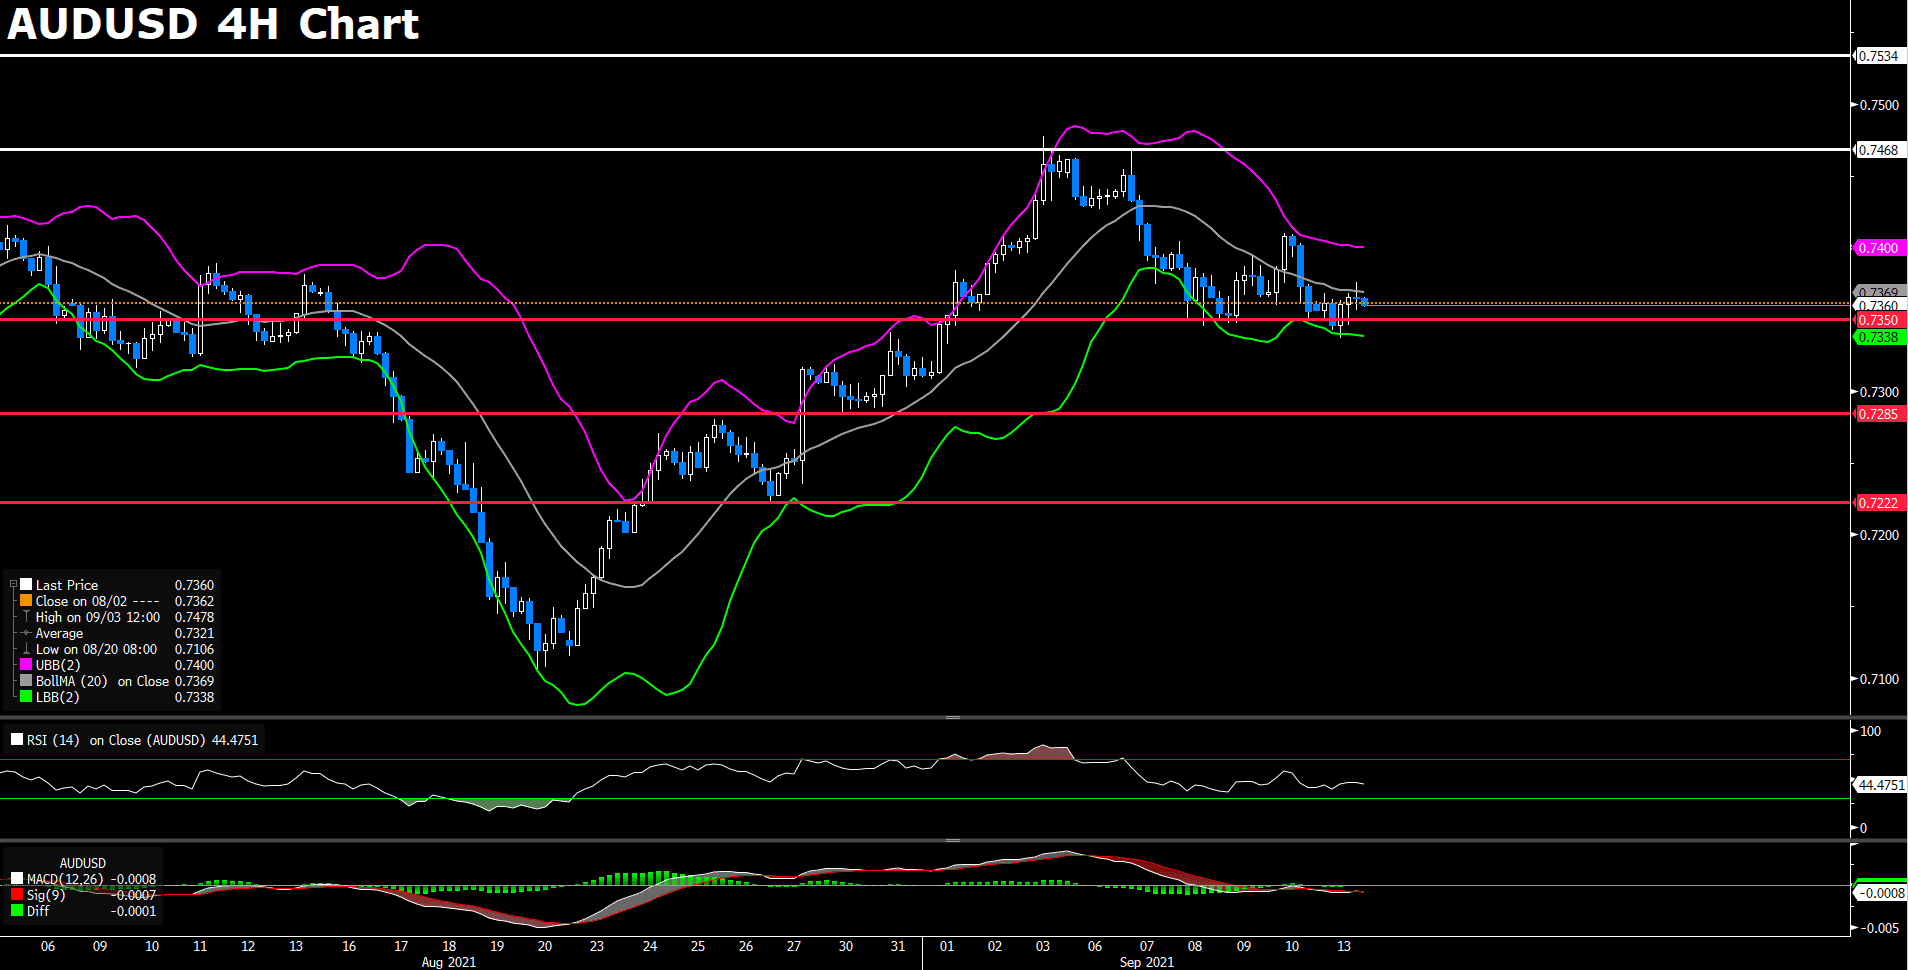
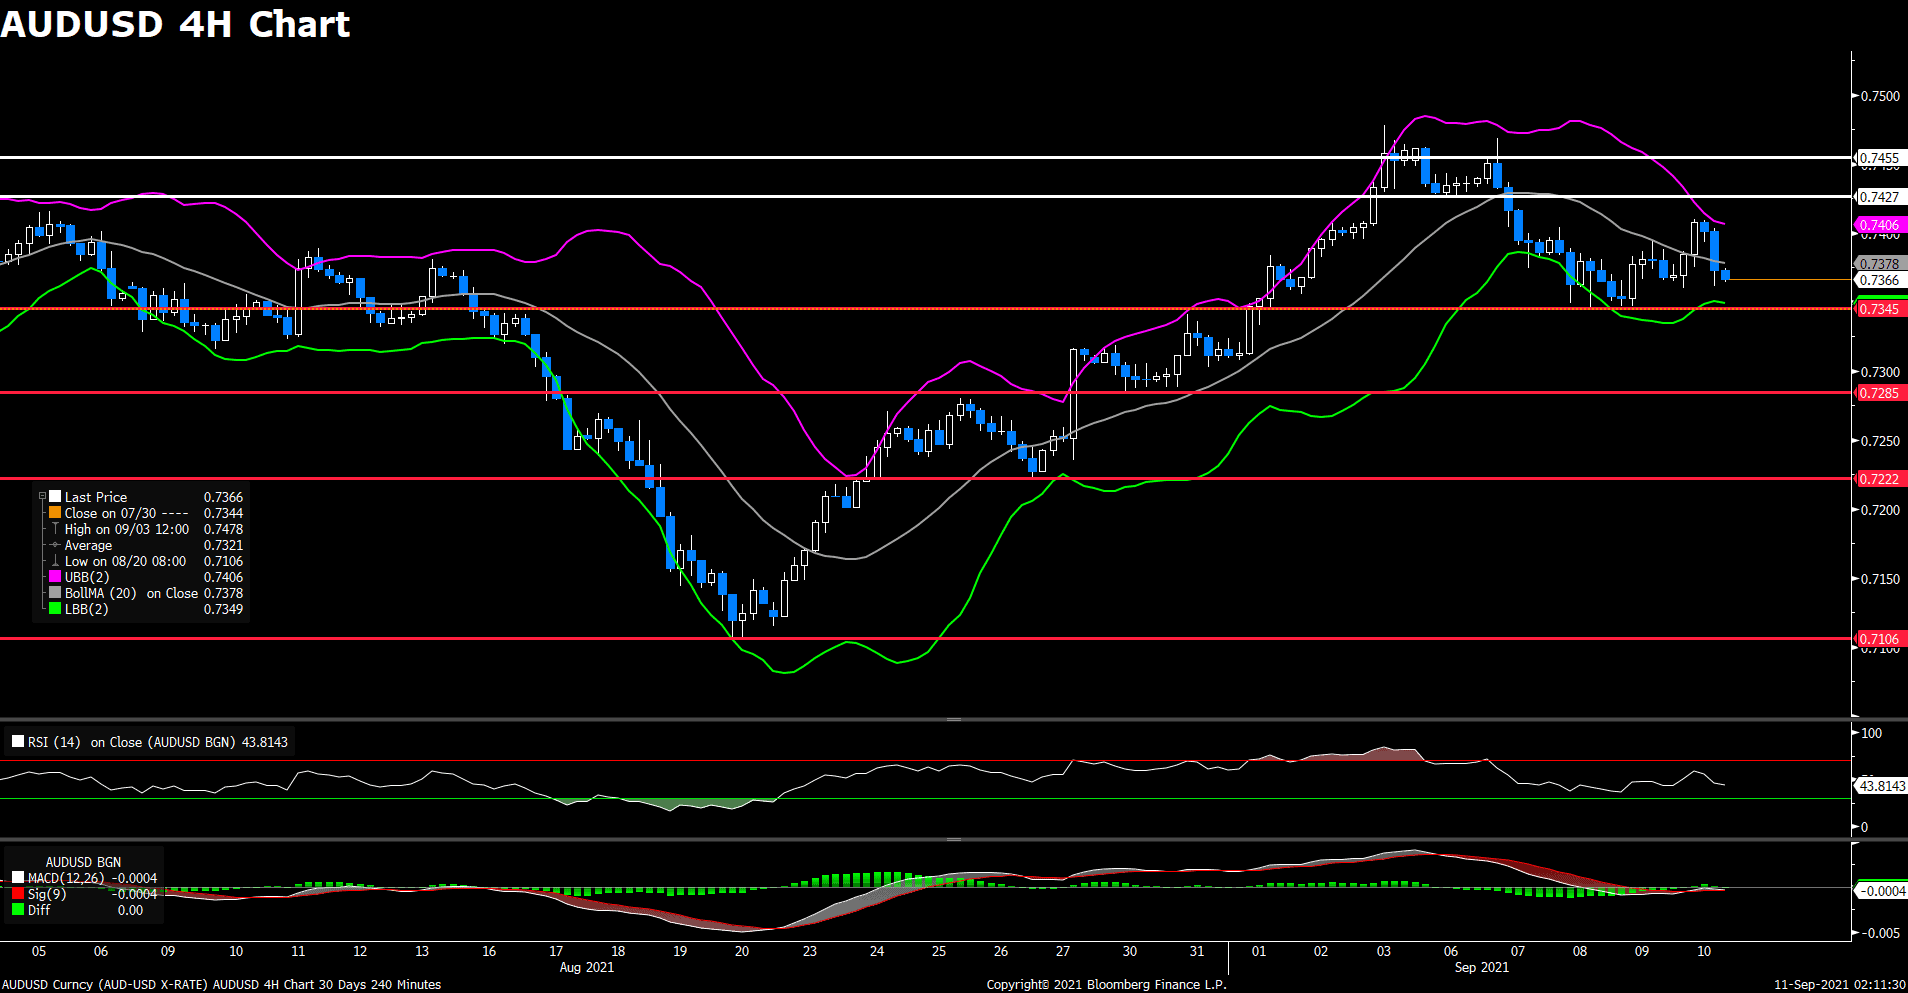
AUD/USD suffered as investors rushed to the safe haven dollar as market sentiment sours. AUD/USD declined, as much as 0.7%, during the early hours of trading. The pair broke through our previously estimated support of 0.7285 and continued trading lower before finding support around our estimated level of support at around 0.7222. The RBA meeting, scheduled for Tuesday, will shed more light on the Australian central bank’s monetary policy direction. Having already scaled back its monthly bond buying measures, the RBA is expected to remain dovish. The credit issue in China could also have spilling over effects on the Aussie dollar, as China is one of the largest exporting country for Australia.
From the technical aspect, AUD/USD has fallen below the 0.7285 support level but has found support around 0.7222; however, if the pair continues to trade lower, the pair will not find support until around the 0.711 price level. RSI for the pair sits at 40.42, indicating a rather neutral buying sentiment. AUD/USD is trading below the 50, 100, and 200 day SMA.
Resistance: 0.7379, 0.7468
Support: 0.7222, 0.7117
Economic Data
|
Currency |
Data |
Time (GMT + 8) |
Forecast |
||||
|
AUD |
RBA Meeting Minutes |
09:30 |
– |
||||
|
USD |
Housing Starts (Aug) |
20:30 |
1.555M |
||||