Daily Market Analysis
Market Focus
The stock-market euphoria abated in the last trading day of August as investors assessed whether lofty valuations could withstand the unwinding of pandemic-era stimulus. S&P 500 dropped from an all-time high, Nasdaq slid 0.04%, and Dow Jones declined 0.11%. Wells Fargo & Co. (NYSE: WFC) tumbled after news reported that the bank risks regulatory action over the pace of restitution. Traders also sifted through data showing a slide in U.S. consumer confidence and a surge in home prices.
Five years into scandals that have already cost Wells Fargo & Co. more than $5 billion in fines and legal settlements, regulators are privately signaling they’re still not satisfied with the bank’s progress in compensating victims and shoring up controls.
The Office of the Comptroller of the Currency and the Consumer Financial Protection Bureau have warned the firm they may bring new sanctions over the company’s pace in fulfilling those obligations, according to people with knowledge of the situation. The bank, which signed so-called consent orders with the agencies three years ago, has sought more time to get the work done, the people said. It isn’t clear when the watchdogs might proceed.
The bank’s stock erased earlier gains and slumped 5.6% in regular New York trading on Tuesday, its biggest drop since mid-June, after Bloomberg reported on regulators’ concerns.
Fresh sanctions would be especially notable if they fault progress under Wells Fargo’s new management team, which took over in late 2019 to clean up scandals that triggered lawmakers’ ire and prompted the Federal Reserve to cap the bank’s growth. Chief Executive Officer Charlie Scharf — who joined the firm after a string of predecessors stepped down — has called satisfying U.S. authorities his highest priority.

Main Pairs Movement:
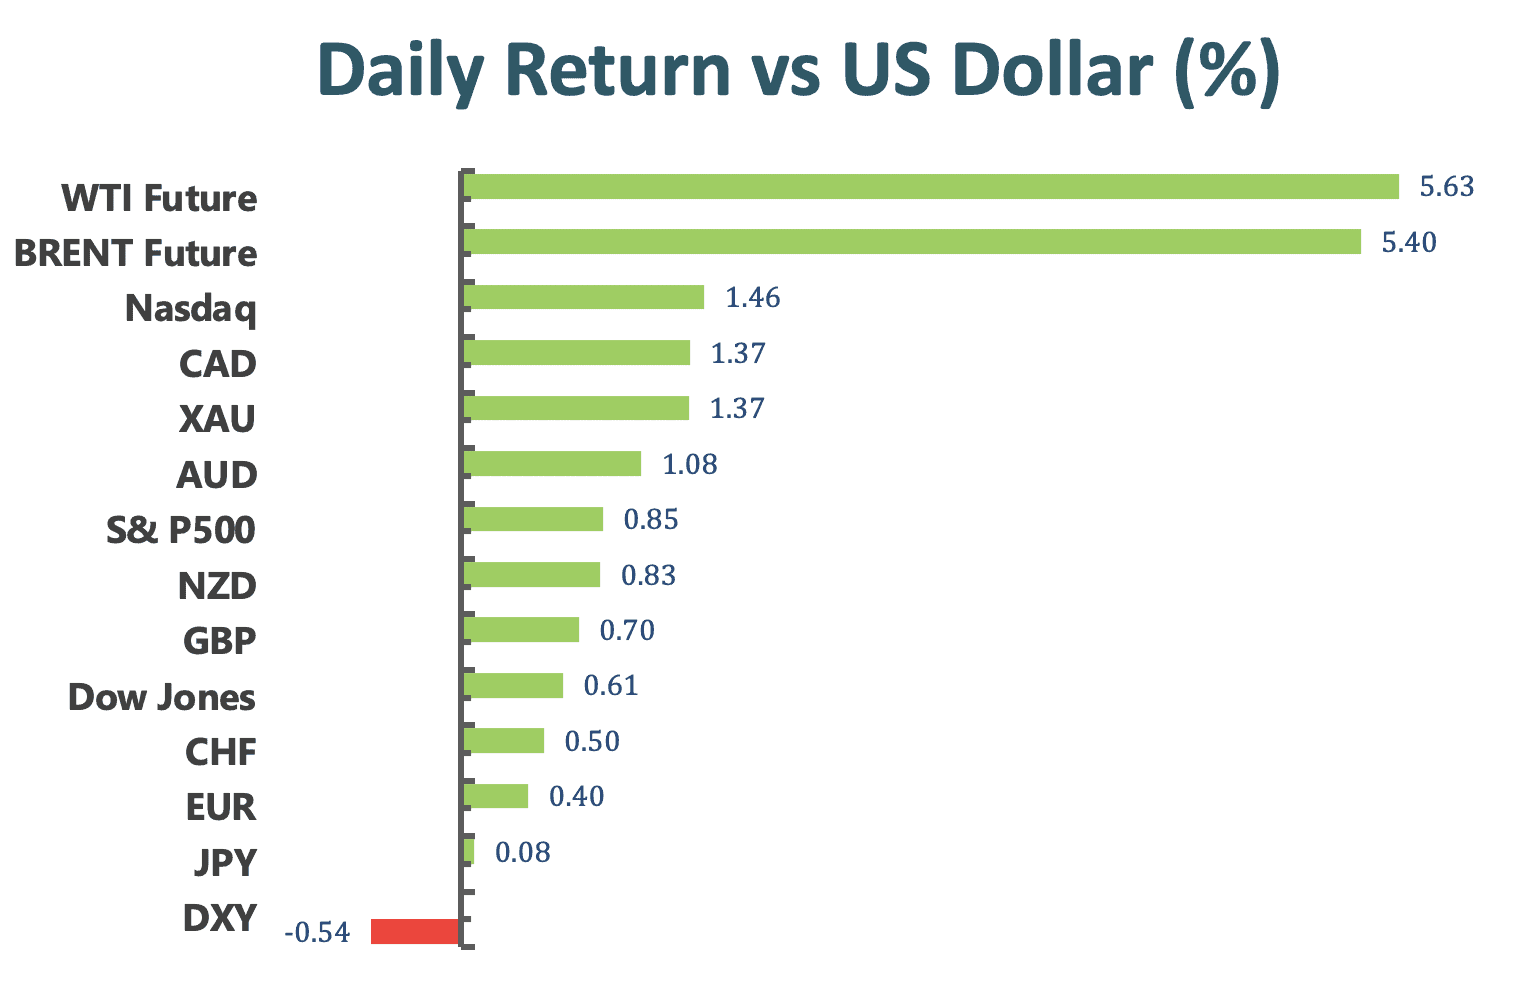
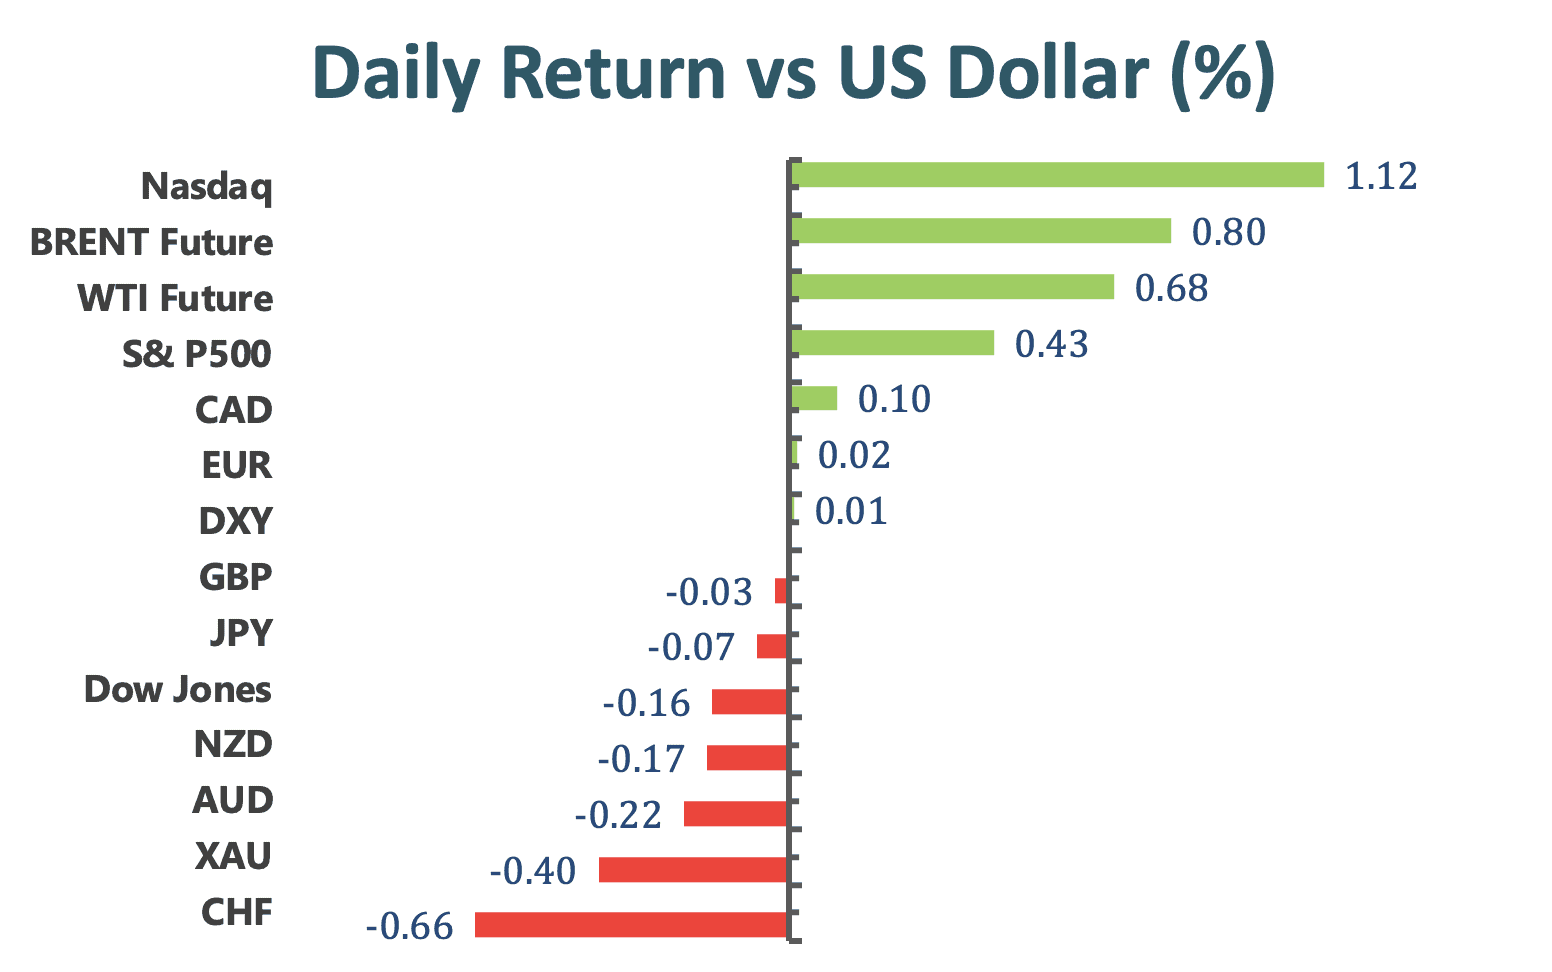
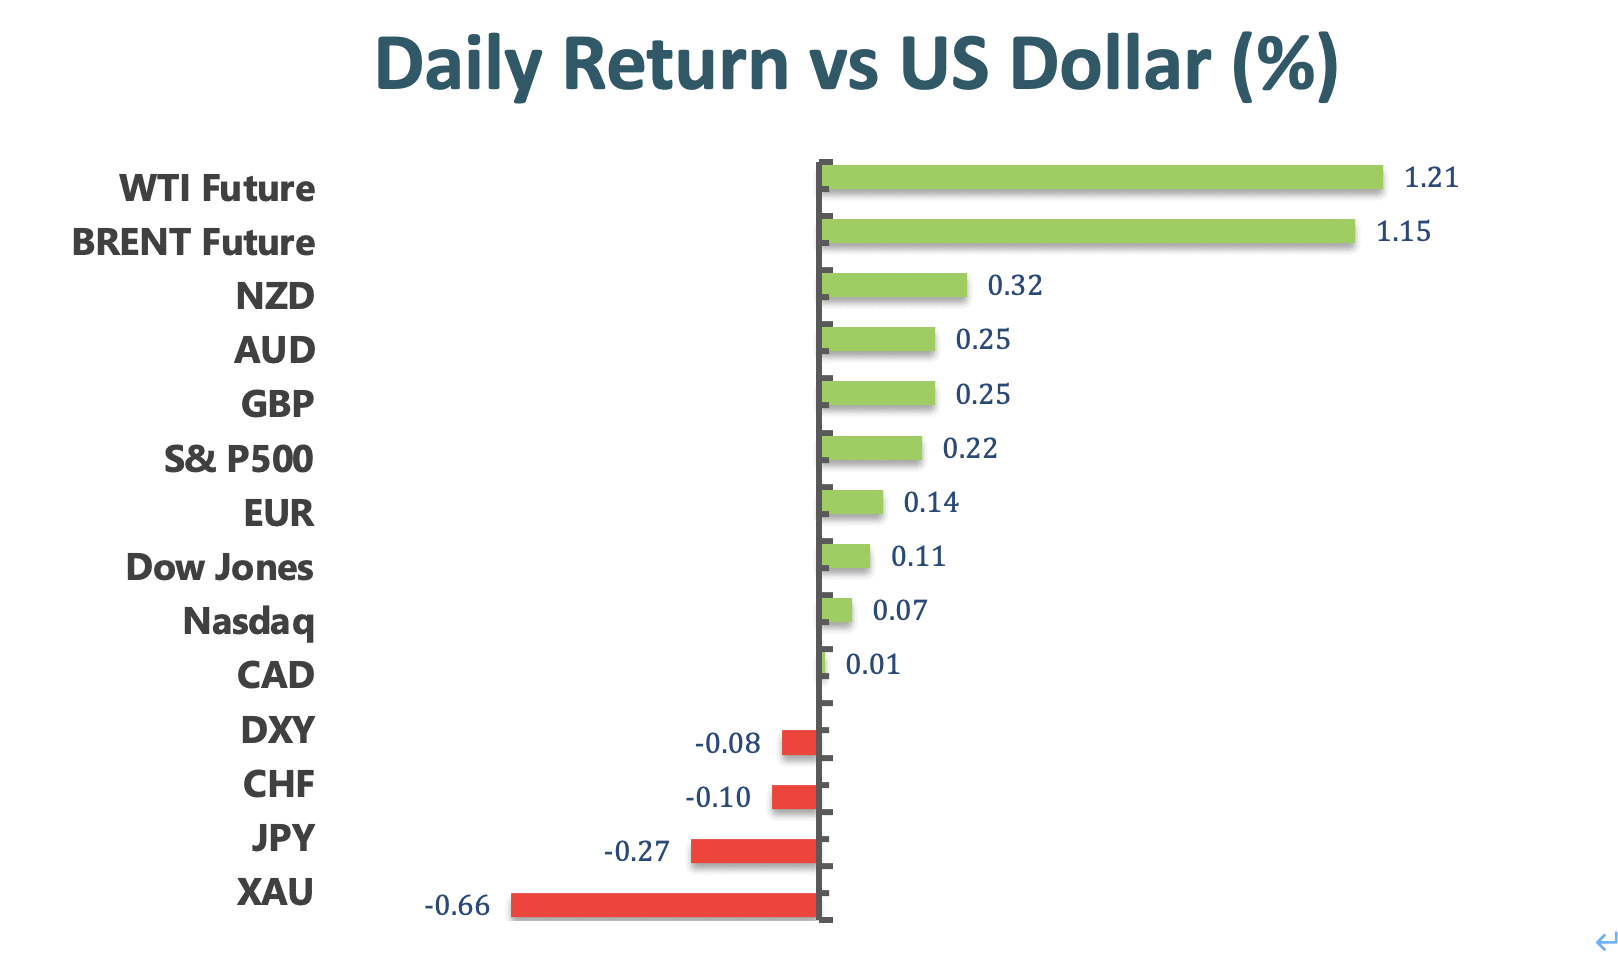
Despite trying to bounce back during American session, the US dollar edged lower on Tuesday and once dropped to a three-week low. The DXY index is at 92.672 as of writing, losing 0.02% on a daily basis. The Conference Board’s Consumer Confidence showed a disappointing outcome as it declined to 113.8 in August, which is lower than market’s expectation of 124.0. Investor now wait for the US Nonfarm Payrolls this Friday, which reflects the recovery condition of US economy.
EUR/USD and AUD/USD both advanced on Tuesday amid weaker US dollar across the board, trading at 1.1806 and 0.7312, respectively. EUR/USD recorded a three-week high during European trading hours, climbing above the 1.1840 level for a time. But the pair then retreated modestly back, posting a 0.09% gain on the day. The Eurozone Core CPI YoY showed a remarkable reading of 1.6%, which provided bullish momentum for the EUR/USD pair.
USD/JPY also rose today, climbing above the 110 level during American session. The pair is trading at 110.03 and posted a 0.1% gain on the day as of writing.
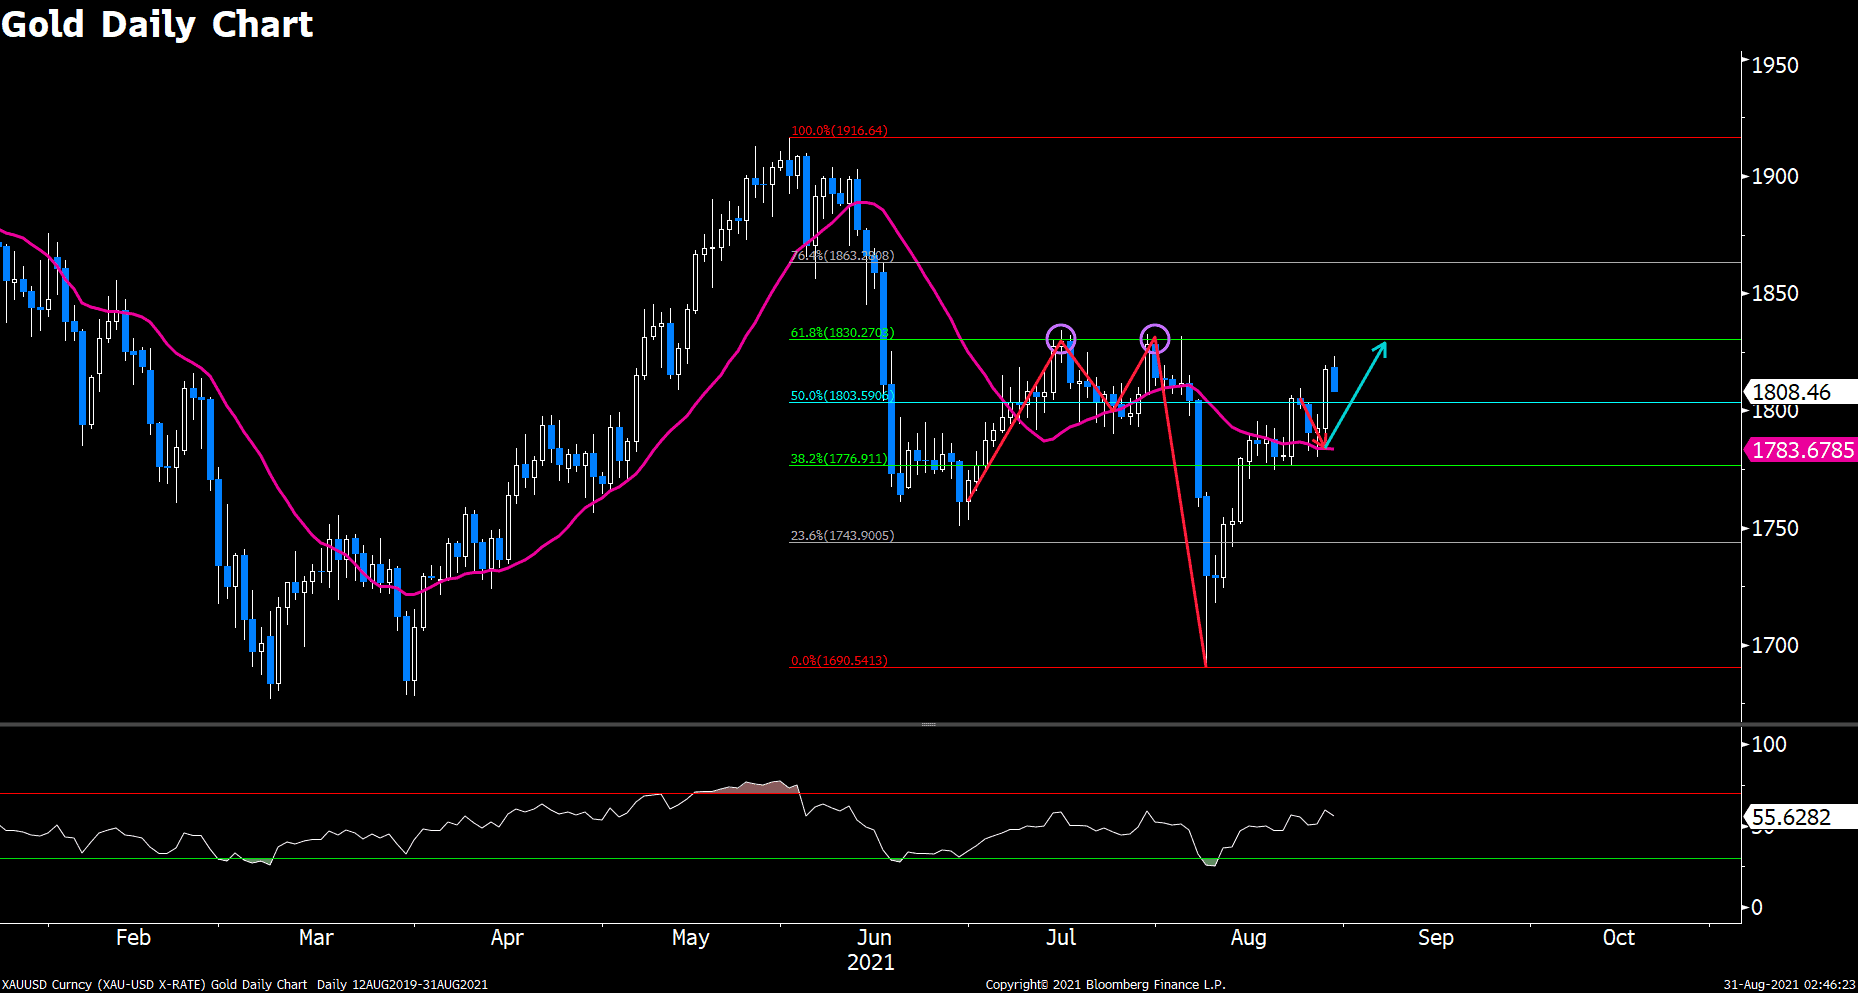
Gold posted a decent gain on Tuesday, as it rebounded strongly from daily low during American session. The decline witnessed in European trading hours might be a correction of last week’s rally. The precious metal is now trading at 1814.51, rising 0.28% on a daily basis. WTI Crude Oil, on the contrary, slumped more than 0.84% on Tuesday.
Technical Analysis:
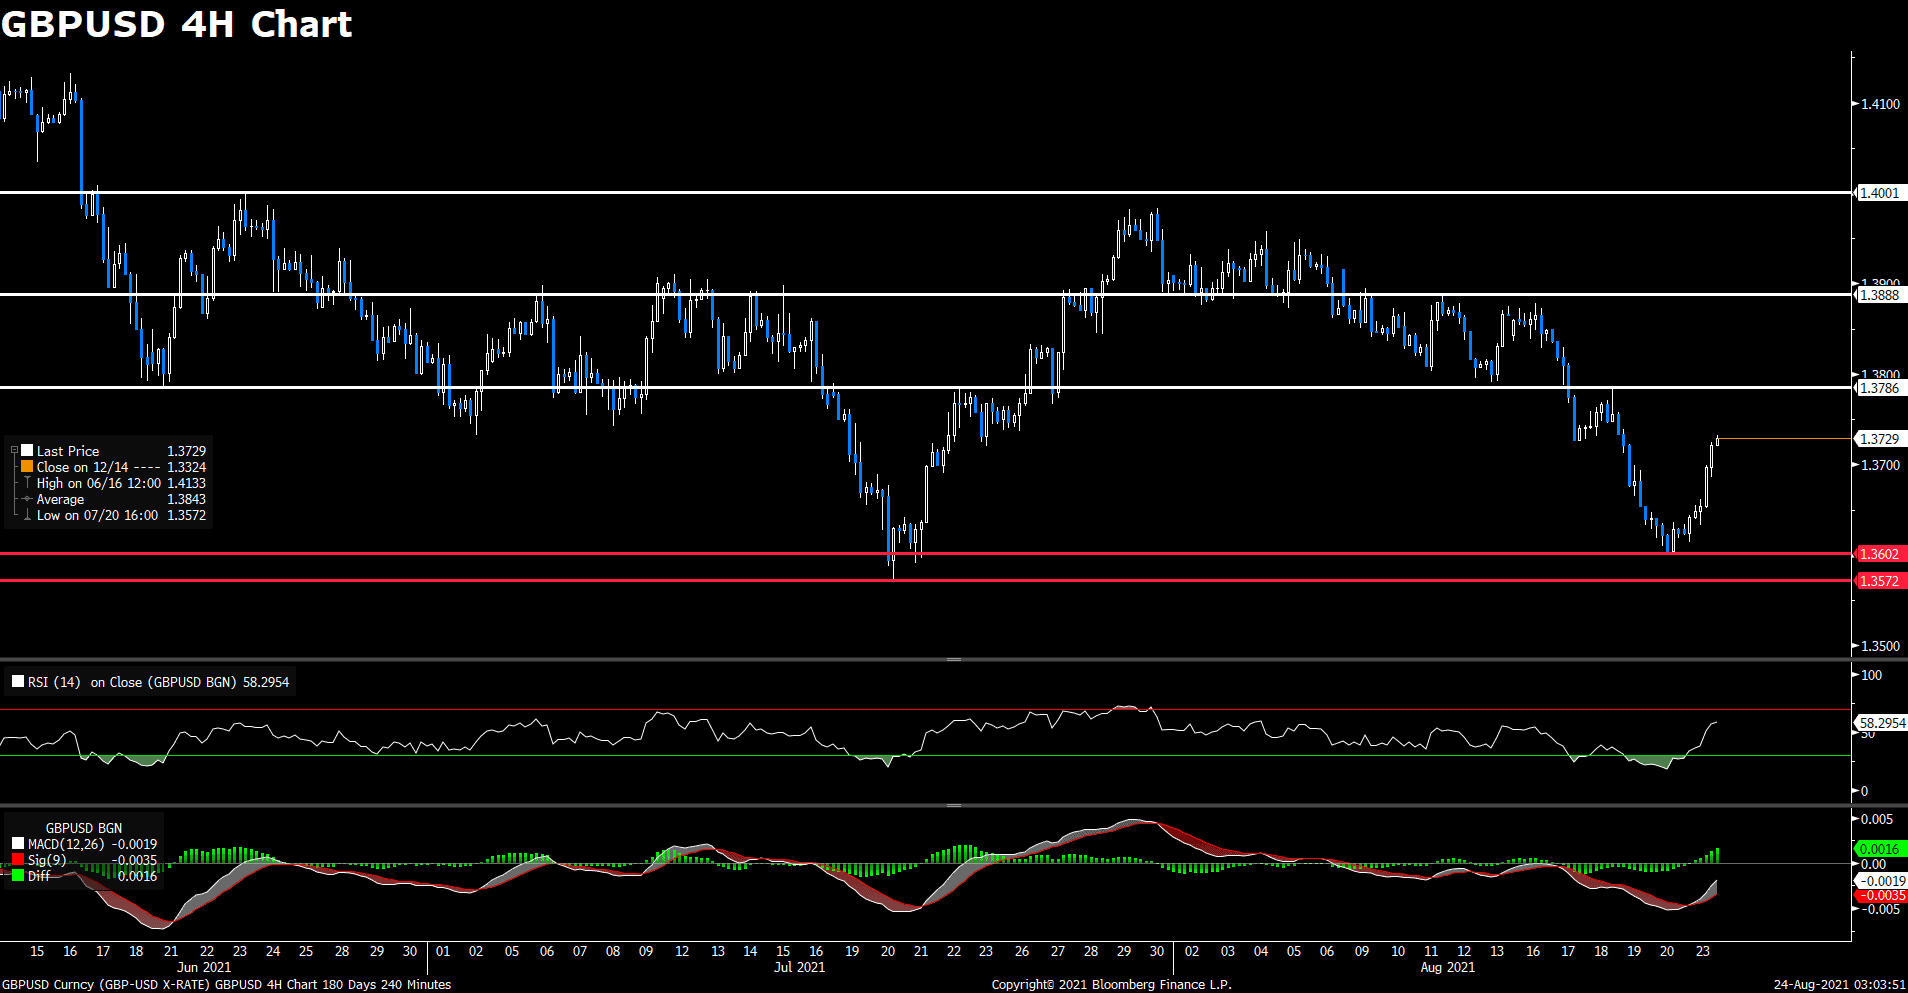
GBPUSD (4-hour Chart)
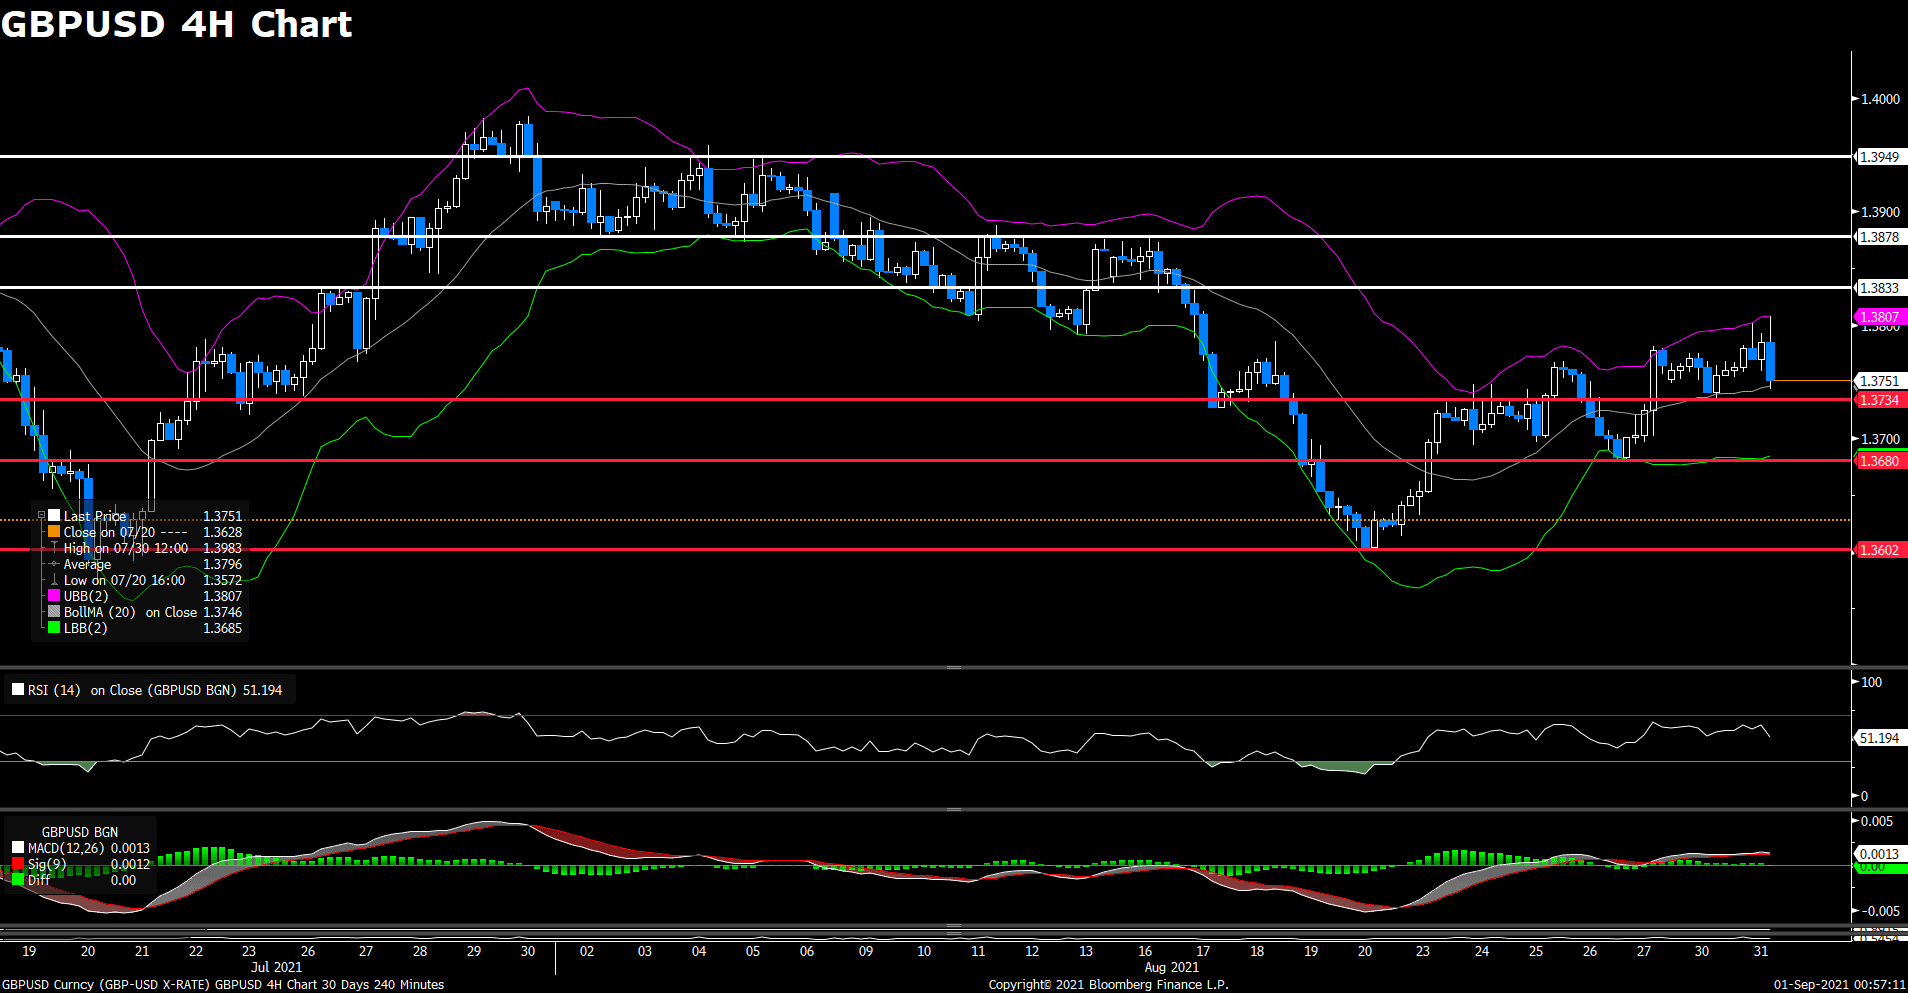
The GBP/USD pair was trading higher on Tuesday, rising above the 1.3800 level. However, the bullish momentum didn’t last long as the pair pulled back during American session. The cable is losing 0.07% on the day at the time of writing. The bearish movement witnessed in GBP/USD is result from the raising demand of US dollar, as the greenback rebounded in the second half of the day. For technical aspect, RSI indicator 50 figures as of writing, suggesting no obvious trend now. But for Bollinger Bands, the price is falling from the upper band and crossing below the moving average, which indicates a selling signal and the lower band becomes the loss target.
In conclusion, we think market will be bearish as the pair heads to test the 1.3734 support. A break below that level will open the door for additional near-term losses. And the next support is at 1.3680. On top of that, UK Manufacturing PMI will be released on Wednesday, a higher-than-expected data should be taken as positive for the British Pound.
Resistance: 1.3833, 1.3878, 1.3949
Support: 1.3734, 1.3680, 1.3602
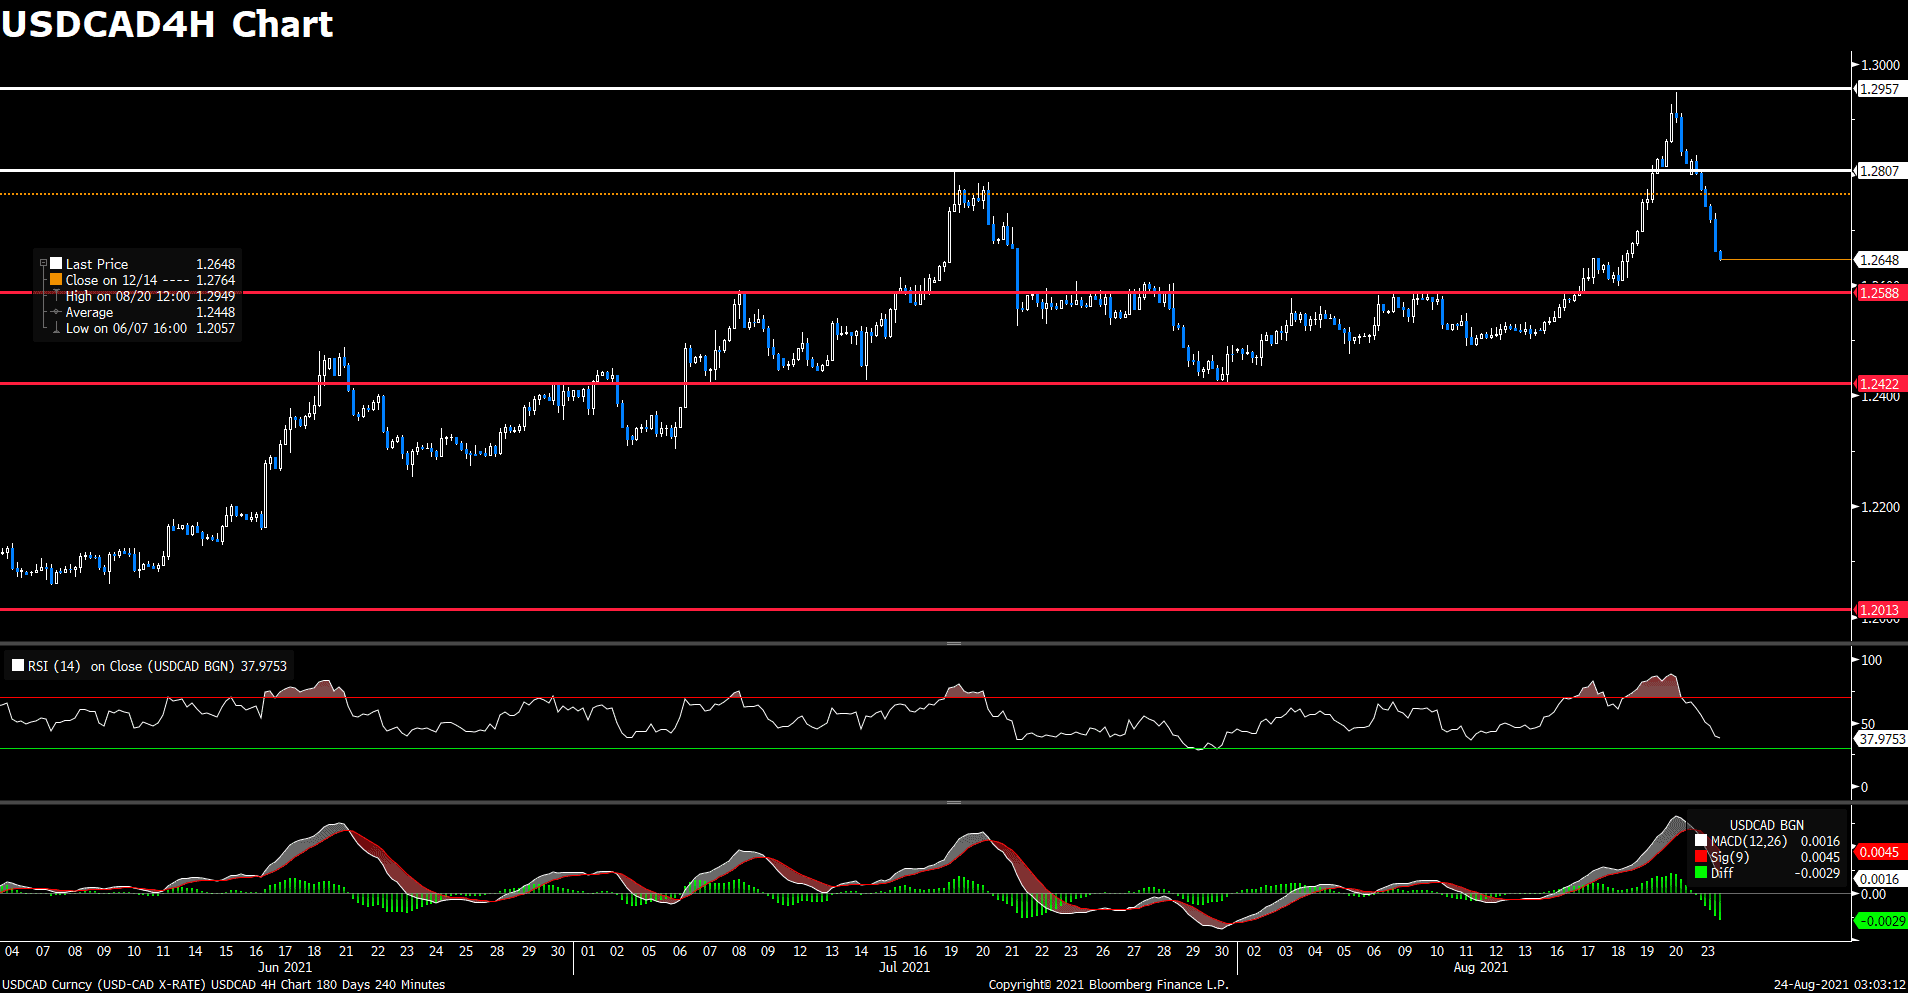
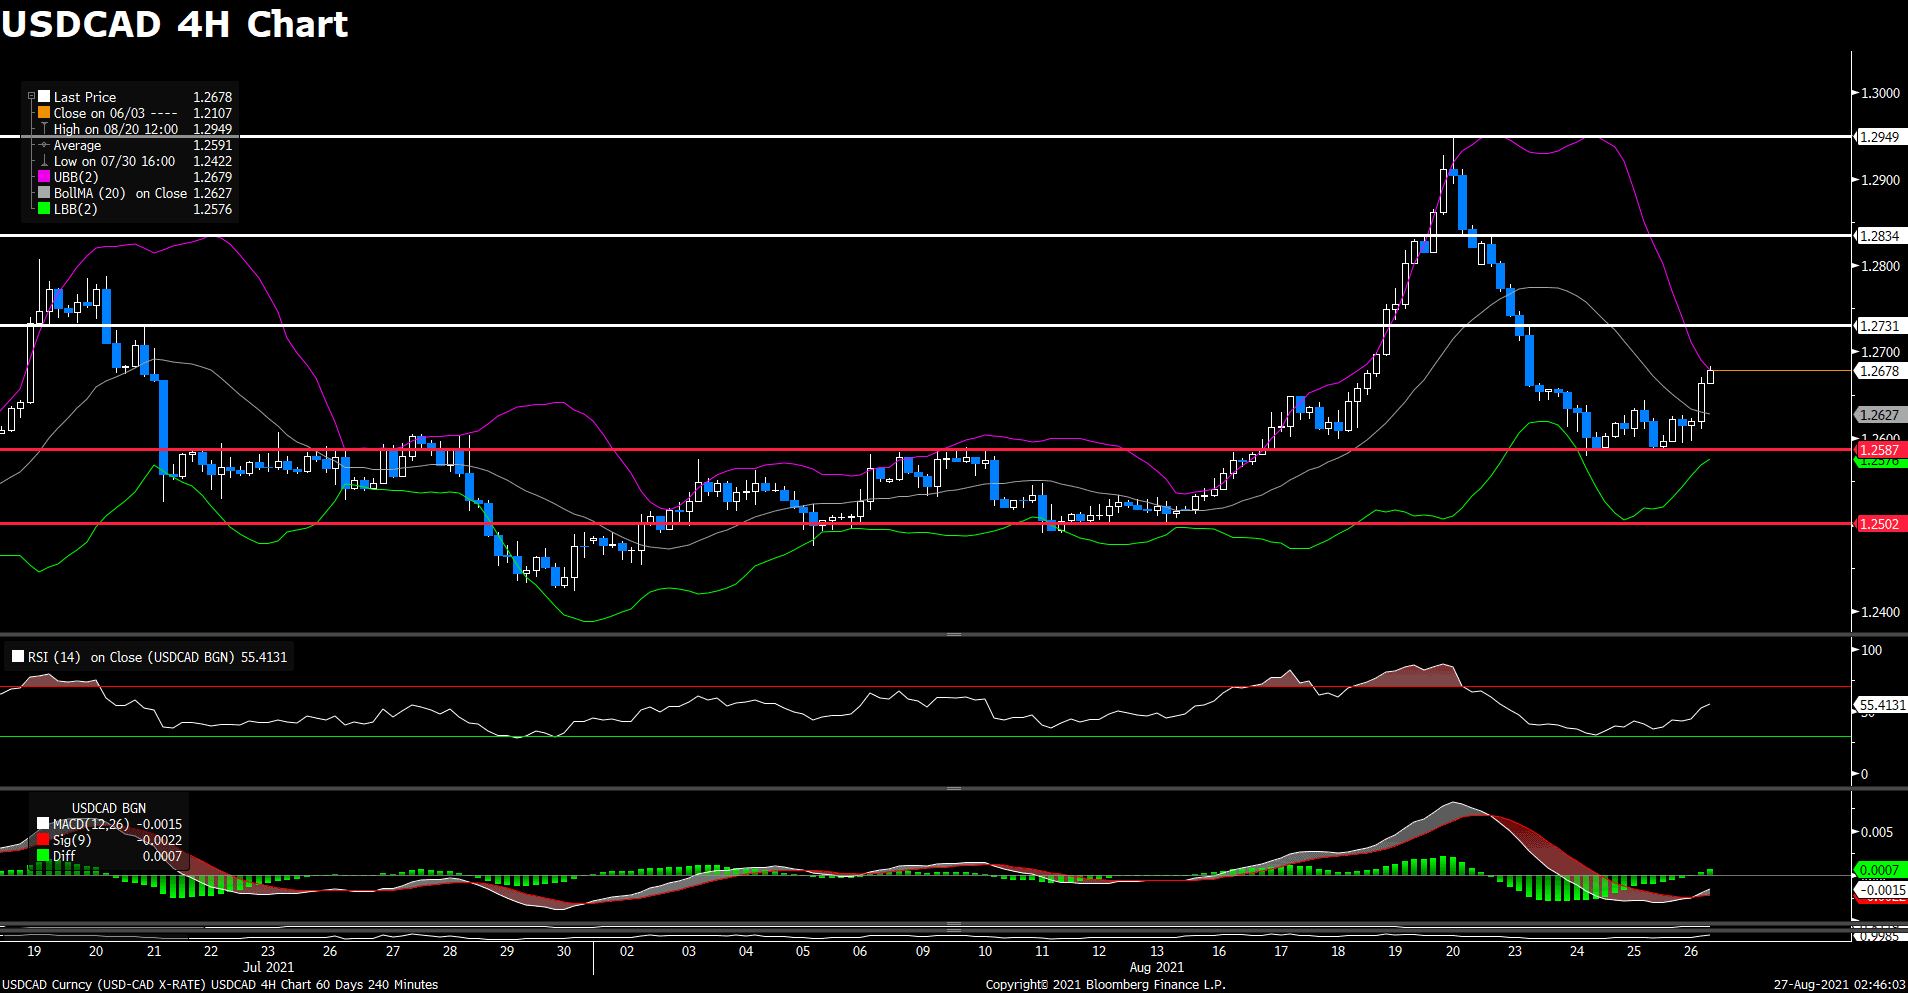
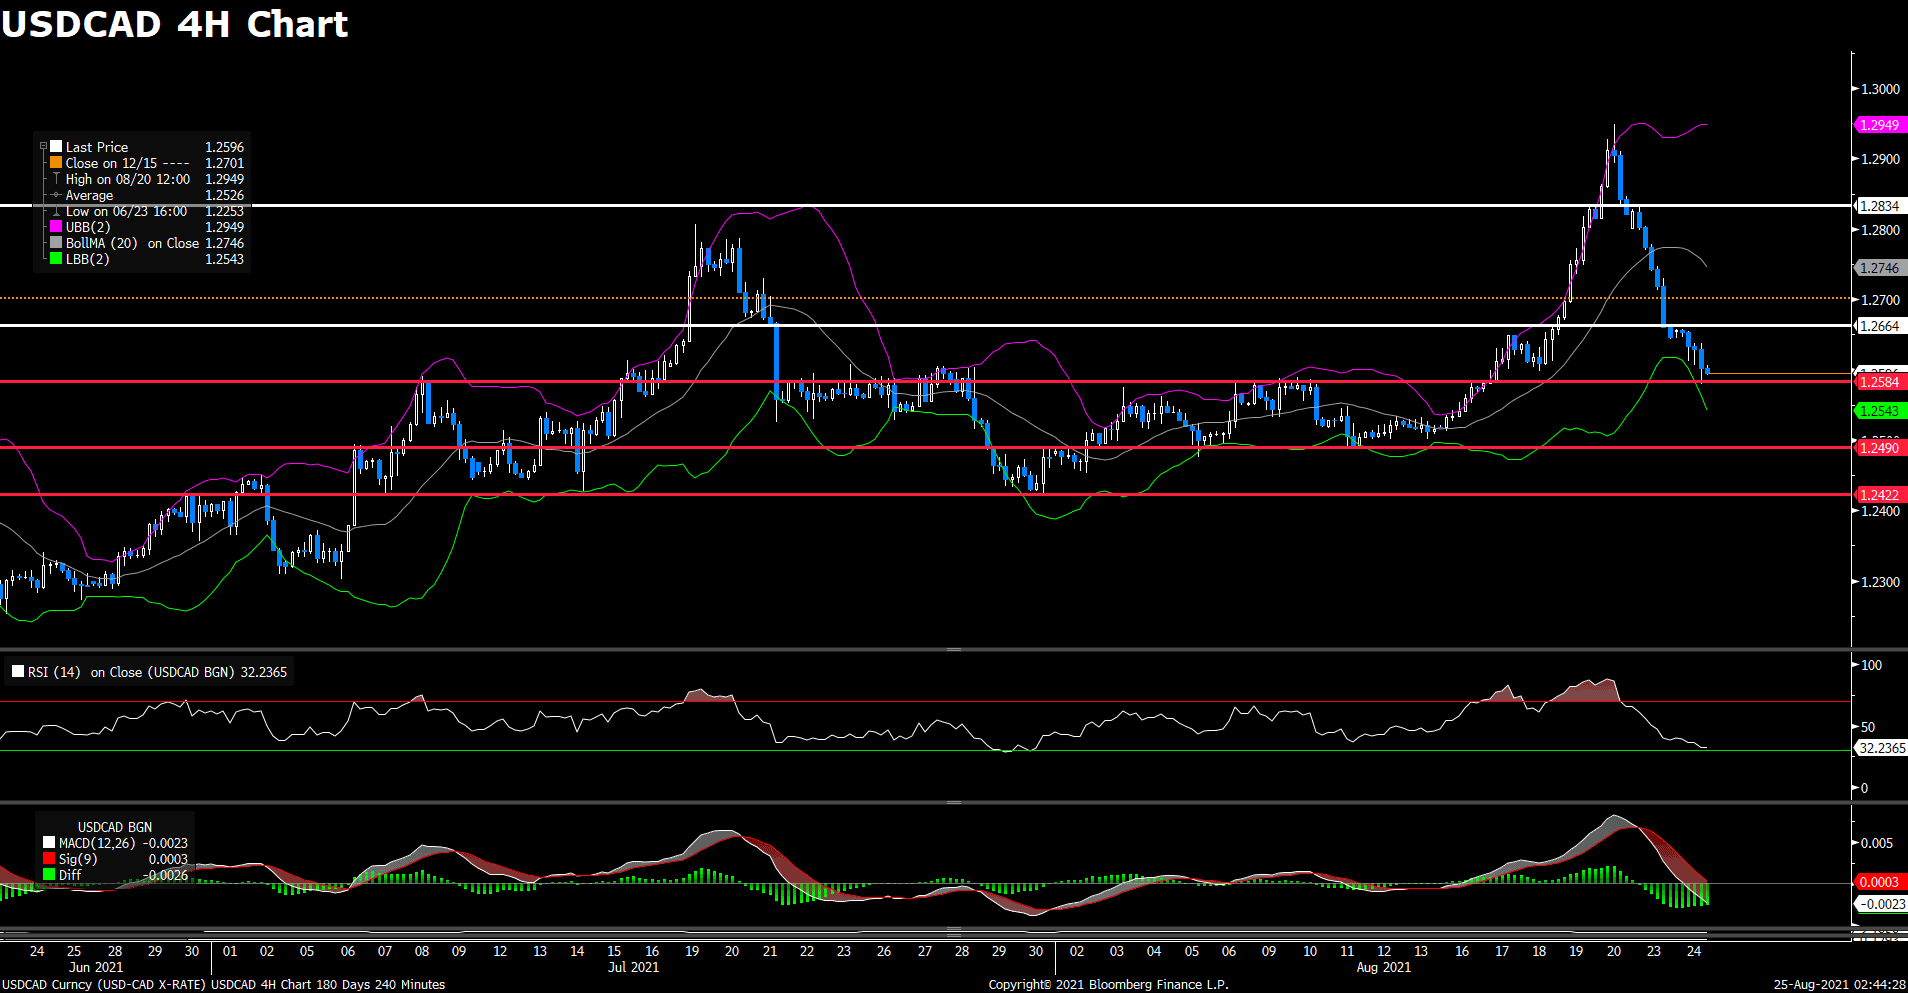
USDCAD (4- Hour Chart)
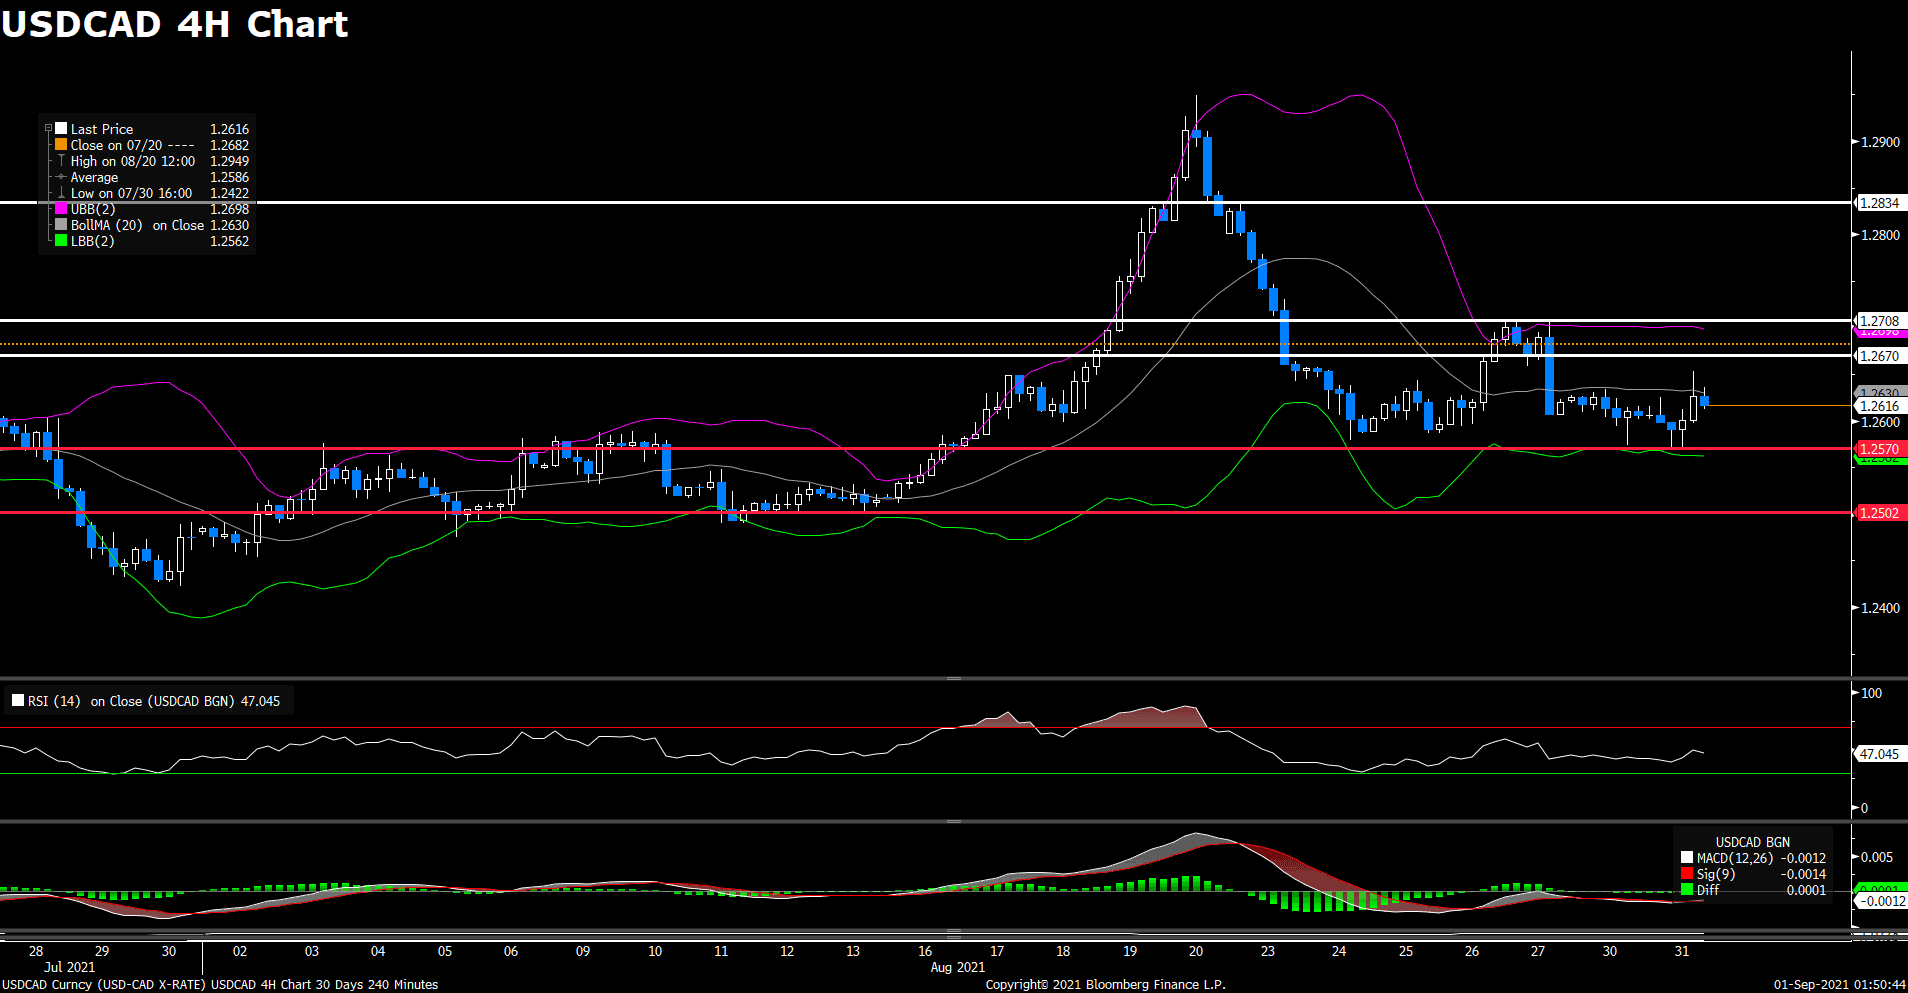
The USD/CAD pair advanced on Tuesday, touching a fresh two-day high during American session. The pair then retreated modestly back as of writing, posting a 0.19% gain on a daily basis. USD/CAD was lifted up by both disappointing GDP report in Canada and strong selling pressure surrounding the crude oil. These two reasons further weighed on the Canadian dollar. For technical aspect, RSI indicator 46 figures as of writing, suggesting selling pressure is slightly higher. If we take a look at MACD indicator, a near-zero Diff points out that the trend may reverse in the near future.
In conclusion, we think market will be bearish as the pair failed to break the 1.2670 resistance. The price is now falling from the 20 SMA line in the Bollinger Bands, which also indicates a selling signal. In addition to that, the EIA will released US Crude Oil Inventories on Wednesday and the commodity-linked loonie is likely to be affected.
Resistance: 1.2670, 1.2708, 1.2834
Support: 1.2570, 1.2502
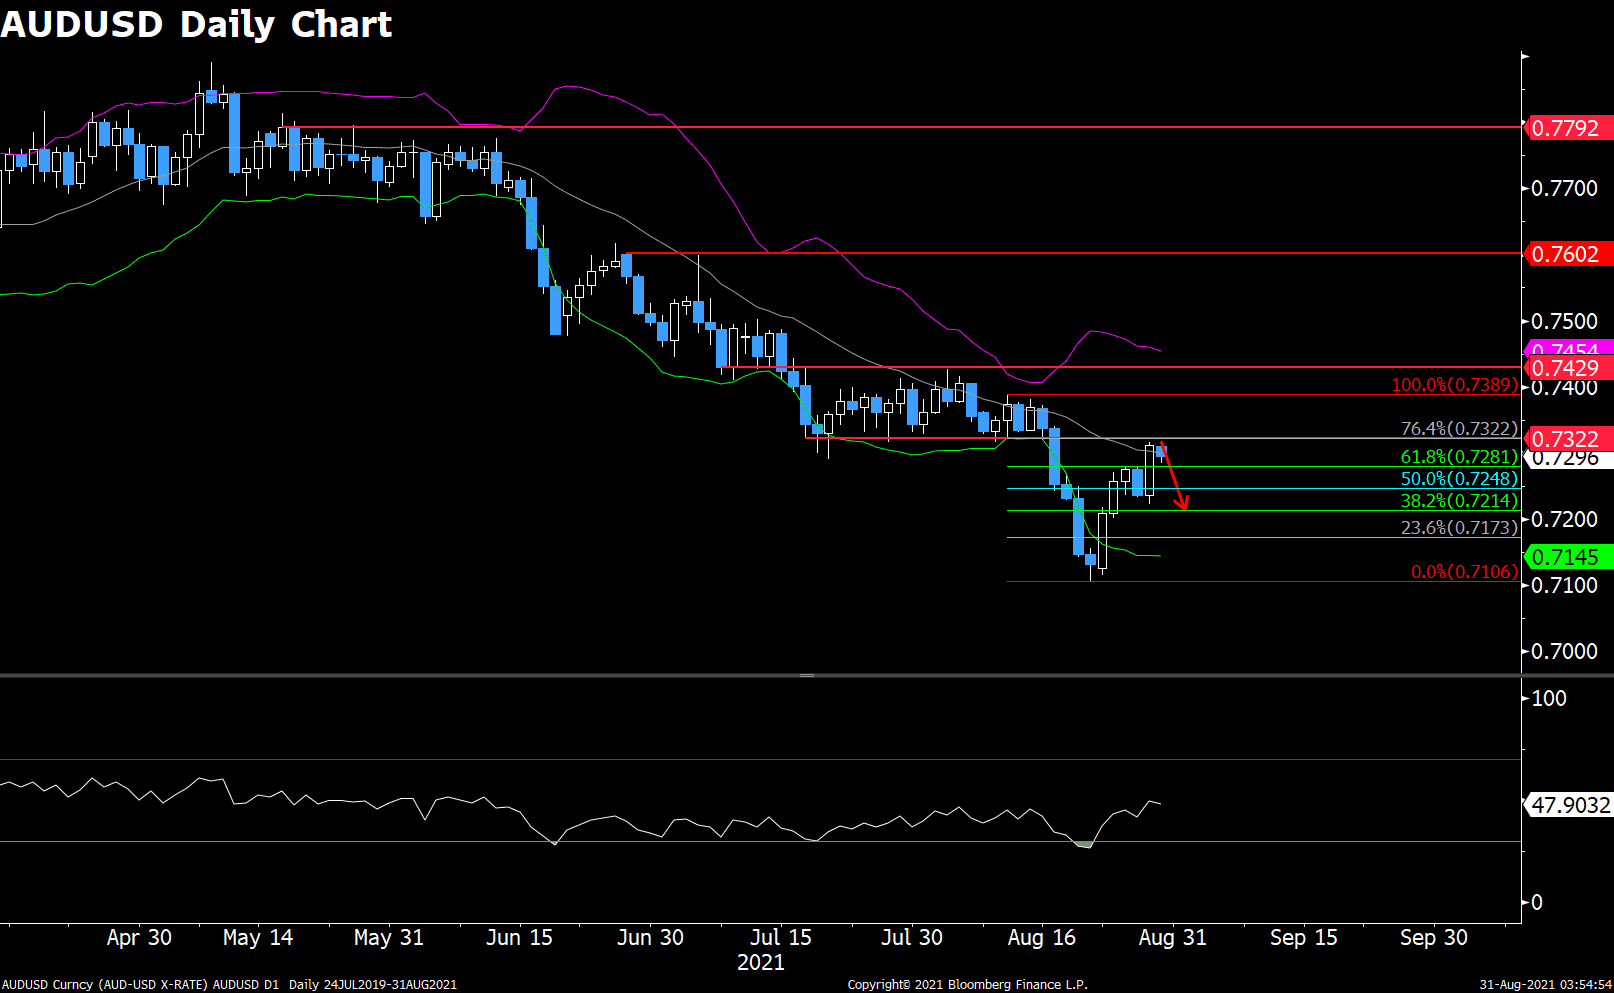
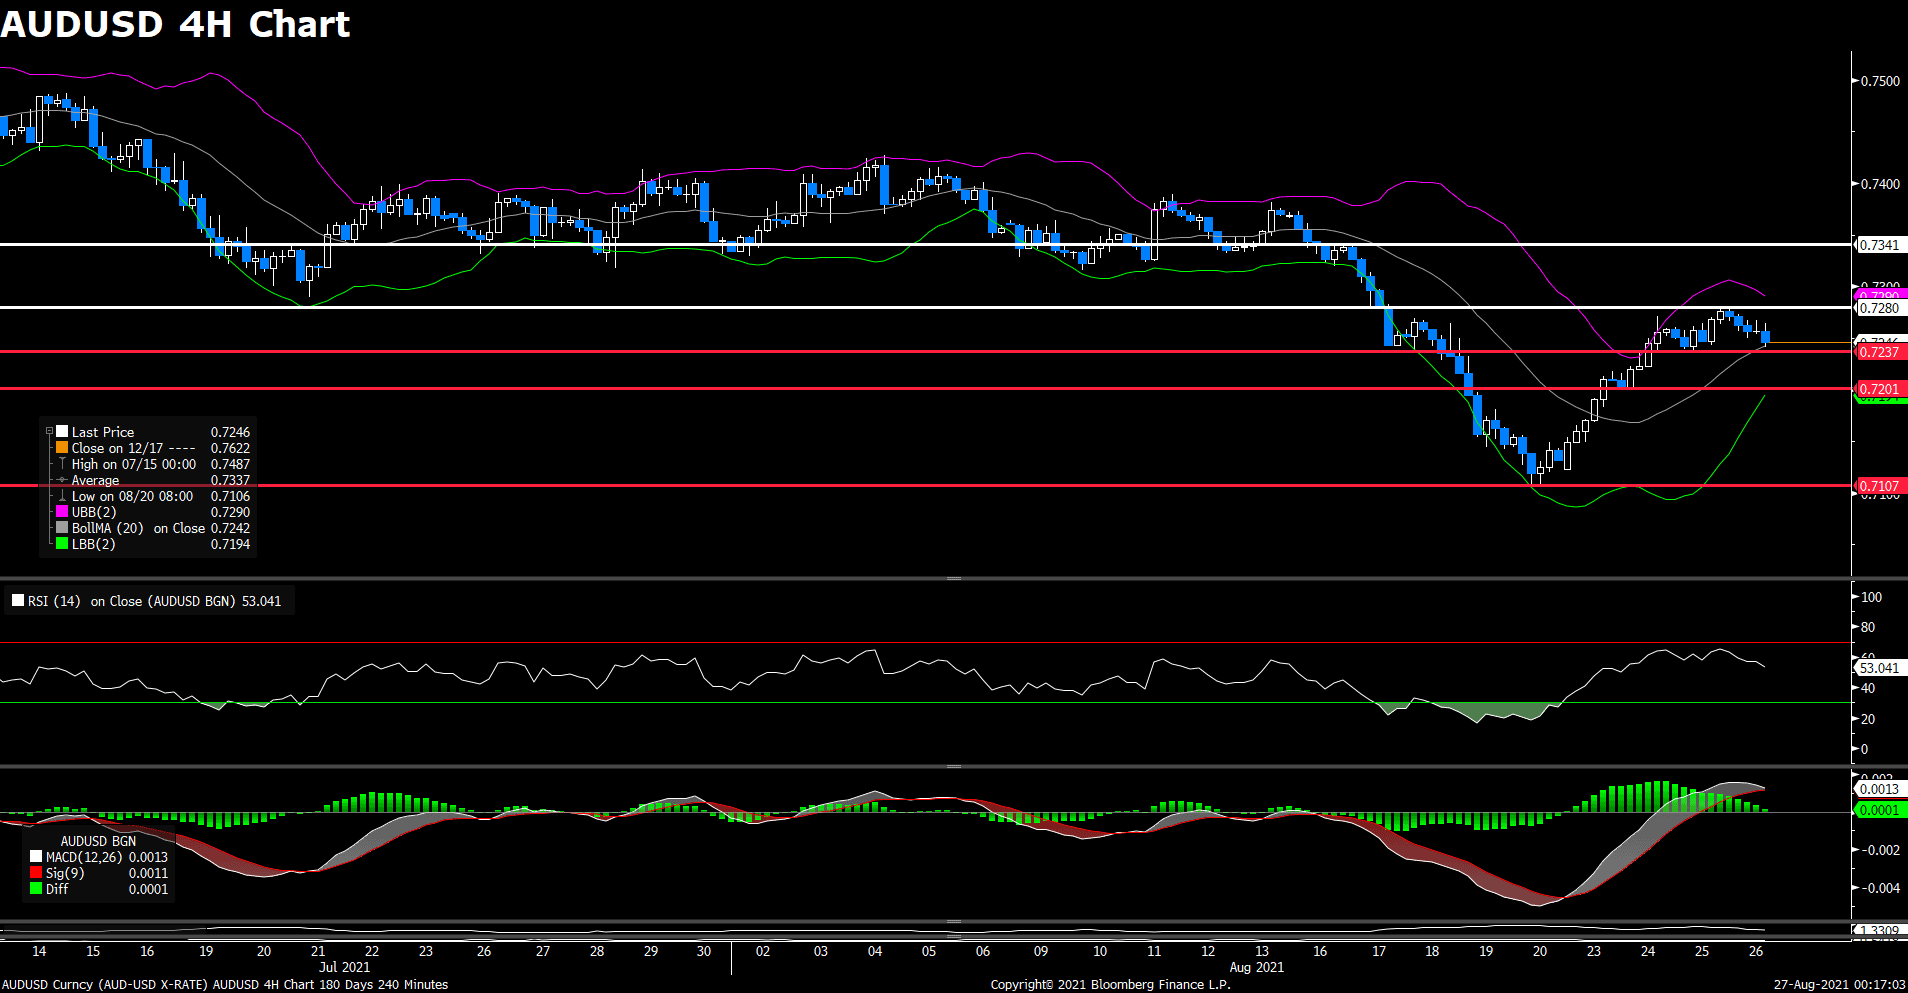
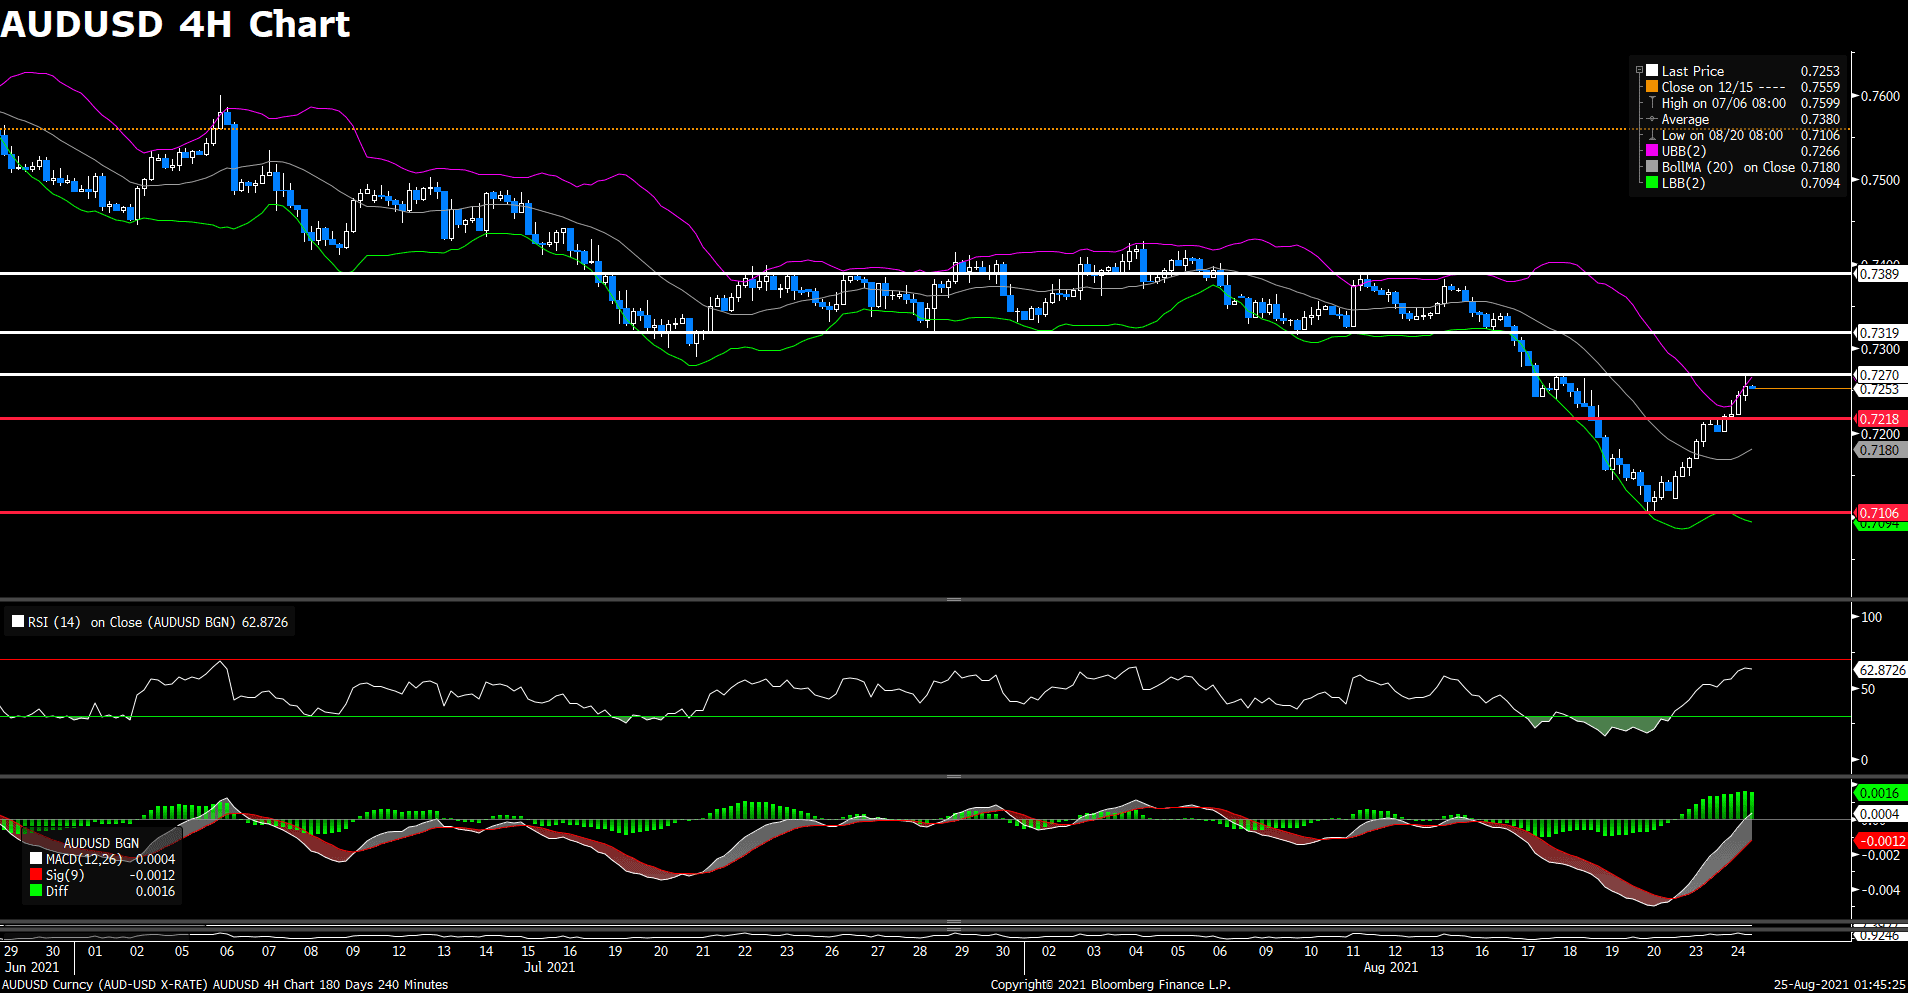
AUDUSD (4- Hour Chart)
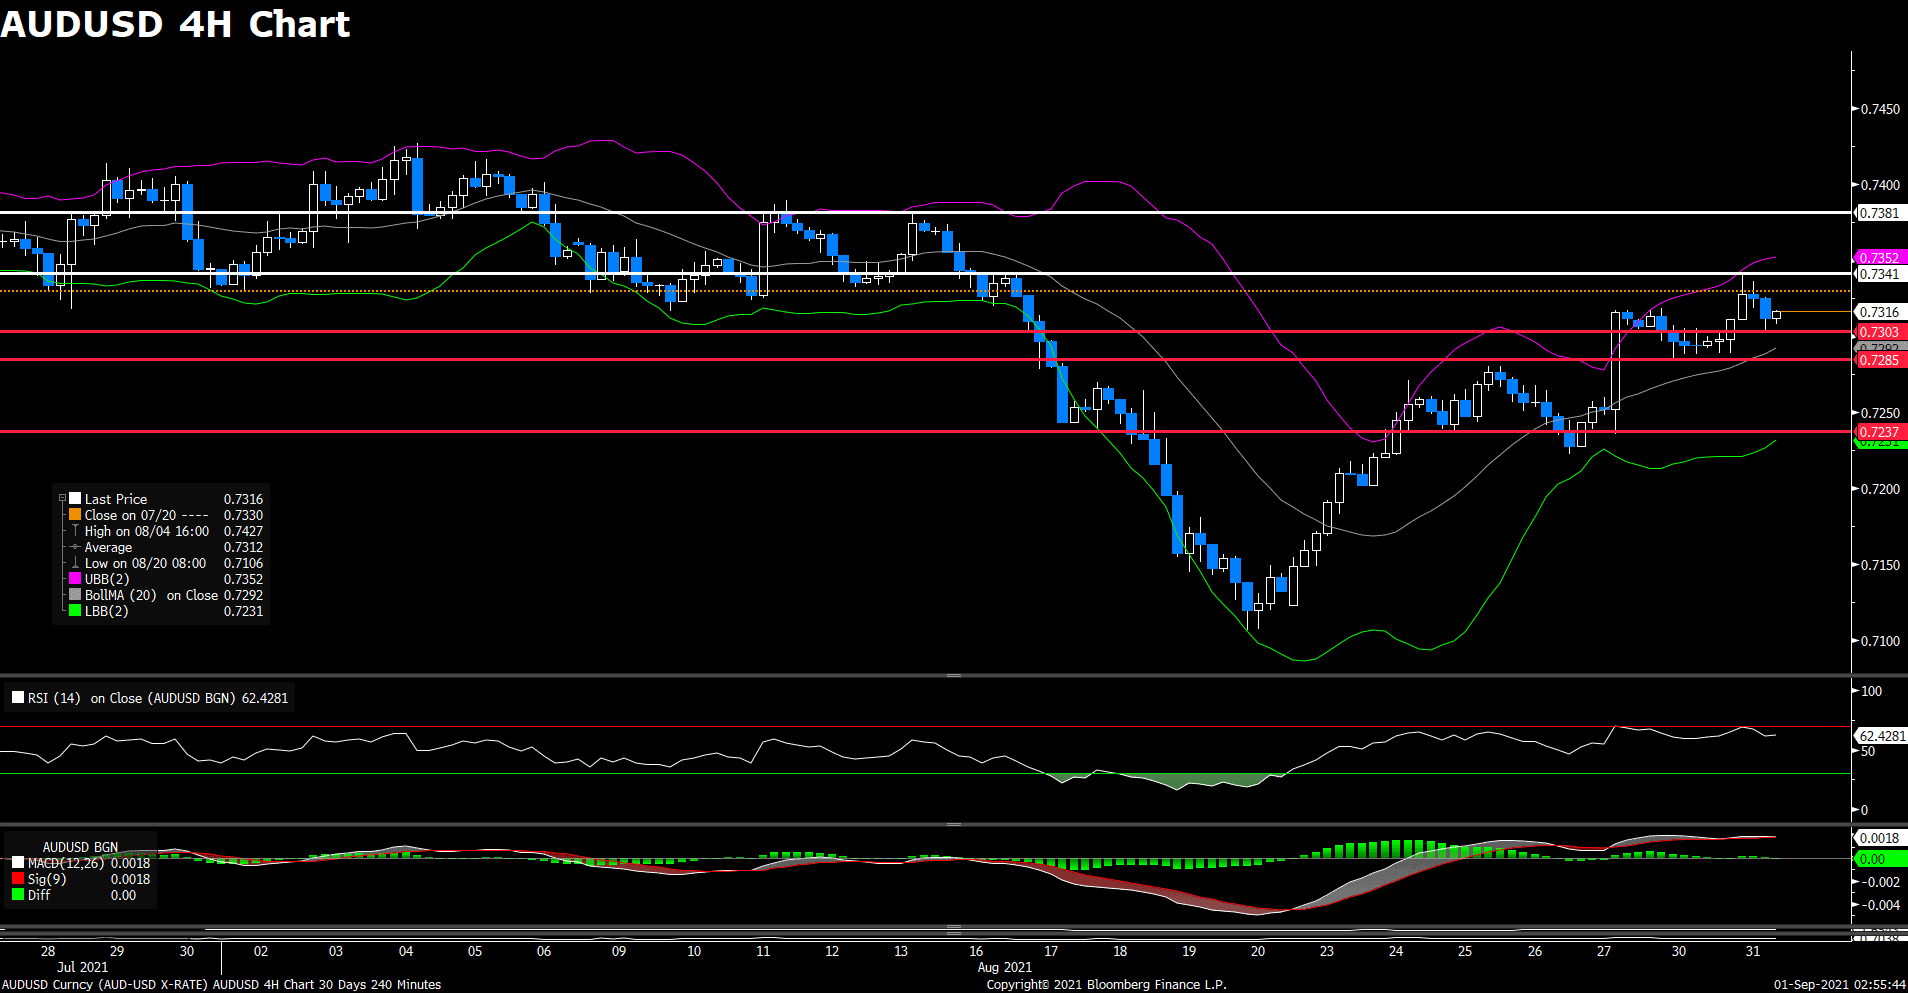
The AUD/USD pair was trading higher on Tuesday and recorded a two-week high right before the European trading hours, but it pulled back to 0.7310 level during American session. The pair was benefited by weaker US dollar across the board, rising 0.27% on the day. For technical aspect, RSI indicator 61 figures as of writing, suggesting bull-movement ahead. For Bollinger Bands, the pair is now trading between upper band and moving average, which indicates a bull market.
In conclusion, we think market will be bullish as long as the 0.7303 support line holds. The pair is now trying to test the 0.7341 resistance while further profits can be expected if price break above that level. The market focus now shifts to Australia’s GDP report on Wednesday.
Resistance: 0.7341, 0.7381
Support: 0.7303, 0.7285, 0.7237
Economic Data
|
Currency |
Data |
Time (GMT + 8) |
Forecast |
||||
|
AUD |
GDP (QoQ) (Q2) |
09:30 |
0.5% |
||||
|
CNY |
Caixin Manufacturing PMI (Aug) |
09:45 |
50.2 |
||||
|
EUR |
German Manufacturing PMI (Aug) |
15:55 |
62.7 |
||||
|
GBP |
Manufacturing PMI (Aug) |
16:30 |
60.1 |
||||
|
USD |
ADP Nonfarm Employment Change (Aug) |
20:15 |
613K |
||||
|
USD |
ISM Manufacturing PMI (Aug) |
22:00 |
58.6 |
||||
|
USD |
Crude Oil Inventories |
22:30 |
-3.088M |
||||


 The Covid-19 vaccine made by Pfizer Inc. and BioNTech SE was granted a full approval by U.S. regulators, a milestone expected to help bolster the immunization drive amid a renewed surge in infections.