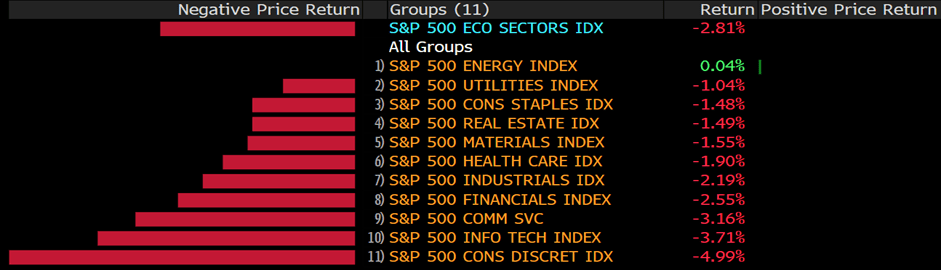
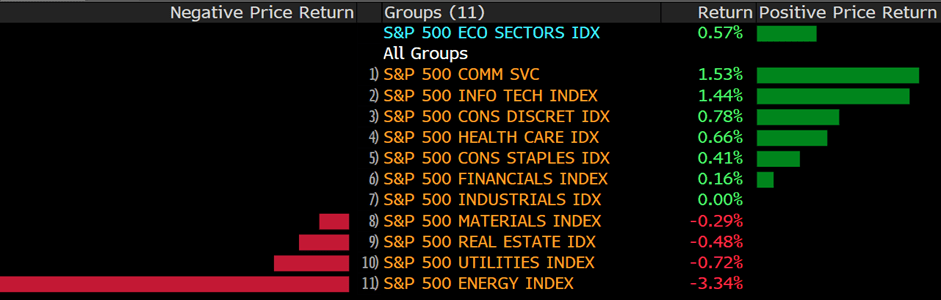
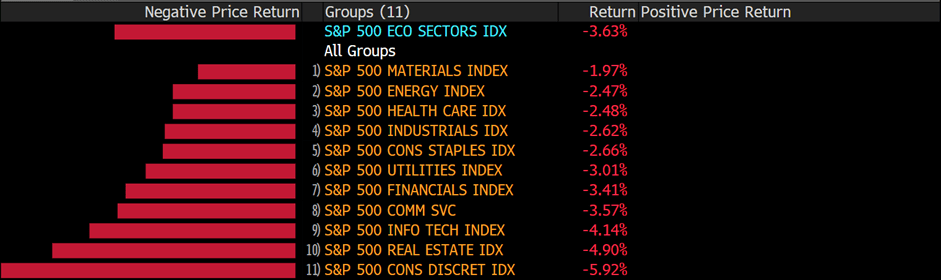
U.S. equities continue to lose ground on the last trading day of the week. The Dow Jones Industrial Average dropped 2.77% to close at 32977.21, the S&P 500 slipped 3.63% to close at 4131.93, and the Nasdaq Composite dived 4.17% to close at 12334.64. The Nasdaq’s sharp drop marked the index’s worst month since 2008. Amazon’s big sell-off dragged down the overall composite and the broader equities market. Ahead of the FOMC’s May meeting, market participants are pricing in interest rate uncertainty and a possible 50 basis point interest rate hike. The broader technology sector selloff also highlights the impact of China’s covid-related lockdowns and its impact on global supply chains.
On this week’s economic docket, the Royal Bank of Australia is due to announce interest rate decisions on Tuesday, and the Federal Reserve’s interest rate decision is set on Wednesday. Bank of England’s PMI and inflation report is due on Thursday, and the BOE would also issue interest rate decisions on the same day.
Main Pairs Movement
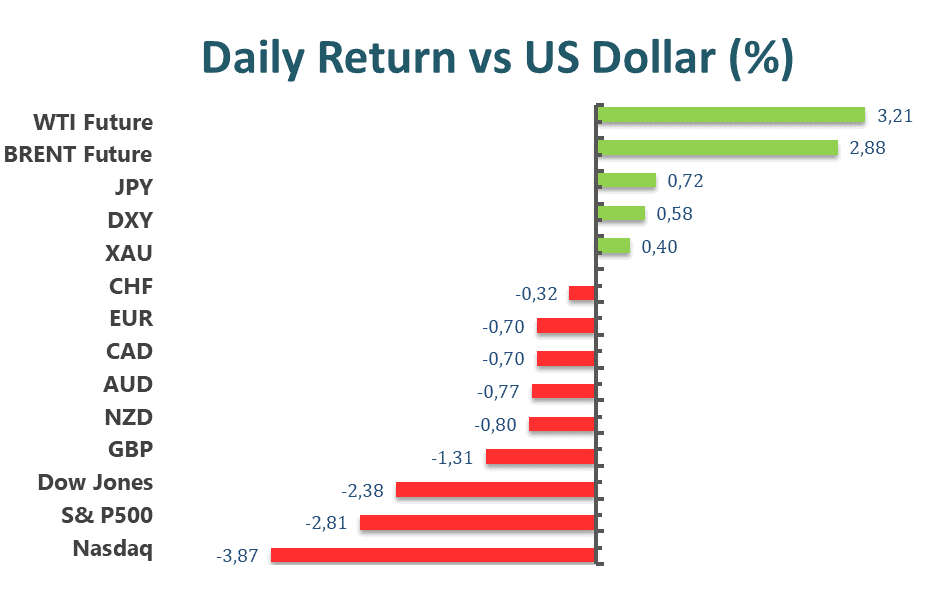
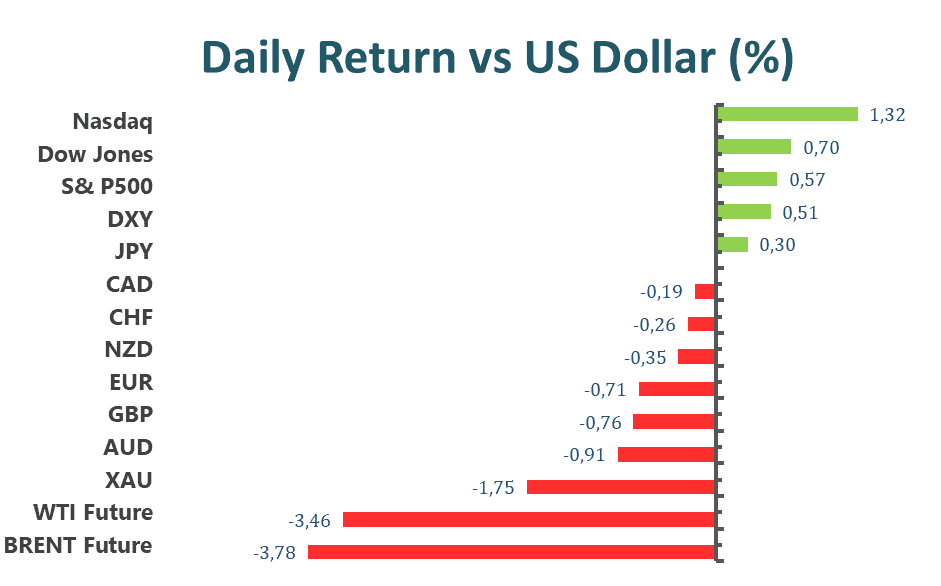
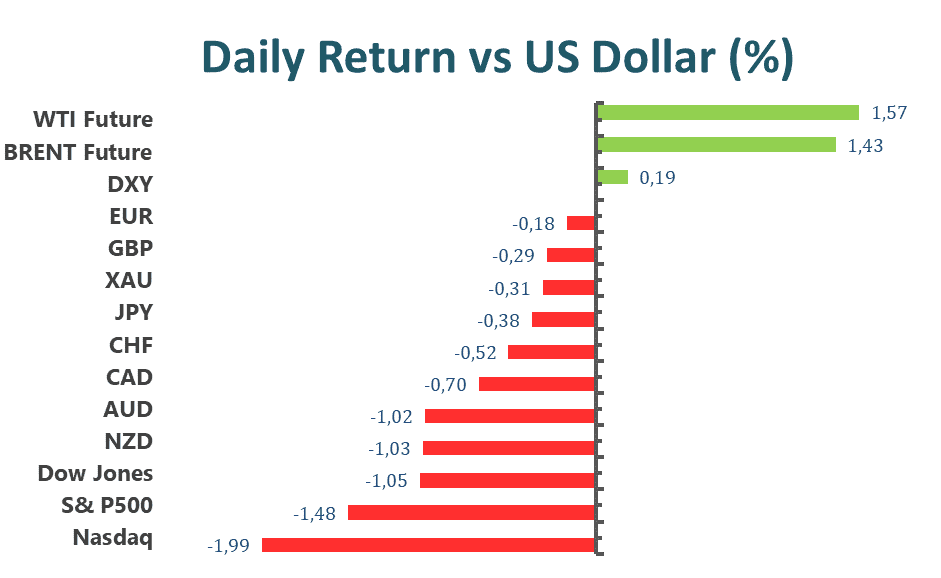
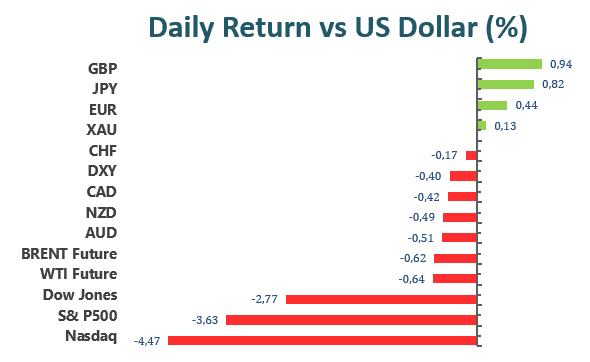
The Dollar showed weakness across the board on the last trading day of the week. The Dollar index closed 0.44% lower, while the benchmark U.S. 10-year Treasury yield rose to 2.937%. The sell-off of U.S. equities spilled over to the retreat of the Greenback. However, the FOMC meeting scheduled for May 4th will bring tremendous volatility to the Dollar index and the broader currency market.
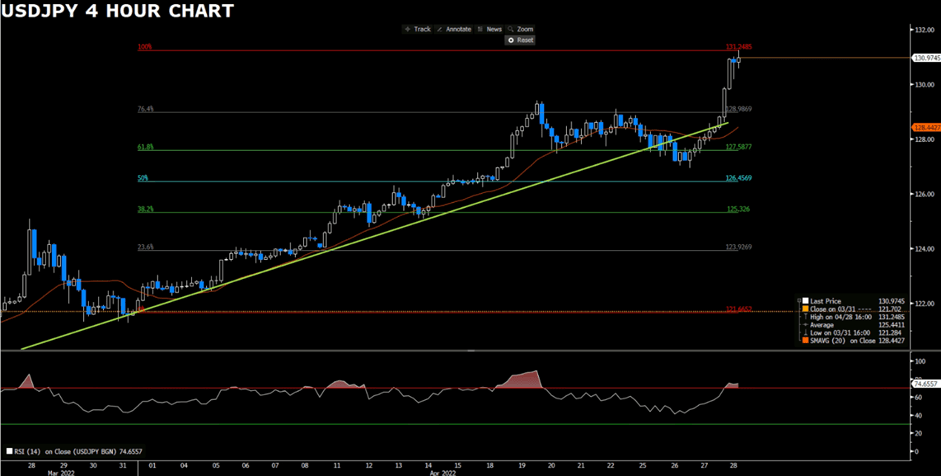
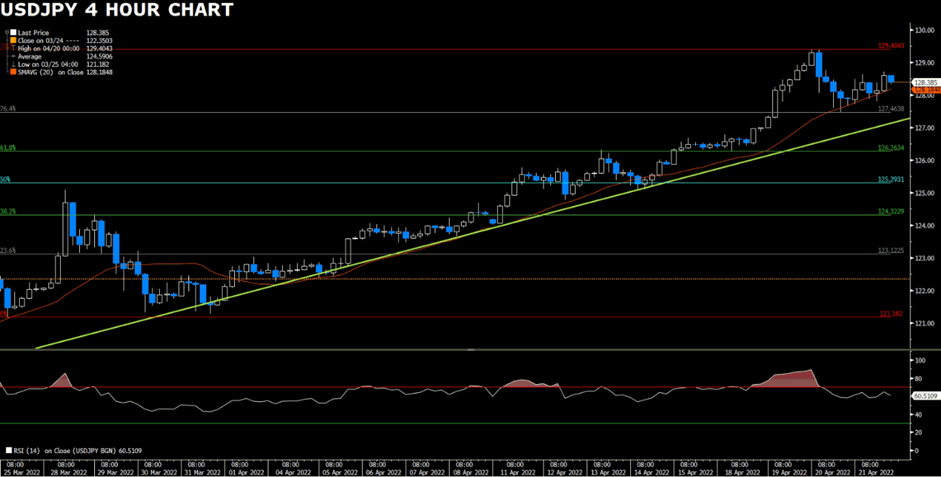
USDJPY has risen to historical levels, but the broad weakness of the Dollar on Friday saw a slight retreat of the pair. Technical indicators continue to suggest a bullish outlook on the pair; furthermore, while the Bank of Japan has yet to announce any sort of monetary tightening, the Federal Reserve is set to begin its second round of tightening of the year.
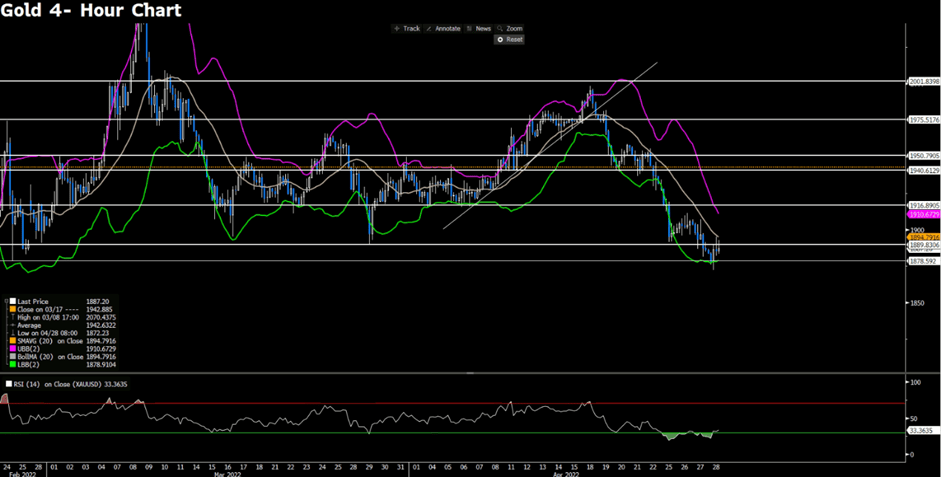
Gold prices rebounded 0.13% on Friday, but could not close above the $1900 per ounce price level. As global central banks begin to ramp up interest rates, XAUUSD has begun to retrace and consolidate below the $1900 price level.
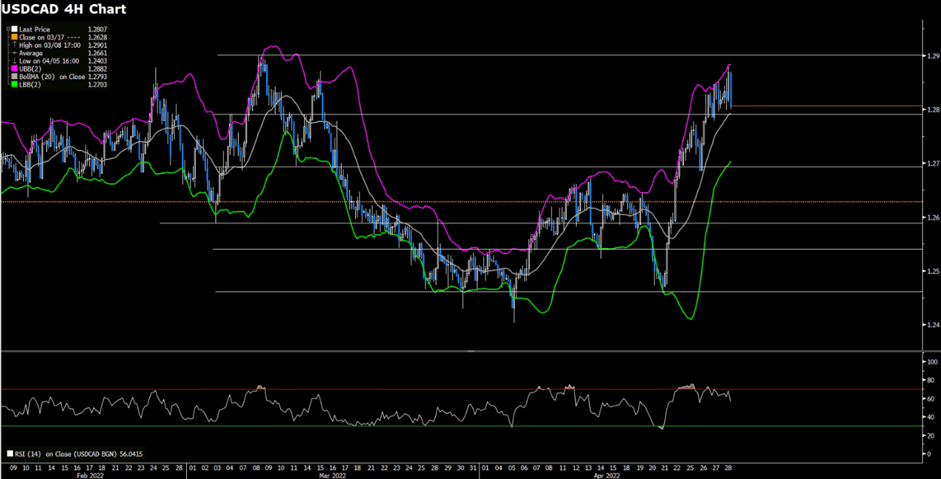
Cable rebounded 0.92% on Friday. The broad-based weakness of the Dollar helped boost the Sterling against the Greenback. With the BoE and the Fed both announcing interest rate decisions in the upcoming week, market participants can expect volatility for the pair.
Technical Analysis
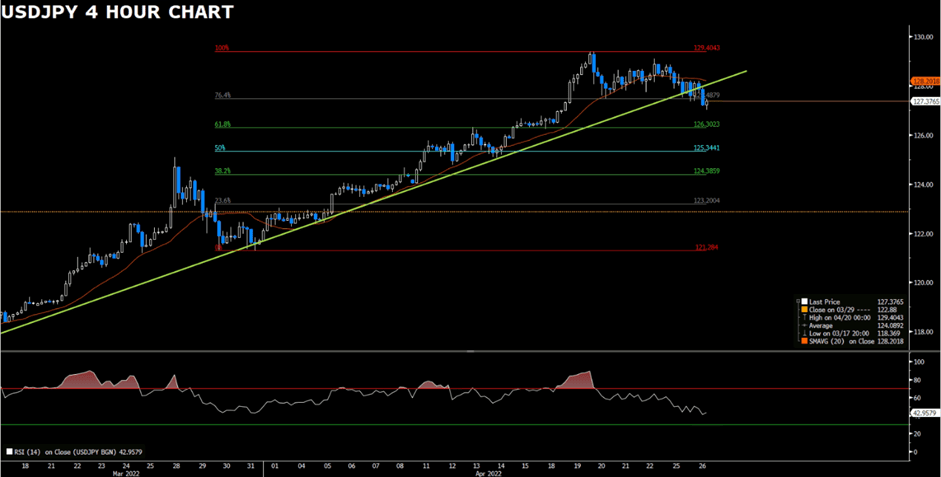
USDJPY (4-Hour Chart)
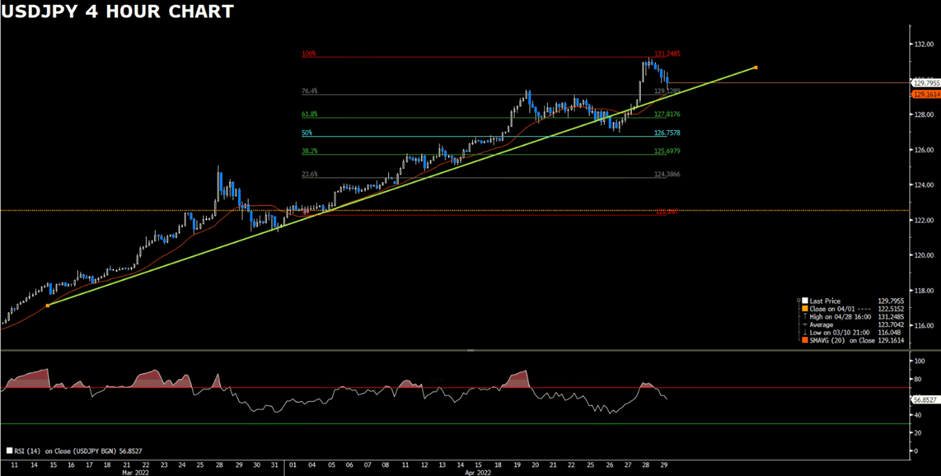
USDJPY corrects from the highest level, 131, in two decades amid an aggressive USD long-unwinding trade. Technically speaking, the four-hour outlook of USDJPY remains strongly bullish though the intraday downtick stalls near the 129.80 region. The pair continues to stay above the ascending trend line, suggesting that the trend is yet to confirm a bearish bias. The bears need to wait till the breakout of the support level at 129.12 to claim tractions. On the flip side, the rebound might happen once the downtick contests the support at 129.12, where the ascending trend-line is located. Succeed to defend the support is expected to give USDJPY another upside momentum toward the next immediate resistance at 131.24
Resistance: 131.24
Support: 129.12, 127.81, 126.75
XAUUSD (4-Hour Chart)
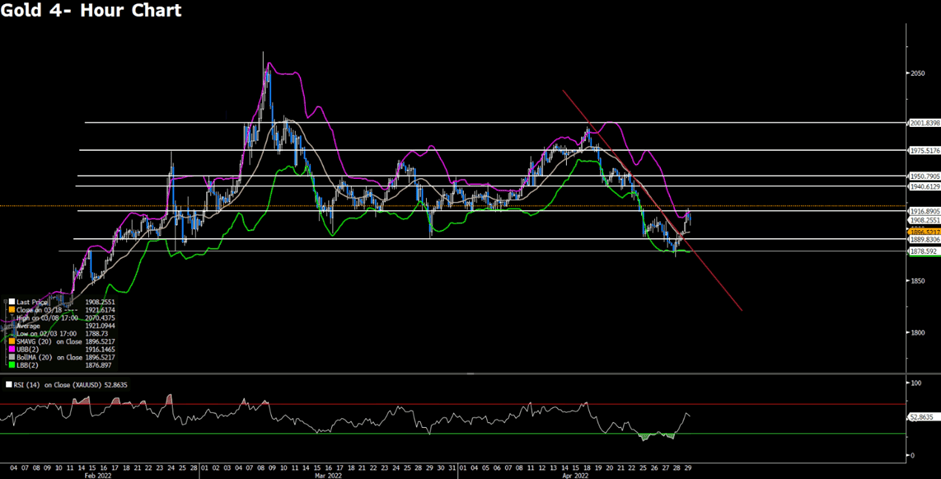
The precious metal, gold, edges higher on Friday following the benchmark 10- year Treasury bond yield is up more than 2% after the US PCE inflation data. From the technical point of view, the near-term outlook of gold seems to turn upside following the outbreak of descending trend line. The upside momentum from these two days has pushed gold above the $1,900 level, the psychological resistance on the four-hour chart. However, the current resistance at $1,916 is set to become the first obstacle that gold needs to overcome if bulls want to extend further north. From the RSI indicator, the reading is currently hovering around the positive territory and has not yet reached the overbought condition, suggesting that bulls still have rooms to head further. On the flip side, failure to defend the support of $1,889 will bear an opportunity to attract some follow-through selling.
Resistance: 1,916, 1,940, 1,950
Support: 1,889, 1,878
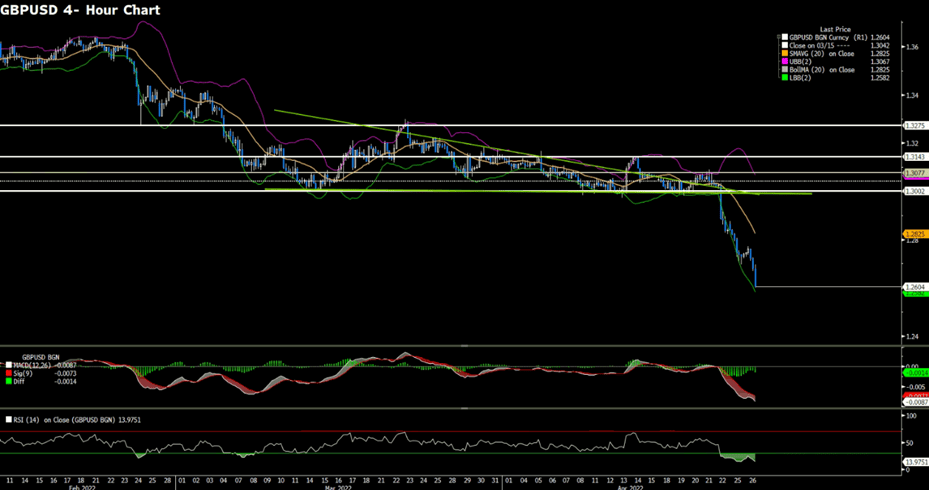
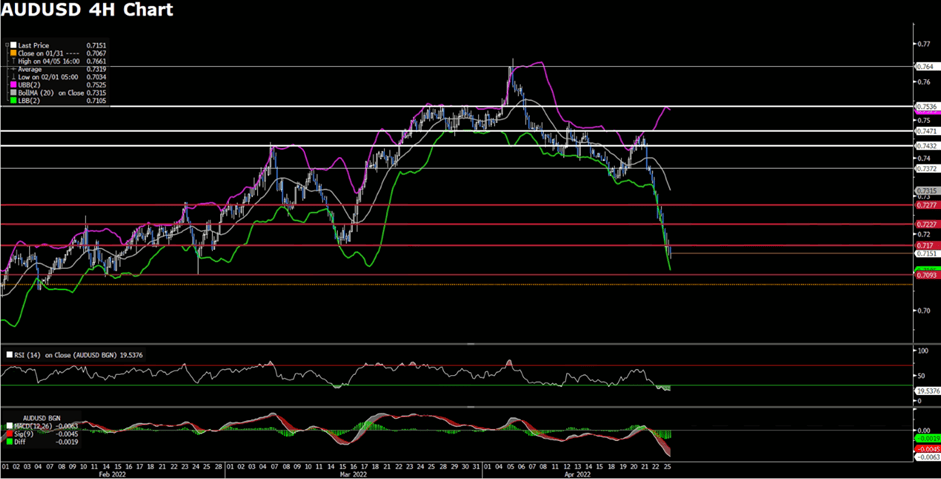
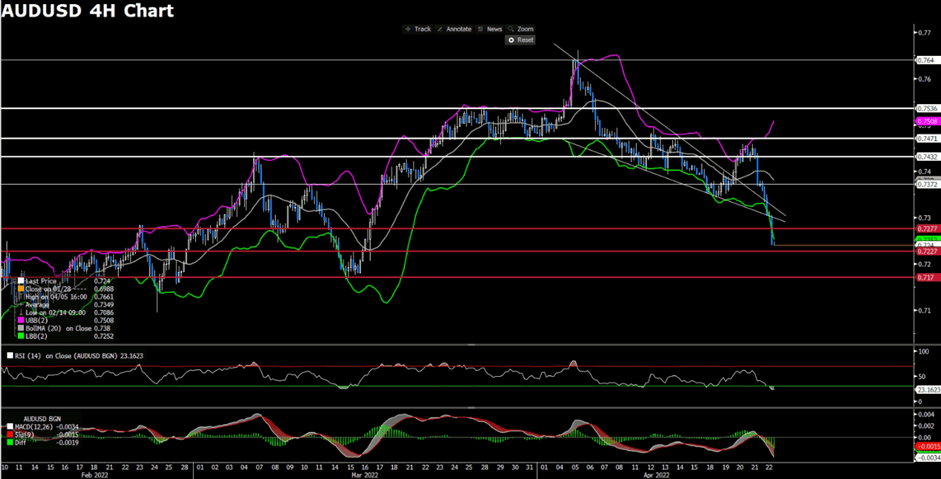
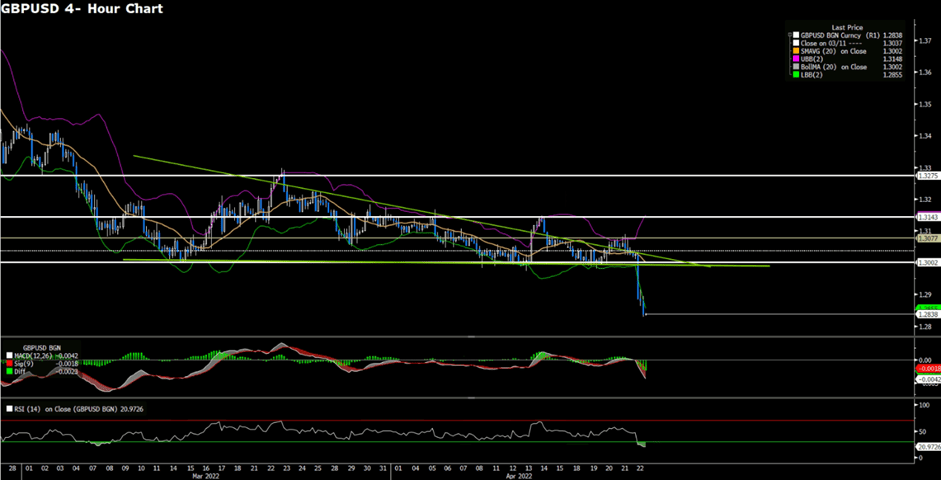
GBPUSD (4-Hour Chart)
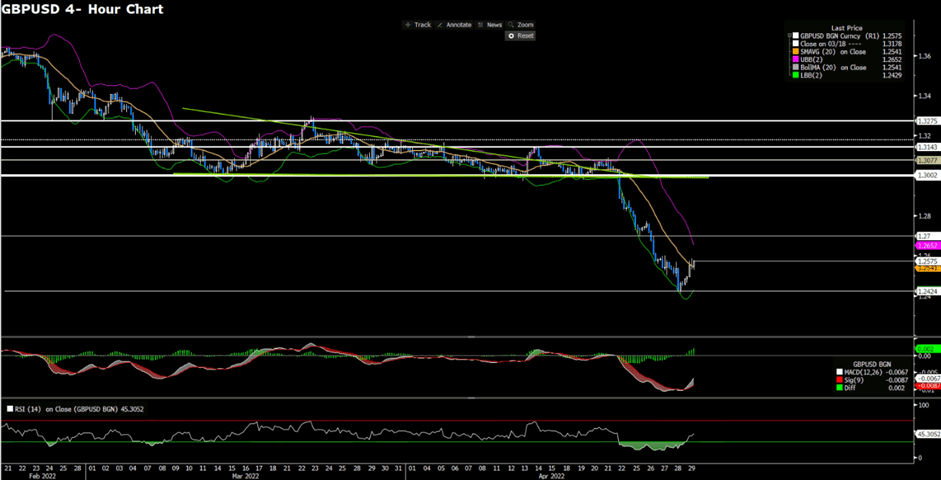
GBPUSD witnessed a rebound after hitting the 1.2400 region. The intraday uptick seems to be boosted by the US PCE inflation data. From the technical perspective, GBPUSD displays a minor pause from the 1.2400 regions after a sheer downside move since the 22nd of April; yet, the outlook remains bearish as the pair continues to fall well below the triangular wedge, suggesting that the context is extremely bearish. On the flip side, to raise the odds of a reversal, GBPUSD needs to at least climb above the 1.3002 level, where the outbreak of the descending wedge is located. At the moment, though the MACD indicator shows some positive move for the pair, the RSI remains at the negative level on the four-hour chart. That being said, the near-term momentum might lend some support to bulls, but the bears are still in control in the longer- timeframe.
Resistance: 1.2700, 1.3002, 1.3077
Support: 1.2424
Economic Data
| Currency | Data | Time (GMT + 8) | Forecast |
| EUR | German Manufacturing PMI (Apr) | 15:55 | 54.1 |
| USD | ISM Manufacturing PMI (Apr) | 22:00 | 57.8 |