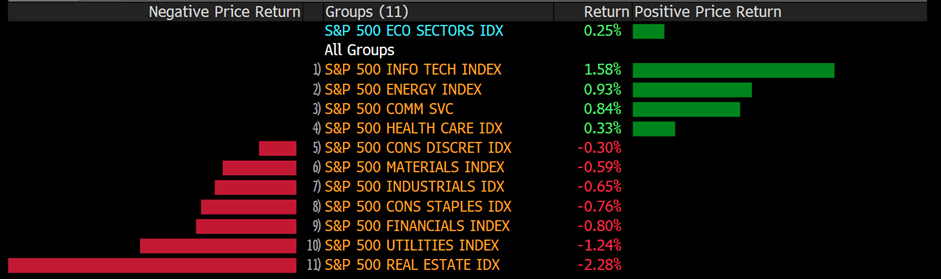
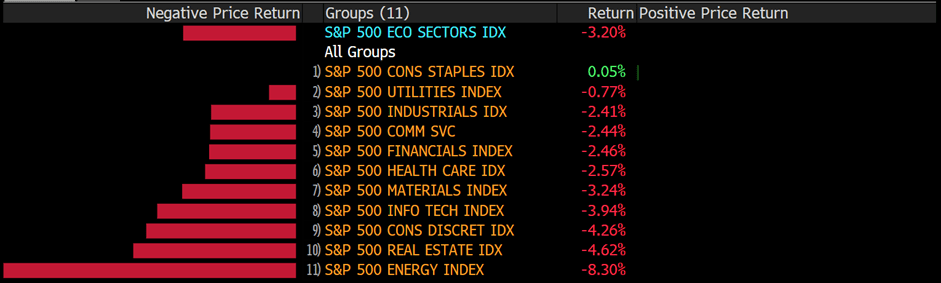
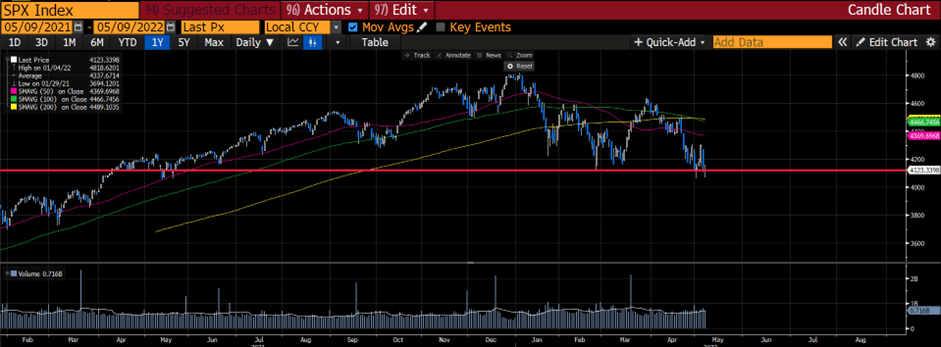
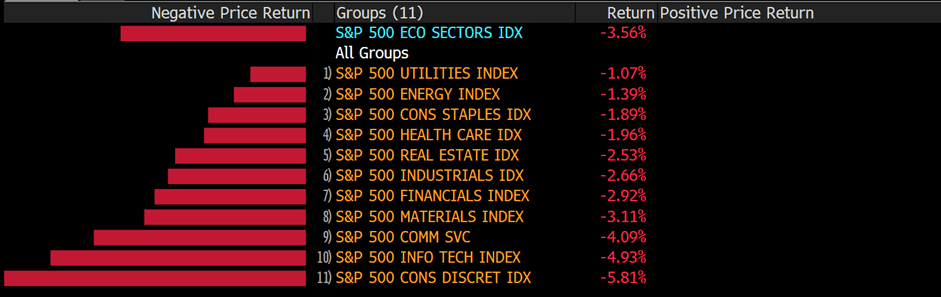
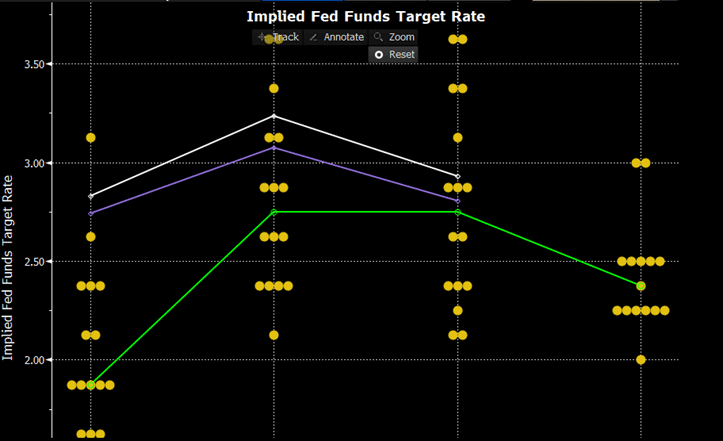
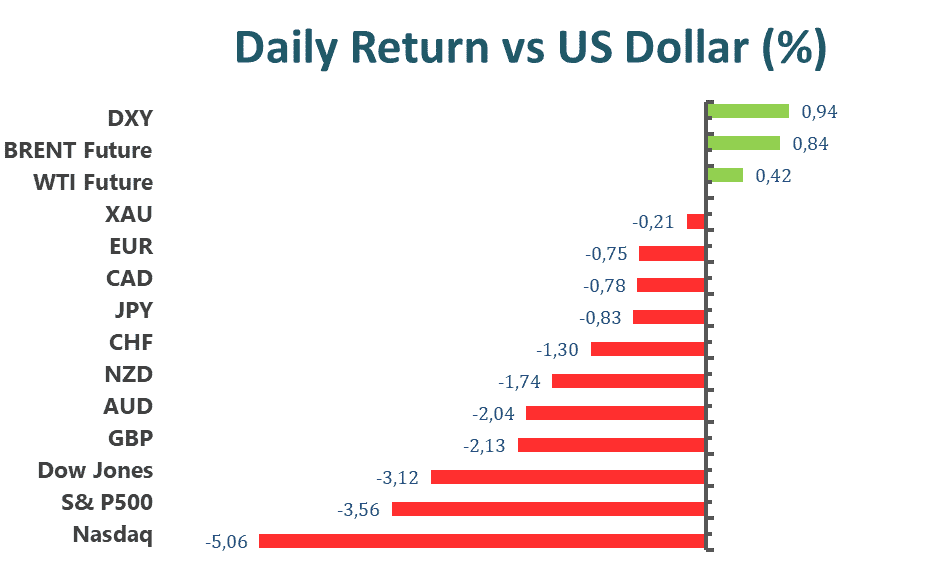
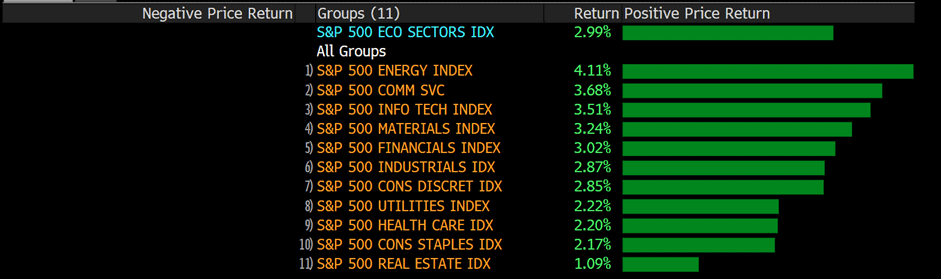
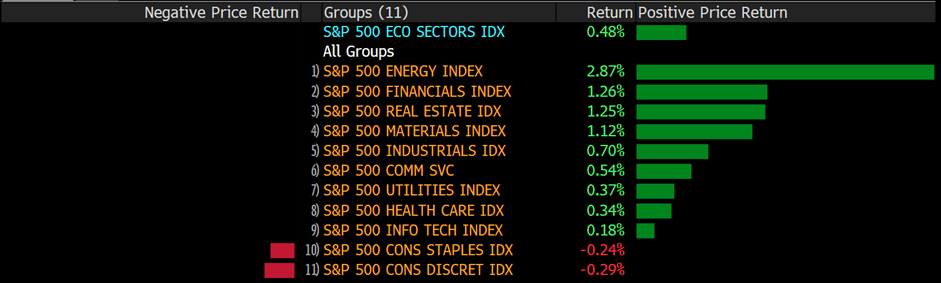
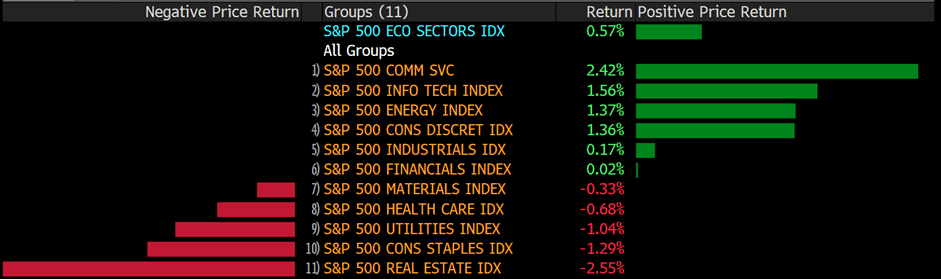
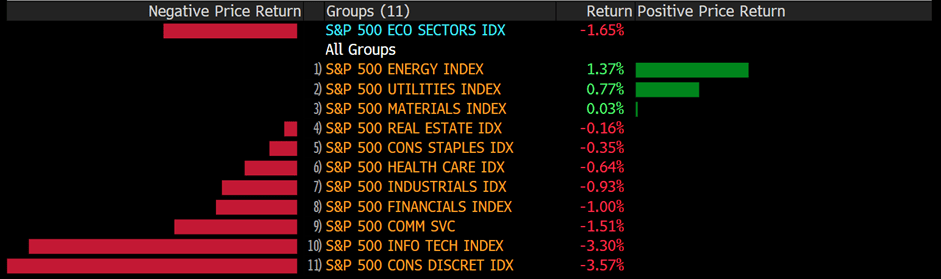
U.S. equity markets experienced another drop as CPI data came in above estimates. The Dow Jones Industrial Average lost 1.02% to close at 31834.11. The S&P 500 slid 1.65% to close at 3935.18. The Nasdaq composite dropped 3.18% to close at 11364.23. April CPI data came in at 8.3%, compared with estimates of 8.1%, and core CPI rose to a record 6.2%. Market participants were expecting a CPI reading that was either similar to or lower than the previous month’s reading, but a higher current month reading indicates that inflation has not peaked and is still on the rise; furthermore, with energy prices declining 2.7% for the month, other factors, such as food prices, still boosted the April CPI reading. The previous FOMC minutes do provide some assurances as the Fed has iterated that it would not hike rates by more than 50 basis points at a time, but the central bank remains that there are still multiple rate increases coming by the end of the year.
The cryptocurrency market experienced a strong pullback as inflation came in red hot. Additionally, the UST issue still weighs heavily on the cryptocurrency market. The stable coin lost its peg to the U.S. Greenback and fell to a low of 0.3 as market participants scramble to exit their positions. Bitcoin is currently trading below $30,000, and Ethereum is trading at $2084, as of writing.
Market participants will be focused on the initial jobless claims report and U.S. PPI report, both scheduled to be released during the American trading session.

Main Pairs Movement
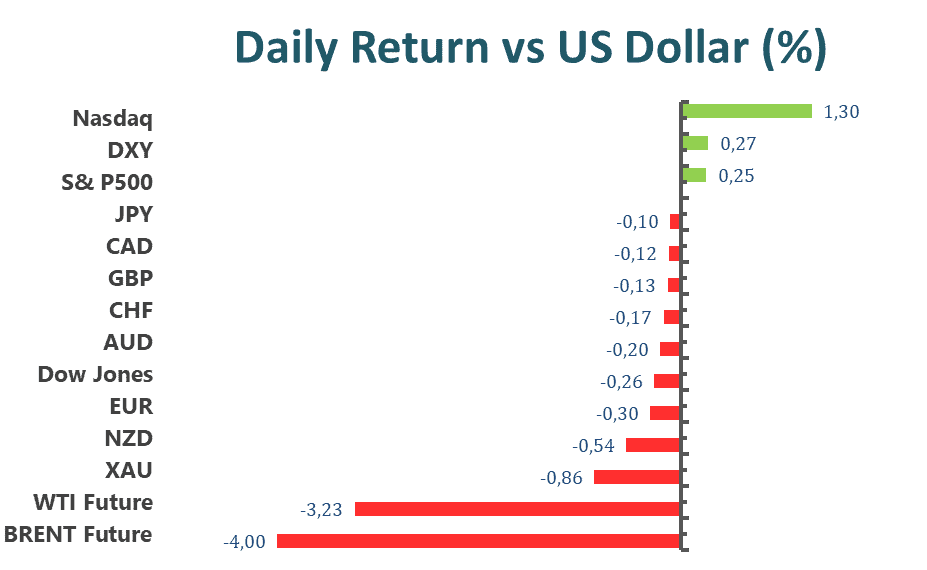
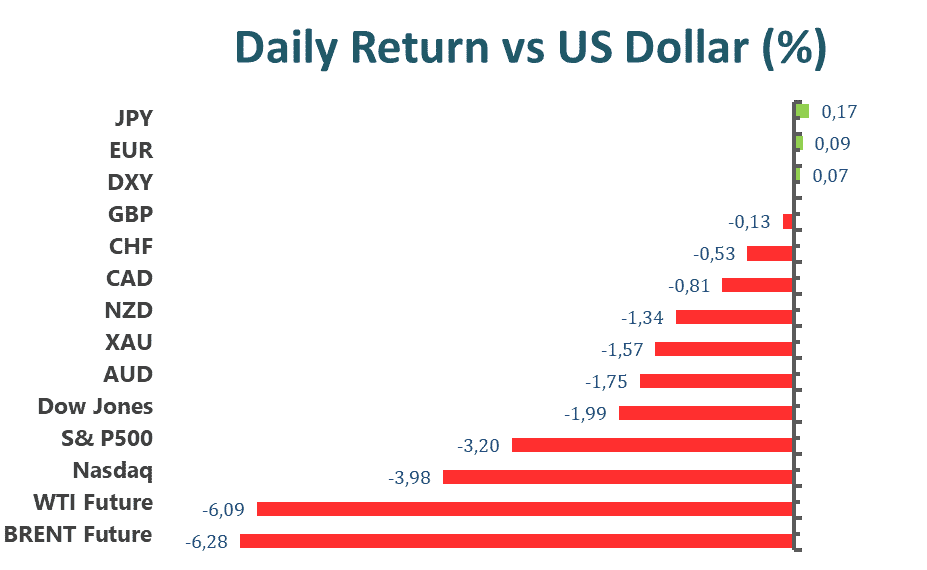
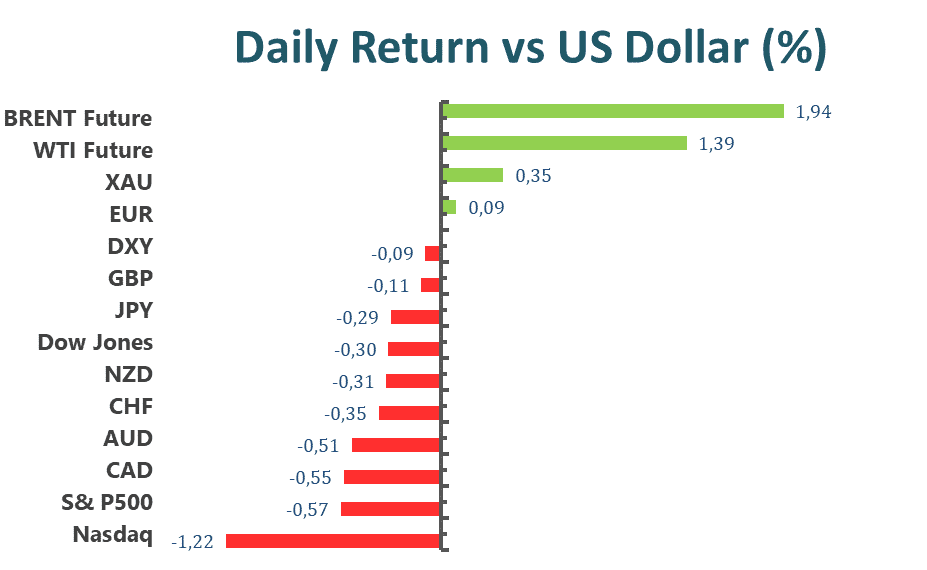
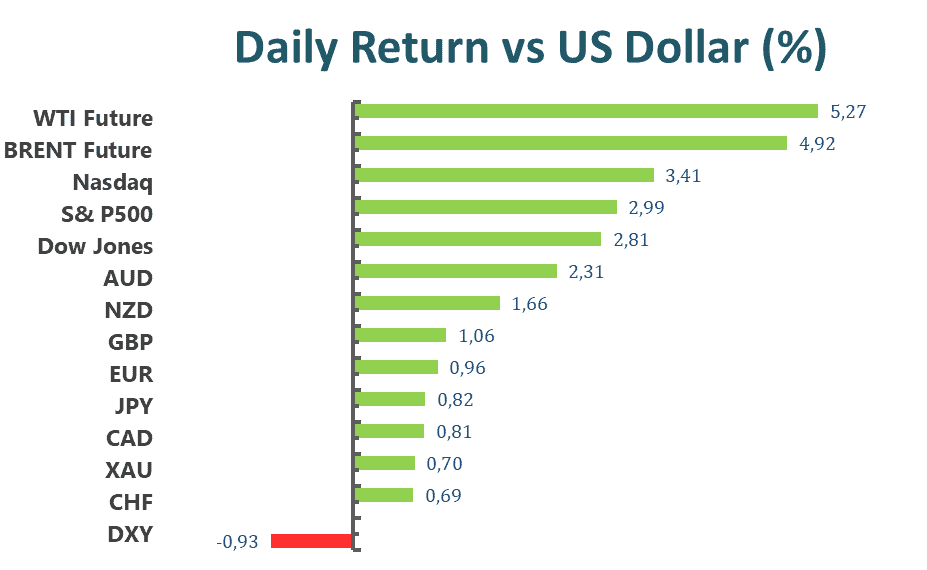
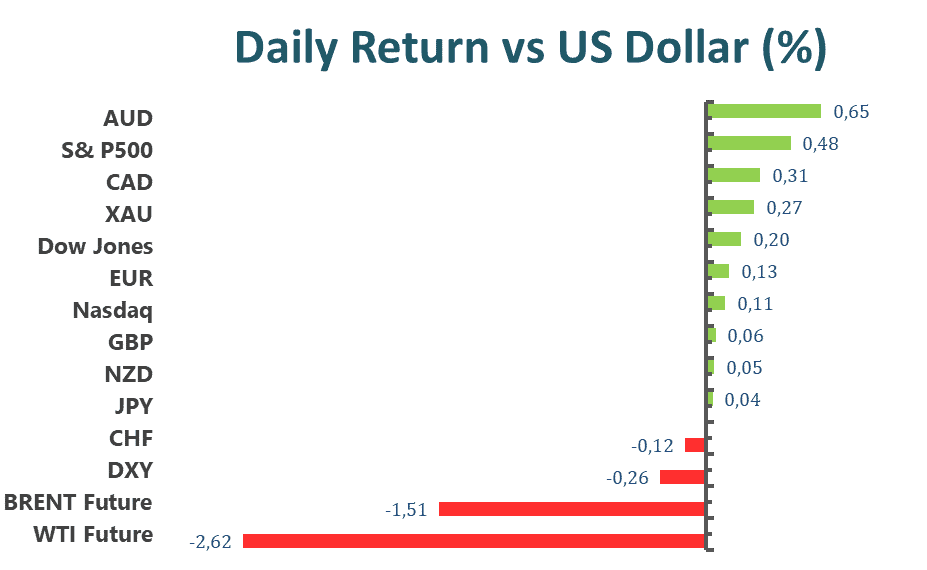
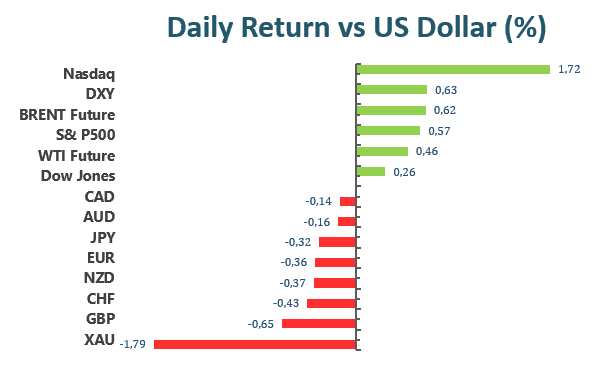
The Dollar Index climbed for the sixth straight trading session and leaped above 104 after the release of the April CPI reading. U.S. Treasury yields jumped above 3% at the initial release of the CPI report, but have gradually simmered below 3% and are currently sitting at 2.906%.
EURUSD lost 0.13% over the previous trading day. The Euro rose for the first part of the day as Euro bulls swooped in to support the currency, but after the U.S. CPI data was released, the Greenback gained back all its losses against the Euro.
GBPUSD dropped 0.52% over the previous trading day. The British Pound gained upward momentum as the U.S. CPI data came in but soon lost all gains as U.S. Treasury yields edged higher.
USDCAD dropped 0.29% over the previous trading day. The Canadian Loonie ended its four-day losing streak as the dollar came under pressure from the heated inflation data. The initial CPI release sparked a 0.78% drop in the USDCAD pair but was able to recover some ground.
Technical Analysis
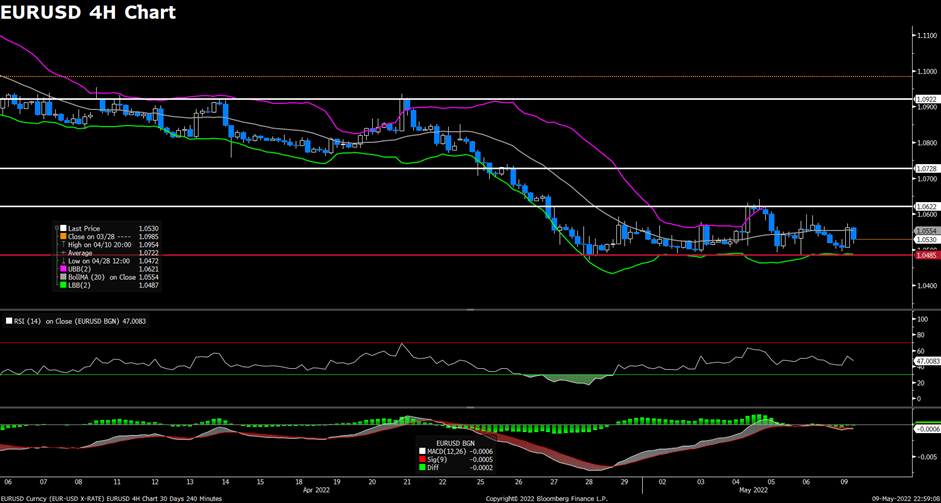
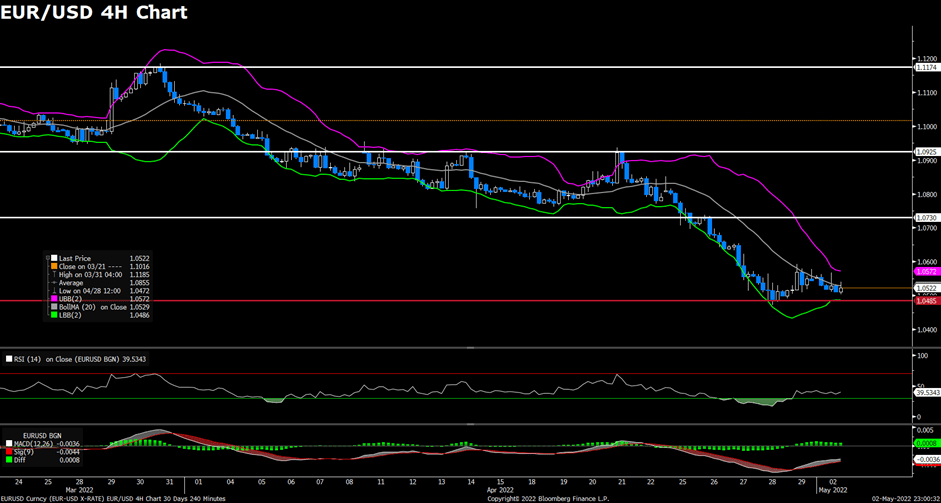
EURUSD (4-Hour Chart)
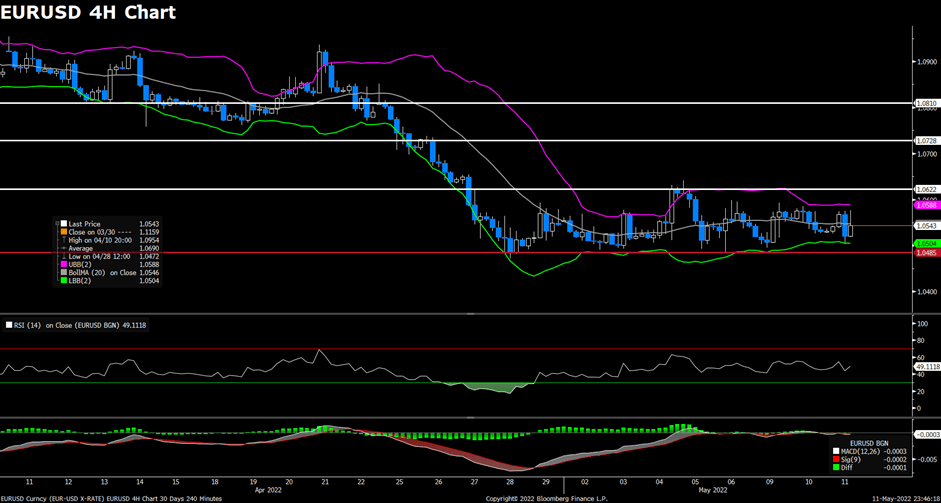
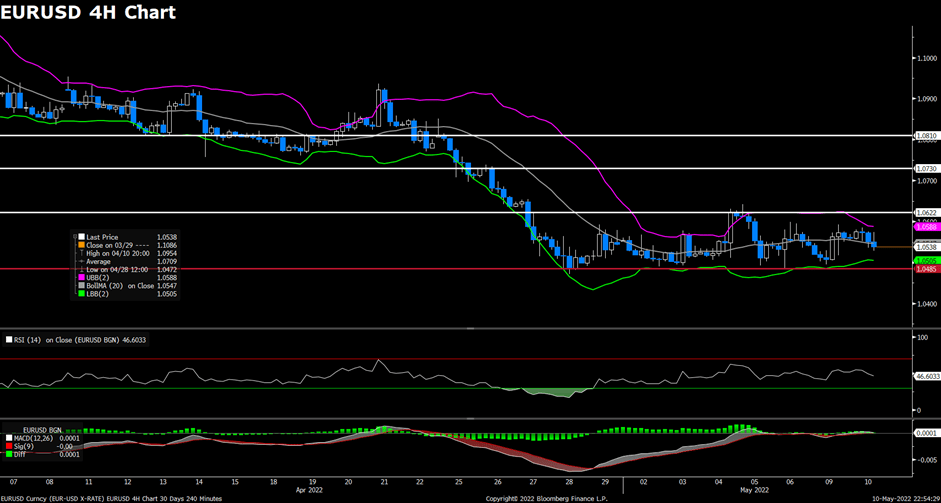
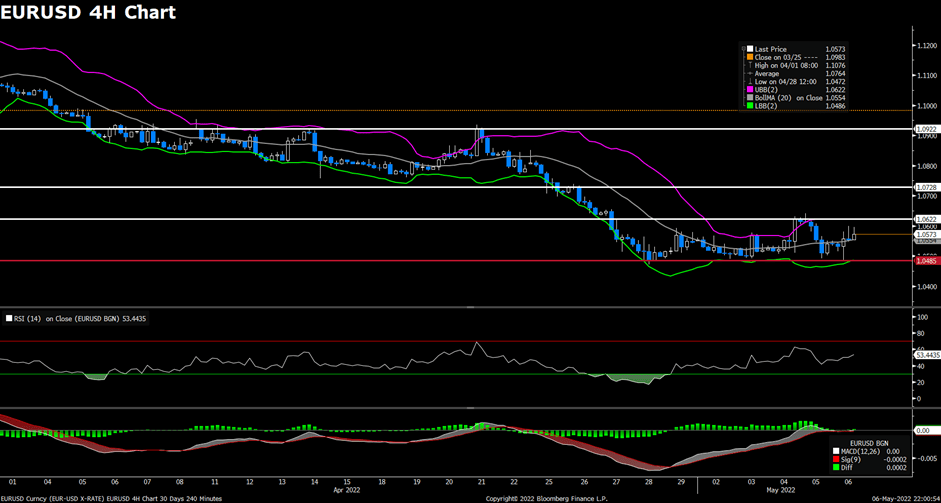
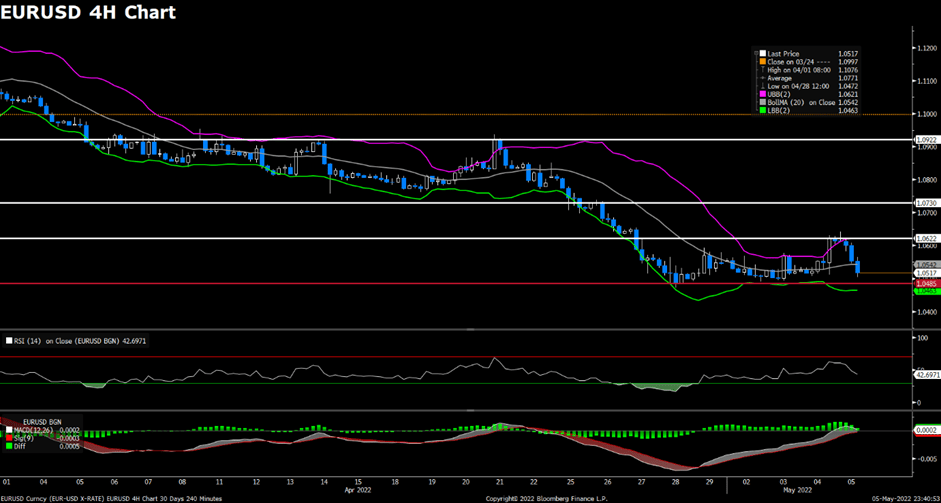
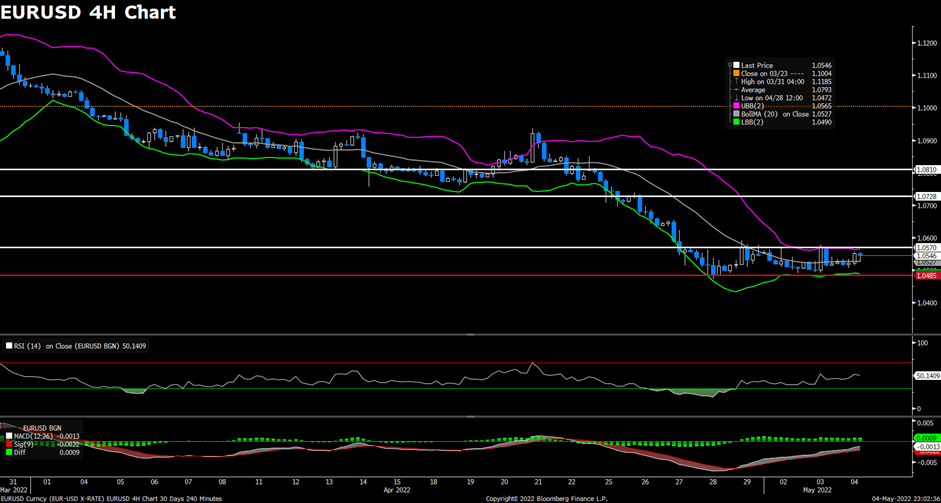
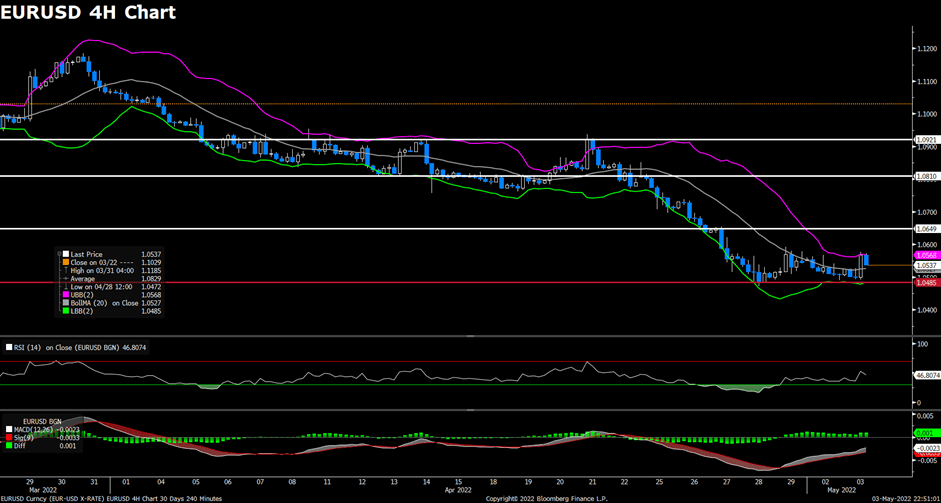
The EUR/USD pair advanced on Wednesday, recovering from a daily low below 1.051 level after the release of the US CPI data. The pair was trading higher to touch a daily high above 1.057 level during the European session, then staged a goodish rebound following US CPI-inspired decline in the US session. The pair is now trading at 1.0544, posting a 0.20% gain daily. EUR/USD stays in the positive territory amid renewed US dollar weakness, despite the stronger US CPI report reaffirming bets for a more aggressive policy tightening by the Fed. For the Euro, ECB President Christine Lagarde hinted that rate hikes could happen as soon as July as inflation continues to rise, showing that the European Central Bank has decided to follow with the rest of the major central banks. The hawkish comment provided some support to the EUR/USD pair.
For the technical aspect, RSI indicator 51 figures as of writing, suggesting that the upside is preserving strength as the RSI keeps heading north. As for the Bollinger Bands, the price regained bullish momentum and crossed above the moving average, therefore the upside traction should persist. In conclusion, we think the market will be slightly bullish as long as the 1.0622 support line holds. On the upside, the pair has room to extend its rebound toward 1.0622.
Resistance: 1.0622, 1.0728, 1.0810
Support: 1.0485
GBPUSD (4-Hour Chart)

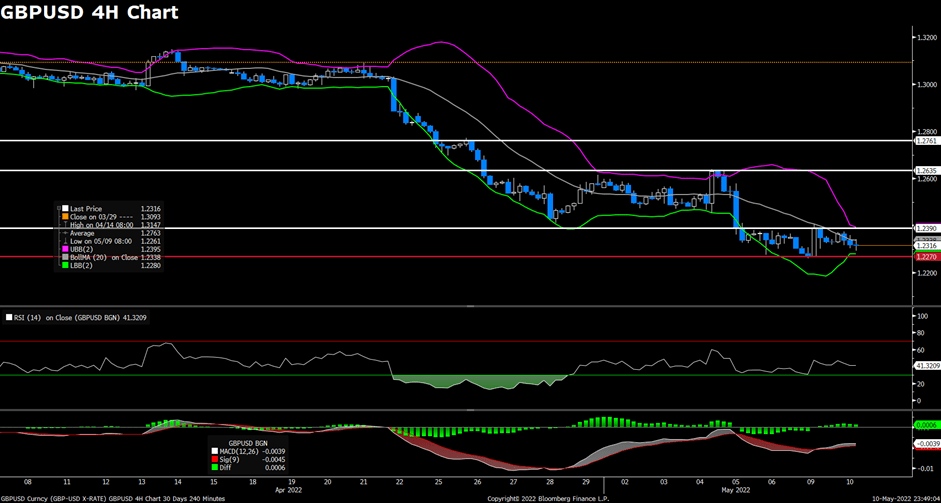
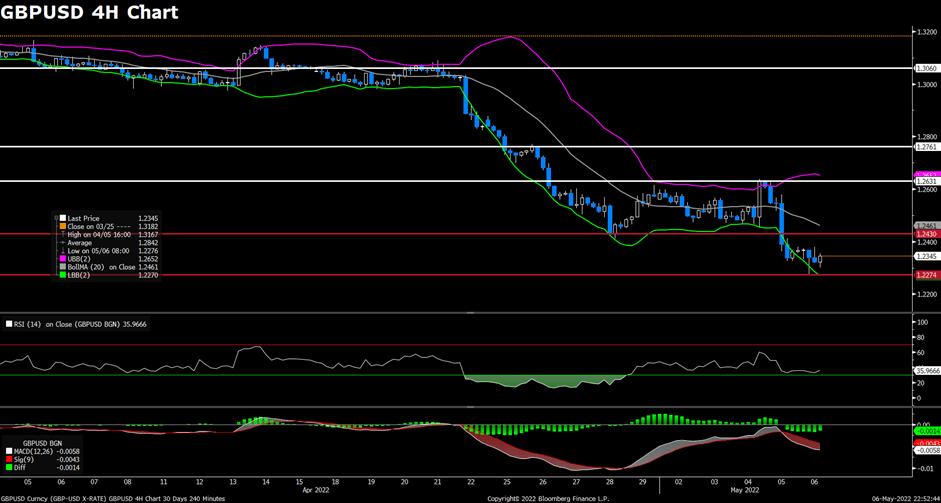
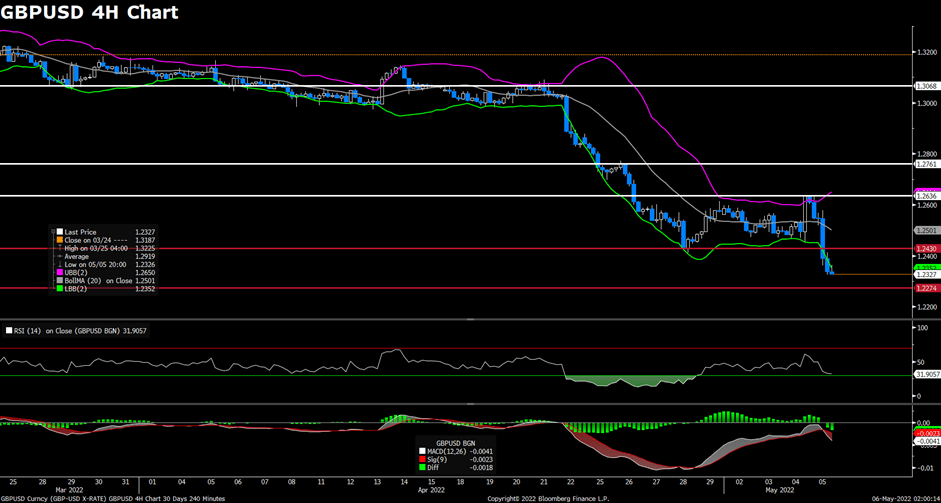
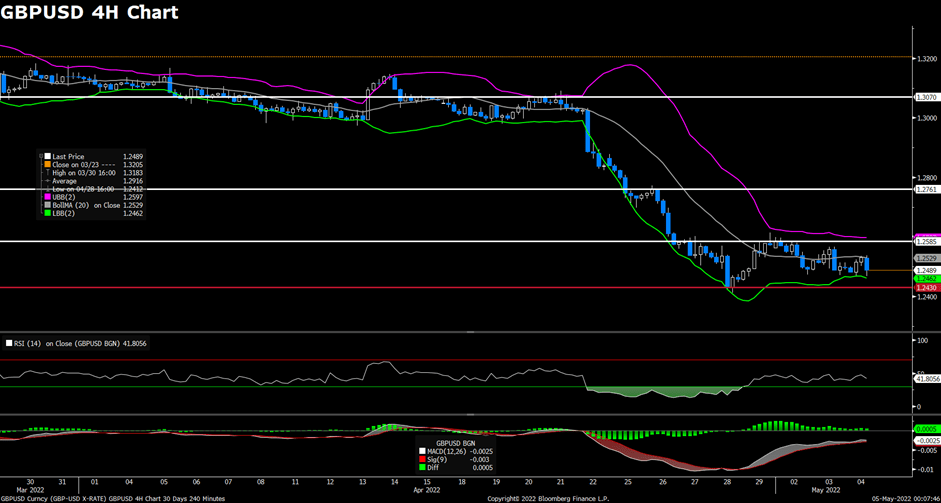
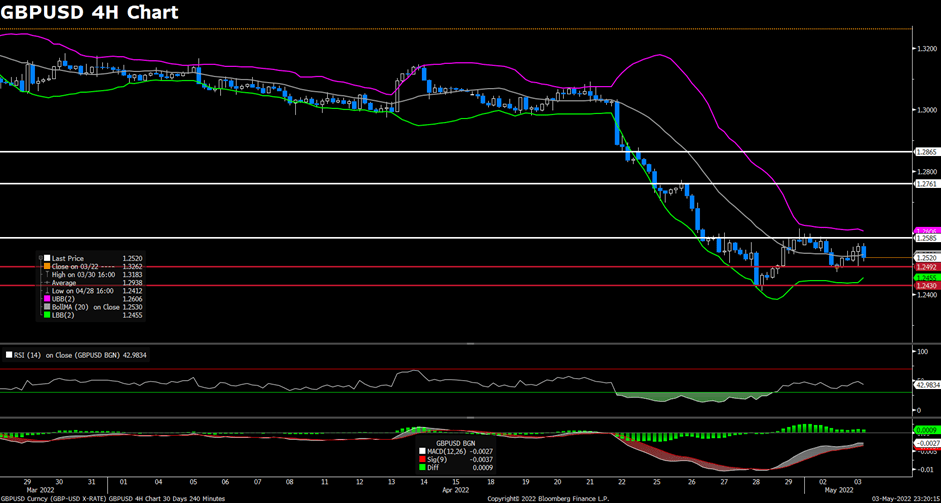
The pair GBP/USD edged higher on Wednesday, gathering recovery momentum and rebounds from the post-US CPI low. The pair regained upside traction after dropping to a daily low below the 1.229 mark, but then started to see fresh selling again and surrendered most of its daily gains in the US session. At the time of writing, the cable remains under pressure but stays in positive territory with a 0.06% gain for the day. The annual pace of the headline US CPI came in at 8.3% in April, which is higher than the market’s expectations of 8.1%. Inflationary pressures are likely to remain high in the next few months amid tight global supply chains and the war in Ukraine. For the British pound, the Bank of England’s gloomy economic outlook last week and negative Brexit-related headlines should keep acting as a headwind for the cable and capped its upside. The latest news showed that Northern Ireland Protocol talks are in a serious situation.
For the technical aspect, the RSI indicator is 42 figures as of writing, suggesting that the downside is more favored as the RSI stays below the mid-line. For the Bollinger Bands, the price retreated from the upper band, indicating some near-term bearish bias and the downside traction should remain. In conclusion, we think the market will be bearish as the pair is heading to test the 1.2270 support. On the upside, a break above the 1.2390 resistance might lead the pair to the 1.2500 area.
Resistance: 1.2390, 1.2631, 1.2761
Support: 1.2270
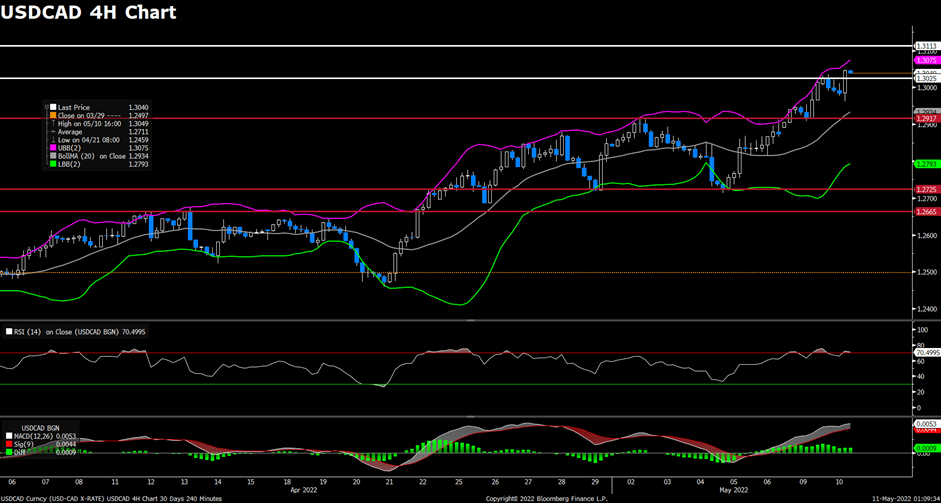
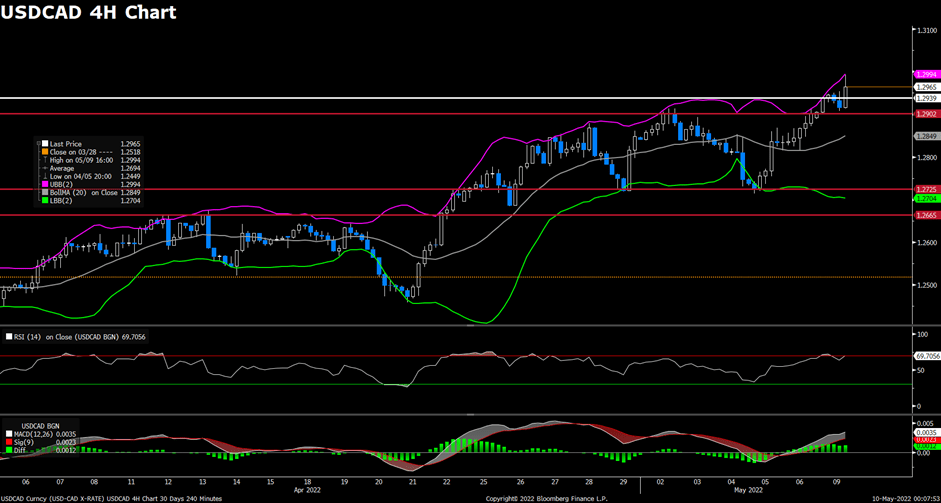
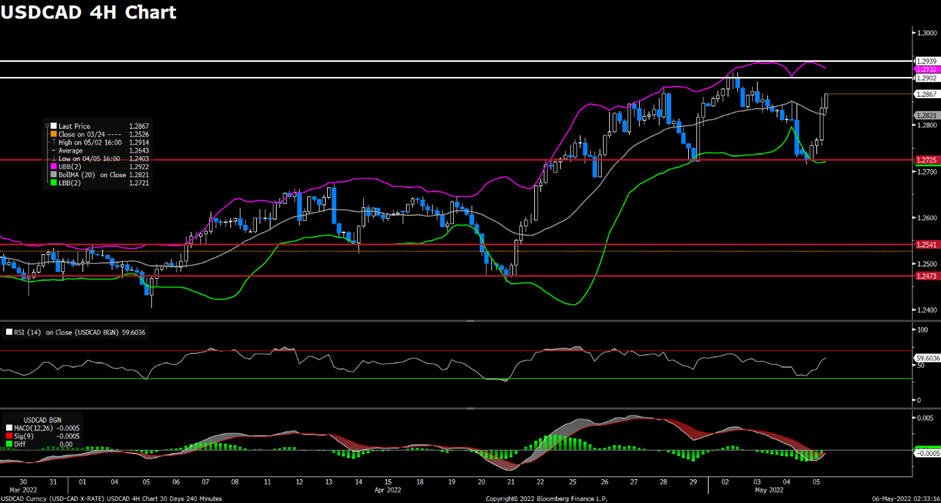
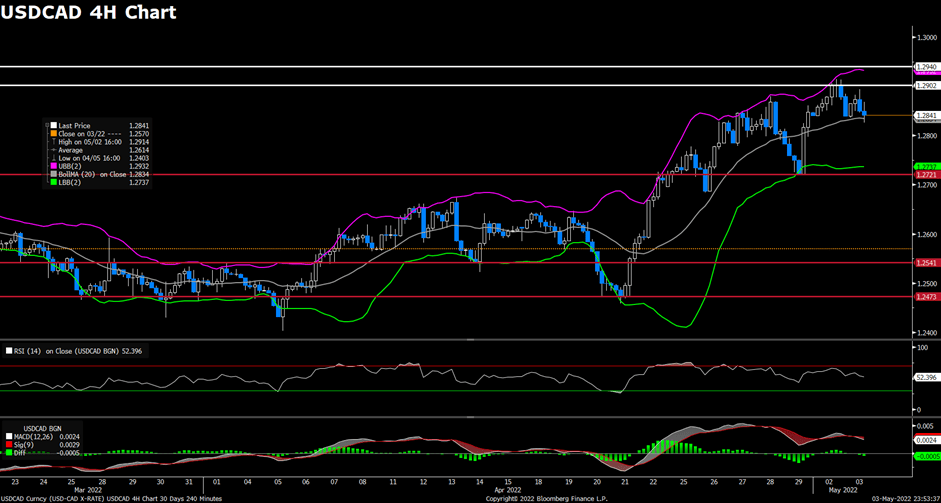
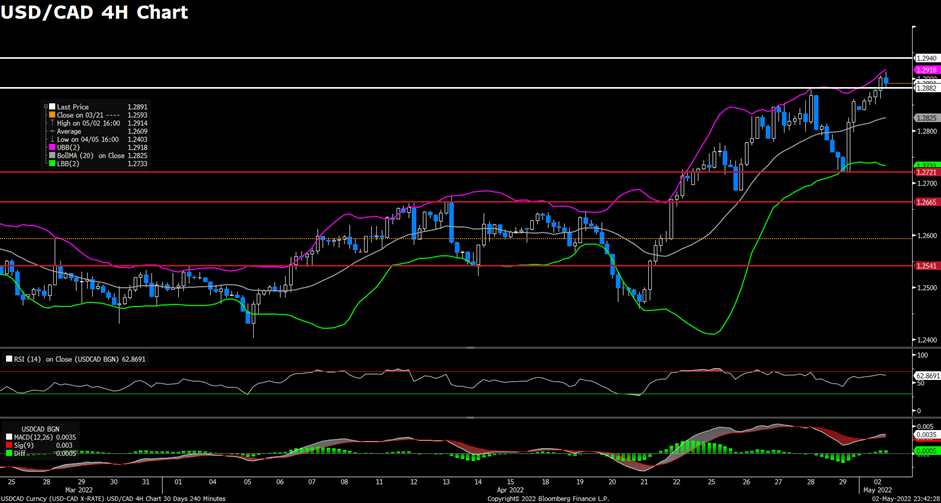
USDCAD (4-Hour Chart)
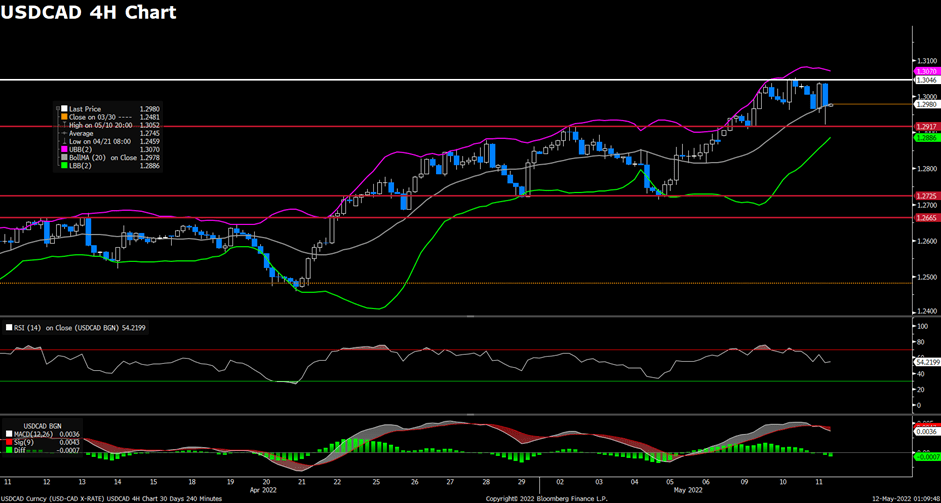
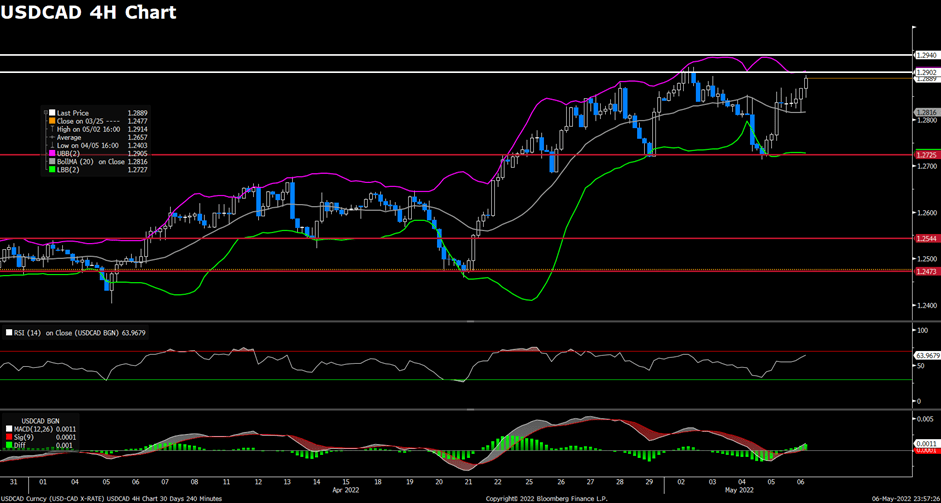
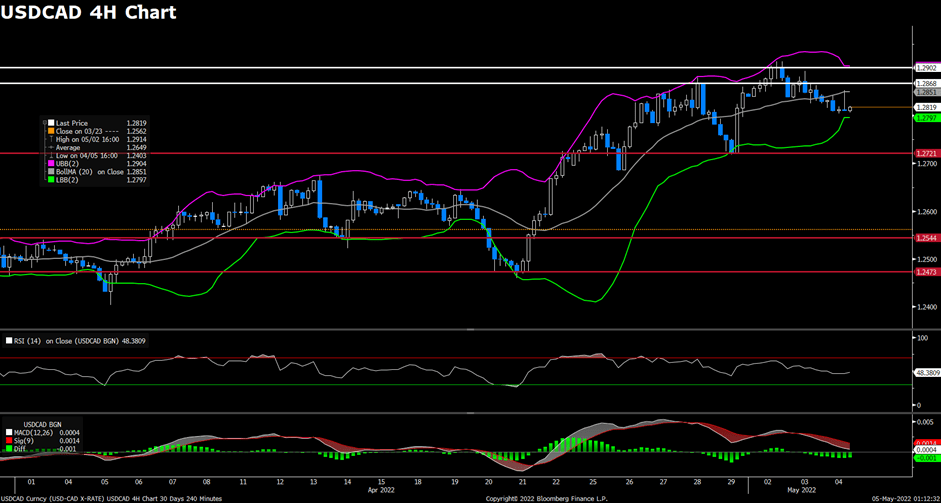
Despite the release of the hotter-than-expected US CPI data, the pair USD/CAD has been choppy in the US session and retreated from the 1.303 level amid US dollar weakness. The pair witnessed heavy selling and tumbled to a daily low near the 1.293 level at the start of the US session, then regained some bullish momentum and recovered some of its daily losses. USD/CAD is trading at 1.2980 at the time of writing, losing 0.36% daily. But the risk-sensitive loonie is under pressure once again on Wednesday as investors are concerned that the Fed will tighten its policy more aggressively this year due to higher inflation. On top of that, surging crude oil prices have provided some support to the commodity-linked loonie and dragged the USD/CAD pair lower. WTI extended its rally towards the $106 per barrel area, as the EU is closer to an agreement on a ban on all Russian oil imports.
For the technical aspect, the RSI indicator is 54 figures as of writing, suggesting that the upside is more favored as the RSI stays above the mid-line. But for the Bollinger Bands, the price failed to rise higher and dropped below the moving average, therefore the downside momentum should persist. In conclusion, we think the market will be bearish as long as the 1.3046 resistance line holds. If USD/CAD dips below the 1.2917 support level, technicians could pull the pair down toward the 1.2850 area.
Resistance: 1.3046, 1.3113
Support: 1.2917, 1.2725, 1.2665
Economic Data
| Currency | Data | Time (GMT + 8) | Forecast |
| GBP | GDP (YoY) (Q1) | 14:00 | 9.0% |
| GBP | GDP (QoQ) (Q1) | 14:00 | 1.0% |
| GBP | GDP (MoM) | 14:00 | 0.0% |
| GBP | Manufacturing Production (MoM) (Mar) | 14:00 | -0.5% |
| GBP | Monthly GDP 3M/3M Change | 14:00 | 1.0% |
| USD | Initial Jobless Claims | 20:30 | 195K |
| USD | PPI (MoM) (Apr) | 20:30 | 0.5% |