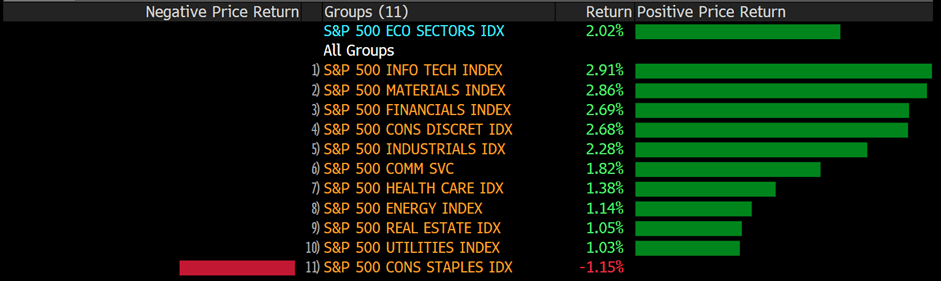
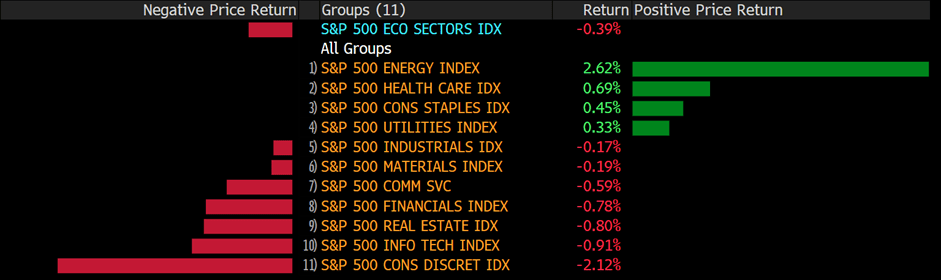
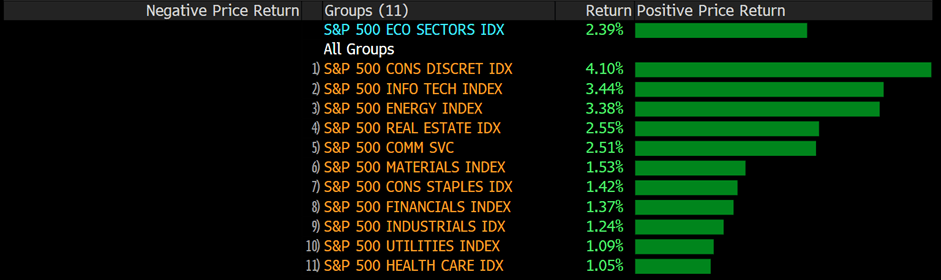
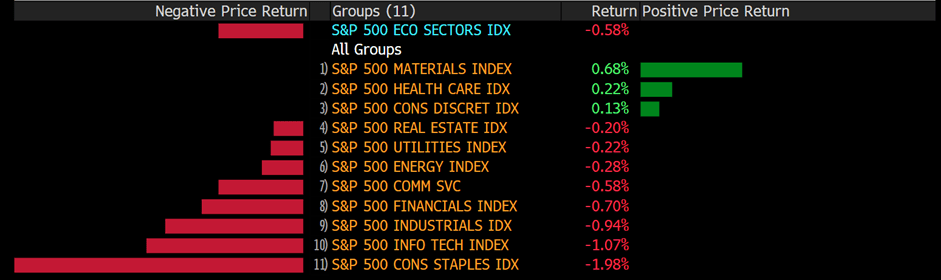
U.S. equities markets attempted to rebound from Wednesday’s sluggish performance but failed to do so during Thursday’s trading session. The Dow Jones Industrial Average fell another 0.75% to close at 31253.13. The S&P500 lost 0.58% to close at 3900.79. The Nasdaq Composite slid 0.26% to close at 11388.5. Market participants poured into U.S. equities at the start of the trading session, but equities could not preserve momentum and began to fall towards the end of the trading session.
U.S. equity markets are set to experience more volatility during the last trading day of the week as option expiration day occurs. According to the CBOE’s calculations, around $1.9 trillion worth of derivatives is set to expire on the 20th– $ 460 billion of single stock derivatives and $855 billion of S&P 500 linked contracts. Options trading volume has reached an all-time high as market participants engage in risk hedging and speculation. The expiring S&P 500 options show a high concentration around the 4000 strikes.
U.S. weekly jobless claims rose to 218,000, compared to 197,000 in the previous report, marking a four-month high and a potential slow down of the labor market shortage. It is also important to note that while jobless claims have been increasing, continuing claims on the other hand are trending lower—indicating that hiring in the labor market is still active and workers are still experiencing a relatively easy process of switching between jobs.
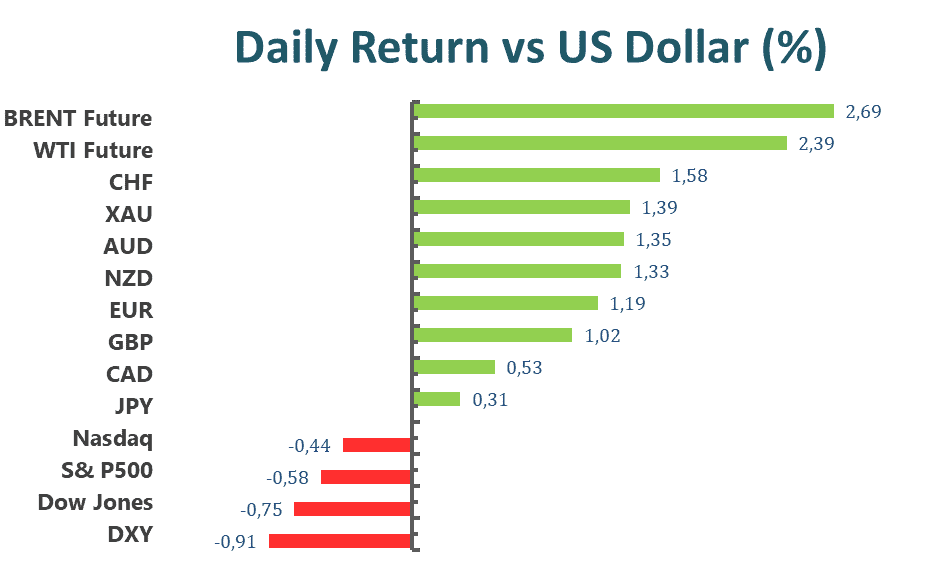
Main Pairs Movement
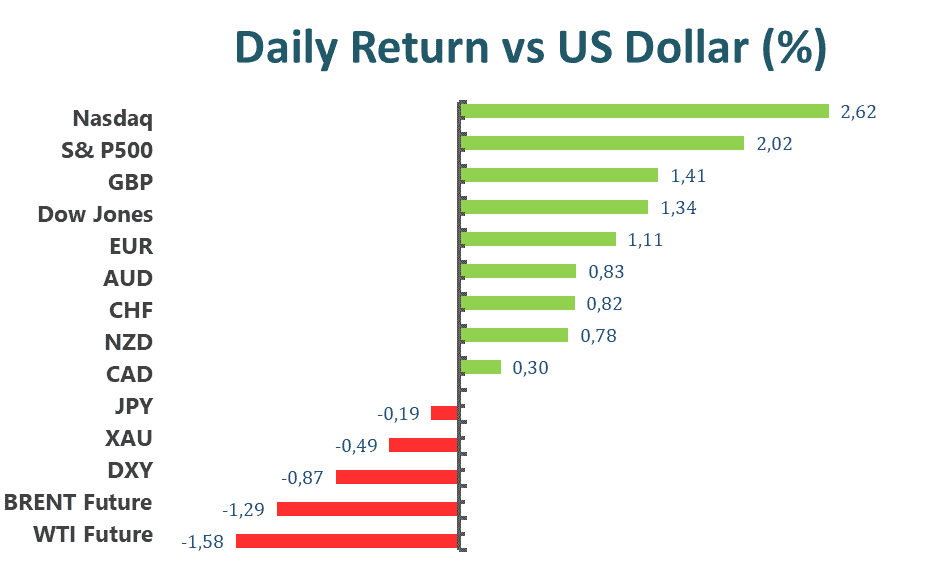
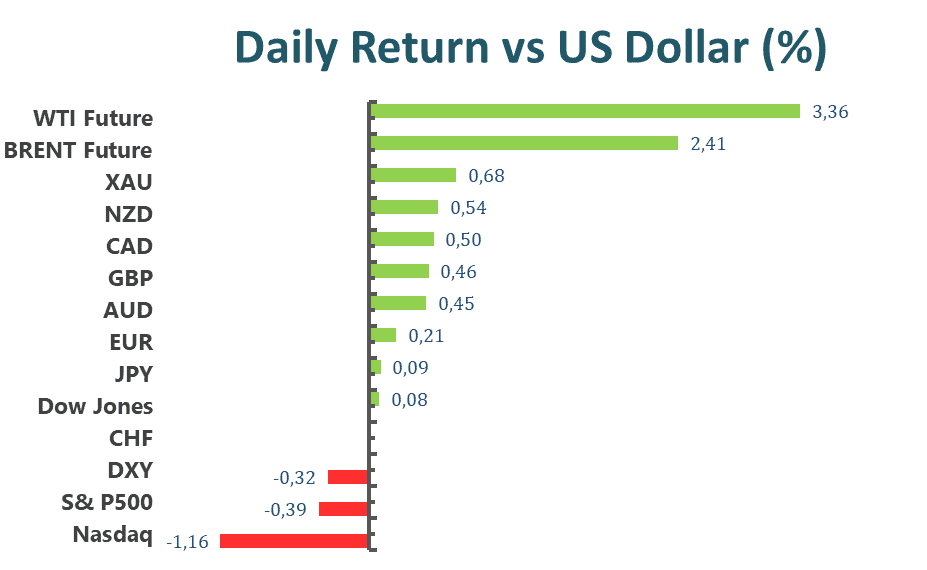
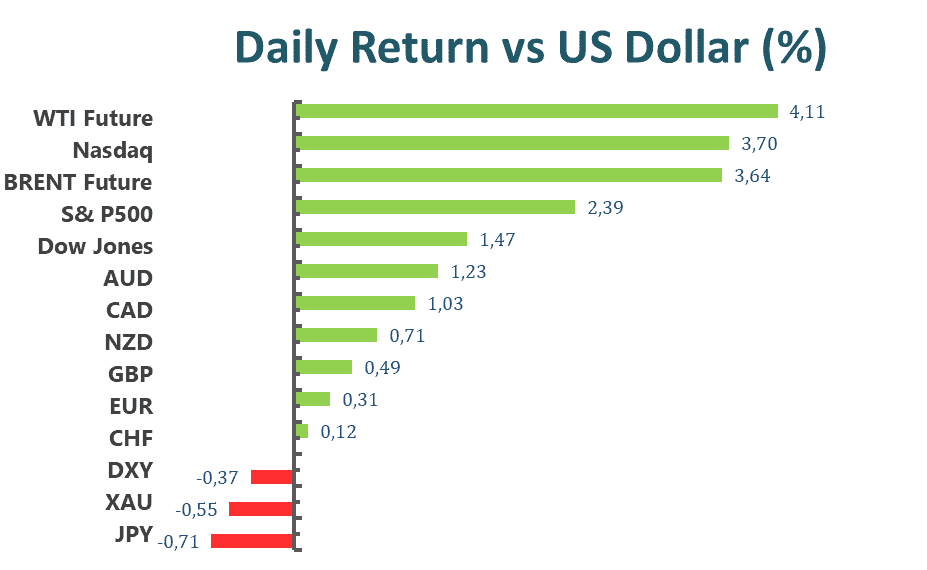
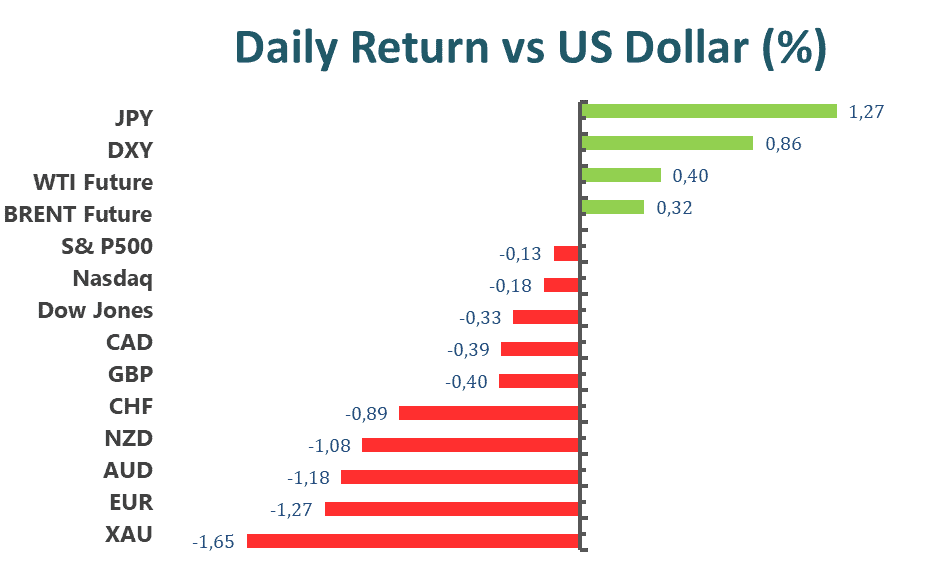
The Dollar index dropped 1% over the previous trading day. Recent weak corporate earnings results from the U.S. and a higher than projected jobless claims figure both helped extend a Dollar correction since last week.
EURUSD rose 1.15% over the previous trading day. Broad-based Dollar weakness buoyed the Euro against the Dollar. EURUSD has recovered close to 2% since dropping to its multi-year low on May 12th.
GBPUSD rose 1.04% over the previous trading day. The Dollar selloff reversed the large drop in Cable on the 19th. Bearish sentiment, however, still surrounds Cable as U.K.’s economic outlook continues to look gloomy.
USDCAD dropped 0.49% over the previous trading day. In addition to the broad-based Greenback selloff, the Canadian Loonie continues to rise as global commodity prices climb.
Technical Analysis
EURUSD (4-Hour Chart)
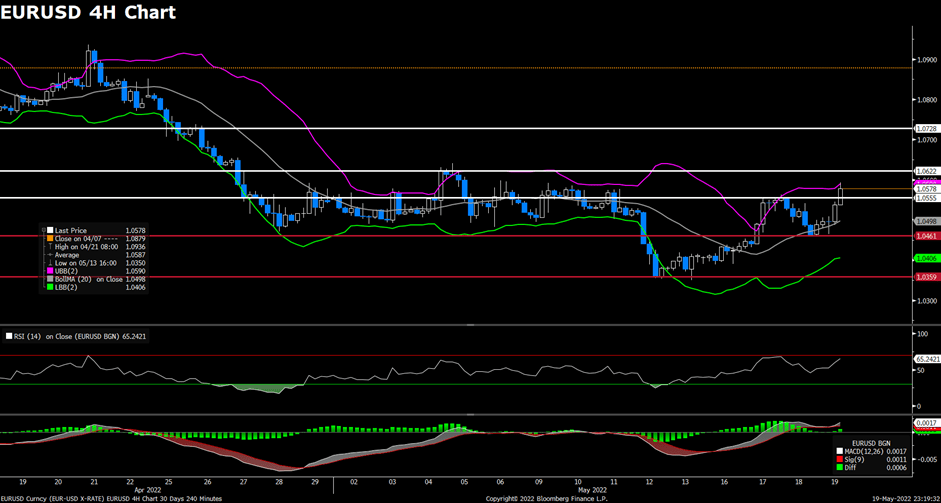
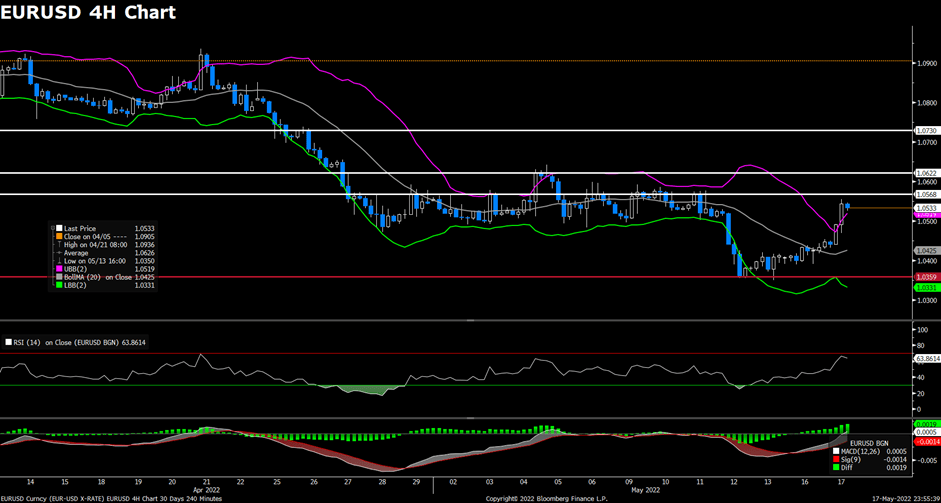
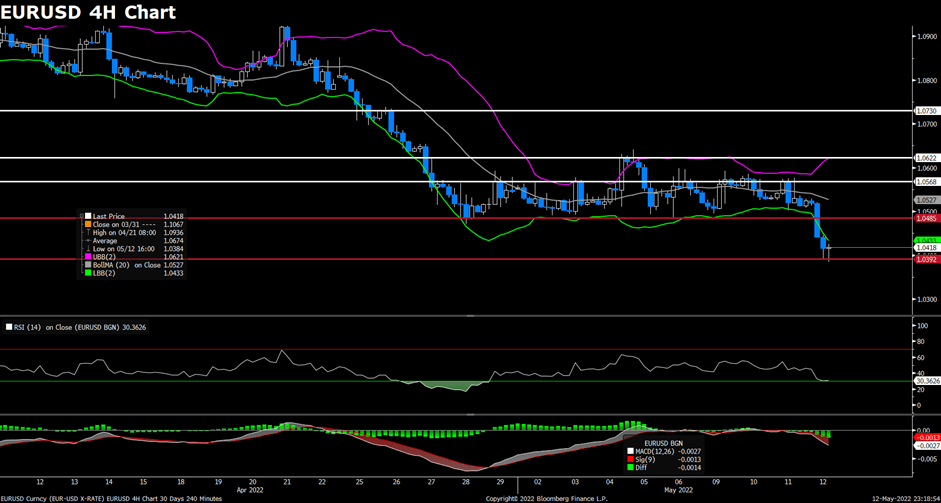
The EUR/USD pair advanced on Thursday, preserving its bullish momentum and extending its rally toward the 1.058 level amid a heavy selloff witnessed in the US dollar. The pair touched a daily low below the 1.047 level heading into the European session but then staged an impressive rebound to recover all of its daily gains. The pair is now trading at 1.0579, posting 1.12% gain on a daily basis. EUR/USD stays in the positive territory amid renewed US dollar weakness, as the falling US Treasury bond yields and disappointing US macro releases both weighed heavily on the greenback. Markets now also seem to have fully priced in at least a 50 bps rate hike move over the next two FOMC meetings. For the Euro, the minutes of the ECB’s Monetary Policy Meeting showed that policymakers are concerned about inflation, reinforcing the speculation that ECB could raise rates at some point in the summer if conditions warrant it.
For the technical aspect, the RSI indicator is 65 figures as of writing, suggesting that the pair is facing heavy bullish momentum as the RSI keeps heading north. As for the Bollinger Bands, the price rose from the moving average and reached the upper band, therefore a continuation of the upside trend can be expected for the pair. In conclusion, we think the market will be bullish as the pair is testing the 1.0555 resistance. A four-hour close above that level will favor the bulls.
Resistance: 1.0555, 1.0622, 1.0728
Support: 1.0461, 1.0359
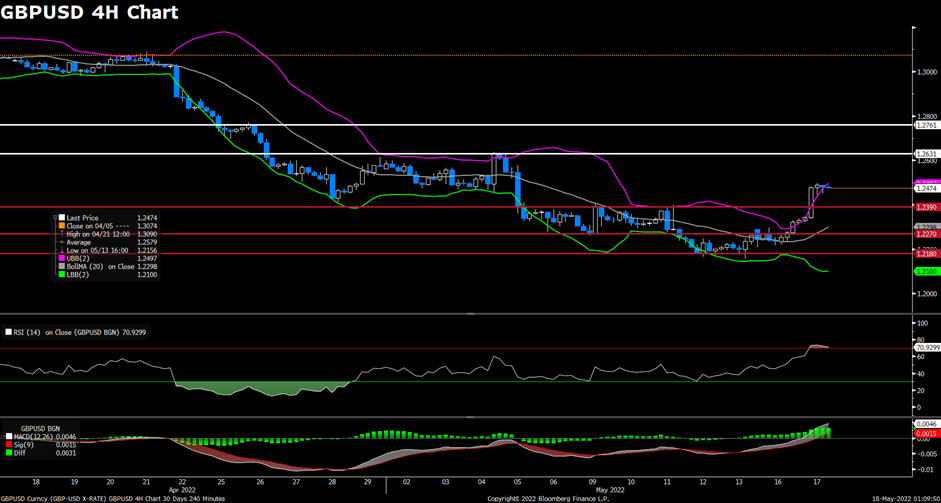
GBPUSD (4-Hour Chart)
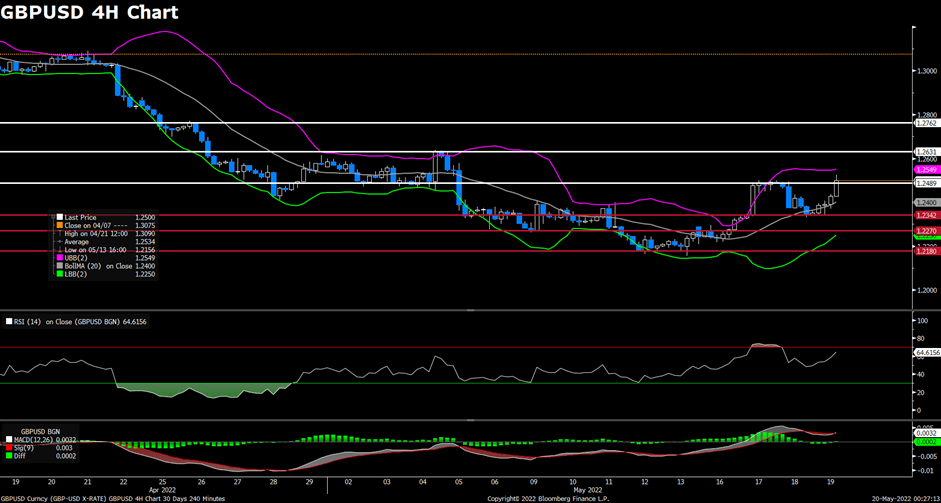
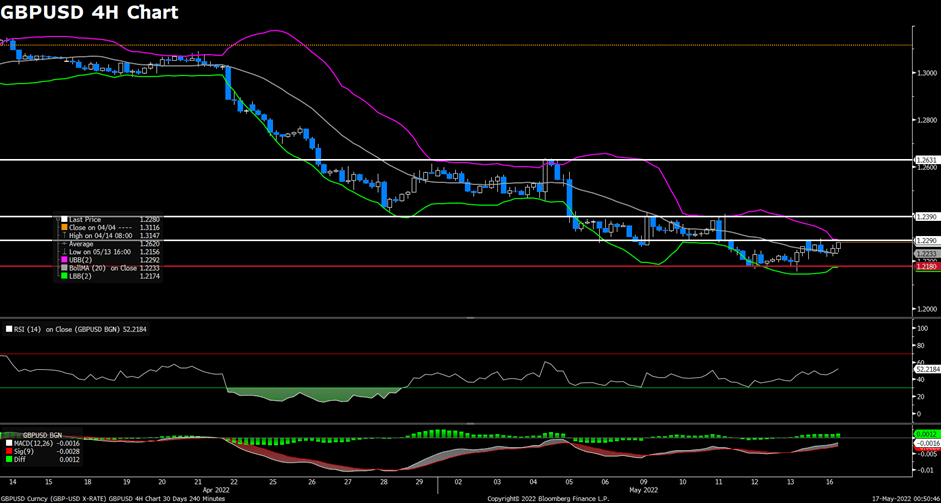
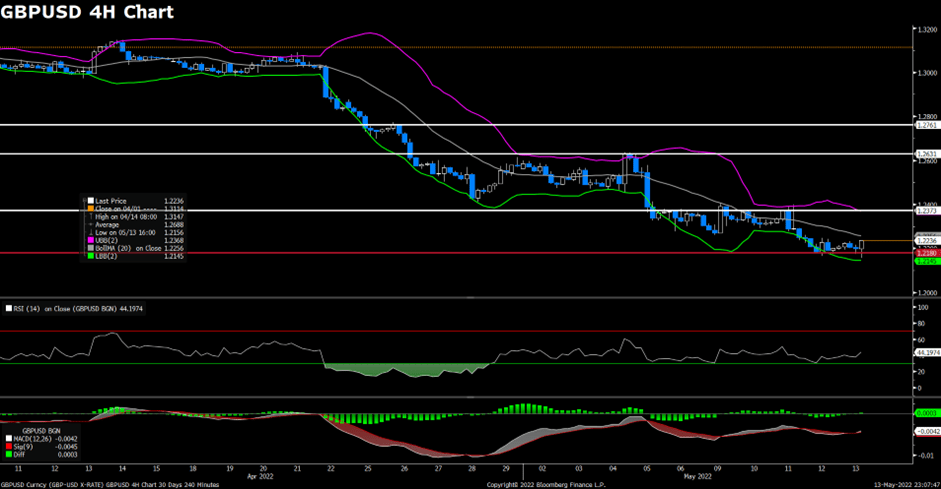
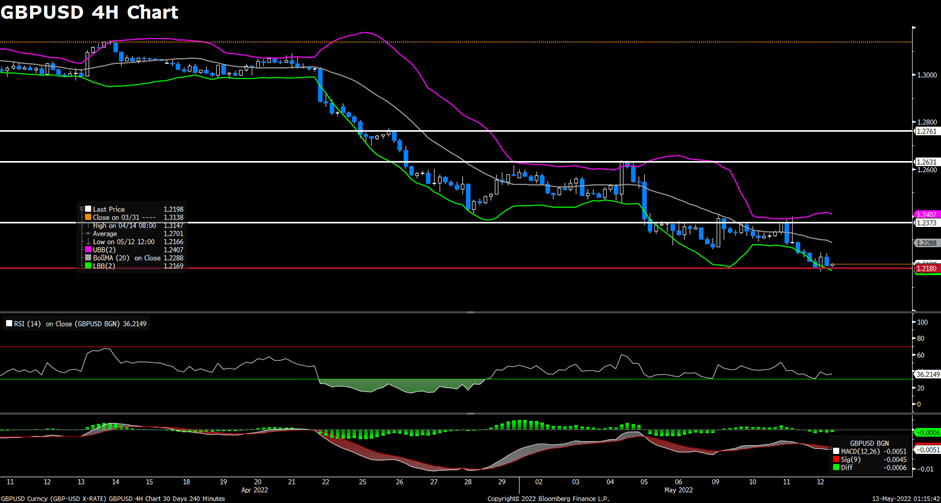
The pair GBP/USD surged on Thursday, gaining upside traction, and climbed to its strongest level in two weeks near 1.251 area amid a weaker US dollar across the board. The pair started to see heavy buying after touching a daily low below the 1.235 level, then extended its daily gains and climbed towards the 1.250 area in the early US trading session. At the time of writing, the cable stays in positive territory with a 1.33% gain for the day. The broad-based US dollar weakness is mainly due to weaker-than-expected US macroeconomic data releases and falling US bond yields, as the headline Manufacturing Activity Index fell to 2.6 in May and well below the market’s expectations for a reading of 16.0. Moreover, the Initial Weekly Jobless Claims also rose to 218K. For the British pound, the BoE tightening discussion will remain a key driver as Tuesday’s upbeat UK labor market report and higher UK Inflation data have revived some bets on BoE tightening.
For the technical aspect, the RSI indicator is 65 figures as of writing, suggesting that the upside is more favored as the RSI is reaching the overbought zone. For the Bollinger Bands, the price regained upside strength and rose from the moving average, indicating that the positive traction should persist. In conclusion, we think the market will be bullish as the pair is testing the 1.2489 resistance. GBP/USD could target 1.2631 if 1.2489 is confirmed as support and the rising RSI also reflects bull signals.
Resistance: 1.2489, 1.2631, 1.2762
Support: 1.2372, 1.2270, 1.2180
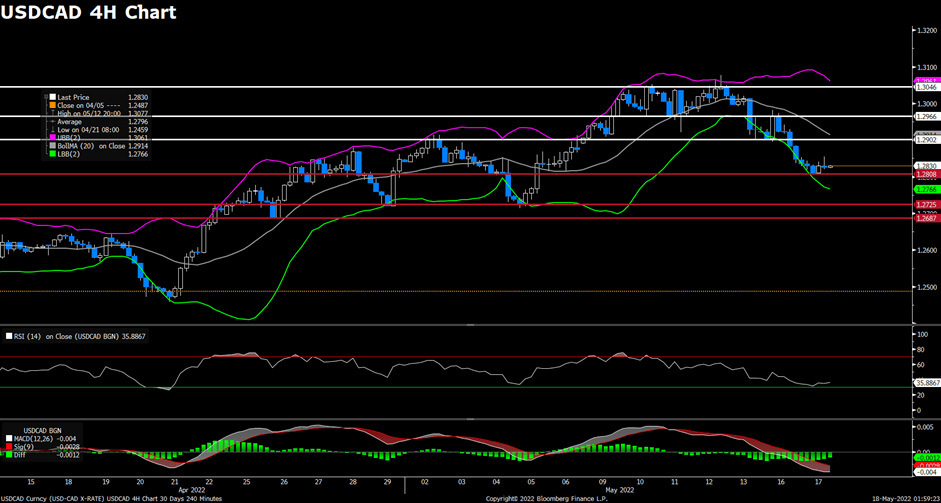
USDCAD (4-Hour Chart)
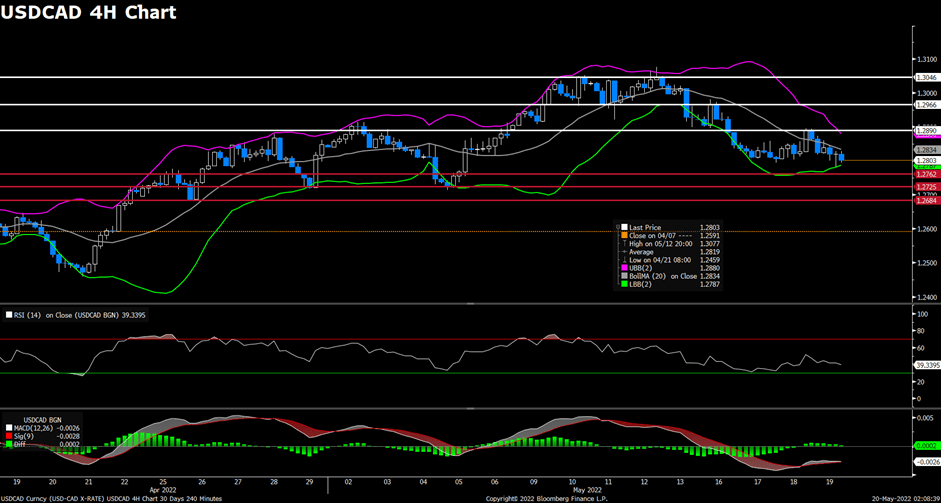
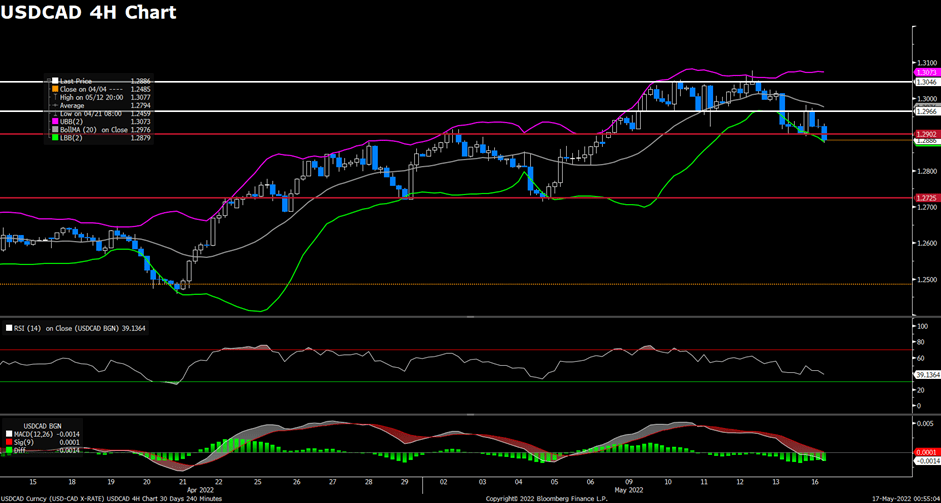
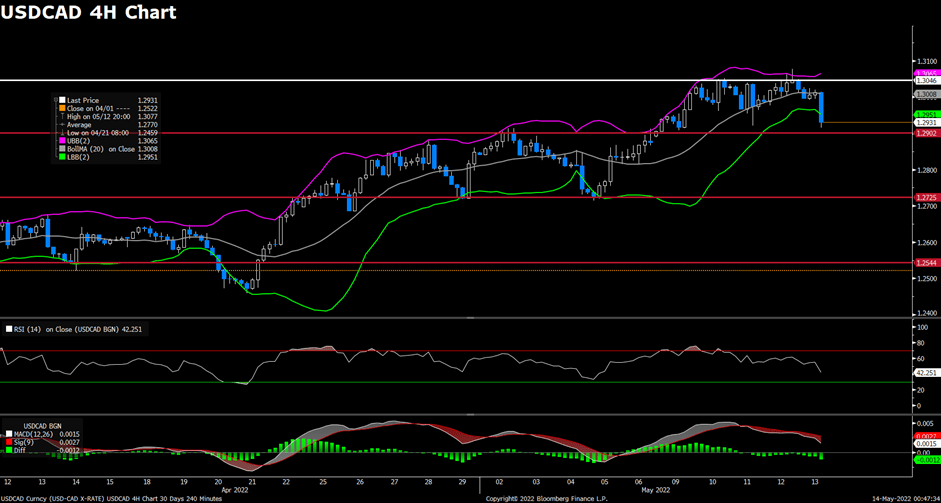
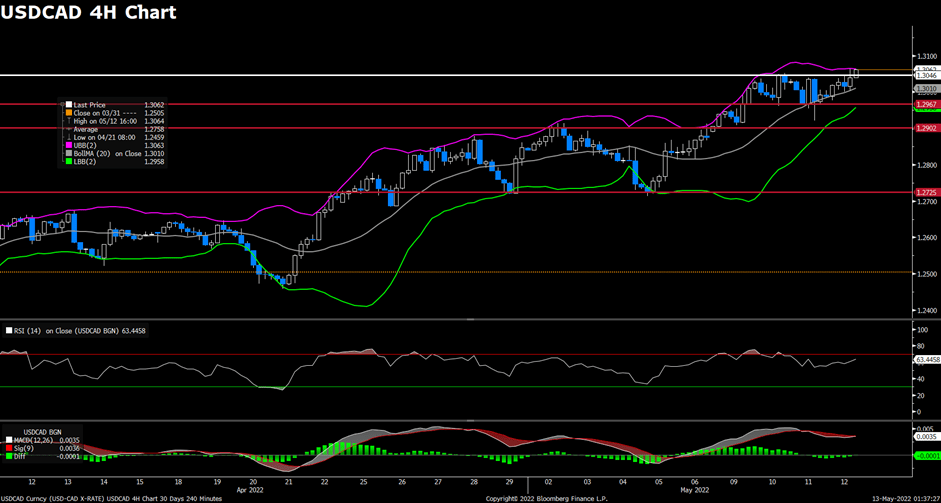
As the Canadian dollar drew support from strong domestic consumer inflation reports and the US dollar remained under bearish pressures, the pair USD/CAD was surrounded by downside momentum and dropped back towards the 1.2800 area. The pair attracted heavy selling during the Asian session, then preserved its downside traction and refreshed its daily low below the 1.2790 level in the early US session. USD/CAD is trading at 1.2803 at the time of writing, losing 0.70% daily. The retreating US Treasury bond yields are acting as a headwind for the US dollar and exerting downward pressure on the USD/CAD pair. On top of that, the surging crude oil prices also provided strong support to the commodity-linked loonie as WTI has recovered back to $110 per barrel area. The easing lockdown restrictions in China and ongoing oil supply concerns have both underpinned the global demand for crude oil.
For the technical aspect, the RSI indicator is 39 figures as of writing, suggesting that downside is more favored as the RSI stays below the mid-line. For the Bollinger Bands, the price resumed its decline and crossed below the moving average, therefore the downside traction should persist. In conclusion, we think the market will be bearish as long as the 1.2890 resistance line holds. On the downside, a four-hour close below the 1.2762 support could open the door for additional losses.
Resistance: 1.2890, 1.2966, 1.3046
Support: 1.2762, 1.2725, 1.2684
Economic Data
| Currency | Data | Time (GMT + 8) | Forecast |
| CNY | PBoC Loan Prime Rate | 09:15 | |
| GBP | Retail Sales (MoM) (Apr) | 14:00 | -0.2% |