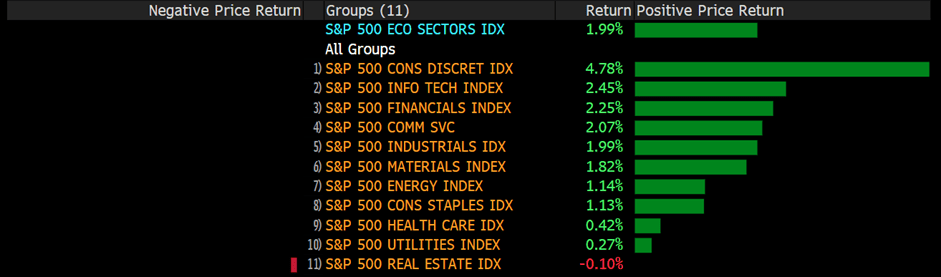
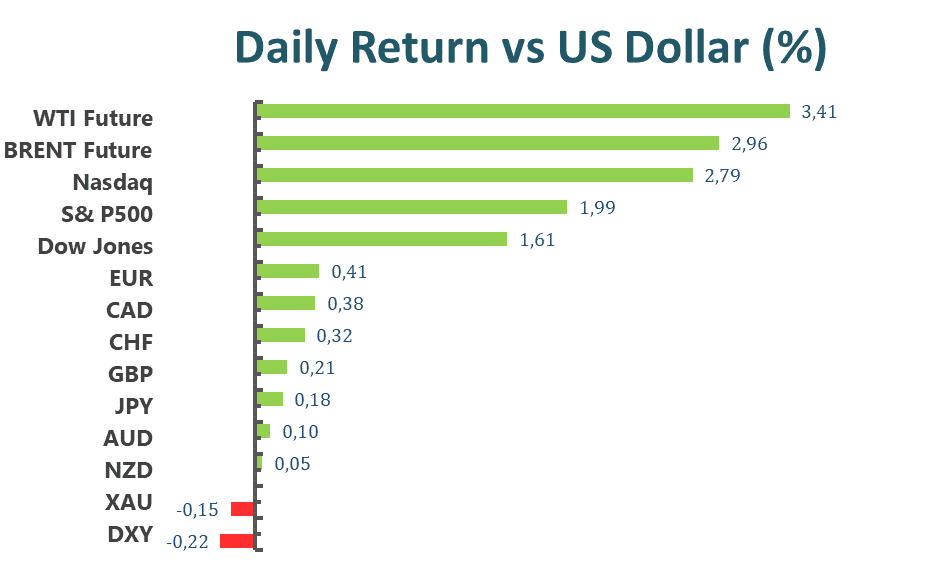
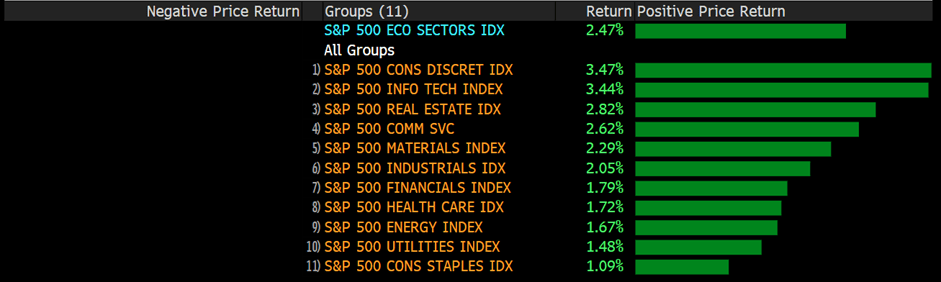
U.S. equity markets ended the week on a high note. The Dow Jones industrial average rose 1.76% to close at 33212.96. The S&P 500 jumped 2.47% to close at 4158.24. The Nasdaq composite leaped 3.33% to close at 12131.13. Friday’s rally in equities was assisted by the personal consumption expenditure price index, which rose 4.9% over April, coming in as expected and showing signs of a decelerating inflationary environment. Market participants gained confidence in equities after the FOMC minutes, released on Wednesday, which did not indicate a more hawkish tone but rather a Fed that was eager to expedite the tightening of its balance sheet.
On the economic docket, EU leaders are meeting on Monday the 30th, and China’s PMI and the EU CPI will be released on the 31st. On June 1st, Australian GDP, Germany, and Britain PMI, and the U.S. ADP nonfarm employment change data will be released. On June 2nd, Australian retail sales and U.S. initial jobless claims will be released. On June 3rd, market participants will be focused on the U.S. May nonfarm payrolls and unemployment rate.
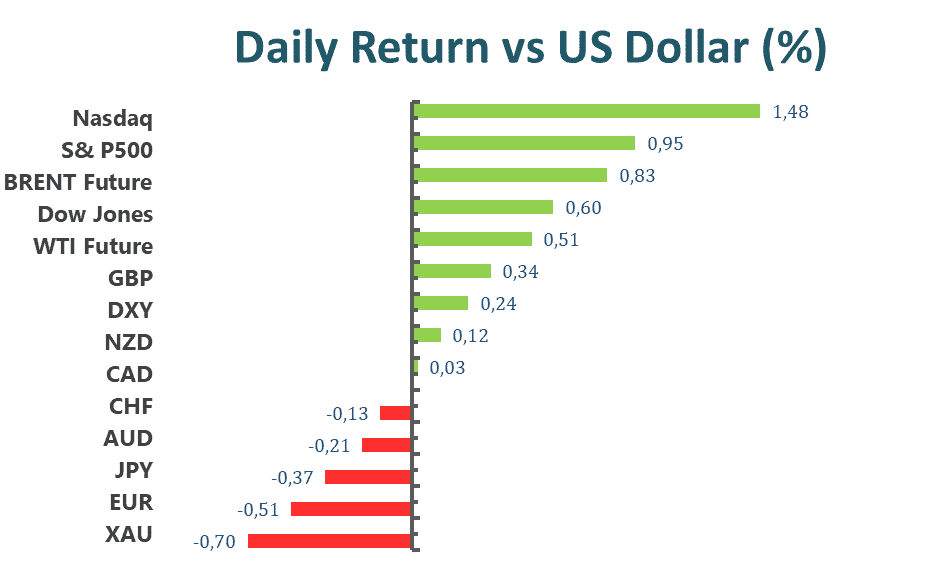
Main Pairs Movement
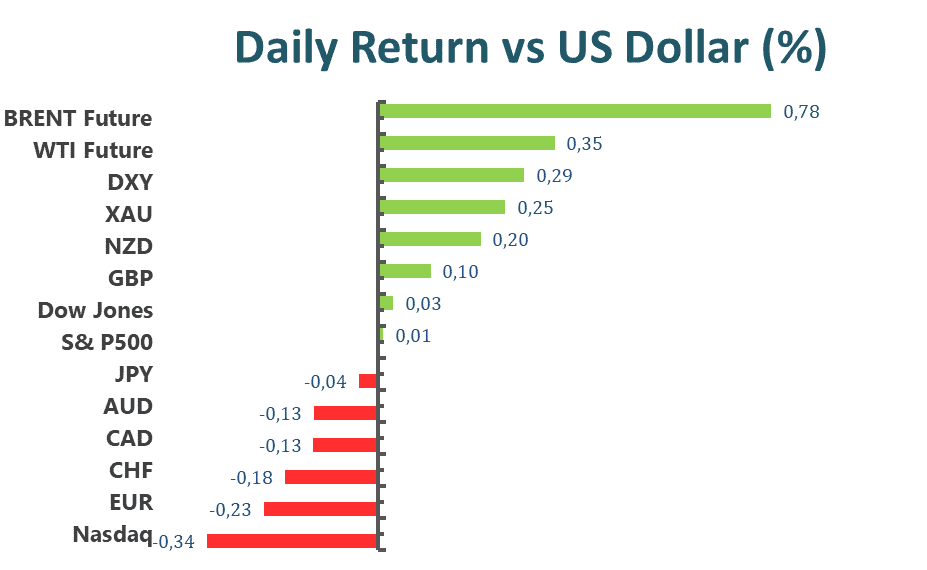
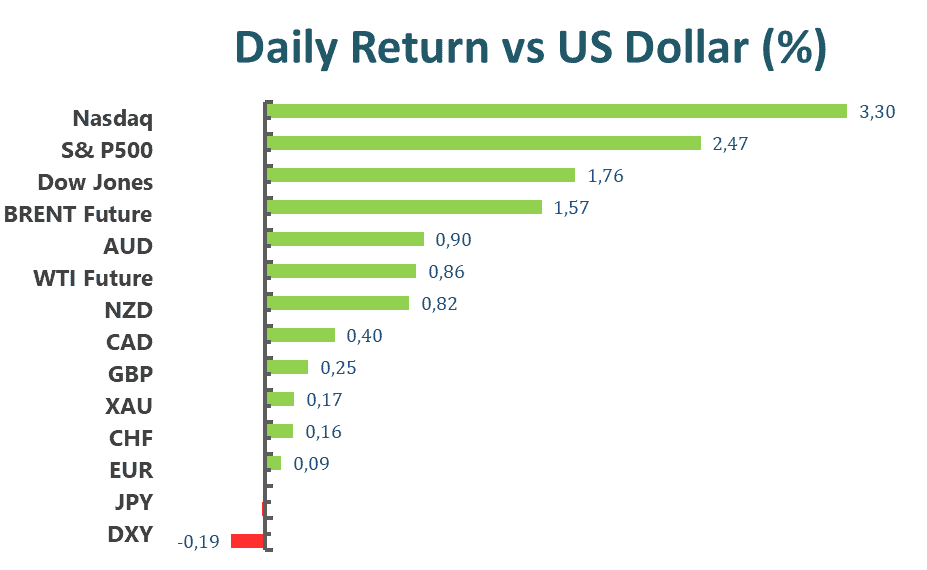
The dollar index continued to fall on Friday. The index dropped 0.12% to close around the 101.66 regions. The improved risk environment in US equities encouraged market participants to rotate into equities. The benchmark U.S. 10-year Treasury yield retreated to 2.743%.
EURUSD rose 0.12% throughout Friday’s trading. Risk on the environment helped buoyed the Euro against the Dollar; furthermore, the ECB’s hawkish tone should help the shared currency over the longer horizon.
GBPUSD rose 0.22% throughout Friday’s trading. A one-time fiscal stimulus from the British government helped boost the Pound against the Dollar. Strong resistance sits around the 1.26 price region.
USDCAD dropped 0.4% throughout Friday’s trading. The Canadian Loonie continued to rise against the dollar as oil prices recover above the $113 per barrel price level. The Risk-On environment also diminished the demand for safe-haven assets, such as the U.S. Greenback.
Technical Analysis
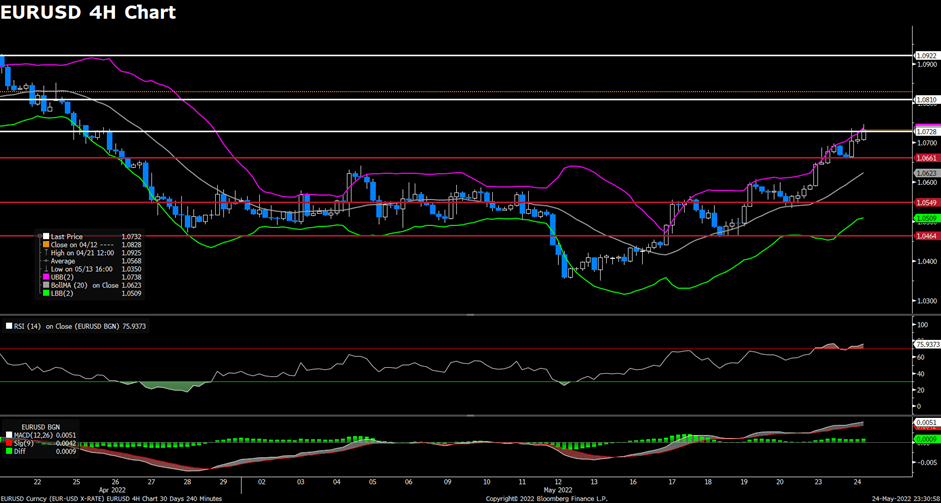
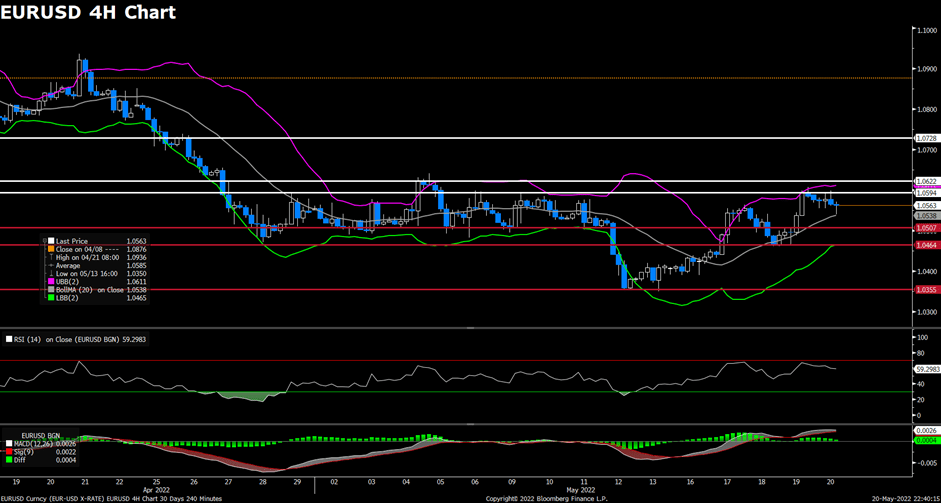
EURUSD (4-Hour Chart)
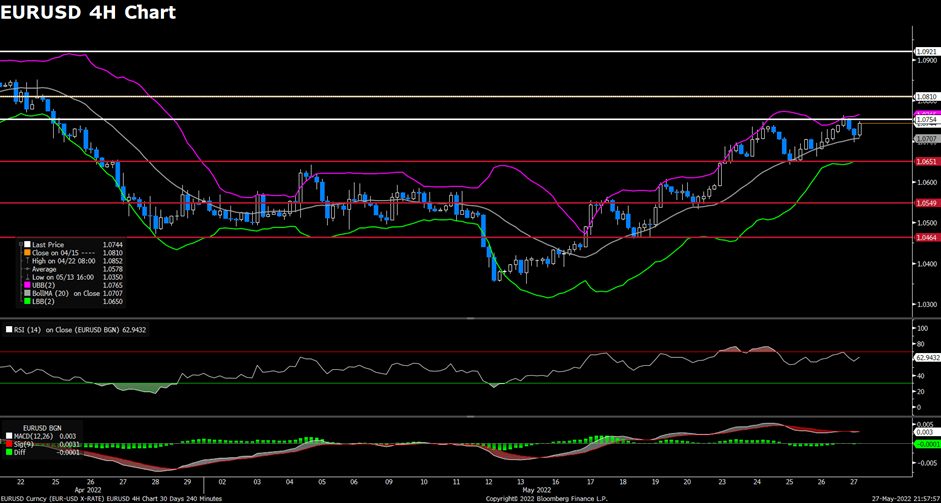
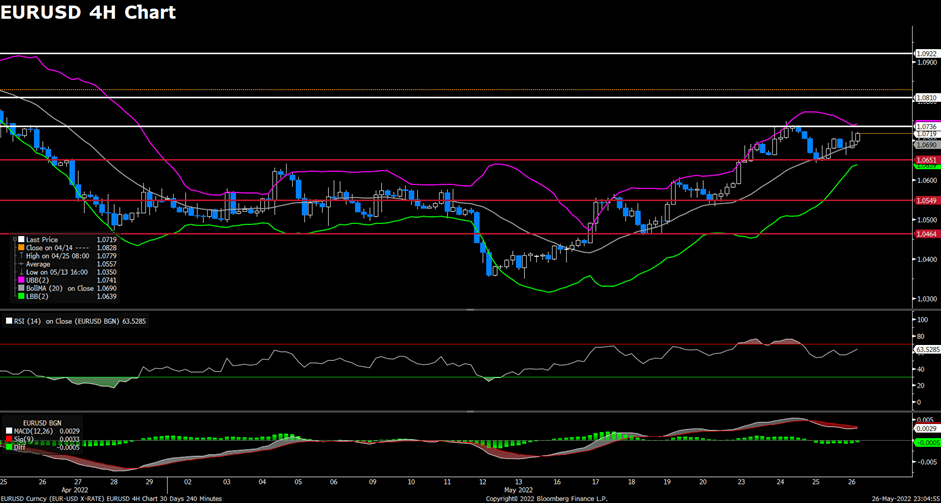
The EUR/USD pair consolidated on Friday, staying in the lower half of its daily range and hovering around the 1.071 area amid mixed market sentiment. The pair was trading higher and touched fresh monthly highs near the 1.0770 level in the Asian session, but then retreated to erase most of its daily gains. The pair is now trading at 1.0744, posting a 0.21% gain daily. EUR/USD stays in the positive territory amid slightly US dollar weakness, as the US annual Core PCE inflation in April fell to 4.9% and failed to surprise the markets. The expectation that the Fed could pause or slow down the rate hike cycle once rates have reached the neutral level later in the year is also exerting some bearish pressure on the greenback. For the Euro, the ECB Governing Council member Pablo Hernandez de Cos said that the first-rate hike will come shortly after they end the QE in Q3, which provided some support for the pair.
For the technical aspect, the RSI indicator is 63 figures as of writing, suggesting that the upside is more favored as the RSI stays above the mid-line. As for the Bollinger Bands, the price regained upside traction and climbed toward the upper band, therefore a continuation of the upside trend could be expected. In conclusion, we think the market will be bullish as the pair is ready to test the 1.0754 resistance. A break above that resistance will lead to further gains and technical readings also favor a bullish continuation.
Resistance: 1.0754, 1.0810, 1.0921
Support: 1.0651, 1.0549, 1.0464
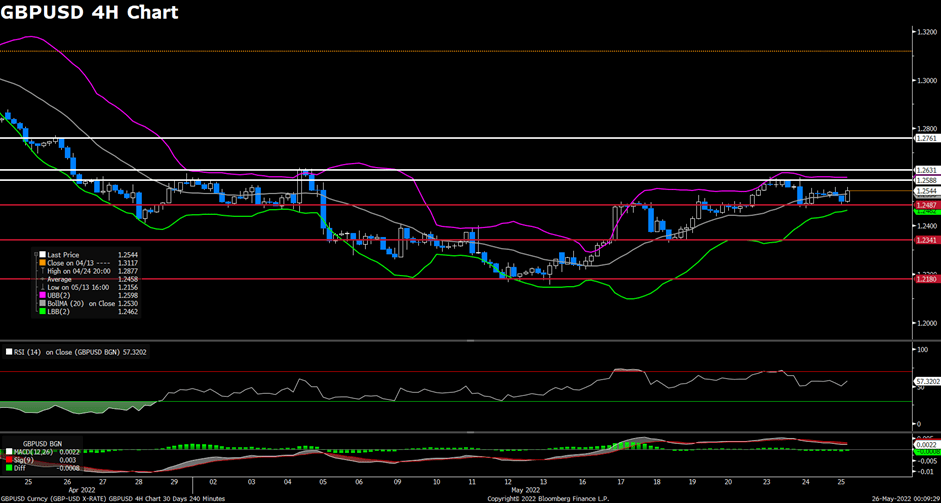
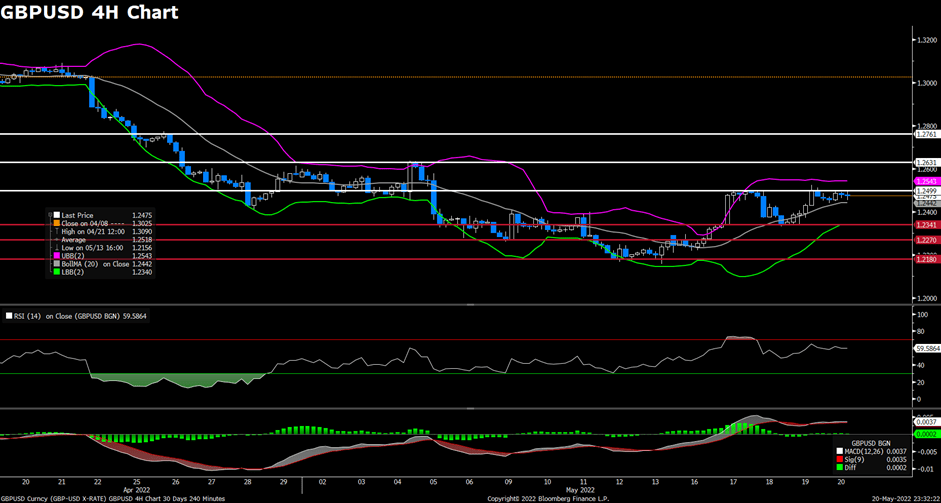
GBPUSD (4-Hour Chart)

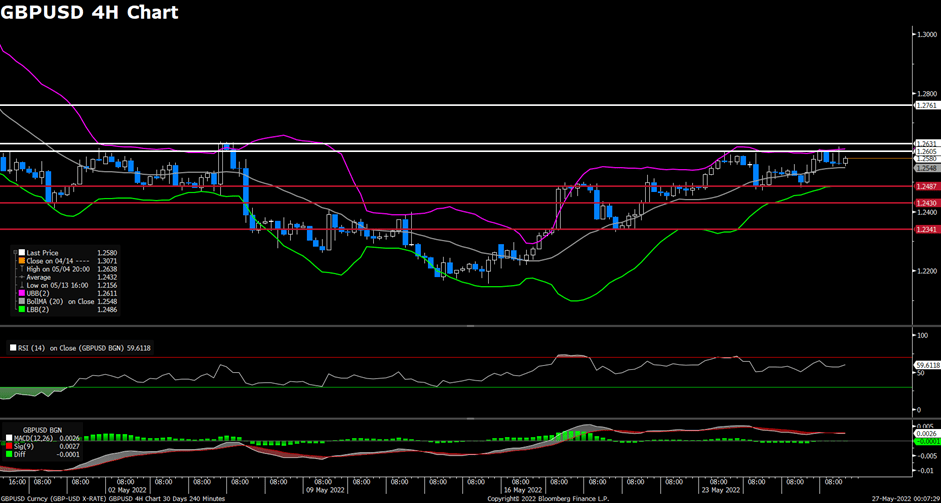
The pair GBP/USD advanced on Friday, retreated slightly from one-month highs in the 1.2660 area but regained upside momentum after the release of US PCE data. The pair gather bearish momentum and dropped to a daily low below the 1.2590 level during the European session, then rebounded back toward the 1.265 area heading into the US session. At the time of writing, the cable stays in positive territory with a 0.42% gain for the day. The annual Core PCE Price Index, which the Fed uses when conducting its monetary policy, failed to underpin the US dollar as the number in April came in line with the market expectation of 4.9%. The data also reduced the pressure on the Fed to tighten monetary policy at a faster pace. For the British pound, the focus remained on the fiscal stimulus plan that the UK government announced on Thursday as they will send one-off payments of £650 to lowest-income households to help them with rising prices. Therefore, the fiscal stimulus helped the cable to find demand.
For the technical aspect, the RSI indicator is 64 figures as of writing, suggesting that the upside is preserving strength as the RSI keeps heading north. For the Bollinger Bands, the price continued to rise toward the upper band, indicating that the upside traction should persist. In conclusion, we think the market will be bullish as the pair is testing the 1.2635 resistance. Sustained strength above that resistance could open the road for additional gains.
Resistance: 1.2635, 1.2761, 1.2865
Support: 1.258, 1.2501, 1.2341
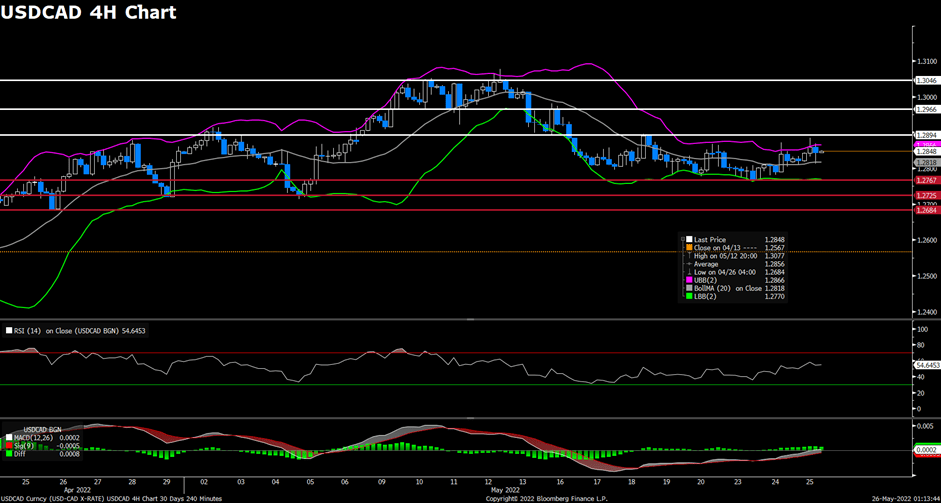
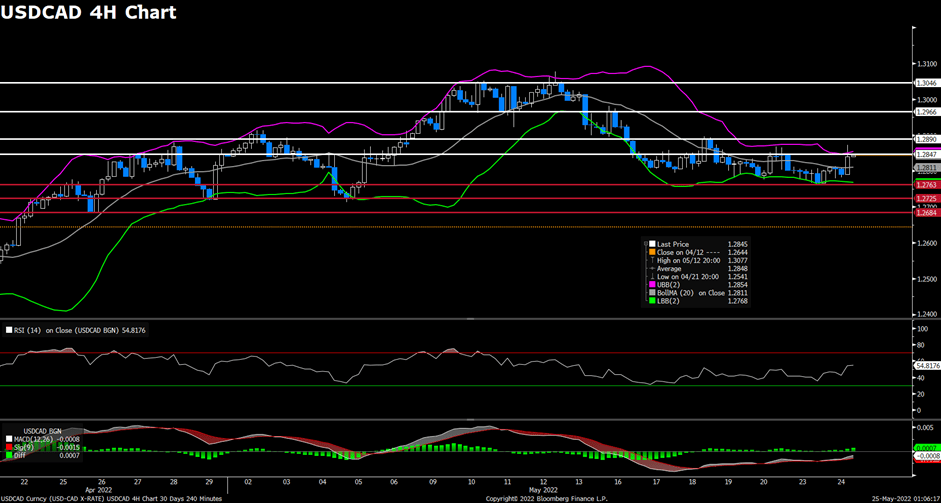
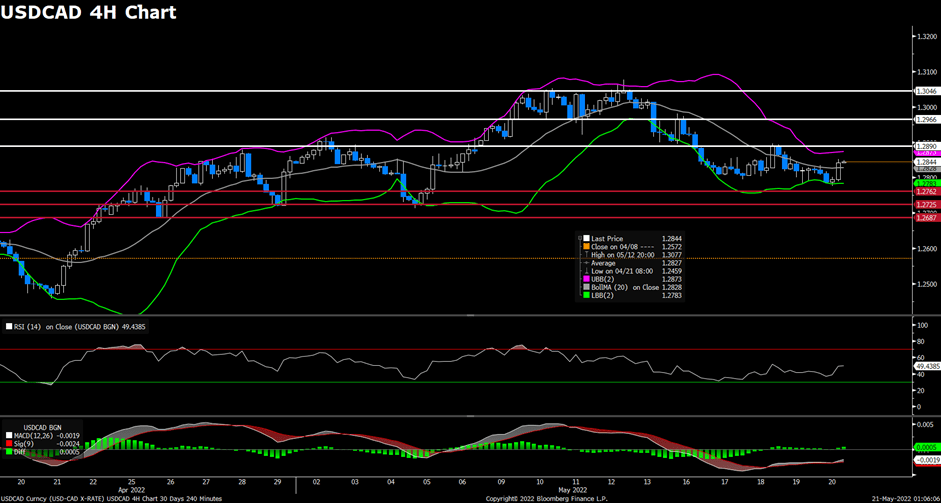
USDCAD (4-Hour Chart)
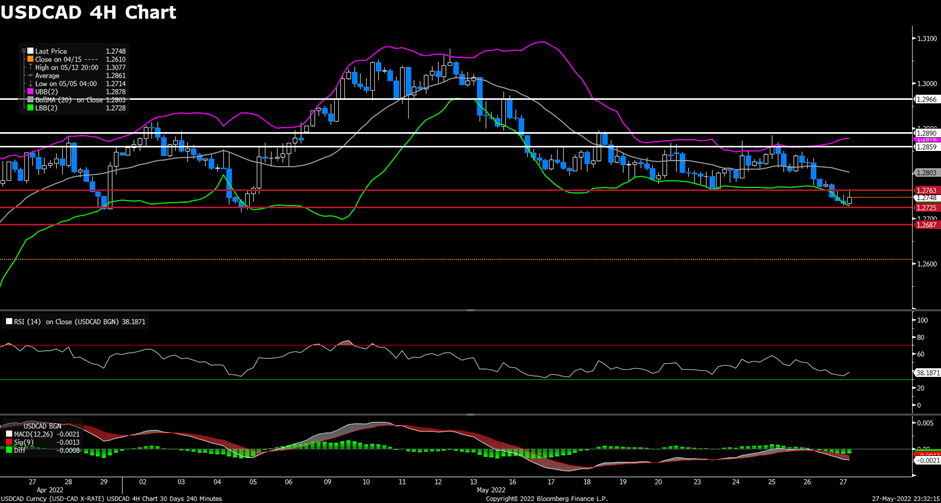
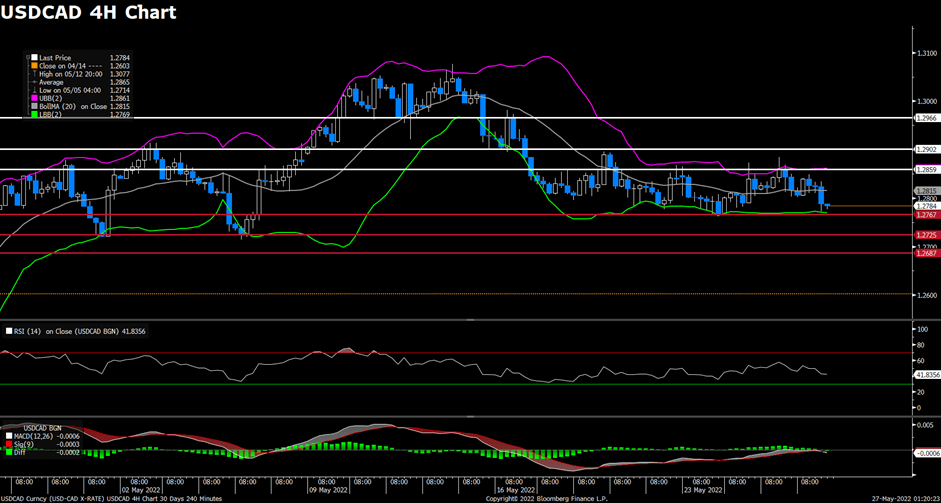
As the softer-than-expected US PCE Price Index data in April failed to impress the USD bulls on Friday, the pair USD/CAD remained under pressure and maintained its offered tone below the 1.275 level. The pair were surrounded by bearish momentum during the first half of the day, then preserved its downside traction and refreshed its daily lows near the 1.2730 mark ahead of the US session. USD/CAD is trading at 1.2746 at the time of writing, losing 0.19% daily. The speculations that the Fed could pause or slow down the rate hike cycle later this year were reaffirmed as the US PCE data indicated that inflationary pressures in the US might be easing. On top of that, the retreating crude oil prices failed to lift the USD/CAD pair higher as WTI has stabilized just below monthly highs near the $113 per barrel area. But the expectations for strong US fuel demand as peak driving season approaches might limit the losses for the black gold.
For the technical aspect, the RSI indicator is 37 figures as of writing, suggesting that the downside is more favored as the RSI stays below the mid-line. For the Bollinger Bands, the price continued to move alongside the lower band, therefore the downside traction should persist. In conclusion, we think the market will be bearish as the pair has already broken below the previous support at 1.2763. If the pair falls below the next support at 1.2725 and starts using it as resistance, further losses can be expected.
Resistance: 1.2859, 1.2890, 1.2966
Support: 1.2763, 1.2725, 1.2687