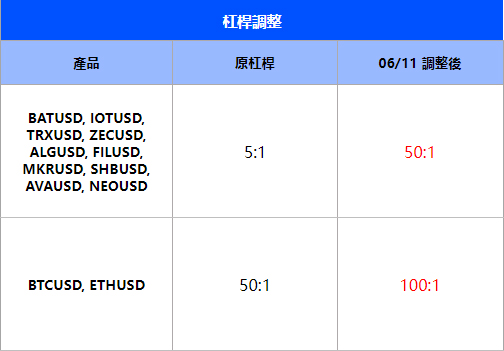
To provide a more favorable trading environment to our clients, VT Markets will modify the leverage of the following products:
1. The leverage of BATUSD, IOTUSD, TRXUSD, ZECUSD, ALGUSD, FILUSD, MKRUSD, SHBUSD, AVAUSD and NEOUSD will be 50:1.
2. The leverage of BTCUSD and ETHUSD will be 100:1.
The modifications will be put into effect from 2022/06/11.
Notes: The figures above are only for reference. The actual execution data should be subject to the numbers on MT4/MT5.
Friendly reminders: 1. All specifications of Indices remain the same except leverage. 2. Open positions can be kept after the modifications. 3. Margin levels might be affected by the modifications. Please ensure sufficient funds in your trading account to keep holding your open positions.
If you’d like more information, please don’t hesitate to contact [email protected]
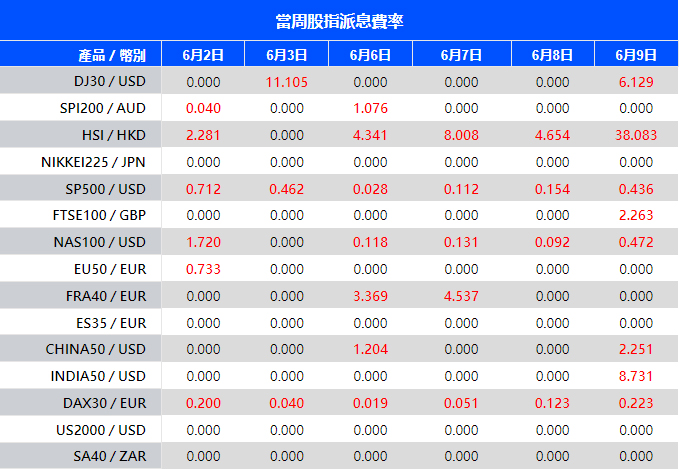
Warmly reminds you that the component stocks in the stock index spot generate dividends. When dividends are distributed, VT Markets will make dividends and deductions for the clients who hold the trading products after the close of the day before the ex-dividend date.
Indices dividends will not be paid/charged as an inclusion along with the swap component. It will be executed separately through a balance statement directly to your trading account, the comment for which will be in the following format “Div & Product Name & Net Volume ”.
Please note the specific adjustments as follows:
Note: The above data is for reference only, the actual execution date may be changed, please refer to the MT4/MT5 software for details.
If you’d like more information, please don’t hesitate to contact [email protected]
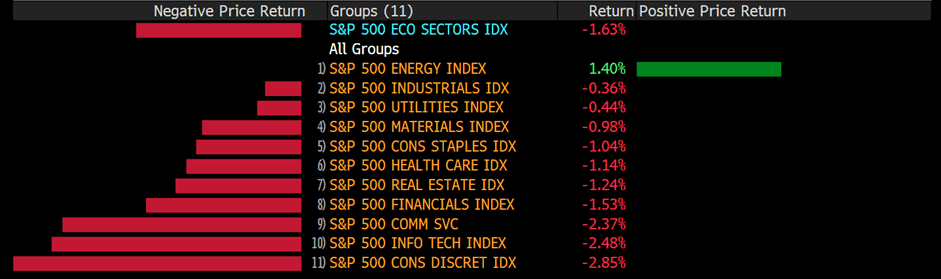
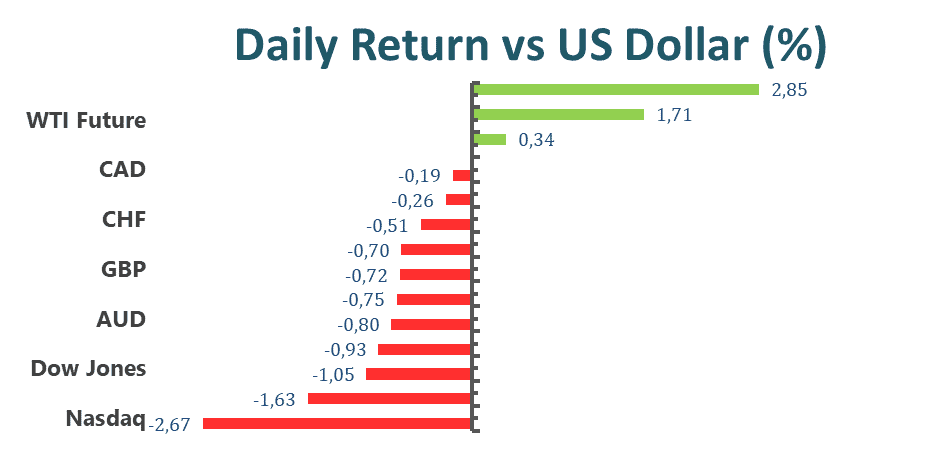
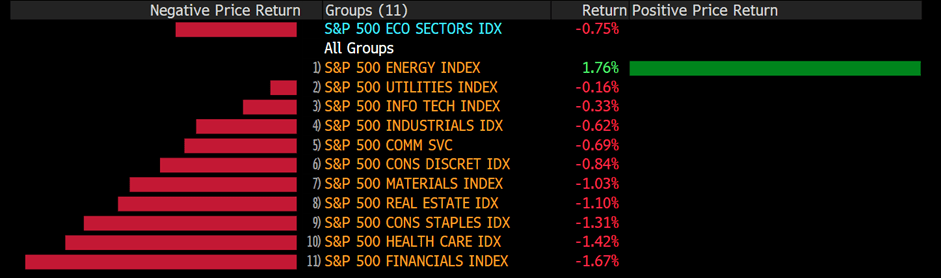
US equities resumed on Friday amid the fears of an economic slowdown and soaring pace of inflation, despite the US economy adding 390,000 jobs in May, better than expected, by 328,000. The Nasdaq Composite slumped 2.67% while the Dow Jones Industrial Averages dropped 1.05%. The S&P 500 declined 1.67% to end the week, tipping the benchmark index into negative territory for the eighth week. The risk sentiment occurred after May hiring economic data. A better-than-expected hiring data suggested that the US labour market remains robust enough for the US Fed to continuously raise interest rates quickly in response to the roaring inflation.
Shares of Tesla fell following the news from Elon Musk that commented on cutting its employment by around 10%. Tesla’s stock price plunged around 20% since the news of acquiring Twitter Inc. At the same time, anxiety about the global market from China also weighed on the company, which has weathered worldwide supply shortages. Tesla has EV factories in the US, Berlin, and China; culling 10% of jobs could equate to losing nearly 10,000 people as Tesla has roughly 100,000 staff worldwide. The move from Tesla could be a caution and a challenge for the economy.
Main Pairs Movement
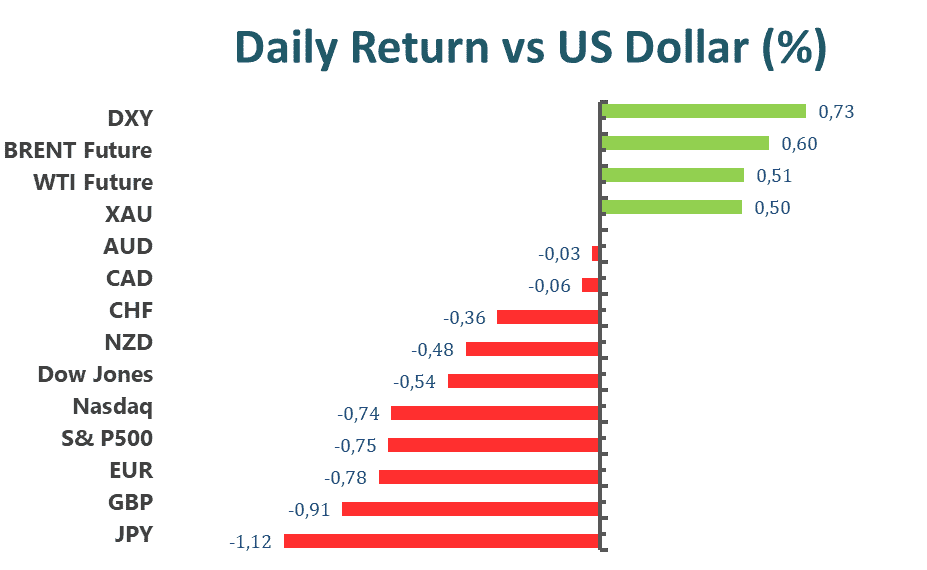
WTI held near Thursday’s high on Friday despite OPEC+ making a surprising decision, planning to boost output for July and August by 50%, likely a response to US pressure. However, crude oil prices held steadily high as the extra barrels probably still cannot offset Russian supply gaps. Beyond the immediate term, any further spending on OPEC+ spare capacity might suggest an upside for crude oil.
Gold declined nearly 1% on Friday after better- than- expected US labour report. A robust US employment in May suggested that the economy remains to power forward; with that being said, the US Fed has enough reasons to tackle the soaring inflation by raising interest rates.
USD/JPY extended rebound, heading toward 131.00. The Japanese Yen weakened as the Bank of Japan’s Kuroda reiterated his strong support for easing policy with Japan’s PMI came in firmer. At the end of the day, USD/JPY closed at 130.816, reversing the pullback from the three-weeks top.
Technical Analysis
EURUSD (4-Hour Chart)
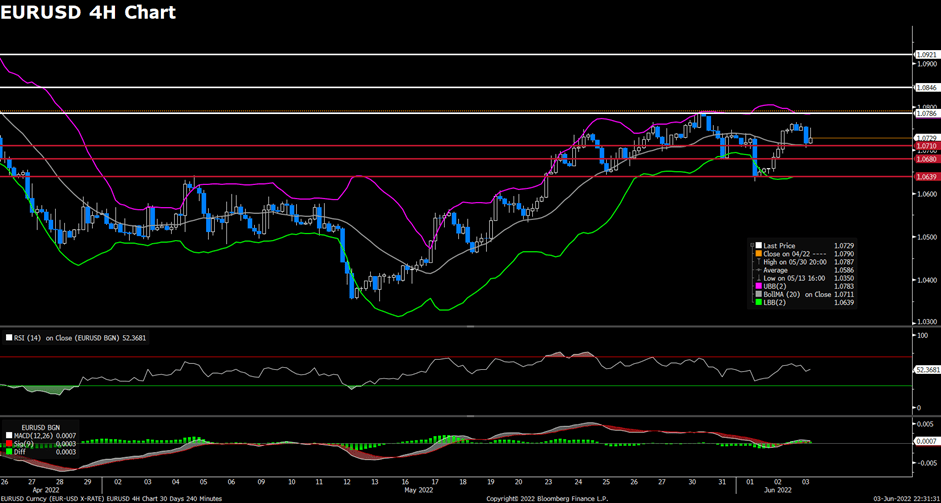
The EUR/USD pair consolidated on Friday, ending its previous rally and retreated from the 1.076 level after the release of the upbeat US Non-farm Payrolls report. The pair were flirting with the 1.074~1.076 area during the first half of the day, then lost its upside traction and dropped to a daily low below the 1.071 level in the late European session. The pair is now trading at 1.0744, posting a 0.01% loss daily. EUR/USD stays in the negative territory amid a stronger US dollar across the board, as the US Non-farm Payrolls rise by 390K in May and beat the market’s expectations of a 325K rise. The better-than-expected job data has provided some support to the greenback and dragged EUR/USD pair lower. For the Euro, the expectations for potential rate hikes by the ECB might limit the losses for the pair, as ECB policymaker Francois Villeroy de Galhau said on Thursday that normalization of the ECB policy is required.
For the technical aspect, the RSI indicator is 53 figures as of writing, suggesting that the upside is more favoured as the RSI stays above the mid-line. As for the Bollinger Bands, the price regained some upside strength after touching the moving average, therefore the upside traction should persist. In conclusion, we think the market will be slightly bullish as long as the 1.071 support line holds. On the downside, a break below the aforementioned support will confirm the bearish shift in the near term.
Resistance: 1.0786, 1.0846, 1.0921
Support: 1.0710, 1.0680, 1.0639
GBPUSD (4-Hour Chart)
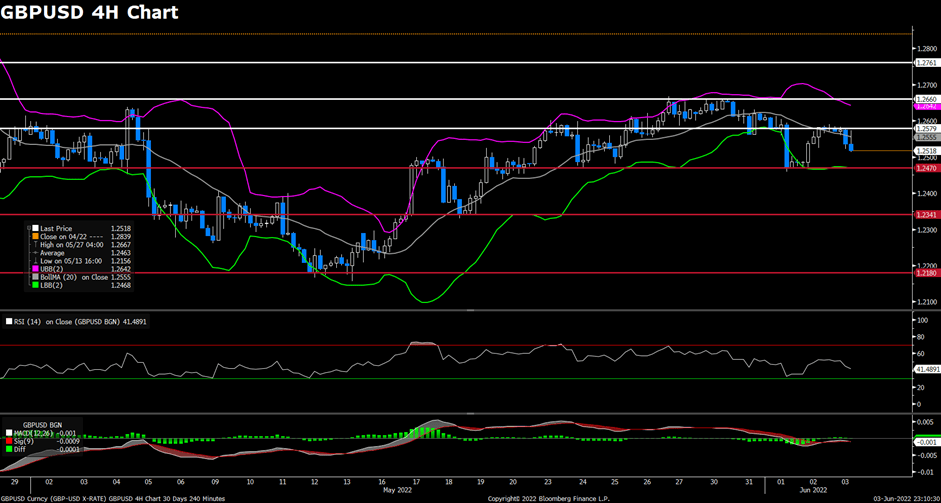
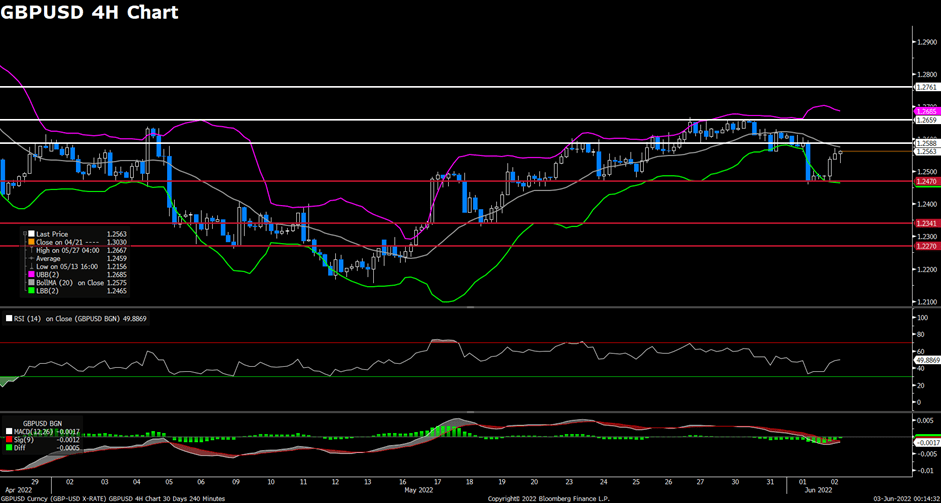
The pair GBP/USD edged lower on Friday, remaining under pressure and extended its daily losses amid holiday-thinned trade and the release of key US jobs data. The pair was trading flat during the Asian session and started to see fresh selling in the mid-European session, then rebounded back slightly to recover some of its intra-day losses. At the time of writing, the cable stays in negative territory with a 0.46% loss for the day. Renewed US dollar strength continued to weigh on GBP/USD pair during the second day of market closures in the UK, as a 390K increase in Nonfarm Payrolls report marked another robust labour market outcome in the US in May. For the British pound, the expectations for the Fed to be far more hawkish than the BoE and the worsening UK economic outlook might continue to exert bearish pressure on the cable. The BOE is expected to continue elevating its interest rates aggressively to contain inflation.
For the technical aspect, the RSI indicator is 41 figures as of writing, suggesting that the pair is surrounded by bearish momentum as the RSI keeps heading south. For the Bollinger Bands, the price preserved its downside traction and cross below the moving average, indicating that a continuation of the downside trend could be expected. In conclusion, we think the market will be bearish as long as the 1.2579 resistance line holds. The falling RSI also reflects bear signals.
Resistance: 1.2579, 1.2660, 1.2761
Support: 1.2470, 1.2341, 1.2180
USDCAD (4-Hour Chart)
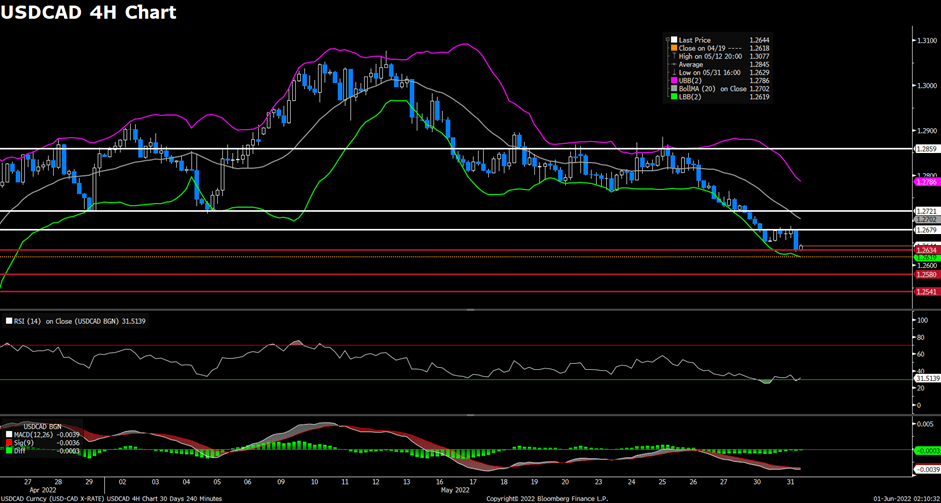
As the US Nonfarm Payrolls data showed that the US economy added 390K new jobs in May on Friday, the pair USD/CAD attracted some buying and extended its recovery toward the 1.2600 mark. The pair were flirting with the 1.256~1.258 area for most of the day and dropped to a daily low below the 1.2550 level, then rebounded back to erase all of its daily losses. USD/CAD is trading at 1.2576 at the time of writing, rising 0.05% daily. Investors expect that the US Federal Reserve will tighten its policy aggressively after the release of the better-than-expected US NFP report. The upbeat data showed that the US economy was not in a recession in the spring. On top of that, the surging crude oil prices also failed to exert bearish pressure on the USD/CAD pair despite WTI having rebounded back to the $119 per barrel area. OPEC+’s announcement of increasing output quotas by a larger 648K barrel per day seems not to deter the bulls.
For the technical aspect, the RSI indicator is 33 figures as of writing, suggesting that the pair remained under bearish momentum as the RSI stays near the oversold zone. For the Bollinger Bands, the price is struggling to climb higher after rebounding slightly from the lower band, therefore the downside traction should persist. In conclusion, we think the market will be bearish as the pair might head to re-test the 1.2562 support. A break below that support might favour the bears and open the road for additional losses.
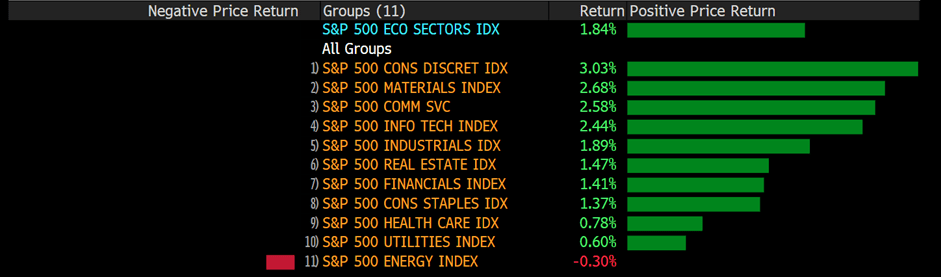
U.S. equities markets rebounded on Thursday. The Dow Jones Industrial Average rose 1.33% to close at 33248.28. The S&P 500 gained 1.84% to close at 4176.82. The Nasdaq composite rallied 2.69% to close at 12316.9. Before markets opened, Microsoft warned that revenue and earnings would come in below analyst estimates, thus sending bearing shockwaves throughout markets; however, equities were able to shake off the bearish outlook and end higher by market close. The ADP non-farm payrolls came in at 128,000 for May, missing estimates of 299,000. Market participants will now focus on the unemployment rate and non-farm payrolls both scheduled to release on Friday.
The benchmark U.S. 10 year treasury yield currently sits at 2.919%.
The technology sector has enjoyed multi-weeks of gains as valuations for tech giants have corrected significantly since the start of the year. Despite Microsofts ominous warning yesterday, shares of Nvidia popped 6.9%, Tesla added 4.7%, and Meta rose 5.4% as well. FAANG stocks remain vulnerable to large volatility in the short term, but share prices of these tech giants are pricing in the interest rate hikes for the year and seem to have found demand in the relatively low prices for the past couple of weeks.
Main Pairs Movement
The Dollar index slumped 0.78% throughout Thursday’s trading. The ADP non-farm payroll showed the second straight month of slow down in hiring in the private sector. Growth fears pressured the Dollar against other major foreign currencies.
EURUSD rose 0.94% over the previous trading day. The pair bounded off strongly from the newfound support level at around the 1.064 price region. Broad-based dollar weakness allowed the Euro to gain back losses from the Asia and European trading sessions.
GBPUSD rose 0.73% throughout yesterday’s trading. The cable advanced as the dollar sold off. Britain’s growth concerns, however, continue to pose a threat to Cable’s upside potential.
USDCAD fell 0.69% throughout yesterday’s trading. OPEC’s meeting concluded with the cartel agreeing to raise output and exclude Russia from its trading agreements; however, the meeting sent oil prices soaring. The commodity-linked Canadian Loonie enjoyed a boost as the WTI shot back up to $116 per barrel.
Technical Analysis
EURUSD (4-Hour Chart)
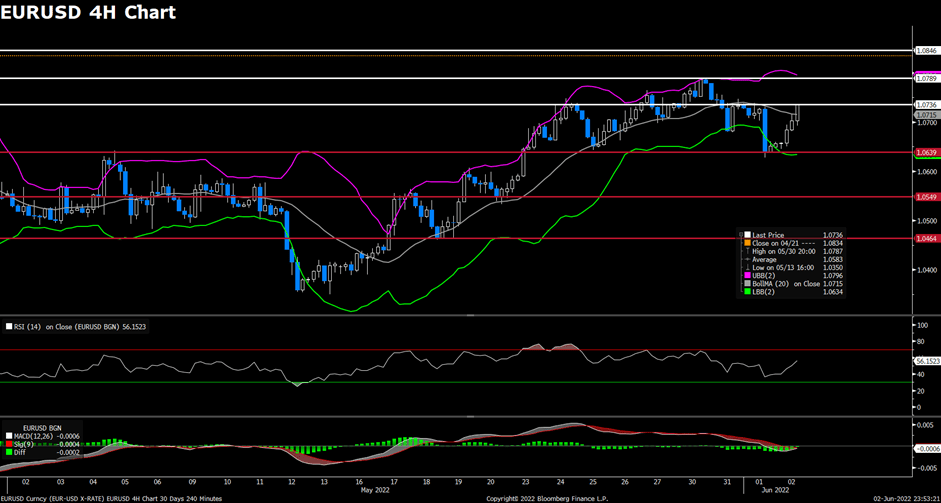
The EUR/USD pair advanced on Thursday, recovering from weekly lows that touched yesterday and managed to hold in positive territory after the release of US job data. The pair were flirting with the 1.064~1.066 area during the first half of the day, then started to witness fresh buying to refresh its daily high heading into the US session. The pair is now trading at 1.0736, posting a 0.84% gain daily. EUR/USD stays in the positive territory amid renewed US dollar weakness, as the worse than anticipated US ADP Nonfarm Employment data exerted bearish pressure on the US dollar. The data showed that private-sector employment rises by 128K in May, which was below expectations for a 300K rise. For the Euro, the hawkish ECB has been a key factor supporting EUR/USD in recent weeks, as investors expect a 50 bps rate hike from the ECB at its July meeting due to hot Eurozone inflation.
For the technical aspect, the RSI indicator is 55 figures as of writing, suggesting that the upside is more favoured as the RSI stays above the mid-line. As for the Bollinger Bands, the price preserved its upside strength and crossed above the moving average, therefore a continuation of the upside trend could be expected. In conclusion, we think the market will be bullish as the pair is heading to test the 1.0736 resistance. A sustained strength above that level will favour the bulls and confirm the bullish shift in the near term.
Resistance: 1.0736, 1.0789, 1.0846
Support: 1.0639, 1.0549, 1.0464
GBPUSD (4-Hour Chart)
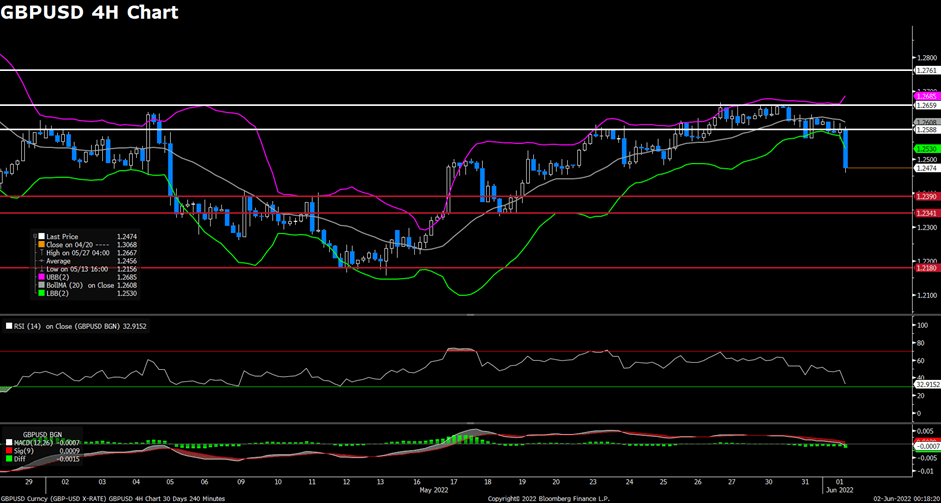
The pair GBP/USD edged higher on Thursday, ending its previous slide and extending its rebound toward the 1.256 area as US yields retreat amid mixed US jobs data today. The pair was trading flat during the Asian session and touched a daily high near the 1.257 level in the European session, then retreated slightly to erase some of its daily gains. At the time of writing, the cable stays in positive territory with a 0.62% gain for the day. Despite the downbeat ADP Employment Change report weighing on the US dollar and pushing the GBP/USD pair higher, the cautious market mood is limiting the cable’s upside for the time being. For the British pound, the worsening UK economic outlook and divergence in Fed/BoE monetary policy will continue to act as a headwind for the cable, as Bank of England Deputy Governor Jon Cunliffe said that the UK economy is expected to slow quite a lot over the next year.
For the technical aspect, the RSI indicator is 48 figures as of writing, suggesting that the pair have a difficult time gathering bullish momentum as the RSI has lost its upward strength within harmful levels. For the Bollinger Bands, the price failed to cross above the moving average, indicating that a trend reversal could be expected for the pair. In conclusion, we think the market will be slightly bearish as long as the 1.2588 resistance line holds. On the downside, GBP/USD could extend its slide toward 1.2341 if the pair breaks below the 1.2470 support and starts using that level as resistance.
Resistance: 1.2588, 1.2659, 1.2761
Support: 1.2470, 1.2341, 1.2270
USDCAD (4-Hour Chart)
As the US ADP Employment Change for May came in weaker than expected and dragged the US dollar down on Thursday, the pair USD/CAD remained under bearish pressure and meanwhile tumbled to six-week lows under the 1.2600 area. The pair edged higher to a daily high in the late Asian session, but then started to see heavy selling and extended its intra-day losses toward the 1.2580 level. USD/CAD is trading at 1.2571 at the time of writing, losing 0.68% daily. The hawkish comments by Bank of Canada Deputy Governor Paul Beaudry also supported the loonie, as he said that the BoC may need to raise its policy interest rate to 3% or higher. On top of that, the surging crude oil prices also underpinned the commodity-linked loonie and dragged the USD/CAD pair lower as WTI has rebounded back to the $117 per barrel area. The latest news reported that the OPEC+ has agreed to lift output by 648K barrels per day in both July and August.
For the technical aspect, the RSI indicator is 28 figures as of writing, suggesting that the pair faces heavy bearish pressure as the RSI reaches the oversold zone. For the Bollinger Bands, the price moved out of the lower band so a strong downside trend continuation could be expected. In conclusion, we think the market will be bearish as the pair is testing the 1.2580 support. A break below that support might favour the bears and open the road for additional losses.
Please be advised of the upcoming AMAZON.COM INC (AMAZON) stock split that is going to take place as per the following schedule:
Ex-Date: June 6th, 2022. Common shares will trade at the new split-adjusted price.
Important implications of the AMAZON Stock Split:
1. The quantity of shares of each client’s position will multiply by 20.
2. Post-split, the “open price” and “take profit / stop loss” of each position will be adjusted, which will be the original price divided by 20.
3. The estimated post-split price may be 1/20 of the EOD price on 3rd, June.
4. All pending orders at the time of the split (Buy Limit, Sell Limit, Buy Stop, Sell Stop, Buy Stop Limit, Sell Stop Limit) will be cancelled.
5. All AMAZON holding positions and pending orders on DEMO account will be closed as a result of the stock split.
Q. What is a stock split?
A. A stock split is a corporate action taken by companies that have seen their share price increase to levels that are either too high or are beyond the price levels of similar companies in their sector, to divide their existing shares into two or more shares.
Q. Why do stocks split?
A. The primary motive is to make the shares more affordable to small investors even though the underlying value of the company has not changed. Amazon would like its stock to be more accessible to a broader base of investors.
Q. What is the split ratio?
A. Amazon also announced it will split its stock in a 20 for 1 offering.
Q. What will this split mean to investors?
A. Each share of AMAZON stock that an investor owns before Ex-Date (June 6th, 2022) will be eligible for stock split. Investors will receive nineteen additional shares and the stock price will be 1/20.
Here is an example:
If an investor owns 100 shares and the market price is $2,400, $2,440 as take profit. After 20 for 1 stock split, the investor will own 100*20= 2,000 shares and the estimated post-split price would be $2400/20 = $120, and the take profit price will adjust to $2,440/20=$122.
Q. Does the 20 for 1 stock split mean the value of my AMAZON shares will increase nineteen times?
A. Unfortunately, not. As stated in the above example, the increase in the number of stocks means every share is now worth less than its previous value, precisely, it’ll be 1/20th the previous value.
Q. How do stock splits affect short sellers?
A. Stock splits do not affect short sellers in a material way. There are some changes that occur as a result of a split that affects the short position, but they don’t affect the value of the short position(s).
If you have any questions, our team will be happy to answer your questions. Please mail to [email protected] or contact the service online.
U.S. stocks fell on the first day of June after JPMorgan Chase President Jamie Dimon warned sharply of the impact of Hurricane Sandy on the U.S. economy. The S&P 500 was down 0.7%, the Dow Jones was down 0.5% and the Nasdaq was down 0.7% on Wednesday.
After rebounding in the trading session, the major stock indexes slipped after solid U.S. manufacturing data and comments from Dimon at an investment conference. According to the Institute for Supply Management, manufacturing in the U.S. grew faster than expected in May, which suggests that the economy may not be as weak as many people believe.
In early March, as the US and its allies unleashed a wave of sanctions on Russia, President Joe Biden stood in the White House and said they wanted to deal a “powerful blow to Putin’s war machine.”
But as the war in Ukraine approaches its 100th day, that machine is still very much operational. Russia is being propelled by a flood of cash that could average $800 million a day this year — and that’s just what the commodity superpower is raking in from oil and gas.
For years, Russia has acted as a vast commodity supermarket selling what an insatiable world has needed: Not just energy, but wheat, nickel, aluminium and palladium too. The invasion of Ukraine has pushed the US and the European Union to rethink this relationship. It’s taking time, though the EU took a further step this week by hammering out a compromise agreement on Russian oil imports.
Main Pairs Movement
The focus remains on inflation and growth, and whether policymakers will continue to tighten monetary policy. On Wednesday, the Bank of Canada raised interest rates by 50 basis points to 1.5%. The policymakers said that they are prepared to take stronger action if needed to achieve the 2% inflation target.
The US ISM Manufacturing Purchasing Managers’ Index rose to 56.1 in May, exceeding expectations. The unexpected spike in activity boosted the dollar and reduced demand for U.S. Treasury. However, yields also rose amid lingering inflation concerns and interest rate hike speculation, with the 10-year U.S. Treasury yield reaching an intraday high of 2.95%.
Commodity-linked currencies performed best against the dollar, with AUD/USD holding gains and closing near 0.7190, while USD/CAD hovered at 1.2600 before rebounding to the current 1.2630 price range.
The yen was the worst performer, with USD/JPY surging to around 130.18 in early trading Thursday. EUR/USD was sharply weaker, closing at 1.0650 price area, while GBP/USD closed slightly below 1.2500.
Technical Analysis
EURUSD (4-Hour Chart)
The EUR/USD pair declined on Wednesday, extending its slide that started yesterday and dropped to weekly lows below the 1.066 mark as the US dollar continues to gather strength against its rivals. The pair was trading lower at the open and remained under bearish pressure during the European session, then refreshed its daily lows toward the 1.065 area in the early US trading session. The pair is now trading at 1.0669, posting a 0.59% loss daily. EUR/USD stays in the negative territory amid renewed US dollar strength, as The stronger expected US economic data helped the greenback to find demand. The ISM Manufacturing PMI rose to 56.1 in May, showing that the business activity in the manufacturing sector continued to expand in the US. For the Euro, the ECB Governing Council member Robert Holzmann’s hawkish comments today failed to lift the EUR/USD higher, as he said that a 50 basis points rate hike will be needed due to the record-high inflation.
For the technical aspect, the RSI indicator is 38 figures as of writing, suggesting that the pair is facing heavy bearish pressure as the RSI keeps heading south. As for the Bollinger Bands, the price moved out of the lower band so a strong downside trend continuation could be expected. In conclusion, we think the market will be bearish as the pair is heading to test the 1.0622 support. A break below that support might open the road for near-term losses.
The pair GBP/USD tumbled on Wednesday, being surrounded by heavy bearish momentum and extended its slide toward the 1.2500 area as investors focus on the weakening UK economy. The pair preserved its downside traction during the first half of the day, then dropped to a daily low below the 1.2490 level and extended its intra-day losses. At the time of writing, the cable stays in negative territory with a 0.98% loss for the day. The risk aversion and higher US bond yields have both underpinned the US dollar today, as the US equity market tumbled sharply following the release of an upbeat US ISM Manufacturing PMI data. For the British pound, the worries about the cost of the living crisis remained as the UK Manufacturing PMI data for May showed that manufacturing activity in the UK expanded at its weakest pace rate since January 2021. The widening Fed/BoE policy differentials might also keep acting as a headwind for the cable.
For the technical aspect, the RSI indicator is 32 figures as of writing, suggesting that the downside is preserving strength and the bearish shift in the near-term outlook is confirmed. For the Bollinger Bands, the price moved out of the lower band, indicating that a strong trend continuation could be expected. In conclusion, we think the market will be bearish as long as the 1.2588 resistance line holds. GBP/USD could extend its slide toward 1.2341 if the pair breaks below the 1.2390 support and starts using that level as resistance.
After the Bank of Canada’s decision to hike the overnight rate by 50 bps on Wednesday, the pair USD/CAD regained some upside momentum and recovered toward the 1.2670 area. The pair climbed to a daily high after dropping to daily lows below the 1.262 level in the early US session, but then witnessed fresh selling to erase all of its daily gains. USD/CAD is trading at 1.2637 at the time of writing, losing 0.10% daily. The loonie has been lifted higher by the hawkish BoC, who said that interest rates would need to rise further and they are prepared to act more forcefully if needed to meet its commitment to achieving the 2% inflation target. On top of that, the surging crude oil prices also acted as a tailwind for the commodity-linked loonie and dragged the USD/CAD pair lower as WTI has rebounded back to the $117 per barrel area. The black gold’s near-term outlook remains bullish as North America and Europe head into peak driving season and lockdowns in Shanghai have now ended.
For the technical aspect, the RSI indicator is 37 figures as of writing, suggesting that the downside is more favoured as the RSI stays below the mid-line. For the Bollinger Bands, the price lost its upside strength and dropped toward the lower band, therefore the downside traction should persist. In conclusion, we think the market will be bearish as the pair is testing the 1.2636 support. A four-hour close below that support will favour a downside continuation.
Please note the adjustment on the following products due to the international holiday in June:
The above time is MT4/5 server time. The trading time of other products is not affected. The above data may be subject to change. Please refer to the actual time on MT4/5.
If you have any questions, our team will be happy to answer your questions. Please mail to [email protected] or contact the service online.
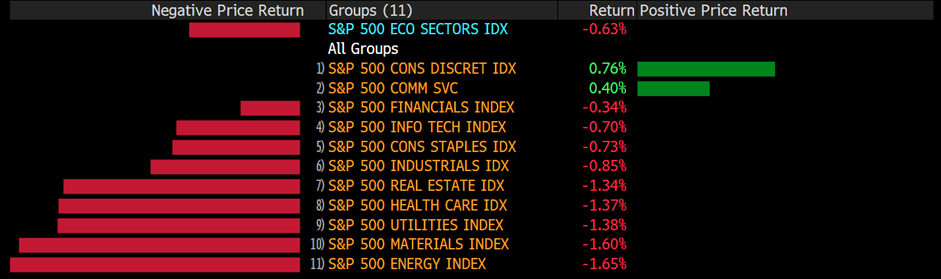
U.S. equities markets resumed trading on the last day of May and closed slightly lower following last week’s positive mood shift. The Dow Jones Industrial Average dropped 0.67% to close at 32990.12. The S&P 500 lost 0.63% to close at 4132.15. The Nasdaq Composite slipped 0.41% to close at 12081.39. The energy sector fared worse throughout yesterday’s trading. The EU has agreed to ban most crude imports from Russia, thus sending oil prices surging; however, oil prices soon dropped as OPEC has also agreed on suspending Russia from its oil production deal.
The benchmark U.S. 10-year Treasury yield climbed to 2.862%.
On the economic docket, Australia’s GBP will be released and PMI figures from China, Germany, Britain, and the U.S. will also be released. Later in the American trading session, the Bank of Canida is set to release its interest rate decision.
Main Pairs Movement
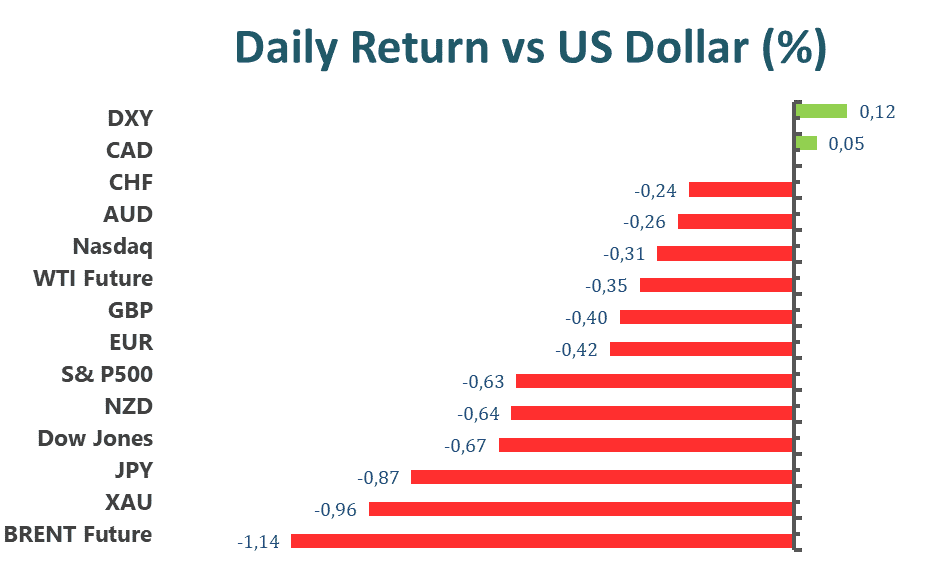
The Dollar index rose 0.41% throughout yesterday’s trading. The rise ended the Dollar index’s three-day losing streak. Rising bond yields and uncertainty among equity markets helped buoy the U.S. Greenback against other major foreign currencies.
EURUSD lost 0.41% throughout yesterday’s trading. Soaring inflation in the Eurozone and a weak economic outlook both add pressure to the ECB’s easy money policy. Despite recent hawkish tones from the ECB, it remains to be seen on how the central bank will react with monetary tightening possibly adding further downward pressure on the economic recovery.
GBPUSD dropped 0.39% throughout yesterday’s trading. Broad-based Dollar demand ended Cable’s four-day winning streak. Market participants will be focusing on today’s PMI figures from both the U.K. and the U.S.
USDCAD lost 0.07% throughout yesterday’s trading. Despite a stronger dollar, the Canadian Loonie still came out ahead as oil prices surged due to the EU’s newly agreed sanctions on Russian oil exports.
Technical Analysis
EURUSD (4-Hour Chart)
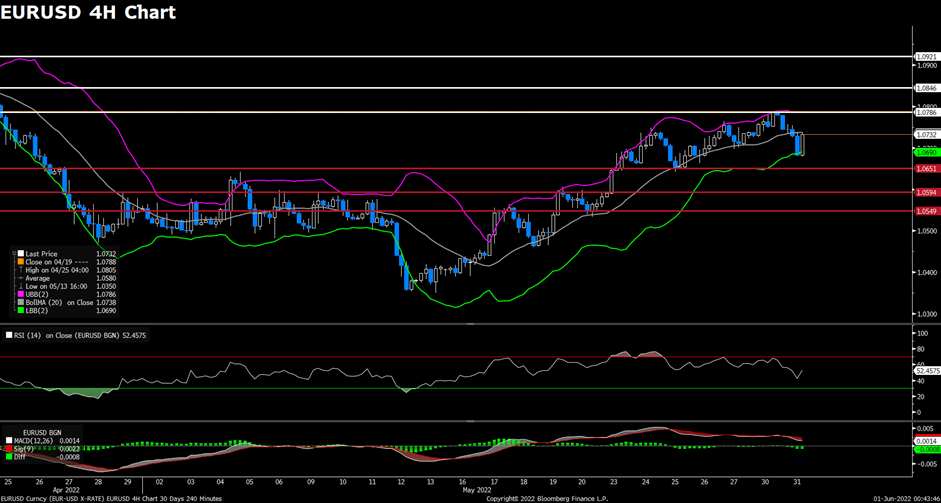
The EUR/USD pair declined on Tuesday, failing to extend its previous rally, and continued to trade deep in negative territory below the 1.075 mark area amid risk-off market sentiment. The pair were surrounded by heavy bearish momentum and dropped daily low below 1.069 level in the late European session, then rebounded back to recover some of its daily losses. The pair is now trading at 1.0732, posting a 0.40% loss daily. EUR/USD stays in the negative territory amid a stronger US dollar across the board, as rising US bond yields helped the greenback to find demand when US market participants return from a long weekend. Moreover, the release of the US Consumer Confidence also underpinned the dollar, as it came in at 106.4 in May and better than the 103.9 expected. For the Euro, the ECB tightening expectations should help limit the losses for EUR/USD pair, as the latest inflation figures were above expected and Eurozone money markets now expect a 115 bps hike from the ECB before year-end.
For the technical aspect, the RSI indicator is 52 figures as of writing, suggesting that the upside has regained strength as the RSI keeps heading north. As for the Bollinger Bands, the price rebounded from the lower band and rose toward the moving average, therefore a continuation of the upside trend could be expected. In conclusion, we think the market will be bullish as the pair might head to re-test the 1.0786 resistance. The rising RSI also reflects bull signals.
Resistance: 1.0786, 1.0846, 1.0921
Support: 1.0651, 1.0594, 1.0549
GBPUSD (4-Hour Chart)
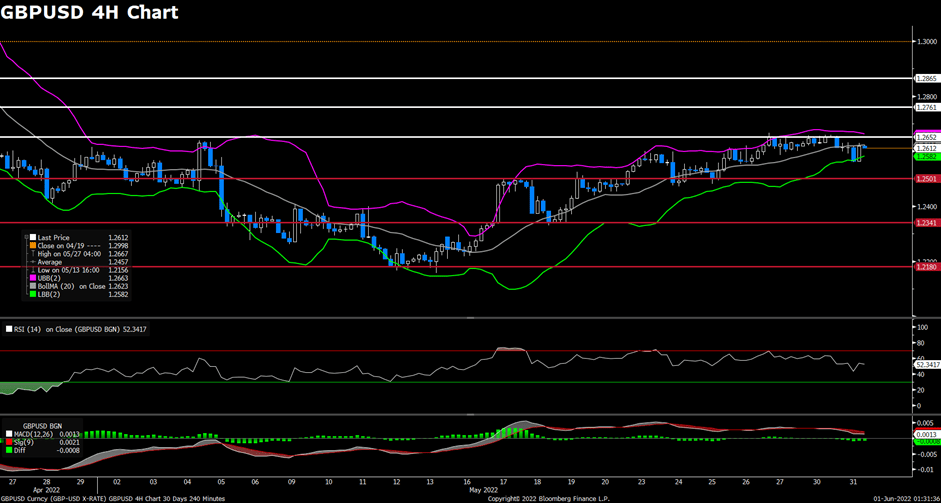
The pair GBP/USD edged lower on Tuesday, retreating from a monthly high and weakening further below the 1.2600 mark amid a downbeat market mood. The pair witnessed heavy selling at the start of the day and dropped to a daily low below 1.256 level heading into the US session, then regained upside traction to erase some of its intra-day losses. At the time of writing, the cable stays in negative territory with a 0.30% loss for the day. The overnight hawkish comments by Fed Governor Christopher Waller lend strong support to the US Treasury bond yields and lifted the greenback higher, as he backed a 50 bps rate hike for several meetings until inflation eases back toward the central bank’s goal. For the British pound, the worries about the cost of living crisis and a possible UK recession later in 2022 continued to exert bearish pressure on the GBP/USD pair. Investors now expect that a jumbo rate hike by the BoE would take its toll on the UK economy, which makes it difficult for the cable to gather bullish momentum.
For the technical aspect, the RSI indicator is 52 figures as of writing, suggesting that the upside is losing strength as the RSI stays flat near the mid-line. For the Bollinger Bands, the price failed to cross above the moving average and retreated slightly, indicating that some downside trend could be expected. In conclusion, we think the market will be bearish as long as the 1.2652 resistance line holds. But a break above that level could be seen as a bull signal and open the door for additional gains toward 1.2761.
Resistance: 1.2652, 1.2761, 1.2865
Support: 1.2501, 1.2341, 1.2180
USDCAD (4-Hour Chart)
As the Bank of Canada is expected to announce a 50 bp rate hike on Wednesday, the pair USD/CAD preserved its bearish momentum and tumbled to fresh one-month lows near the 1.263 mark on Tuesday. The pair flirted with the 1.266~1.268 area during the first half of the day, then started to see fresh selling and erased all of its daily gains heading into the US session. USD/CAD is trading at 1.2642 at the time of writing, losing 0.10% daily. The recovery witnessed in the US dollar failed to support the USD/CAD pair as the loonie rose across the board ahead of the BoC meeting. On top of that, the falling crude oil prices also failed to undermine the commodity-linked loonie and pushed the USD/CAD pair higher despite WTI having retreated to the $114 per barrel area after nearly hitting the $120 mark earlier in the session. The news reported that EU 27 leaders have agreed on a Russian oil embargo to lend support to oil prices, as the EU agreed to phase out 90% of Russian oil imports by the year’s end.
For the technical aspect, the RSI indicator is 32 figures as of writing, suggesting that the pair is facing heavy bearish pressure as the RSI stays near the oversold zone. For the Bollinger Bands, the price remained under pressure around the lower band, therefore the downside traction should persist. In conclusion, we think the market will be bearish as the pair is testing the 1.2634 support. Further losses could be expected if the pair break below the aforementioned support.
U.S. equity markets were closed on the 30th in celebration of memorial day, and markets will reopen for trading on the 31st.
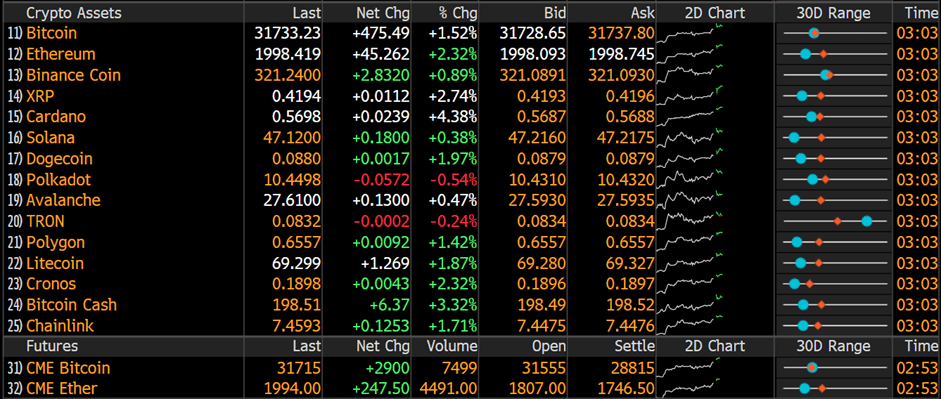
After the tremendous crash of UST and Luna, the team behind the Terra blockchain project has voted to revive Luna but not TerraUSD, the stablecoin. Previous Luna tokens are now branded as “Luna Classic”, and the newly issued token will be branded as Terra 2.0. Despite efforts from the Terra team to restore confidence in the Terra protocol, market participants are not buying into what could be another financial detriment. Terra 2.0 went live over the previous weekend and peaked at $19.53 on Saturday, but subsequently crashed to around $4.39 in just hours. The entire cryptocurrency market is still in the wake of Terra’s collapse, but market participants seem to be circulating back as trading volume has increased over the past couple of days. As of writing, Bitcoin is trading at 31,733, Ethereum at 1998.419, and Solana at 47.12.
Main Pairs Movement
The dollar index continued to fall for the third trading day. The U.S. Greenback fell 0.26% against a basket of other major foreign currencies.
EURUSD rose 0.38% over the previous trading day. Broad-based dollar weakness allowed the EURUSD pair to continue its upward trajectory. Germany’s CPI soared to 7.9% YoY, helping the narrative of a more aggressive ECB.
GBPUSD rose 0.19% over the previous trading day. The recent fiscal stimulus sent out by the BoE has allowed some breathing room for the British Pound.
USDCAD fell 0.51% over the previous trading day. Risk on the environment and a broad-based Dollar weakness has allowed the Canadian Loonie to gain against the Dollar for the fourth consecutive trading day.
Technical Analysis
EURUSD (4-Hour Chart)
The EUR/USD pair advanced on Monday, preserving its upside traction, and trades near a fresh monthly high near the 1.0780 area amid risk-on market sentiment. The pair was trading higher and touched a daily high around 1.078 level during the European session, but then lost its bullish strength to surrender some of its daily gains. The pair is now trading at 1.0782, posting a 0.44% gain daily. EUR/USD stays in the positive territory amid renewed US dollar weakness, as the latest news support investors’ mood and showed that China has announced it would start lifting covid-related restrictions in Shanghai this week as planned. The expectations that the Fed could pause or slow down the rate hike cycle later in the year continued to act as a headwind for the greenback. For the Euro, the Germany Consumer Price Index surged to 7.9% YoY in May, which came in higher than expected and underpinned the expectation that the ECB will start of its hiking cycle as soon as this summer.
For the technical aspect, the RSI indicator is 67 figures as of writing, suggesting that the upside is preserving strength as the RSI keeps heading north. As for the Bollinger Bands, the price regained upside traction and climbed toward the upper band, therefore a continuation of the upside trend could be expected. In conclusion, we think the market will be bullish as the pair is heading to test the 1.0810 resistance. Further advances could be expected if the pair breaks above that resistance.
Resistance: 1.0810, 1.0921
Support: 1.0710, 1.0651, 1.0549
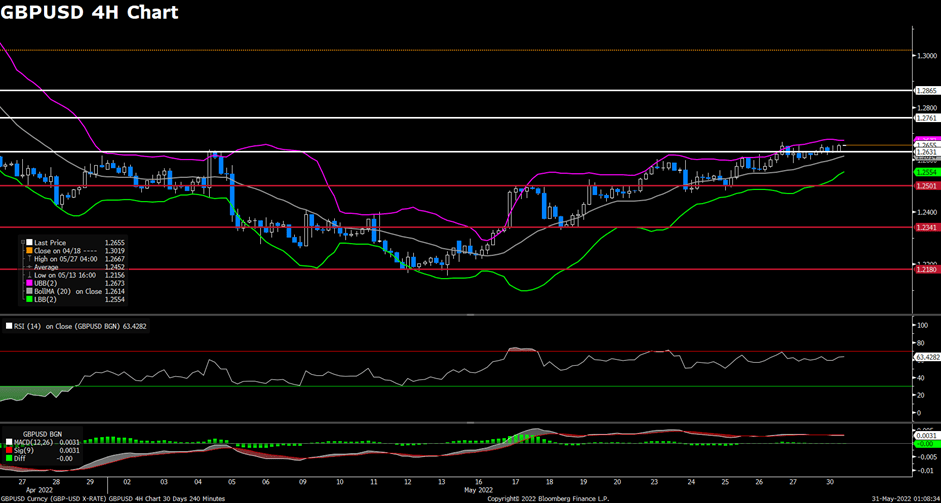
GBPUSD (4-Hour Chart)
The pair GBP/USD edged higher on Monday, failing to extend its rally, and consolidated near one-month highs around the 1.2650 area amid an upbeat tone to risk appetite at the start of the week. The pair remained in quiet trading conditions and dropped to a daily low below 1.262 level in the early European session, then rebounded back to erase most of its intra-day losses. At the time of writing, the cable stays in positive territory with a 0.24% gain for the day. The release of the US PCE data last Friday reaffirmed the expectations that the Fed could pause the rate hike cycle as inflationary pressures in the US could be easing. Therefore, the dollar remained under bearish pressure on the Memorial Day public holiday. For the British pound, the fiscal stimulus plan that will help households struggling under the rising inflationary pressures continued to act as a tailwind for the GBP/USD pair. But the escalating recession fears due to higher inflation might keep limiting the upside for the cable.
For the technical aspect, the RSI indicator is 63 figures as of writing, suggesting that the upside is more favored as the RSI stays above the mid-line. For the Bollinger Bands, the price preserved its positive traction and climbed toward the upper band, indicating that the upside momentum should persist. In conclusion, we think the market will be bullish as the pair is testing the 1.2631 resistance. Sustained strength above that resistance will reaffirm the positive bias and pave the way for additional gains.
Resistance: 1.2631, 1.2761, 1.2865
Support: 1.2501, 1.2341, 1.2180
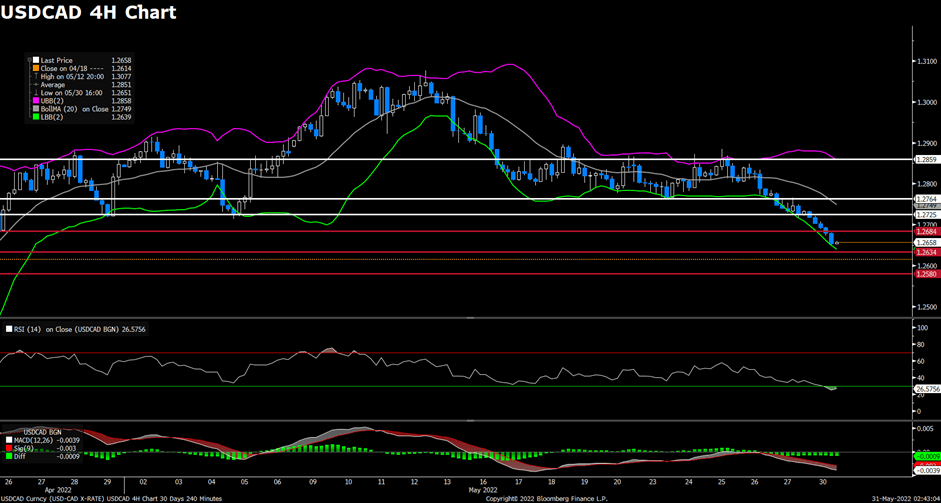
USDCAD (4-Hour Chart)
As the Canadian dollar was among the top performers during the US trading session on Monday, the pair USD/CAD was surrounded by bearish momentum and dropped to fresh monthly lows near the 1.2650 level. The pair witnessed heavy selling for most of the day, then extended its slide and refreshed daily lows after the start of the US trading session. USD/CAD is trading at 1.2657 at the time of writing, losing 0.49% daily. The prospects for an eventual slowdown of the Fed’s policy tightening and the prevalent risk-on environment have both weighed on the safe-haven US dollar, as the easing of COVID-19 lockdowns in China lends support to investors’ mood. On top of that, the surging crude oil prices also underpinned the commodity-linked loonie and dragged the USD/CAD pair lower as WTI has climbed above monthly highs near $117 per barrel area. The expectations for a recovery of oil demand in China are acting as a tailwind for the black gold.
For the technical aspect, the RSI indicator is 27 figures as of writing, suggesting that the pair is facing heavy bearish pressure as the RSI reaches the oversold zone. For the Bollinger Bands, the price continued to move alongside the lower band, therefore the downside traction should persist. In conclusion, we think the market will be slightly bullish as the pair is in oversold condition now, therefore it should witness some technical correction before edging lower. On the downside, further losses can be expected if the pair falls below the next support at 1.2634.