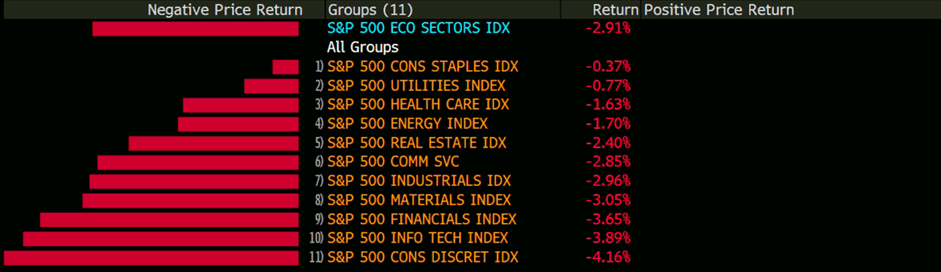
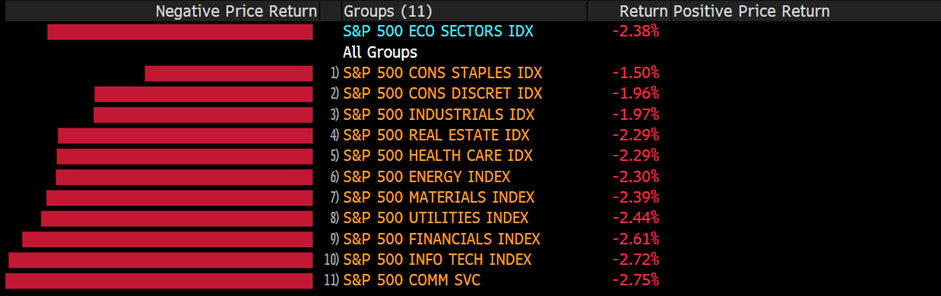
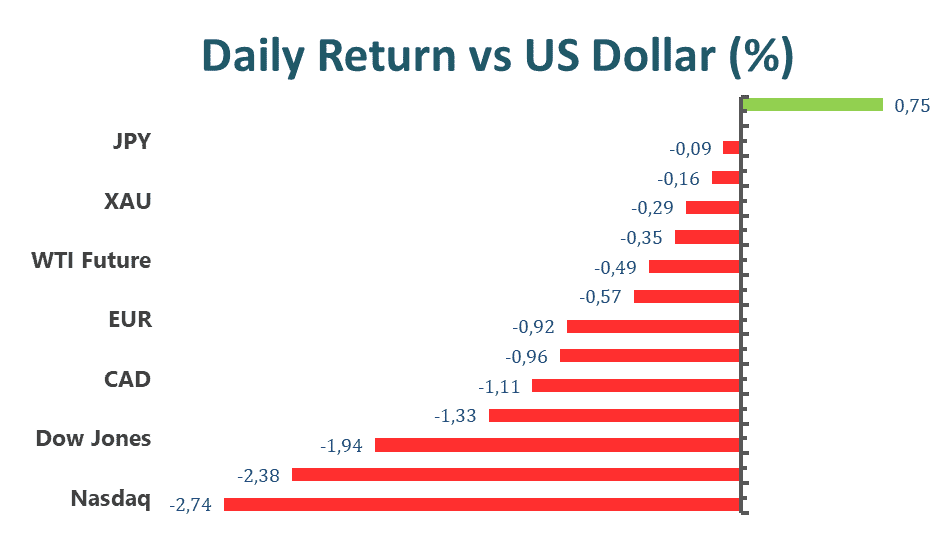
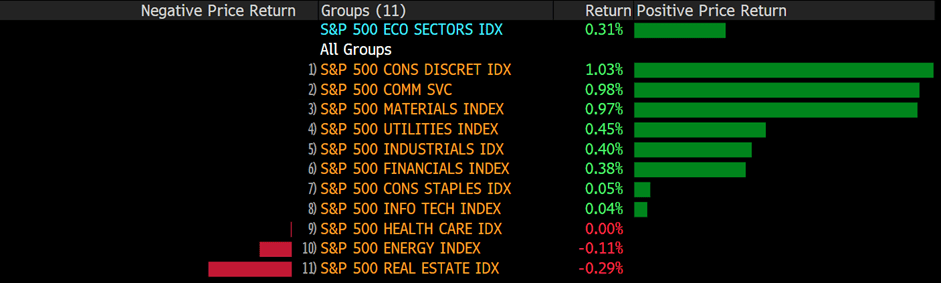
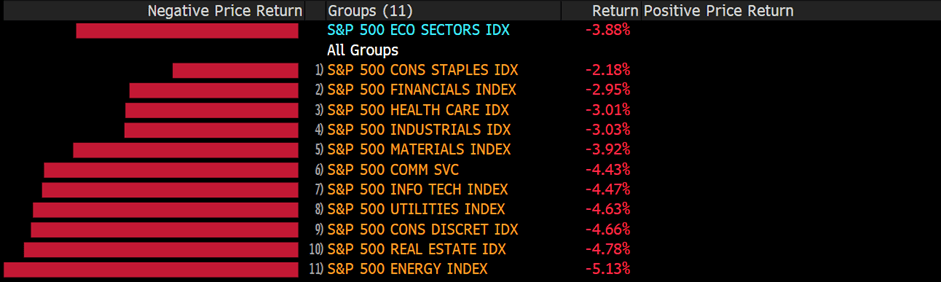
Major sell-off intensified on Monday, turning US indices into bear market territory as recession fears grew ahead of the key FOMC meeting this week. The S&P 500 tumbled nearly 4% to 3749.83, the lowest level since 2021; the S&P 500 is now down 21% from its high, closing in the bear market territory. In the meantime, the Nasdaq Composite shed 4.68% while the Dow Jones Industrial Averages dropped 2.79%; the Nasdaq and the Dow were down 33% and 17%, respectively from their high.
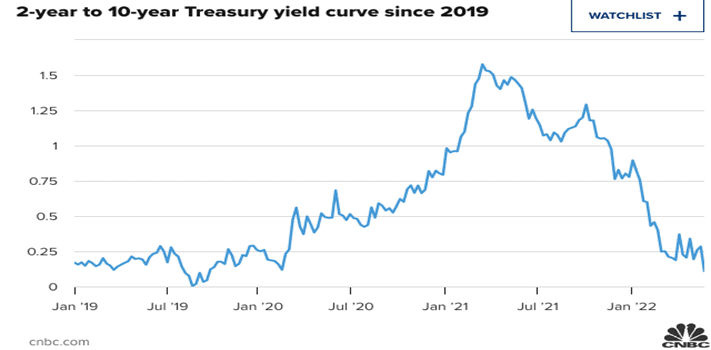
The markets continued to digest a higher-than-expected inflation report from last week, thus beginning to anticipate an even faster pace of interest rate hikes; some Fed policymakers are now coming up with the idea of a 75 basis point rate increase this week. Meanwhile, the market closely monitored the spread between the US 2- year Treasury yield and the US 10- year Treasury yield. The US two-year yield now exceeds the 10- year for the first time since early April, a potential recession.
Bitcoin, Ethereum, and other cryptocurrencies plunged on Monday, making two of the world’s biggest cryptocurrency platform-restricted activities. Bitcoin and Ethereum were both down more than 15% intraday. Crypto-investors seemed to dump intensify their crypto-assets amid a broader sell-off in risk assets as the rampant inflation continued and the Fed’s upcoming interest rates decision.
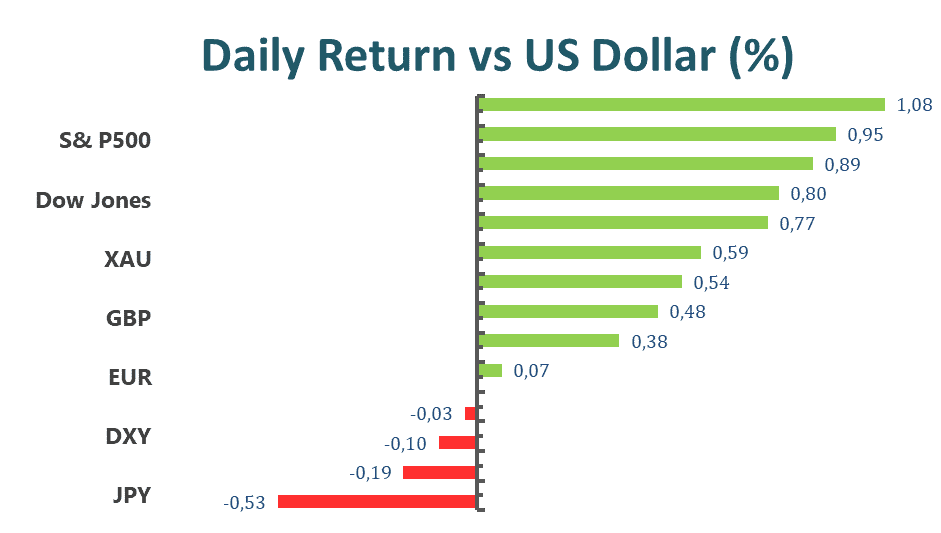
Main Pairs Movement
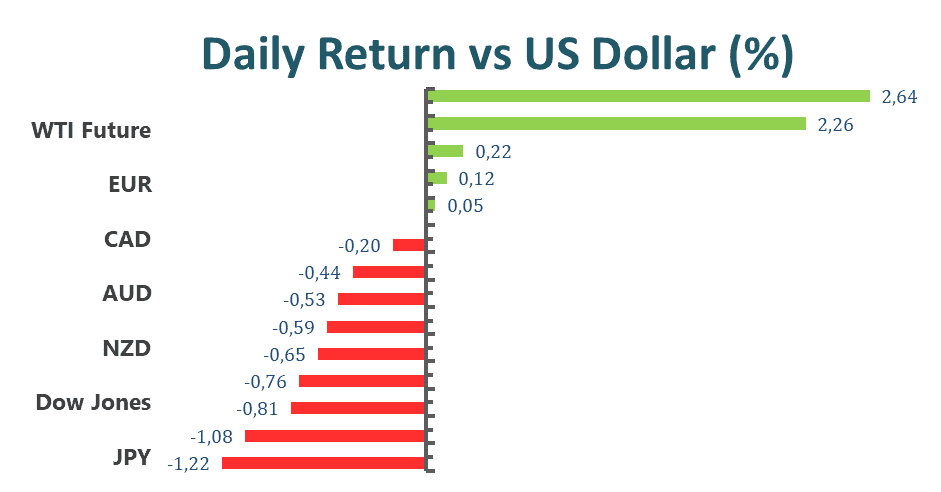
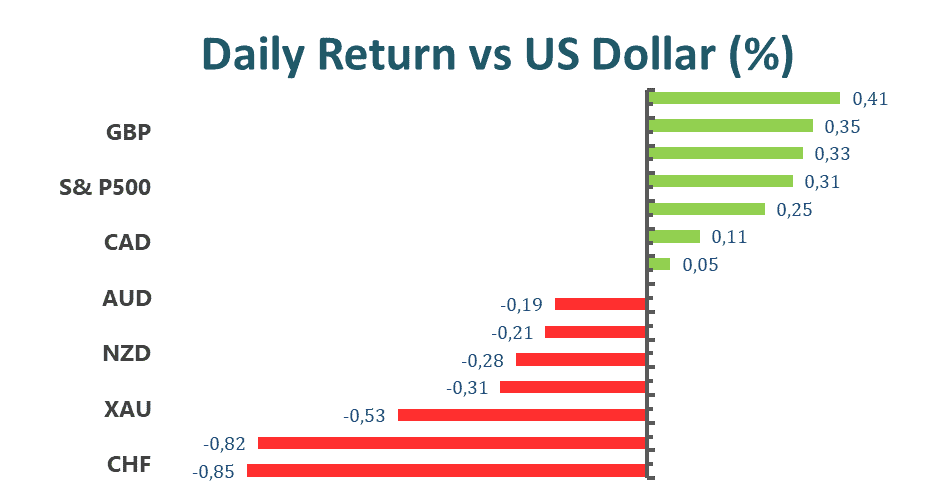
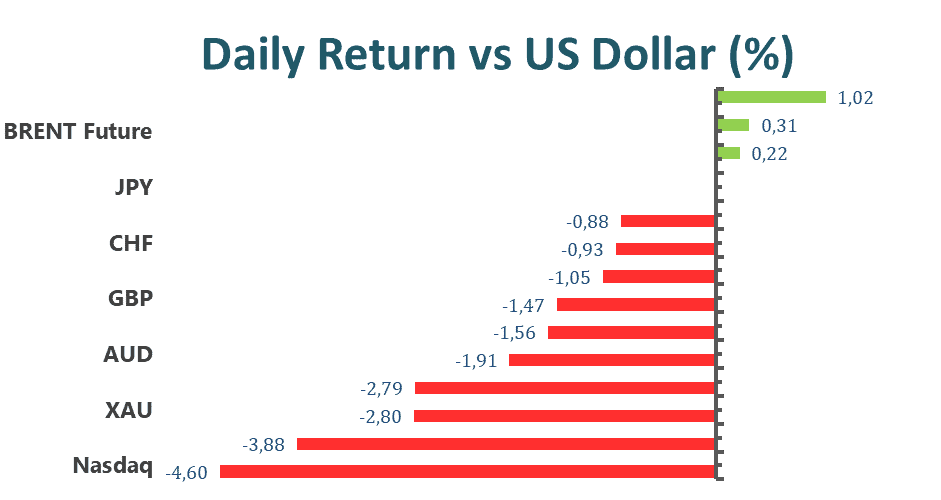
AUD/USD dropped 1.72%, to 0.69204 on Monday following a collapse in the US and the global stock market. Investors bet on the greenback as the Fed will impose even more tightening monetary policy, boosting the greenback.
WTI had little change and remained well supported near 120 despite the risk-off conditions as China lockdown worries. According to Bloomberg, China is somehow walking back some of its Covid loosening measures as the officials see some potential outbreaks.
Gold plunged more than 2% and closed at 1819.39 on Monday as the greenback soared to fresh cycle highs. Despite the inflationary pressure giving some support to the bullion, the potential 75 basis points interest rate hikes by the Fed has caused angst in the financial markets, hurting the precious metal, gold.
EUR/USD was down for the third- consecutive trading day, closed at 1.0406 on a bloody Monday. Risk aversion dominated the financial and forex markets as the greenback demand spurred, sending most of the G-10 currency pairs to the lowest, including EUR/USD.
Technical Analysis
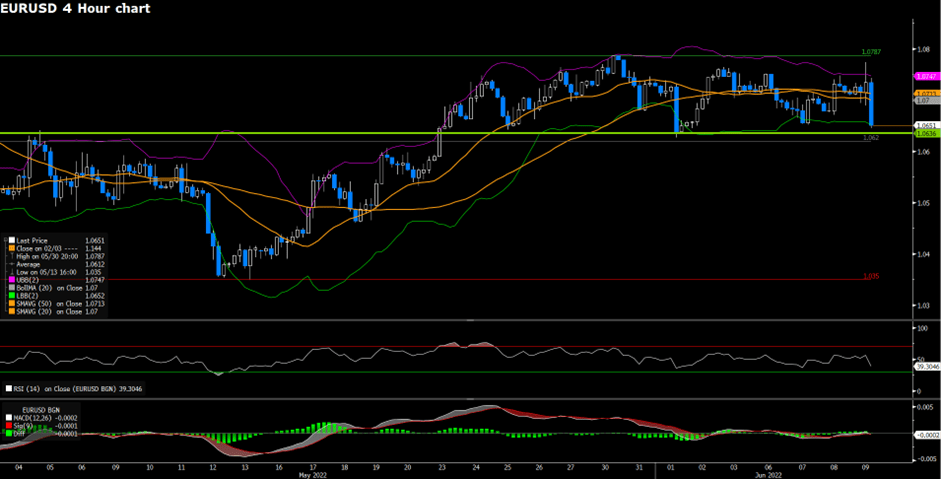
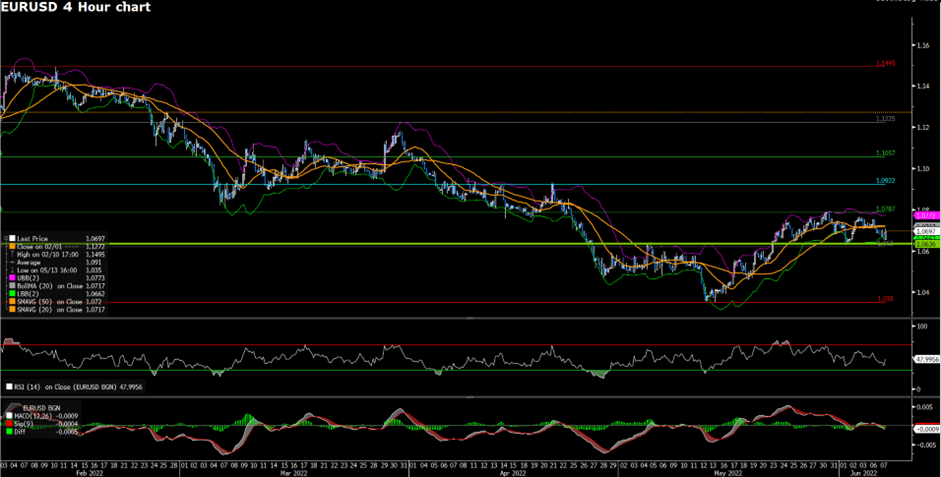
EURUSD (4-Hour Chart)
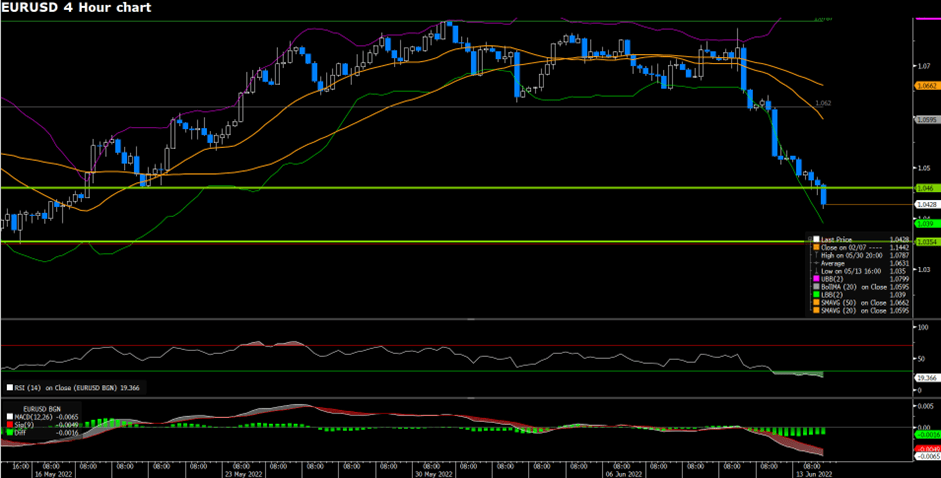
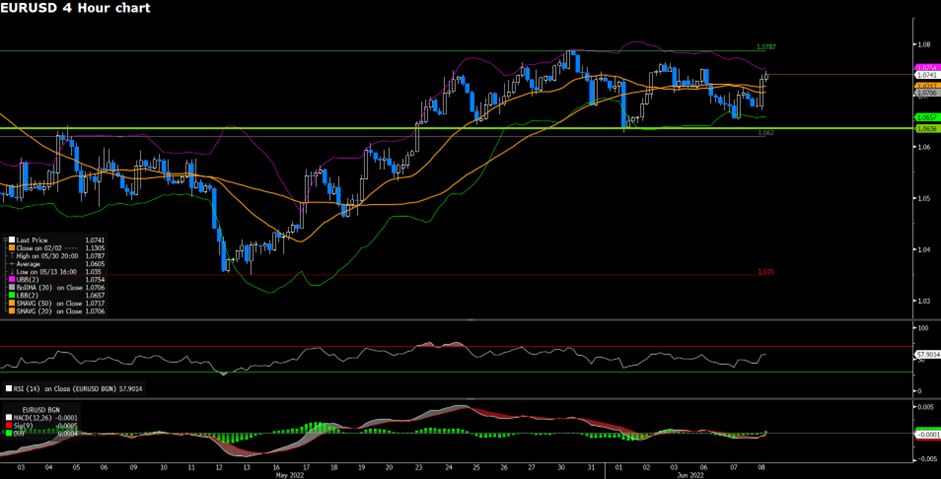
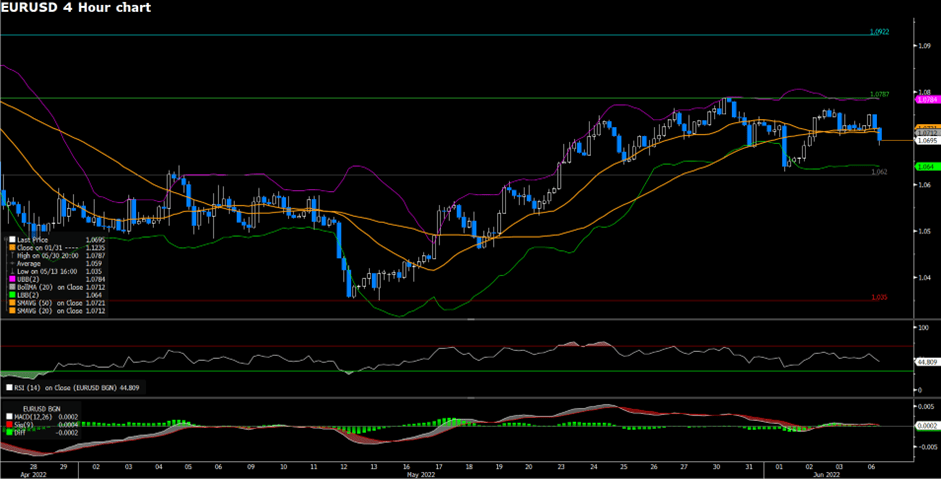
EURUSD continued to plunge on the first trading day of the week. The EURUSD is now on its third consecutive losing day. The Euro has slid more than 2% after the ECB conference held on last Thursday. Inflation and worries over an impending recession have boosted demand for haven assets such as the U.S. Greenback. The U.S. Dollar remains in strong demand as the benchmark 10-year Treasury yield rises past 3.35%.
On the technical side, EURUSD has broken well below our previously estimated support level of 1.064. As of writing, EURUSD is heading towards its lowest level of 2022 and the support level of 1.03783. RSI for EURUSD currently sits at 35.95. On the four-hour chart, EURUSD is trading below its 50, 100, and 200-day SMA.
Resistance: 1.07454
Support: 1.03783
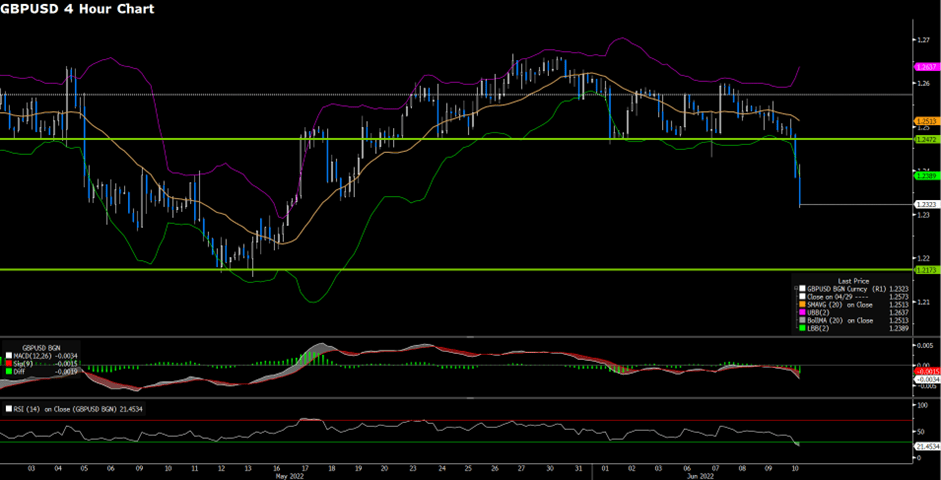
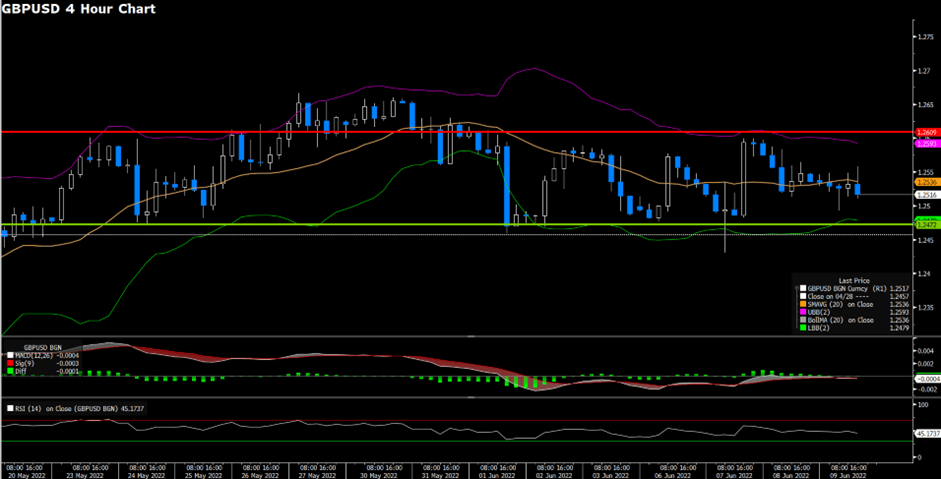
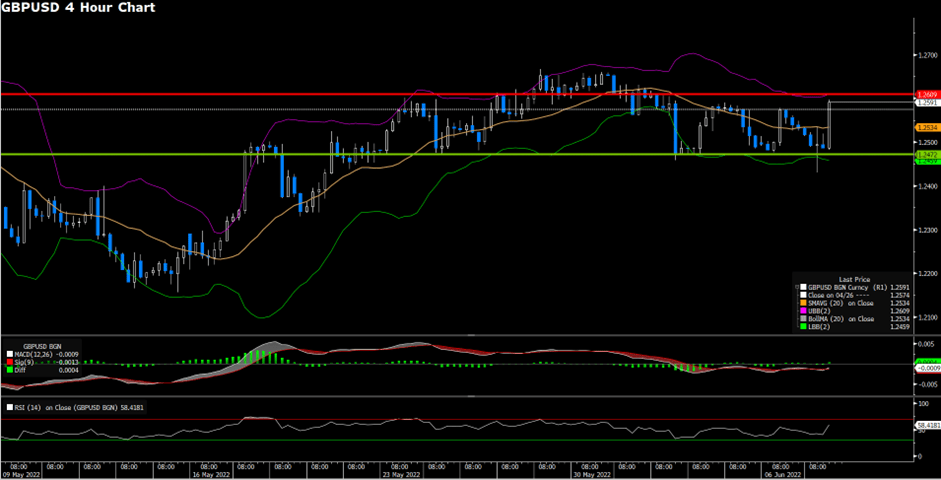
GBPUSD (4-Hour Chart)
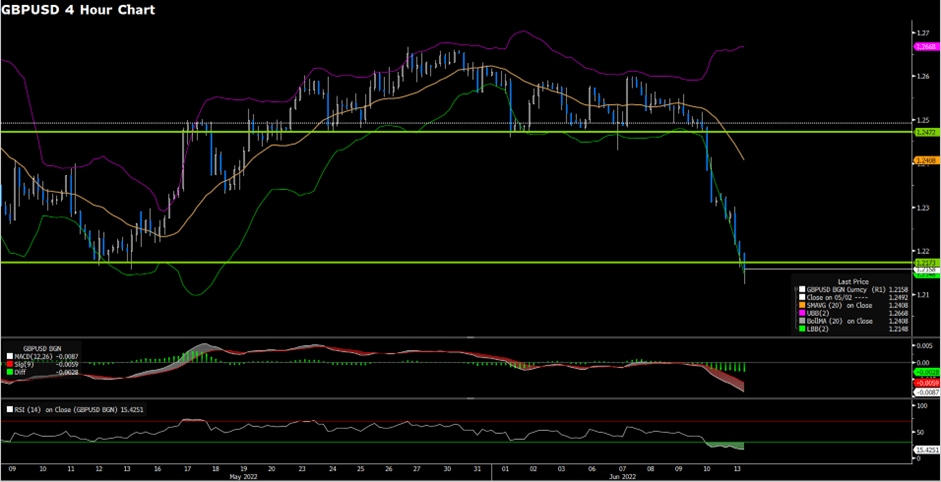
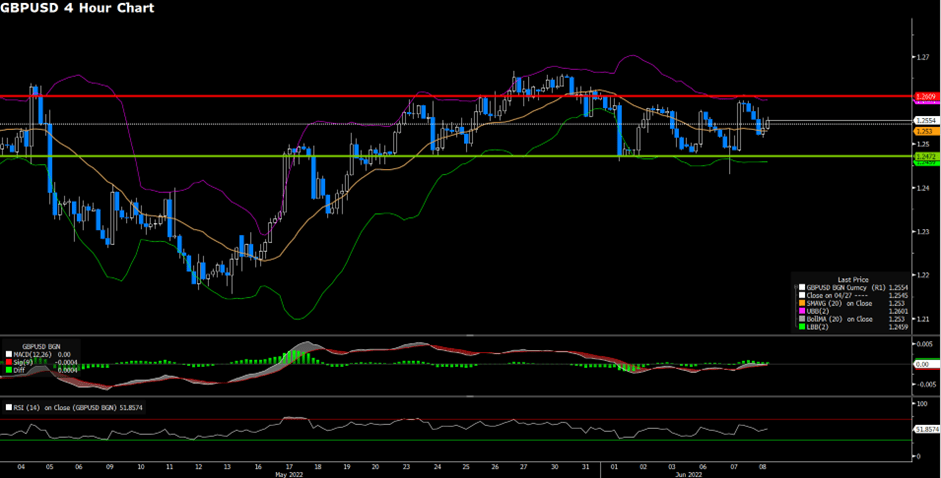
GBPUSD has continued to slide on the first trading day of the week. The British GDP contracted 0.3%, month over month, marking a larger contraction than the previous monthly figure of negative 0.1%. The slowing economy in Britain has agitated market participants as the ECB now faces the possibility of stagflation. The broad-based risk-averse market sentiment has only added fuel to the recent rally of the U.S. Greenback.
On the technical side, GBPUSD has dropped below its May low of 1.21996 and is heading towards two-year-long support at 1.20824. RSI for Cable has dropped to 33.42, as of writing. On the four-hour chart, GBPUSD is currently trading below its 50, 100 and 200-day SMA.
Resistance: 1.25944
Support: 1.20824
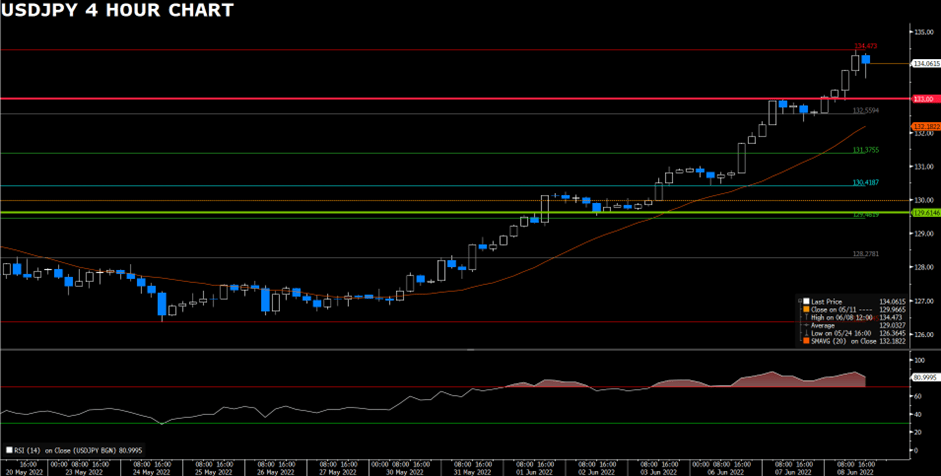
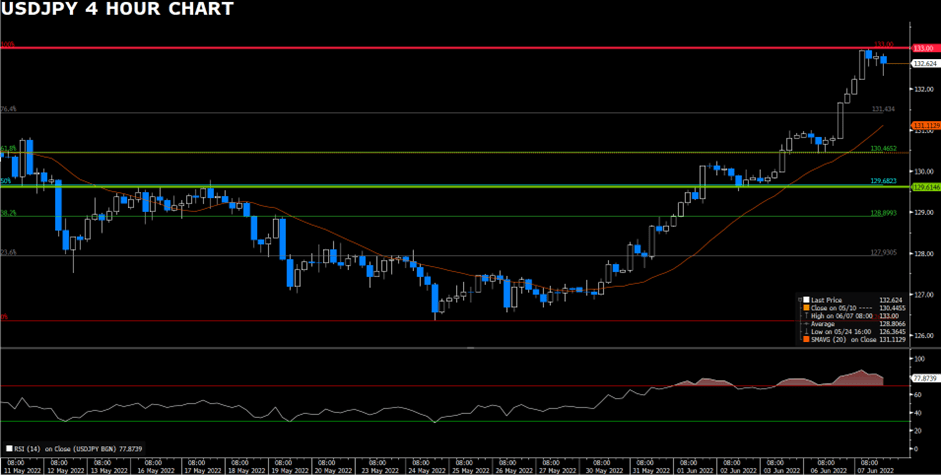
USDJPY (4-Hour Chart)
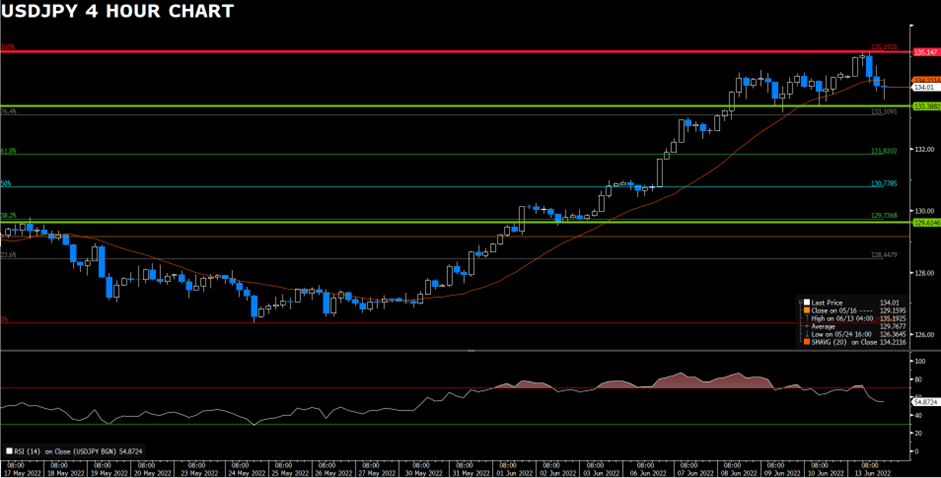
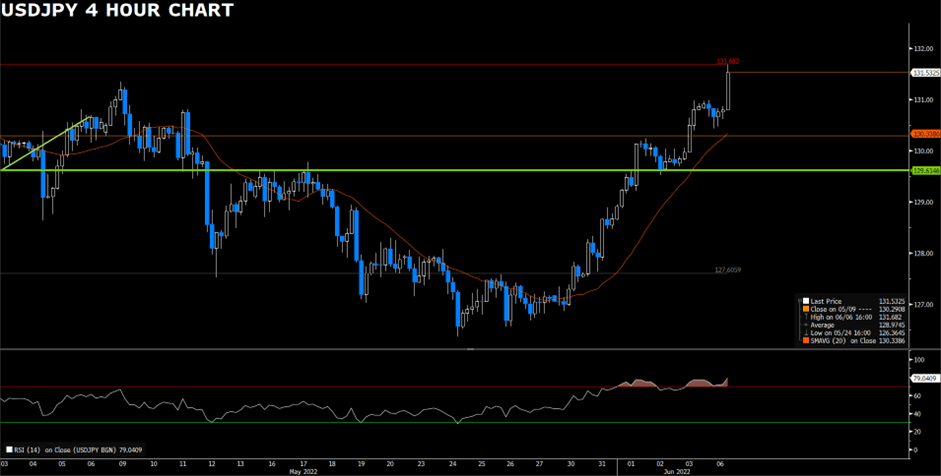
USDJPY continued to be traded at extremely elevated levels. The Dollar’s strength has been aided by the soaring U.S. 10-year treasury yield and a broad-based risk-averse environment. BoJ chief Haruhiko Kuroda recently expressed concerns over the sharp drop of the Japanese Yen, however, the Japanese Yen will continue to fare worse against the Dollar as market participants are now pricing in a possible 75 basis point interest rate hike by the Federal Reserve.
On the technical side, USDJPY seems to have hit its near-term resistance level at the 135 price region. A near-term support level at 133.382 has formed, while the lower level of support remains firm. RSI for USDJPY has reached overbought territory and is indicating 74.12, as of writing. On the four-hour chart, USDJPY currently trades above its 50, 100, and 200-day SMA.
Resistance: 134.56
Support: 133.5, 132.5
Economic Data
| Currency | Data | Time (GMT + 8) | Forecast |
| GBP | Average Earnings Index + Bonus (Apr) | 14:00 | 7.6% |
| GBP | Claimant Count Change (May) | 14:00 | -49.9K |
| EUR | German ZEW Economic Sentiment (Jun) | 17:00 | -27.5 |
| USD | PPI (May) | 20:30 | 0.8% |