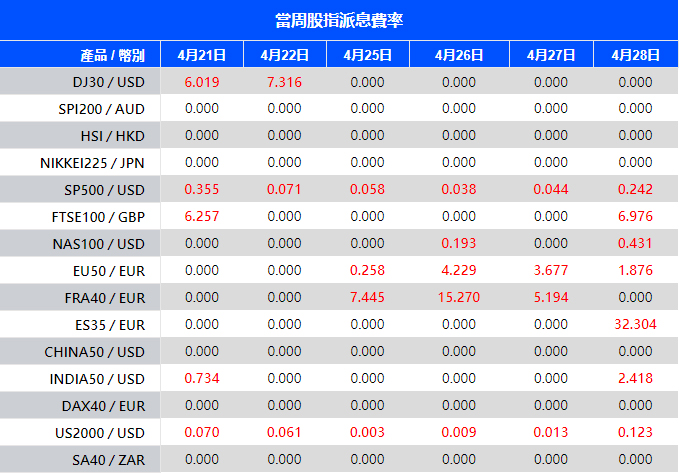
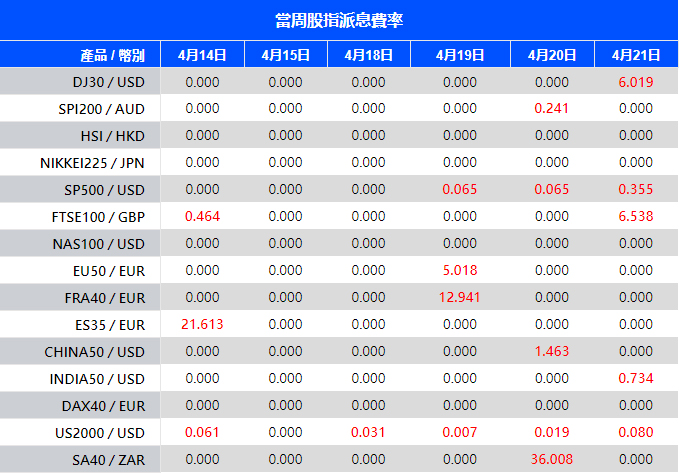
Warmly reminds you that the component stocks in the stock index spot generate dividends. When dividends are distributed, VT Markets will make dividends and deductions for the clients who hold the trading products after the close of the day before the ex-dividend date.
Indices dividends will not be paid/charged as an inclusion along with the swap component. It will be executed separately through a balance statement directly to your trading account, the comment for which will be in the following format “Div & Product Name & Net Volume ”.
Please note the specific adjustments as follows:
Note: The above data is for reference only, the actual execution date may be changed, please refer to the MT4/MT5 software for details.
If you’d like more information, please don’t hesitate to contact
[email protected]
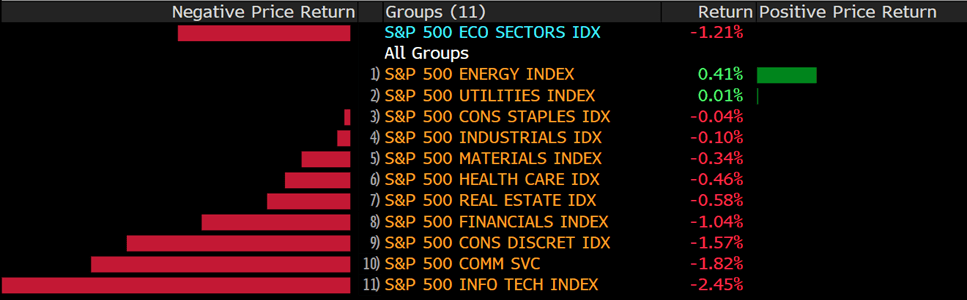
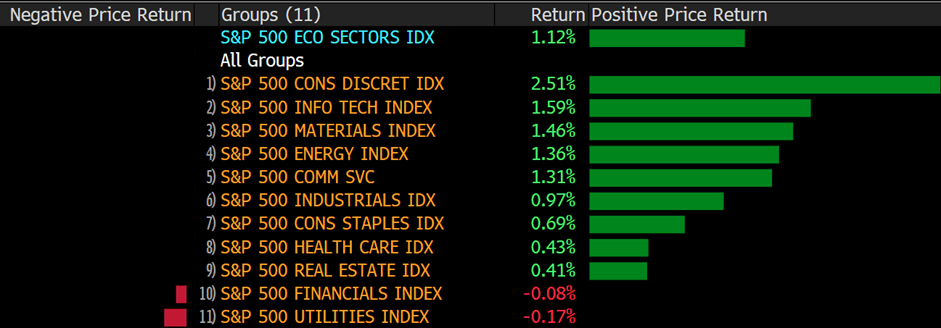
U.S. equities closed mixed Wednesday as investors took in a host of quarterly earnings results and looked ahead to more data. The Dow gained to extend advances from the previous session. The S&P 500, and the tech-heavy Nasdaq Composite underperformed as Netflix (NFLX) shares slumped after the company posted an unexpected decline in quarterly subscriber numbers. The streaming giant posted its worst day since 2004, with the stock down just over 35% by the end of the trading day.
Tesla Inc. reported better-than-expected first-quarter results, underpinned by strong demand for its electric vehicles, with Elon Musk predicting the output will grow at a fast pace for the rest of the year despite supply-chain challenges.
The first major U.S. automaker to report financial results for the first three months, Tesla easily beat estimates with a record profit. It cautioned that production remains constrained by shortages and higher prices for key components, a common refrain for automakers due to global bottlenecks in supplies of parts such as semiconductors.
But CEO Musk said Tesla should be able to make up for any production shortfalls in the first half of the year from pandemic shutdowns at its factory in Shanghai and is on track to expand production to more than 1.5 million vehicles this year. It delivered about 936,000 cars in 2021.
“We may pull a rabbit out of the hat,” Musk said on a conference call Wednesday. “Q3 and Q4 will be substantially higher.”
Main Pairs Movement
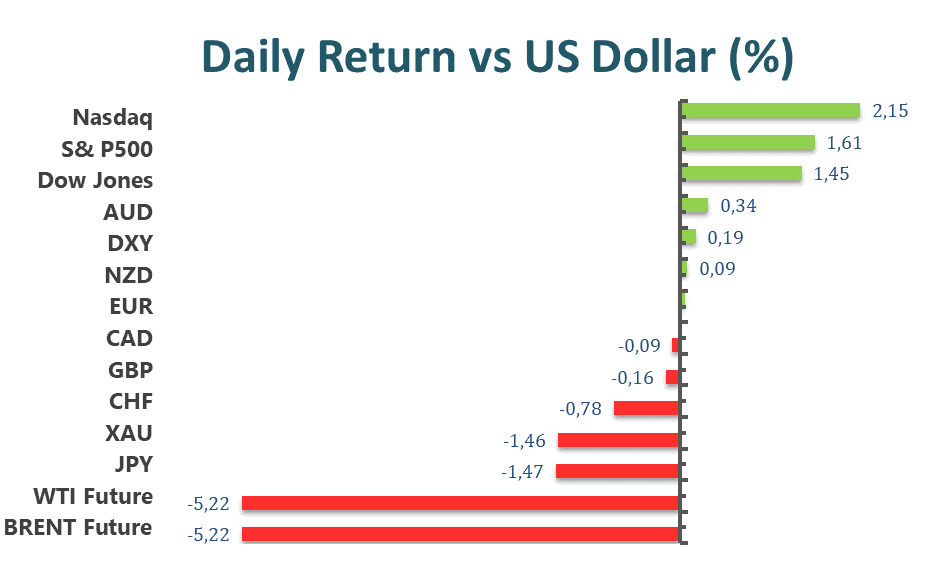
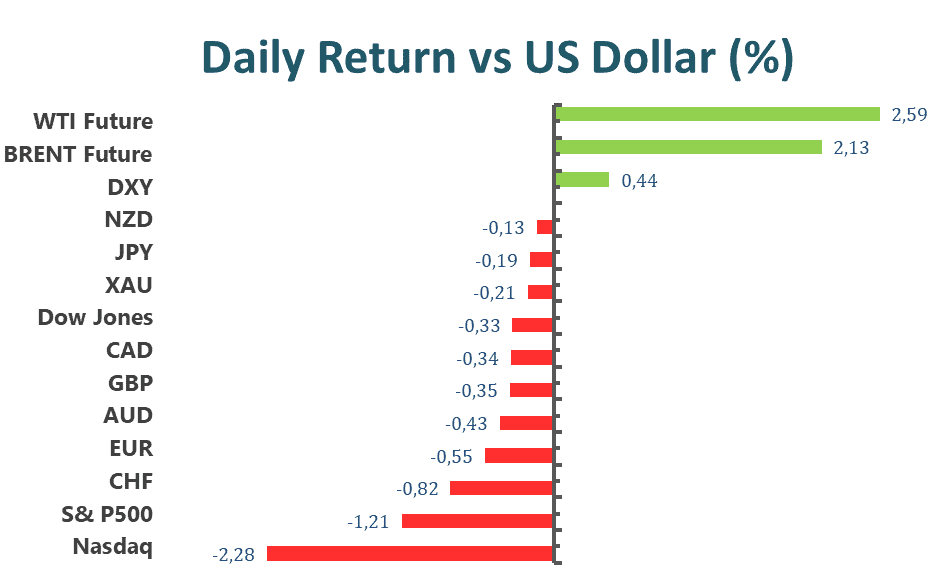
The US dollar succumbed to profit-taking on Wednesday as US yields pared back from multi-year highs, burnishing the greenback’s investment appeal somewhat. The US Dollar Index (DXY) slid back 0.6% to the low 100.00s having hit its highest levels since March 2020 above 101.00 on Tuesday, weighed primarily by downside in USD/JPY as the yen received some overdue respite.
USD/JPY dropped just over 0.8% on the day to back under the 128.00 level, more than 1.2% below intra-day multi-decade highs at 129.40 hits earlier in the session. But at current levels near 127.75, the pair still trades over 1.0% higher on the week and over 5.0% higher on the month, with little sign of a more meaningful yen rebound unless the BoJ signals some sort of policy stance shift.
The euro and sterling gained some ground against the US dollar counterpart on Wednesday, with decent Eurozone Industrial Production figures and hawkish ECB chatter about a potential July hike boosting the euro. However, the main driver of EUR/USD’s 0.6% recovery to the 1.0850 area and GBP/USD’s 0.5% rebound to above 1.3050 were probably the broad dollar weakness.
The commodity-linked currencies were notable outperformers on Wednesday. AUD/USD jumped about 1.0% to near 0.7450, NZD/USD gained about 1.0% to reclaim 0.6800 and test its 50-Day Moving Average at 0.6813, and USD/CAD dropped to two-week lows under 1.2500.
Technical Analysis
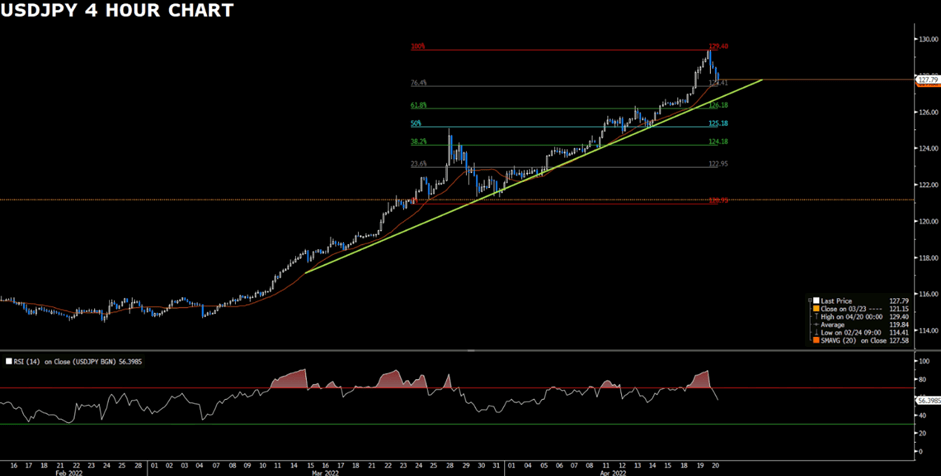
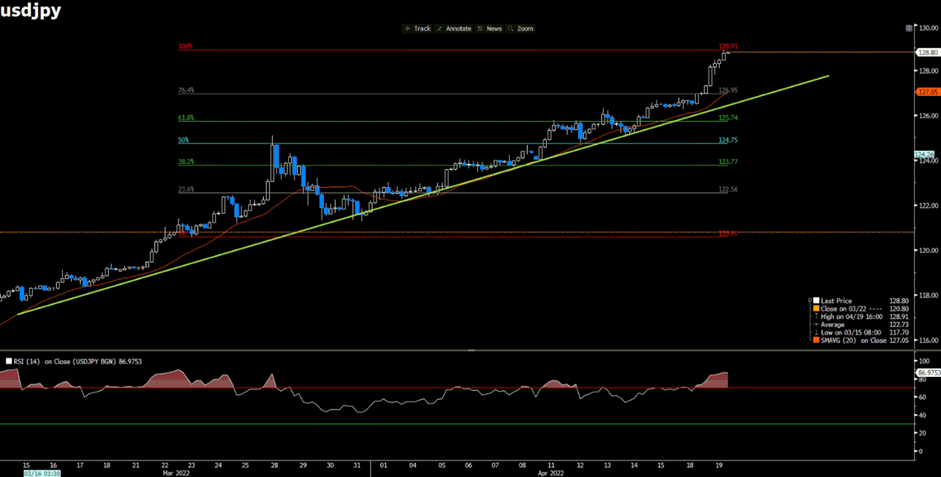
USDJPY (4-Hour Chart)
USDJPY heads south after surging toward 129.00 earlier today; the more- than 2.5% drop in the US 10- year yield seems to be weighing on USDJPY on Wednesday. Technically speaking, USDJPY remains bullish on the four-hour chart despite the sharp decline on Wednesday. The 100% Fib. The Retracement level at 129.4 looks to be a static resistance as the pair confronts a technical correction after hitting the resistance. At the time of writing, USDJPY is heading toward the immediate support at 127.41; failure to defend the level will make USDJPY turn downside in the near- term due to falling below the 20 SMA. To the upside, as long as the pair can stay above the ascending trendline, the outlook of USDJPY would remain bullish.
Resistance: 129.4
Support: 127.41, 126.18, 125.18
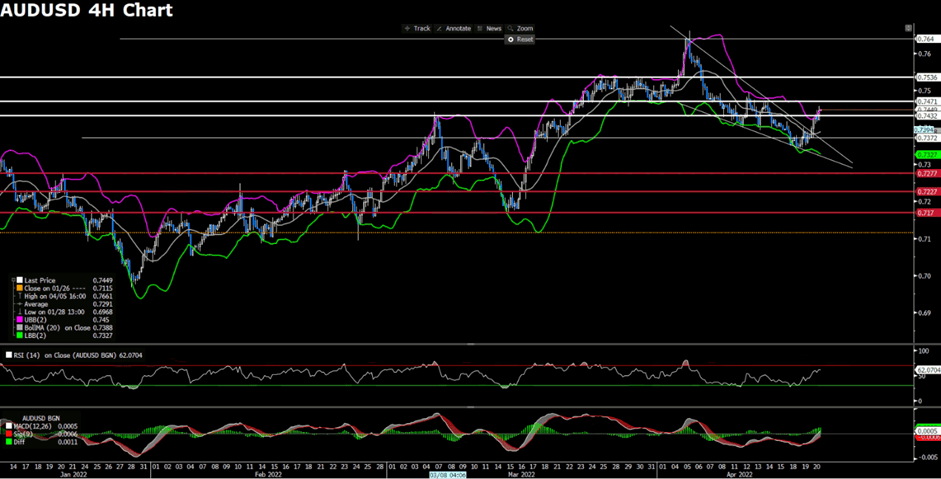
AUDUSD (4-Hour Chart)
AUDUSD recovers to strong intraday gains around 0.7430, just a few pips below the weekly high. From the technical perspective, the outlook of AUDUSD turns positive on the four-hour chart following the breakout of the descending triangular trendline. In the meantime, the breakthrough of the resistance level at 0.7432 brings the pair to near-weekly highs. The acceptance above the next immediate hurdle at 0.7471 will re-confirm AUD’s bullish tone; at the same time, trading above the level would possibly attract some follow-through buying. As the RSI indicator has not yet reached the overbought territory, there are rooms for AUDUSD to trade further north while the MACD has turned positive today.
Resistance: 0.7471, 0.7536
Support: 0.7432, 0.7372
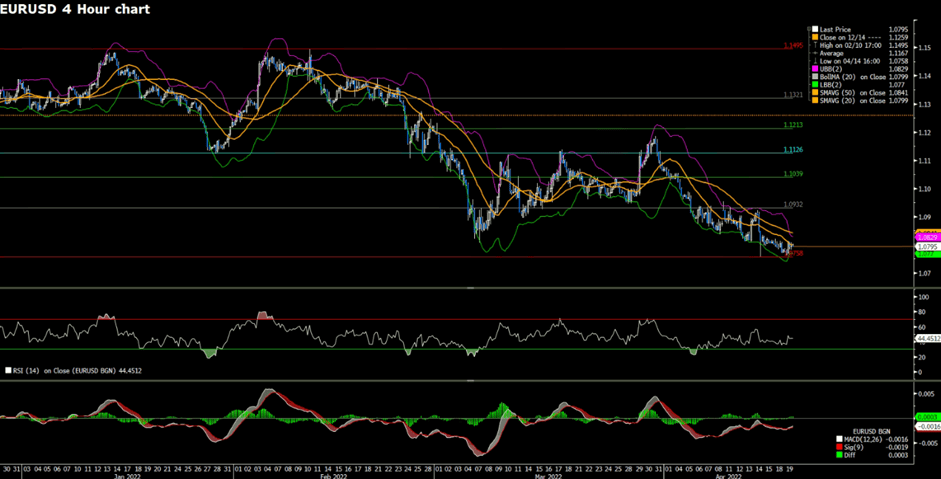
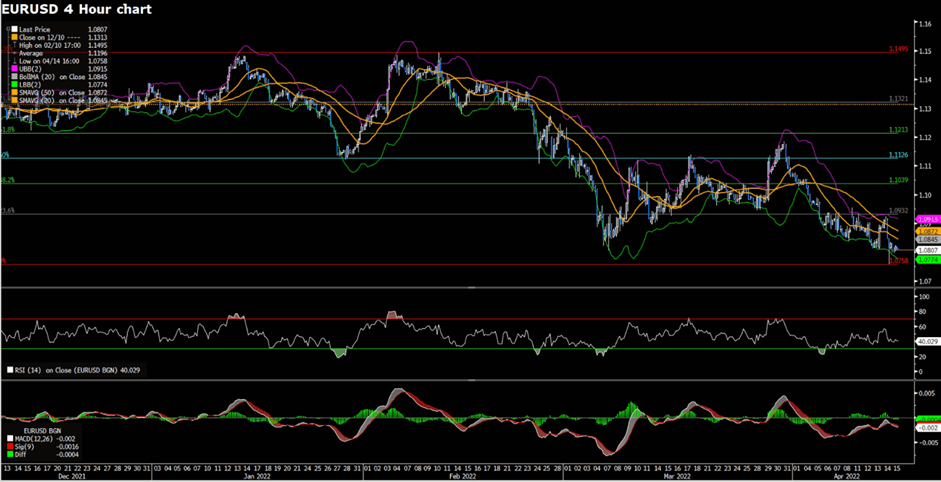
EURUSD (4-Hour Chart)
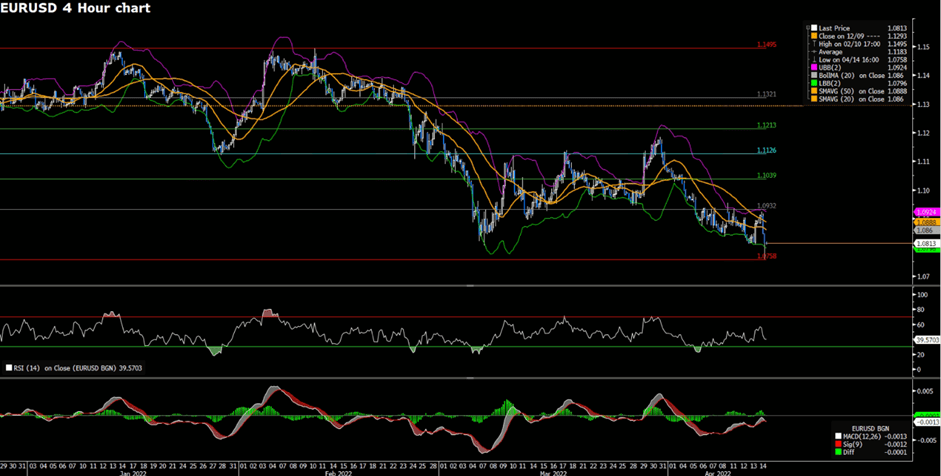
EURUSD regains traction, climbing above 1.0850 as the US dollar weakens against its rival currencies following the more- than 2.5% decline in the US 10- year yield. From the technical perspective, EURUSD heads positively for a second consecutive day but is still far from turning bullish overall. However, as the pair has finally traded above its 20 and 50 SMAs, EURUSD turns upside in the near- term. The pair is expected to head toward the next immediate hurdle at 1.0932 as the RSI indicator has not reached the overbought territory and is currently located within the positive level, giving EURUSD room to extend further north.
US equities climbed Tuesday, recouping some of the week’s losses as investors sifted through a barrage of quarterly reports for signs of how corporate America fared against the backdrop of Eastern Europe’s war and mounting inflationary pressures. The S&P 500 increased by 1.6 percent to its highest level in a month, while the Dow Jones Industrial Average closed 500 points higher. The Nasdaq Composite, which is heavily weighted toward technology, extended gains to 2.2 percent after finishing at a one-month low on Monday, along with the S&P 500.
Netflix Inc. has hit a brick wall following a decade of spectacular growth that rocked Hollywood to its core.
According to a statement released Tuesday, the streaming service lost 200,000 users in the first quarter, the first time since 2011. Additionally, Netflix anticipates losing another 2 million users in the current second quarter, putting the business on track to have its worst year as a public company.
Investors, analysts, and Hollywood executives had anticipated Netflix would announce a slow start to the year, but Wall Street expected the company to add 2.5 million members. The shares, which had already fallen more than 40% this year, fell as much as 24% to $265.11 in after-hours trading.
Netflix management cited four possible explanations, including the widespread usage of password sharing and increased competition. The corporation claims that 100 million households utilize its service without paying for it, in addition to its 221.6 million paying customers. The corporation is experimenting with different methods of registering such viewers.
“Our relatively high home penetration – when combined with the vast number of families that share accounts – combined with competition is causing headwinds for revenue growth,” management noted in a letter to shareholders.
Main Pairs Movement
The Japanese yen was hammered on Tuesday as rising global bond yields increased pressure on G10/Japan interest rate differentials, reducing the attractiveness of the low-yielding safe-haven currency as an investment. Needless to say, the yen was the worst-performing major G10 currency, with USD/JPY soaring about 1.4 percent to its highest level since early 2002 in the upper 128.00s.
EUR/USD and GBP/USD both traded roughly flat near 1.0800 and 1.3000, respectively, despite the return of normal European flows following Monday’s Easter holiday closures. On Tuesday, relevant fundamental data, as well as updates on the Russia-Ukrainian war, were scarce, resulting in lethargic trading conditions.
Finally, the antipodes remained rather calm. The Australian dollar is a minor G10 outperformer following Tuesday’s slightly hawkish RBA minutes release, in which the bank underlined elevated projected inflationary pressures and suggested an early rate hike. The AUD/USD pair recovered roughly 0.4 percent to the 0.7375 regions, having rallied off the 0.7340s 50-Day Moving Average. Meanwhile, NZD/USD traded flat at around 0.6730, remaining near to the more than one-month lows reached on Monday at just around 0.6700.
Technical Analysis
USDJPY (4-Hour Chart)
USDJPY surges toward 128.80 on Fed-BOJ divergence, following the US Fed, which is more aggressive and hawkish while the BOJ is positive on a weak Japanese Yen. From the technical perspective, the outlook of USDJPY is certainly positive and bullish as it continues to trade aggressively above the ascending trendline. Despite the RSI indicator being way overbought, the fundamental point of view outweighs the technical indicator. On the flip side, USDJPY needs to decline below 125.74 in order to calm the current bullish momentum; any meaningful declines might attract some sellers for a technical correction.
Resistance: 128.91
Support: 126.95, 125.74, 124.750
XAUUSD (4-Hour Chart)
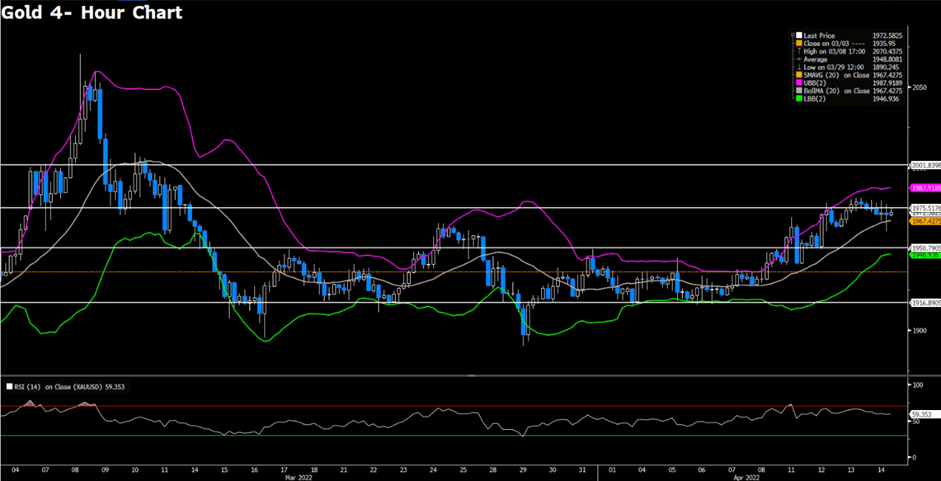
Gold is down on Tuesday, trading at around $1,955 after hitting nearly $2,000 per ounce on Monday. The demand for gold declines as the greenback is on the back of hawkish comments from the US Fed, saying that the possibility of a 75 bps interest rate hike. From the technical perspective, in the four-hour chart, chances are on the downside as the price has dropped below the bullish trendline and the midline of the Bollinger band. In the meantime, the RSI indicator has not yet reached the oversold territory, currently at 36 readings, meaning that the deportation of bulls is possible. A bearish continuation could be expected on a break below the support at $1,950.
Resistance: 1975. 2001
Support: 1950, 1916
EURUSD (4-Hour Chart)
EURUSD clings to a small recovery near 1.0800 on Tuesday after reaching near multi-month lows. Technically speaking, the outlook of the EURUSD remains on a bearish path; in the four-hour chart, despite turning positive intraday, EURUSD is still far below the bearish moving averages. At the same time, the RSI indicator remains within negative levels while the MACD continues to hover around the negative territory, suggesting that EURUSD remains pressured. In order to regain traction in the near- term, EURUSD at least needs to climb above the 20 SMA, then aims for the next hurdle at 1.0932. Otherwise, today’s positive move could be viewed as a technical correction.
To provide a more favorable trading environment to our clients, VT Markets will modify the trading settings of these Indices at the following time:
1. The leverage of ES35 and SA40 will be 200:1.
2. The trading time of FRA40 will be 01:00 – 24:00 (GMT+3)
3.The trading time of China50 will be 01:00 – 03:55,04:00 – 11:55,12:00 – 24:00 (GMT+3).
The modifications will be put into effect from 2022/04/25.
Note: The above data is for reference only. The actual execution date may be changed. Please refer to the MT4/MT5 software for details.
Friendly reminders:
1. All specifications of Indices remain the same except leverage and trading time.
2. Open positions of Indices can be kept after the modifications.
3. Margin levels might be affected by the modifications.
Please ensure sufficient funds in your trading account to keep holding your open positions.
If you’d like more information, please don’t hesitate to contact [email protected].
On Monday, US stocks extended their losses from the previous week as investors returned from a holiday weekend and prepared for another hectic week of corporate earnings reporting. Several large firms, including United Airlines (UAL), American Express (AXP), Netflix (NFLX), and Tesla (TSLA), released their most recent quarterly earnings reports. After oscillating between gains and losses throughout the session, the S&P 500 edged lower. Dow Jones and Nasdaq Composite both finished lower by 0.11 percent and 0.14 percent, respectively.
According to sources familiar with the subject, Apollo Global Management Inc. is interested in assisting with the financing of a bid for Twitter Inc. in response to Elon Musk’s $43 billion unsolicited offer to take the business private.
Apollo is considering a bid for Twitter and might provide Musk or another bidder, such as private equity company Thoma Bravo LP, with equity or financing to support an offer, the individuals said on condition of anonymity due to the nature of the conversations. According to one of the people, the involvement could take the shape of financing or preferred equity.
Twitter shares gained the most in two weeks on Monday as the social media firm launched a poison pill defense to foil Musk’s proposal to buy the company for $54.20 per share.
According to Bloomberg, Morgan Stanley is advising Musk, while Twitter has engaged the assistance of Goldman Sachs Group Inc. and JPMorgan Chase & Co. as it evaluates how to respond to Musk’s aggressive approach.
Main Pairs Movement
The US dollar held its ground against all of its main G10 peers, as the Dollar Index reached its highest level since April 2020 in the 100.80s. Traders noted expectations for a more aggressive Fed tightening cycle, which is evident in the rise in US rates across the curve, which boosted the greenback on Monday.
EUR/USD fell roughly 0.25 percent to retest the 1.0800 level and is now aiming for last week’s lows near 1.0750. GBP/USD fell roughly 0.4 percent to a little beyond 1.3000 and is also approaching annual lows, which are just below the 1.3000 mark in this case. NZD/USD plummeted almost 0.3 percent, falling below a critical level of support in the shape of the March low of 0.6728 and therefore reaching its lowest level since late February.
The Australian dollar was the poorest performance among the major G10 currencies, with AUD/USD plunging 0.6 percent to one-month lows below the 0.7350 level. The yen also performed poorly against a backdrop of rising US rates, with USD/JPY reaching its highest level since 2002 near 127.00. The loonie was the second-best performer among the G10 currencies, supported by increased oil prices. USD/CAD maintained a narrow range just around 1.2600 and below its 200- and 50-Day Moving Averages.
Commodities advanced for a third consecutive day on Monday. Gold briefly rose to nearly $2,000 per troy ounce but then retreated to more familiar levels by the day’s conclusion, closing 0.27 percent higher. Crude oils also posted modest increases, with WTI up 0.9 percent to $106.90 per barrel and Brent rising 1.38 percent to $112.70.
Technical Analysis
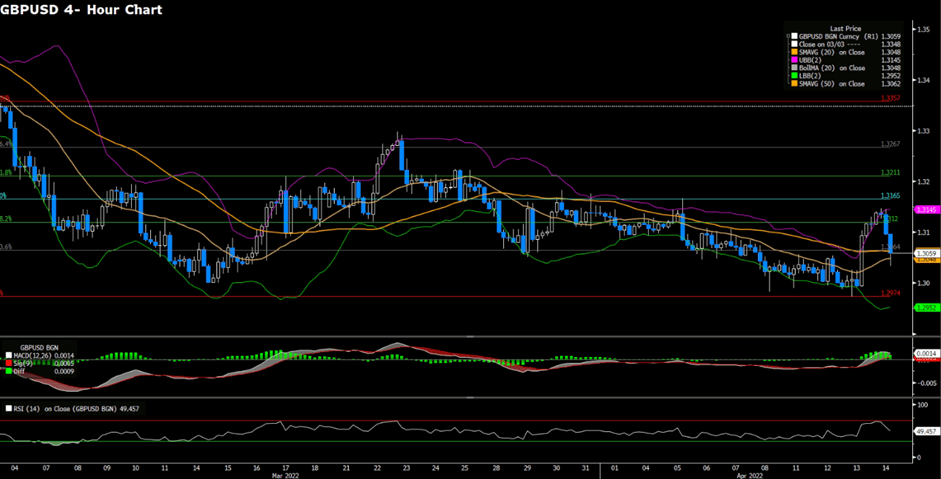
GBPUSD (4-Hour Chart)
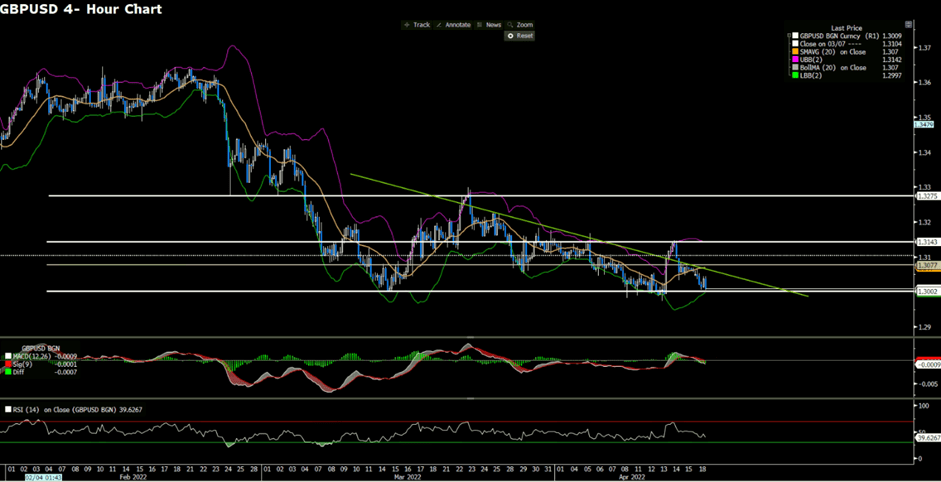
GBPUSD edges lower, staying below 1.3050, as the market mood remains cautious on Monday, boosting the greenback to the highest level. From the technical perspective, the decline from last week has brought GBPUSD to bearish territory. GBPUSD continues to lose traction, testing the support at 1.3002. The breakout of the support at 1.3002 will attract more sellers, accelerating the downside toward the next hurdle. In the meantime, the RSI indicator stays near 40, suggesting that the latest recovery attempt was a technical correction and the GBP buyers remain hesitant and cautious.
Resistance: 1.3077, 1.3275 Support: 1.3002
XAUUSD (4-Hour Chart)
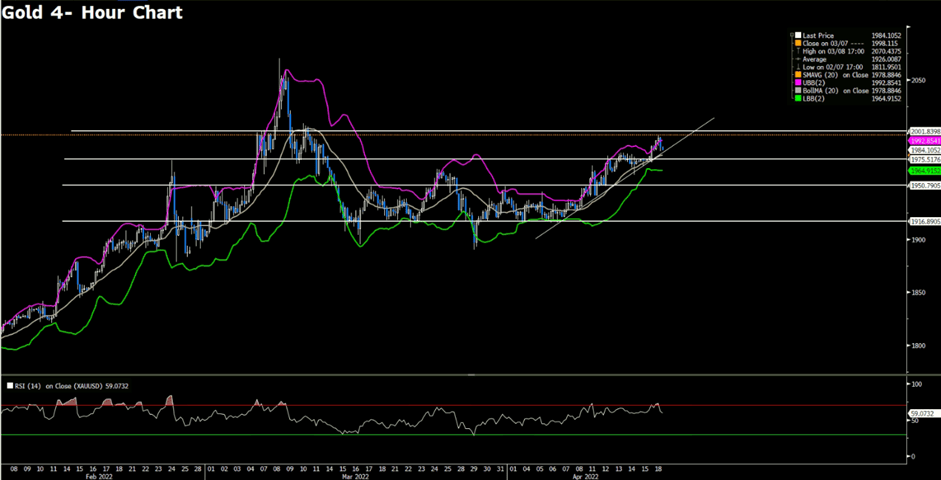
Gold extends its rally toward $1,990 per ounce, aiming for $2,000 as the US yields turn south. From the technical perspective, the bulls are in control and taking on fresh highs. The four-hour outlook of gold remains bullish as it continues to trade within the ascending trendline and above the midline of the Bollinger band. In the meantime, the 20 SMA is scaling higher, adding to the upside filter. The RSI indicator has not reached the overbought territory, which indicates a potential bullish momentum that might continue to go forward.
Resistance: 2001 Support: 1975, 1950, 1916
EURUSD (4-Hour Chart)
EURUSD is back under pressure as the US dollar advances to the highest in two years. From the technical aspect, EURUSD’s intraday bias remains downside and under pressure as the price trades below the 20 and 50 SMAs and trades within the lower bounce of the Bollinger band. The bearish momentum is now heading toward the immediate support level at 1.0758; failure to defend the level will lead EURUSD further south, accelerating its downside pressure. The near-term outlook of the EURUSD also exposes the bearish picture; the RSI indicator hovers near 40, suggesting an absence of buyers. The MACD continues to signal within the negative territory, lending supports to bears.
US equities stopped trading due to the holidays, while Asian stocks look set for a muted open Monday before Chinese economic data that may shed light on the impact of Covid lockdowns. Japan’s equity futures fell, while other markets, including Australia, Hong Kong, and a large portion of Europe, remained closed for Easter. Contracts for the S&P 500 and the Nasdaq 100, which are heavily weighted toward technology, fell.
According to Goldman Sachs Group Inc., the Federal Reserve will face a difficult task in tightening monetary policy sufficiently to contain inflation without triggering a US recession during the next two years. The Fed’s primary challenge is to close the wage gap and slow wage growth to a level consistent with its 2% inflation target by tightening financial conditions sufficiently to reduce job openings without sharply increasing unemployment, Chief Economist Jan Hatzius wrote in a research report published on Sunday.
Achieving a so-called gentle landing may be difficult, as historically big drops in the gap have occurred exclusively during recessions in the United States. “At face value, these historical tendencies indicate that the Fed confronts a difficult path to a smooth landing,” Hatzius said. A recession is not a foregone conclusion, Hatzius noted, because the Fed will benefit from post-Covid-19 normalizations in labor supply and durable goods prices. There are more instances of countries in the Group of 10 advanced economies – which includes Belgium, Canada, France, Germany, Italy, Japan, the Netherlands, Sweden, Switzerland, and the United Kingdom – that have successfully implemented a gentle landing, he said.
Main Pairs Movement
The economic data released this week in the United States were highlighted by the highest monthly increase in the Consumer Price Index (CPI) since September 2005. Households are feeling the pinch as a result of soaring prices for necessities, as evidenced by this week’s retail sales figures. However, underneath the surface, there are signs that pandemic-related inflation is beginning to ease.
Recent UK economic figures followed the global trend toward greater inflation and slower growth. The March CPI data release in the United Kingdom revealed that inflation pressures increased even further last month. Headline CPI is now at a 30-year high, quickening more than expected to 7% YoY.
Greenback won over most of its major rivals last week. The Euro pair closed the week 0.62 % lower at 1.0808, while Cable managed to climb 0.68% in the same period, last seen at 1.3055. The Japanese Yen depreciated by 1.67%, at 126.35 against the US dollar, while its Chinese peer stayed almost sidelined in value. Commodity-linked currencies were also limped during last week’s trading, with USD/CAD up 0.40% to 1.2572, and AUD/USD down 0.51% to 0.7458.
Technical Analysis
GBPUSD (4-Hour Chart)
GBPUSD steadies in a tight range above 1.3050 after the ECB’s policy decision yesterday. From the technical view of point, GBPUSD’s bears seem to face corrective action on the four-hour chart. The currency pair has been corrected to a near 50- period Simple Moving Average and now is providing an optimal opportunity for the buyers as the MACD turns positive, lending some support to bulls. At the same time, the RSI indicator continues to hover around the midline, suggesting the directionlessness of the price. Failure to defend the current support level will turn the currency pair to the downside, heading further south toward 1.2974.
AUDUSD does not move significantly in a sleepy session on Friday; however, the downside looks ahead as the demand for the safe-haven dollar continues to gain traction. From the technical perspective, the outlook of AUDUSD looks downside since early April as the support level at 0.7471 was broken. And now, the bearish double top formation reconfirms AUDUSD’s bears. As the RSI has not reached the oversold territory and is within the negative area, AUDUSD has room to decline further south toward the next support at 0.7372. The bulls seem to lack momentum unless the pair climbs back above 0.7471.
EURUSD recovers above 1.0800 after suffering the heavy slump from Thursday. With the market moves subdued on Easter Friday, EURUSD edges slightly higher. From the technical aspect, the intraday bias continues to be bearish for EURUSD as the pair still trades below the 20 and 50 Simple Moving Averages. At the time of writing, despite EURUSD moving slightly higher on Friday, it faces the immediate support at 1.0758 and 1.0800, the psychological support; in case both levels turn into resistances, the pair can test 6- month lows if the levels fail to defend.
As part of our commitment to provide the best reliability and service to our clients, the trading hours of certain products will be adjusted as follows due to the maintenance.
Please be reminded that the following aspects might be affected during this maintenance period:
1. The functions of client portal operations might be disabled during this period.
2. There might be a gap between the original price and the price after maintenance. Pending orders, Stop Loss, and Take Profit settings within the gap will be filled at the market price after maintenance activity ends.
3. The quotations of products will be paused. Clients may not be able to open new positions or close the held positions.
No action is required by our client. Your service will be back online after the maintenance is completed.
Thank you for your patience and understanding about this important initiative.
If you’d like more information, please don’t hesitate to contact [email protected].
U.S. stocks fell Thursday to cap another losing week on Wall Street as investors digested a series of bank earnings and reeled from more red-hot CPI numbers. The S&P 500 and tech-heavy Nasdaq Composite each settled at four-week lows, recording declines of 1.2% and 2.2%, respectively. The Dow Jones Industrial Average fell 0.3 percent following a brief rise earlier in the morning. Meanwhile, Treasury yields climbed higher, with the 10-year benchmark marking its biggest one-week jump to hit 2.8%, the highest level since December 2018.
According to sources familiar with the subject, Twitter Inc.’s board of directors is considering adopting a measure that would shield the company against hostile acquisition offers in response to billionaire Elon Musk’s unsolicited offer to take the company private.
One of the options under consideration is adopting a poison pill, known as a shareholder rights plan, said the people, who asked not to be identified as discussing private deliberations. The poison pill could be announced as early as tomorrow by Twitter. Another possibility is to assert that the offer is excessively low, as one individual has stated.
Tesla Inc.’s CEO proposed $54.20 per share in cash for Twitter on Thursday, valuing the social media business at $43 billion. Musk, who stated that this was his “final and best” bid, had already amassed a stake in Twitter of more than 9% earlier this year. Twitter’s board of directors met Thursday to discuss Musk’s proposal and evaluate whether it was in the company’s and all of its shareholders’ best interests. The corporation did not respond to a request for comment on the offer or the board’s approach.
A poison pill defensive tactic permits current shareholders to purchase additional shares at a discount, therefore reducing the hostile party’s ownership interest. Poison pills are frequently used by corporations facing activist investors or hostile takeover attempts.
Main Pairs Movement
The dollar recovered some of its recent gains ahead of the close as speculative investors booked profits ahead of the Good Friday holiday when the majority of financial markets will be closed.
Following the European Central Bank’s dovish monetary policy announcement, the Euro pair fell to 1.0765, its lowest level in two years. The ECB held rates steady, as expected, and reiterated its intention to stop its bond-buying program in the third quarter of this year. April’s monthly net purchases will total €40 billion, May’s will total €30 billion, and June’s will total €20 billion.
Cable ended the day near 1.3070, down for the day but well off intraday lows. On the other hand, commodity-linked currencies closed the day near their daily lows versus the dollar. The Australian dollar is trading around 0.7410, while the Canadian dollar is hovering around 1.2615. The USD/JPY pair ended the day at about 125.90.
Gold fell 0.22 percent on the day to $1,973.40 per troy ounce. On Thursday, when the Russian oil embargo took effect, crude oils ended in the green for the third consecutive session. Concerns about inflation propelled US government bond yields to multi-year highs. The 10-year Treasury note yield peaked at 2.835 percent and is now trading at 2.82 percent.
Technical Analysis
GBPUSD (4-Hour Chart)
GBPUSD falls hard toward 1.3000 on renewed US dollar strength, boosted by the ECB’s dovish speech and rising US bond yields. From the technical perspective, the outlook of GBPUSD turns to the downside as it falls back to the descending trendline and below the 20 Simple Moving Average. At the time of writing, the British pound attempts to defend its support level at 1.3064; failure to defend this level would re-confirm GBPUSD’s bearish momentum toward 1.2974. The RSI indicator on the four-hour chart stays slightly above the midline, implying that GBPUSD might still have rooms to move further south. On the flip side, GBPUSD needs to climb back above the resistance level at 1.3120 to reclaim a positive stance.
Resistance: 1.3120, 1.3165, 1.3211
Support: 1.3064, 1.2974
XAUUSD (4-Hour Chart)
Gold gives up some ground on Thursday amid the resurgence of the US dollar’s demand. From the technical aspect, the four-hour chart for gold shows that it continues to trade above the midline of the Bollinger band, suggesting that gold stays in the bullish mood. The RSI indicator has slightly turned lower, but it still hovers and develops within the positive levels, indicating prevalent buying interests. On the upside, if gold eventually can break through the resistance at $1975, it will re-confirm the upside momentum, accelerating toward the next hurdle at $2001.
Resistance: 2001
Support: 1975, 1950, 1916
EURUSD (4-Hour Chart)
EURUSD slides to fresh two-year lows below 1.0800 as the ECB leaves its policy rates unchanged. From the technical perspective, the intraday bias remains bearish since EURUSD continues to trade within the descending trendline and below the 20 and 50 Simple Moving Averages. In the meantime, the RSI indicator remains below the midline, suggesting the absence of buying interests; the MACD continues to edge into the negative territory, lending supports to bears. At the moment, 1.0758 would be the support pivot for the pair, failure to defend the level would accelerate the bearish momentum.
Warmly reminds you that the component stocks in the stock index spot generate dividends. When dividends are distributed, VT Markets will make dividends and deductions for the clients who hold the trading products after the close of the day before the ex-dividend date.
Indices dividends will not be paid/charged as an inclusion along with the swap component. It will be executed separately through a balance statement directly to your trading account, the comment for which will be in the following format “Div & Product Name & Net Volume ”.
Please note the specific adjustments as follows:
Note: The above data is for reference only, the actual execution date may be changed, please refer to the MT4/MT5 software for details.
If you’d like more information, please don’t hesitate to contact [email protected].
On Wednesday, US stocks climbed as investors digested a series of carefully anticipated quarterly reports and continued to absorb a scorching reading on US inflation. The S&P 500 index gained more than 1%, snapping a three-day losing trend. The Nasdaq Composite excelled and gained 2% as technology stocks rallied and Treasury yields across the curve fell. Early Wednesday morning, investors received several quarterly reports from several significant US firms and stock index components. These included JPMorgan Chase (JPM), the largest bank in the United States in terms of assets, Delta Air Lines (DAL), and Bed, Bath & Beyond (BBB) (BBBY).
Inflation is on the rise, central banks are on the move, and earnings season has here. To top it off, stock traders must contend with the market-roiling prospect of a monthly options expiry worth more than $2 trillion.
Approximately $495 billion in single-stock derivatives are expected to expire Thursday, followed by $980 billion in S&P 500-linked contracts and $170 billion in options tied to the State Street fund that tracks the S&P 500, according to estimates from Goldman Sachs Group Inc.’s Rocky Fishman. Volumes of this nature have been a cause of volatility throughout the last year.
While nothing is certain in markets, indexes have historically declined on days when contracts are closed out. This time, it comes as equities endure yet another round of volatility, with the S&P 500 recording only four positive days since the month began.
Main Pairs Movement
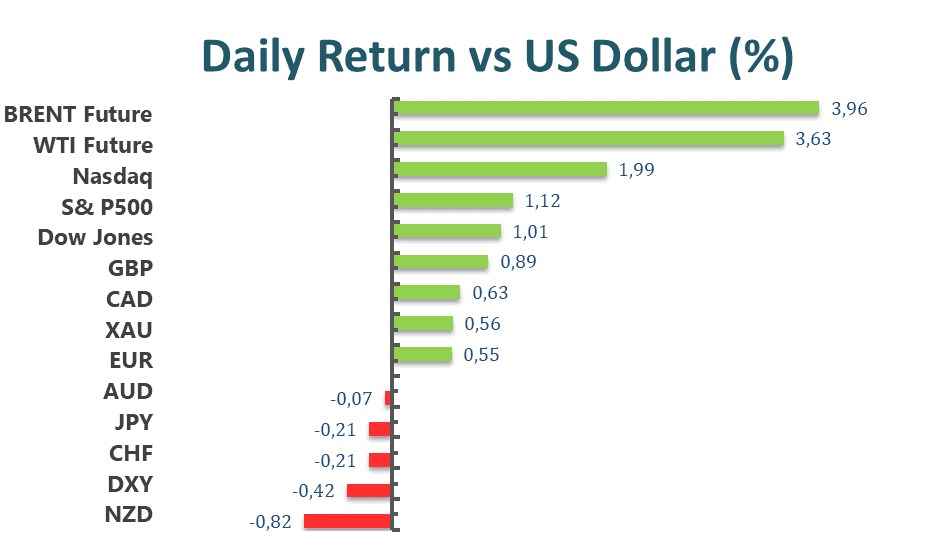
Inflation, central banks, and the Eastern European crisis remained at the center of the market’s attention, weighing on sentiment. The latest UK CPI increased to a three-decade high of 7%, while the US CPI increased by 8.5 percent year on year, both figures above expectations.
The Bank of Canada boosted benchmark interest rates by 50 basis points to 1.00 percent and also revealed intentions to begin shrinking its balance sheet on April 25, citing an increased risk of forecasts of rising inflation becoming entrenched. Earlier that day, the RBNZ increased the official cash rate by 50 basis points to 1.5 percent. Today, the European Central Bank will make its monetary policy announcement.
For the time being, Germany has opposed the EU’s ban on Russian oil, while Moscow has announced that US and NATO vehicles bringing weaponry to Ukraine would be deemed valid military targets.
Euro/dollar is trading near 1.0880, while the cable is barely above the 1.3100 level. Australian trades in a range around 0.7440, while the Loonie closed in the red at 1.2565. USD/JPY hit a new multi-year high of 126.31.
Gold prices continue their upward trend, trading around a new multi-week high of $1,981.57 per troy ounce. Risk-off emotions in general, along with the dollar’s decline during the American session, kept the metal bid intact throughout the day. Crude oil prices continued to rise, reaching a high of $103.50 per barrel for WTI and $108.40 per barrel for Brent.
Technical Analysis
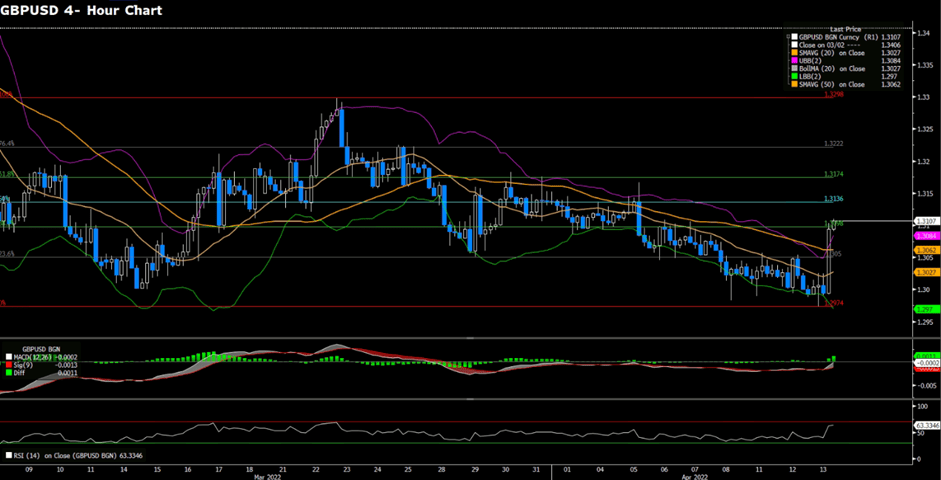
GBPUSD (4-Hour Chart)
GBPUSD trades near an intraday high of 1.3100 as market players drop the US dollar. Market players bet on the BOE’s monetary policy meeting next week. From the technical perspective, GBPUSD’s intraday bias punctuates the bearish tone as it successfully up-breaks the 20 Simple Moving Average and the midline of the Bollinger band. At the same time, the upside momentum also breaches the descending trend line on the four-hour chart. However, to attract bulls, GBPUSD needs to close its intraday price above 1.3098 to fully reclaim its bullish momentum. As the RSI has not reached the overbought condition, GBPUSD still has room to extend further north.
Resistance: 1.3136, 1.3174
Support: 1.3098, 1.305, 1.2974
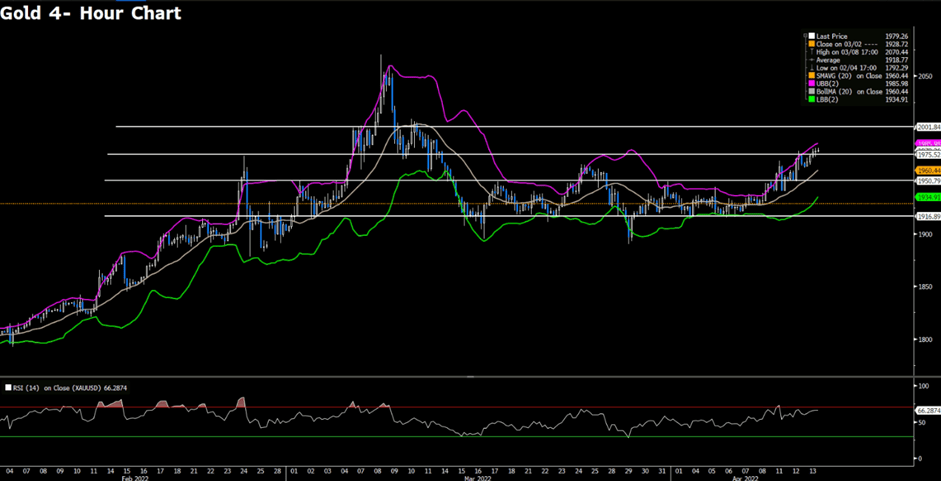
XAUUSD (4-Hour Chart)
Gold continues to climb, trading near a fresh multi-week high of $1981.57, alongside the US dollar’s weakness on Wednesday. From the technical aspect, gold maintains its bullish bias, continuing to favor the upside. On the four-hour chart, gold has breached the immediate hurdle at $1975, showing some upside strength. At the same time, gold sustainably trades above the 20 Simple Moving Average and trades within the upper bounce of the Bollinger band, suggesting absent selling interest at the time being. Gold’s positive move is expected to go on as the RSI has not fully reached the overbought territory, giving room for gold to extend further north toward $2001.
Resistance: 2001
Support: 1975, 1950, 1916
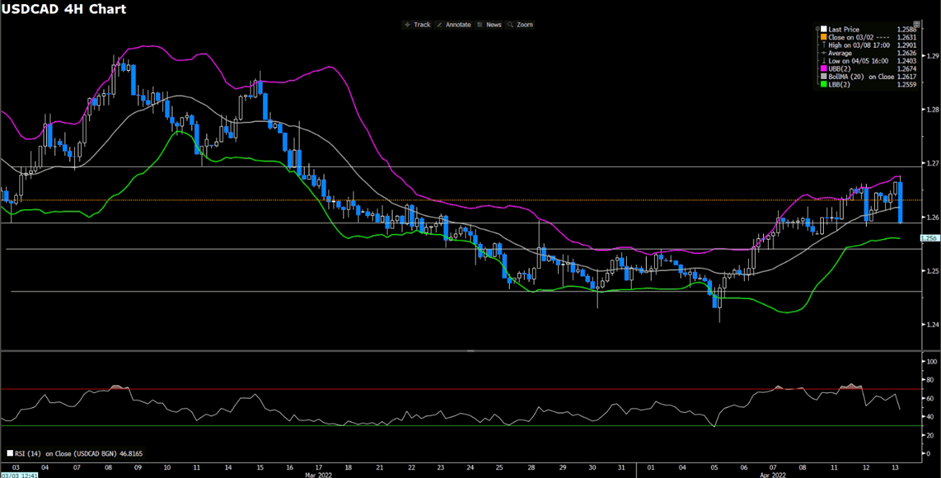
USDCAD (4-Hour Chart)
The Canadian dollar gains traction against the US dollar following the announcement from the Bank of Canada Governor Tiff Macklem that the BOC raises the interest rate to 1% in response to the inflationary pressure. USDCAD slides toward its support at 1.259 after the BOC raises 50 bps on its interest rate. From the four-hour chart, the near-term outlook of USDCAD turns downside, piercing below the midline of Bollinger Band. Failure to defend the 1.2590- 1.2600 level will attract some fresh sellings toward the next support at 1.2543. As the RSI is well above the oversold territory, USDCAD has plenty of room to move further south.