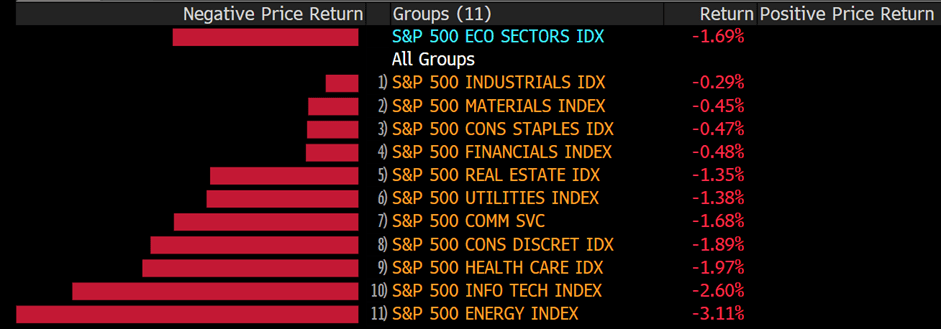
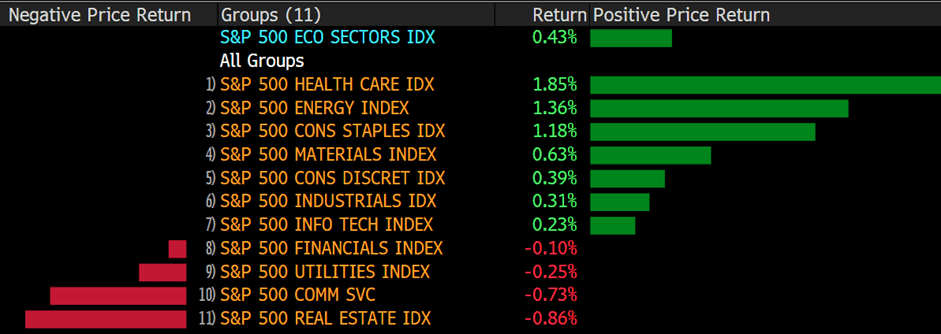
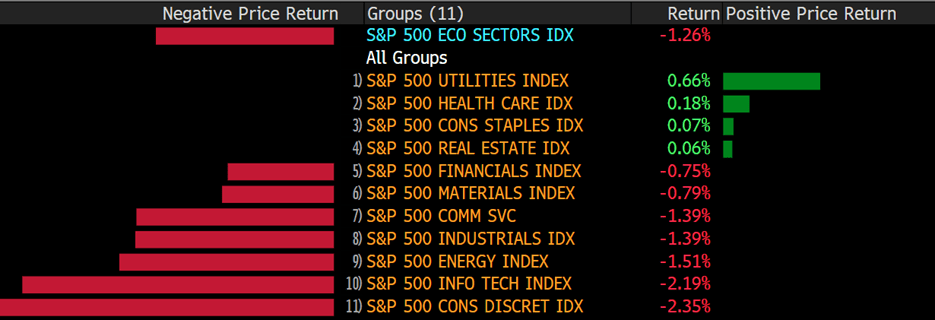
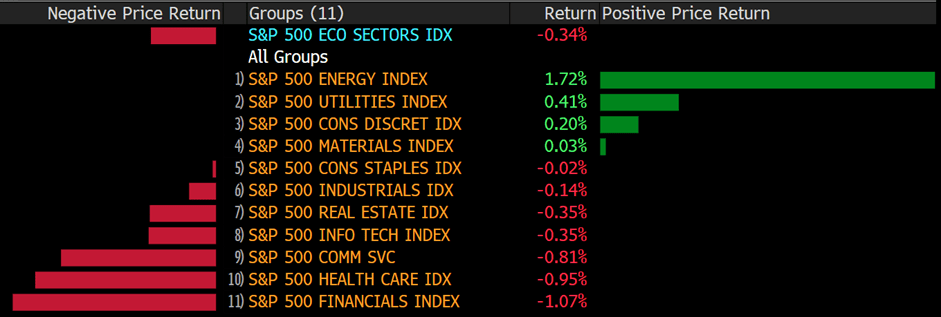
U.S. stocks reversed earlier gains in the final hour of trading Tuesday amid fresh worries about the latest US CPI print that showed inflation in March further accelerated to a new 40-year high. S&P 500 edged 0.3% lower to 4397.35, and Dow Jones gave up an intraday climb to cap trading roughly 90 points, or 0.26%, lower to 34219.89. Nasdaq Composite faltered after an earlier advance, declining 0.3% to 13371.57.
On a once-obscure corner of Wall Street, a pattern of predictive and possibly extremely lucrative trading has developed – and US authorities are suspicious. The scene is the world of special-purpose acquisition companies, or SPACs, the shell organizations that have inundated markets in recent years in order to obtain capital from investors and then look for businesses to acquire. The instrument is a stock warrant, which entitles holders to purchase shares at a fixed future price. SPACs are notorious for issuing a large number of warrants.
The unusual trading pattern begins when someone purchases large quantities of a SPAC’s warrants, boosting the daily trading volume by 10, 20, or even 60 times normal levels. Within a few weeks, word spreads that the SPAC has identified a business to acquire, frequently driving warrant prices skyward. According to a Bloomberg examination of over 300 mergers disclosed since late 2018, such warrant trading spikes occur in around one out of every four SPAC transactions.
According to persons familiar with the case, the US Securities and Exchange Commission is now investigating warrant trades that occurred prior to deals to determine whether they were made unlawfully based on inside information. The SEC may conduct additional investigations as it sifts through additional complaints of well-timed bets reported by market surveillance systems such as the Financial Industry Regulatory Authority.
Main Pairs Movement
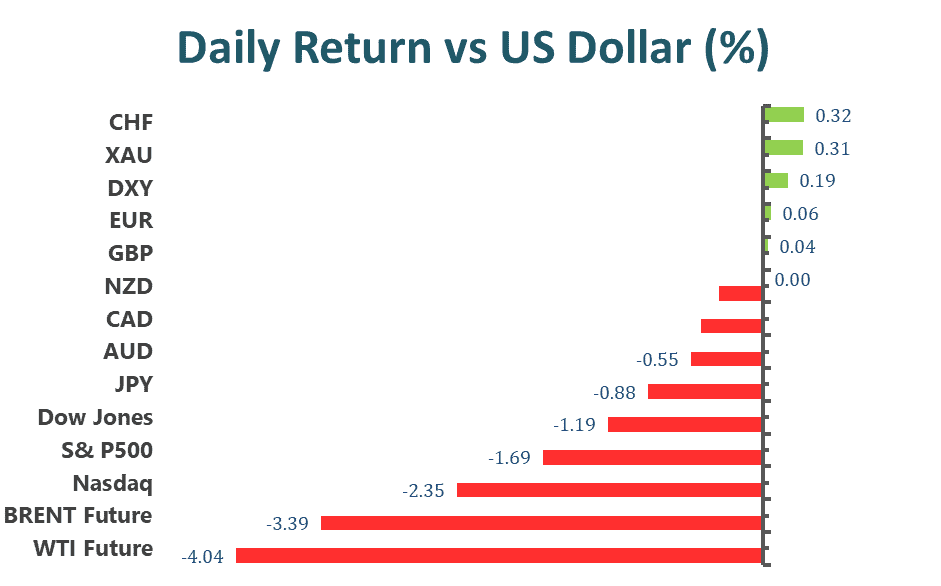
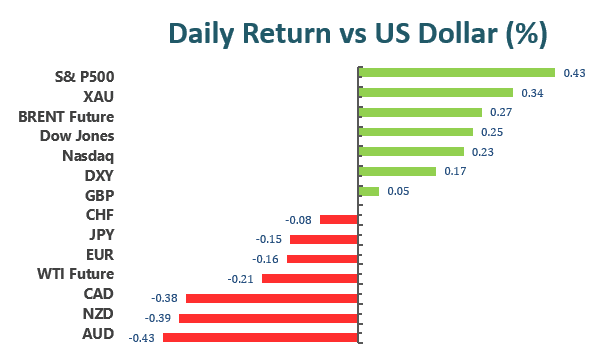
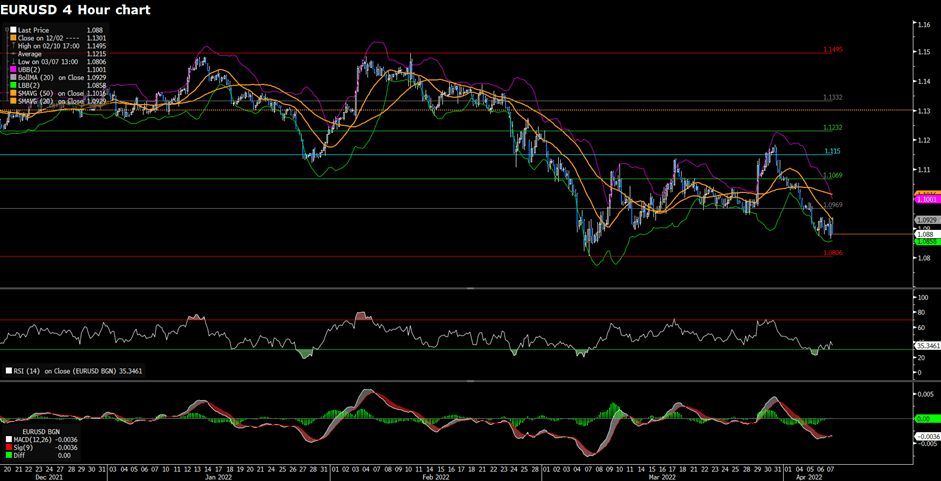
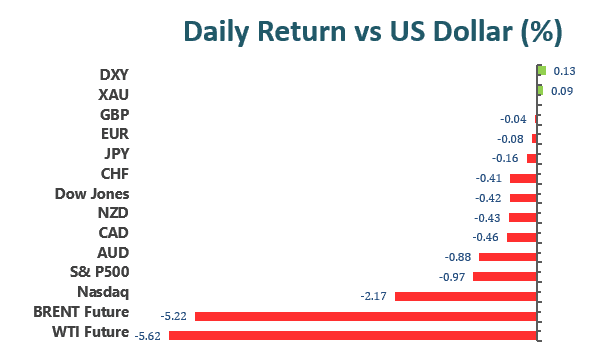
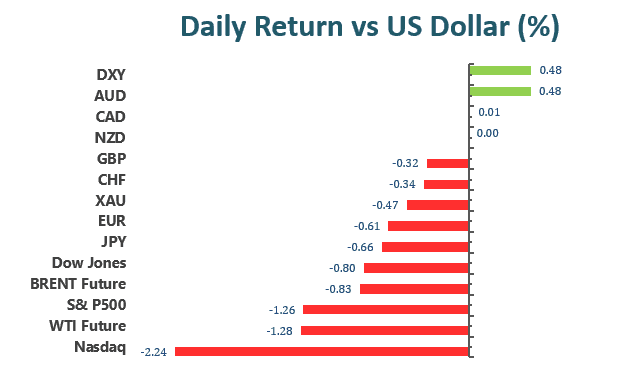
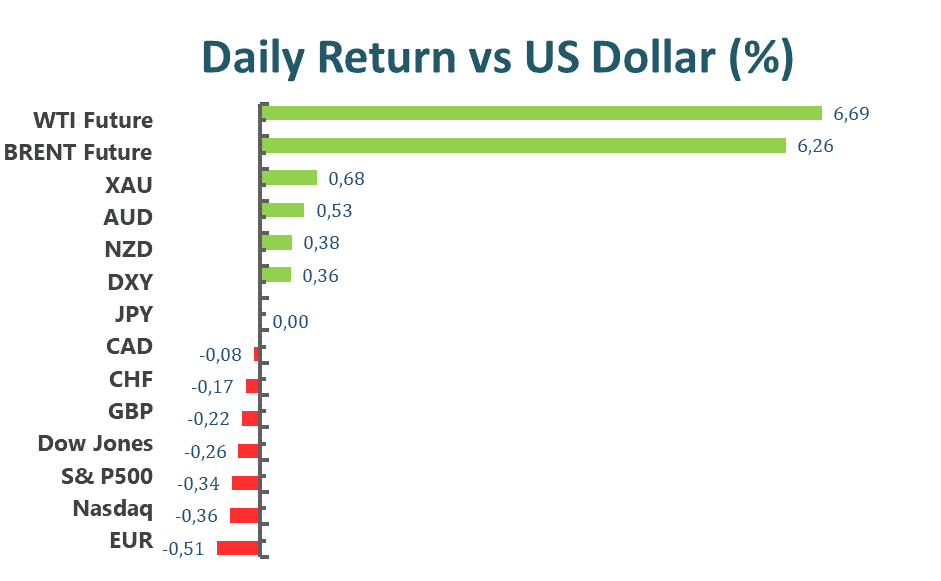
The US dollar lost strength ahead of the announcement of US inflation data but recovered considerably later in the day to close unevenly. It is stronger versus the common currency, with EUR/USD trading near 1.0830, not far from the year low of 1.0805, and GBP/USD battling to stay above 1.3000, despite positive UK job data.
Commodity-linked currencies traded side by side with their American counterparts for the majority of the day, erasing some gains before the close as Wall Street struggled to hold onto early gains. The Australian dollar is trading near 0.7450, while the USD/CAD currency pair is trading at 1.2640.
On Tuesday, gold reached a new multi-week high of $1,978.59 per troy ounce but has since fallen to approximately $1,965. Crude oil prices also increased dramatically, with WTI trading above $100.00 and Brent trading at $105.50 a barrel following OPEC’s reduction of both this year’s oil demand growth and supply estimate. Oil saw a brief reversal following Iran’s supreme leader’s statement that nuclear discussions are “doing well.” US government bond yields spiked ahead of the release of US data, before reversing course. The 10-year US Treasury note yield peaked at 2.836 percent and is currently trading at 2.72 percent.
Technical Analysis
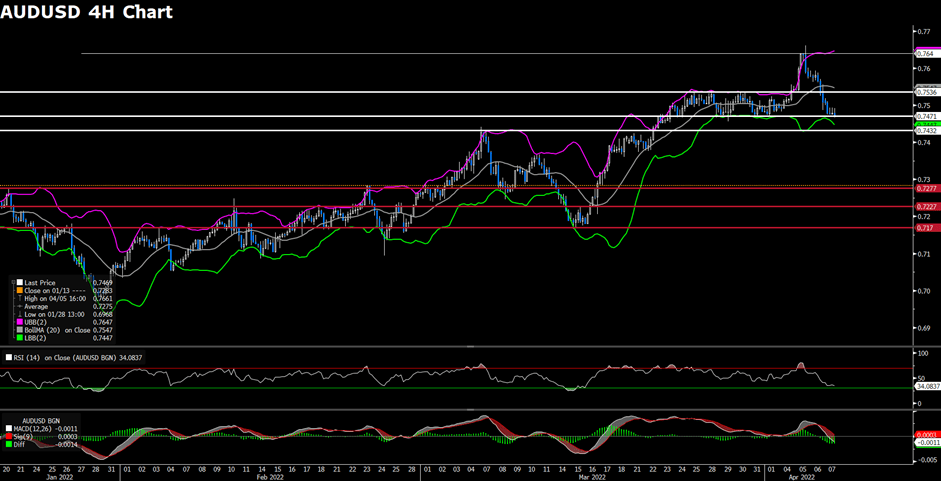
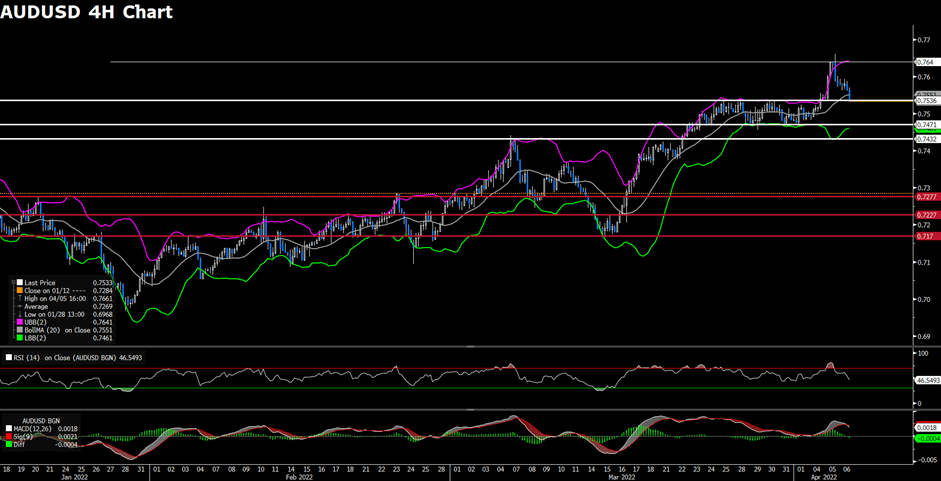
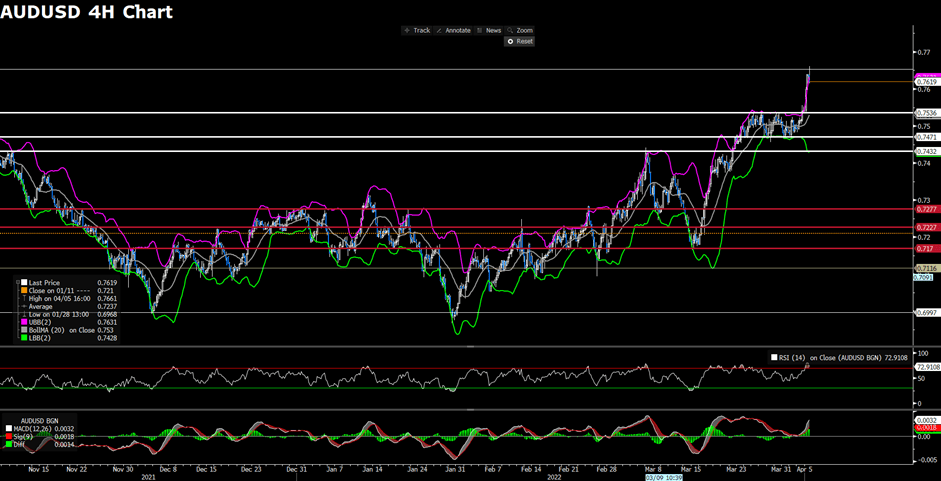
AUDUSD (4- Hour Chart)
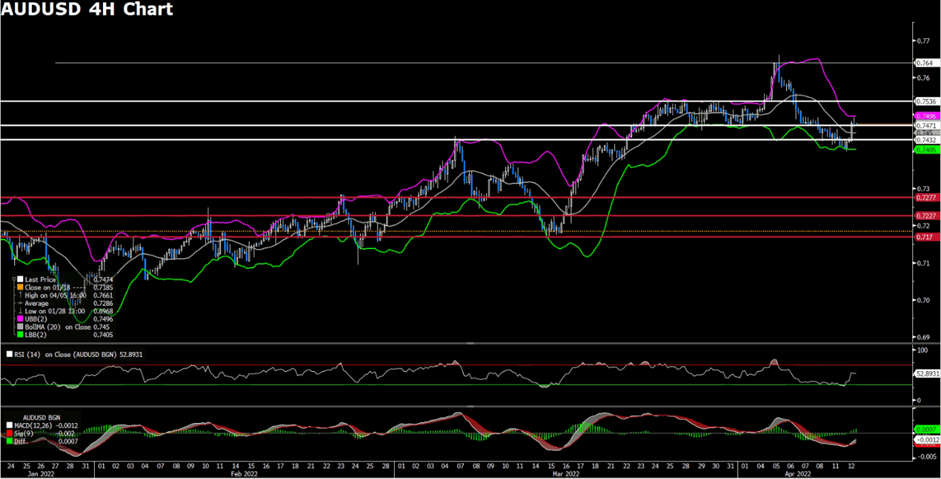
The Aussie snaps four days of consecutive losses against the US dollar, up 0.85% during the US session, following the mixed US inflation data. From the technical perspective, the overnight move-up brings AUD from a bearish to a neutral stance. The break-out of the resistance at 0.7432 and 0.7471 triggers some fresh buyings for AUDUSD. The acceptance above the next resistance at 0.7536 would boost AUDUSD to the upside. As the RSI reading is still far from overbought, AUDUSD has room to extend further north; at the same time, the MACD has turned positive, lending supports to bulls. On the flip side, if the currency pair cannot close its four-hour chart above 0.7471, then it might trigger some selling pressure.
Resistance: 0.7471, 0.7536, 0.7640, 0.7700
Support: 0.7432, 0.7300, 0.7277
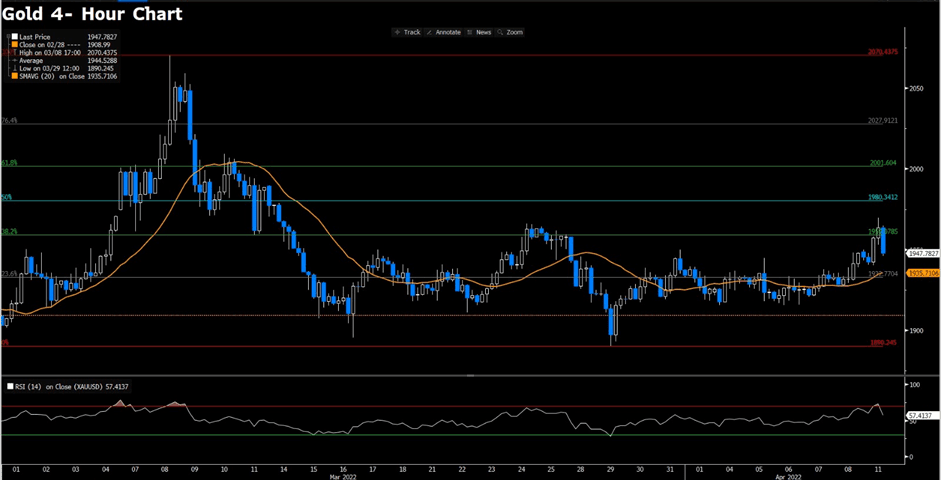
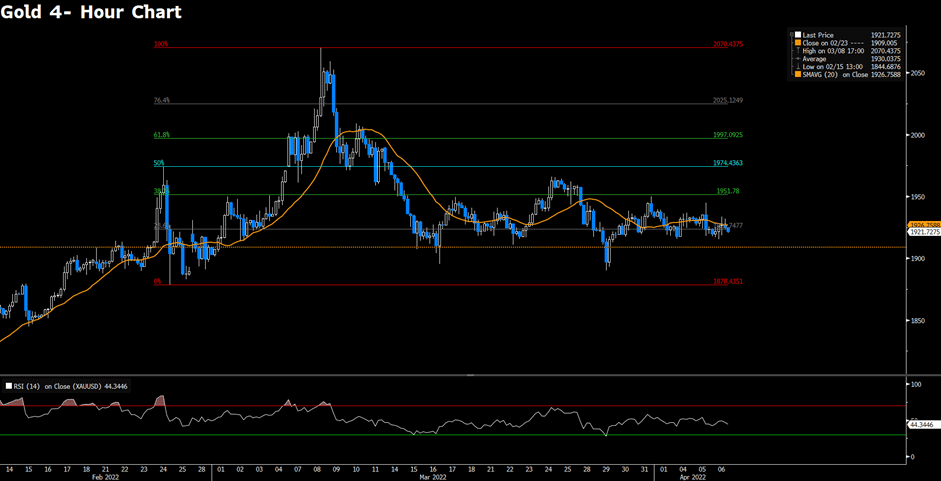
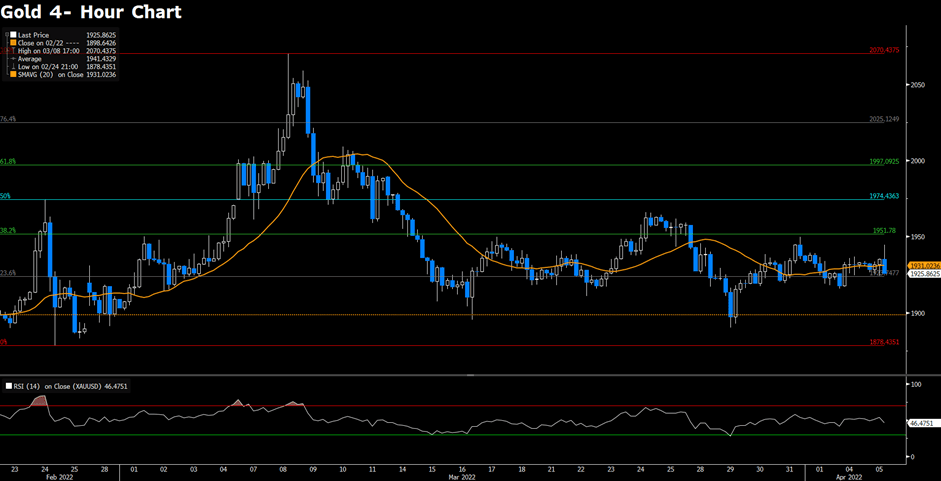
XAUUSD (4- Hour Chart)
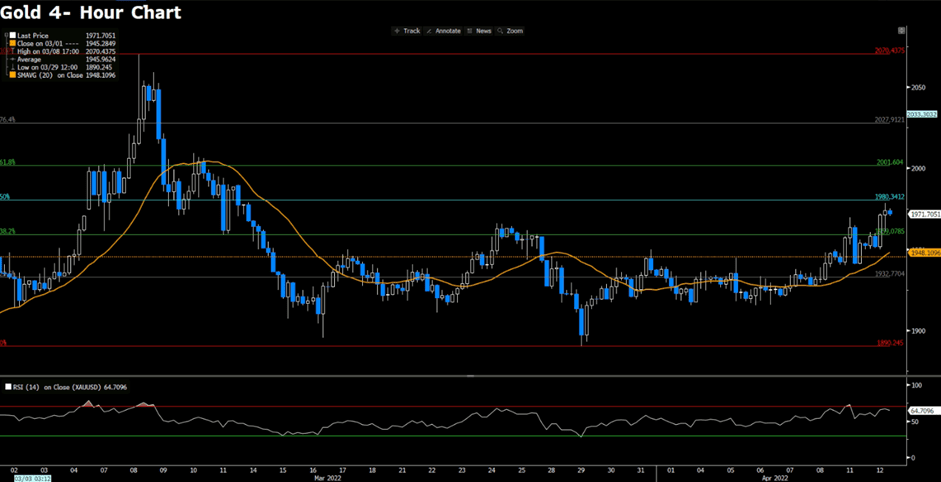
Gold spikes to a fresh multi-week high, above $1970. The bullion is boosted by the US CPI, which accelerates to 8.5%, triggering the risk sentiment that views gold as a hedge against the inflationary pressure. From the technical perspective, the four-hour outlook of gold turns upside following the breakthrough of the resistance at $1959. At the same time, the bulls are favorable as the resistance at $1959 is seen as a defensive level for bears, and gold trades well above the 20 Simple Moving Average. The RSI indicator has not yet reached the overbought territory, providing an opportunity for gold to extend further north, challenging the next hurdle at $1980, followed by $2001.
Resistance: 1980, 2001
Support: 1959, 1934, 1890
USDCAD (4- Hour Chart)
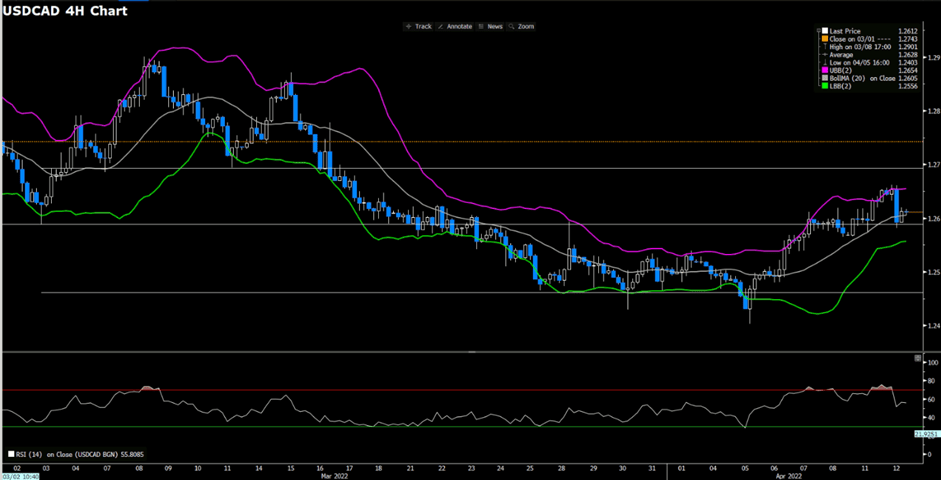
USDCAD drops sharply from three-week highs amid the US inflation data and the upsurge of crude oil prices. From the technical perspective, USDCAD remains positive bias on the four-hour chart as it continues to trade within the upper bounce of Bollinger Band. The support pivot at 1.26 becomes a defensive level for the currency pair; failure to hold above 1.26, will lead USDCAD to the negative territory. At the time of writing, the price action of the pair is directionless as the RSI sits at the midline, lacking fresh buyings or sellings. Further price action eyes on monetary decision-making from the Bank of Canada on Wednesday.
Resistance: 1.2700
Support: 1.2600, 1.2460
Economic Data
| Currency | Data | Time (GMT + 8) | Forecast |
| NZD | RBNZ Interest Rate Decision | 10:00 | 1.25% |
| NZD | RBNZ Rate Statement | 10:00 | N/A |
| GBP | CPI (YoY) (Mar) | 14:00 | 6.7% |
| USD | PPI (MoM) (Mar) | 20:30 | 1.1% |
| CAD | BoC Monetary Policy Report | 22:00 | N/A |
| CAD | BoC Interest Rate Decision | 22:00 | 1.00% |
| USD | Crude Oil Inventories | 22:30 | 1.367M |
| CAD | BOC Press Conference | 23:00 | N/A |