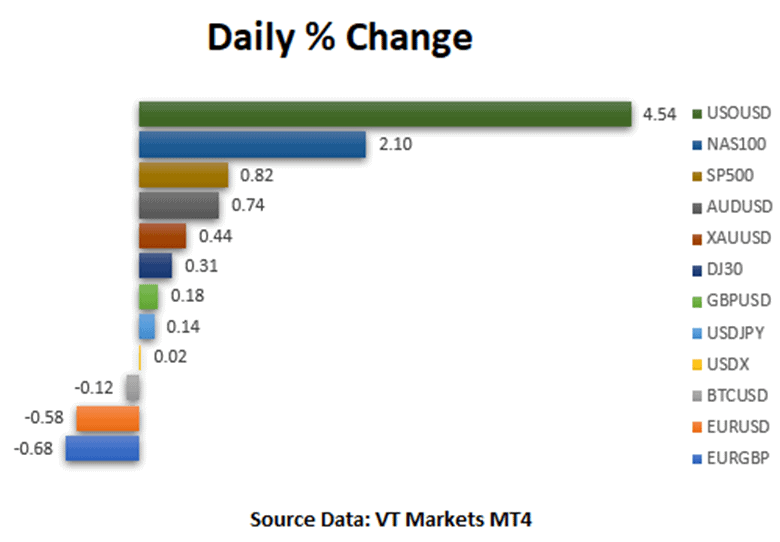
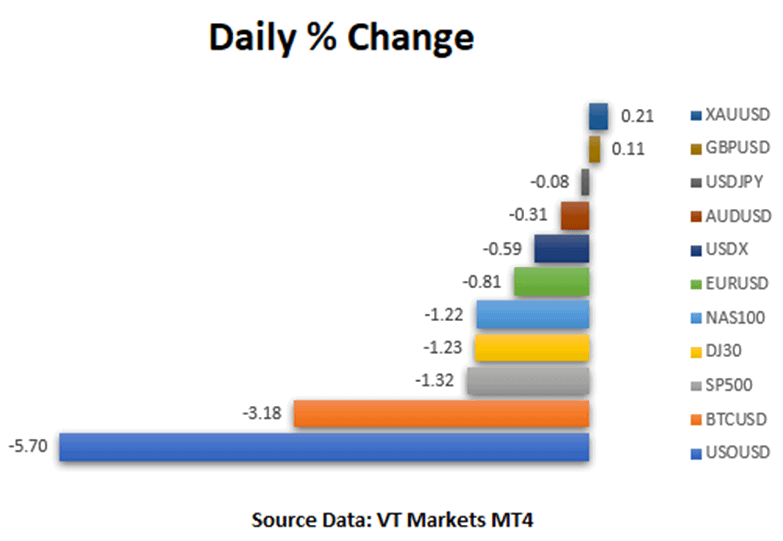
The financial markets began the week with modest changes across asset classes as investors anticipated the latest central bank remarks and events in Ukraine, while also anticipating the start of the corporate earnings season next week. Meanwhile, US equity markets began the week on a positive note, with the NAS100 rising 2.10 percent on the strength of many technology stocks, the SP500 rising 0.82 percent, and the DJ30 rising 0.31 percent, according to MT4 VT Markets data.
Source: Shutterstock | Twitter as one of the market movers on Monday
Negotiators from Russia and Ukraine will restart video talks on Monday, following the European Union’s condemnation of Russia’s military atrocities in multiple Ukrainian cities and President Joe Biden’s statement that Vladimir Putin might face a war crimes trial. This diminishes the likelihood of a breakthrough in the peace process.
Meanwhile, the Treasury yield curve is indicating a slowdown in economic development as the Federal Reserve boosts interest rates to rein in inflation. For the first time since 2007, the US two-year yield has surpassed the 30-year barrier, signaling an inversion on the other side of the curve. The Fed’s minutes this week will provide additional context for a probable 50 basis point rate hike in May and clarify the central bank’s balance sheet reduction strategy.
It’s going to be more and more difficult for businesses in Canada to meet demand and keep up with demand, and that will make people think the Bank of Canada is going to start raising interest rates very quickly. In the central bank’s quarterly survey of business leaders, most companies say they are having trouble meeting unexpected demands.
Main Pairs Movement
In the United States, technology stocks surged, led by Twitter (TWTR), which nearly doubled from Friday’s close. TWTR finished Friday at $39.17 and opened Monday at $47.86, before advancing to $50 in Monday trade, owing to CEO Elon Musk’s 9.2% shareholding.
Starbucks (SBUX) shares opened sharply lower, from Friday’s close of $91.03 to $87.89, having continued their drop to $86.18 before closing at an opening price of $87.75 due to founder Howard Schultz suspending a share-buyback program.
WTI crude oil prices increased beyond $103 per barrel, or 4.54 percent, as traders considered China’s Covid outbreak and attempt to tap strategic supplies.
The USDX (US Dollar Index) increased by 0.38 percent, while the XAUUSD (Gold Index) increased by 0.44 percent. Numerous major currencies traded in a range of directions; EURUSD dipped 0.58 percent, while AUDUSD surged 0.74 percent. EURGBP’s 0.68 percent decline allowed GBPUSD to climb by 0.18 percent.
Technical Analysis
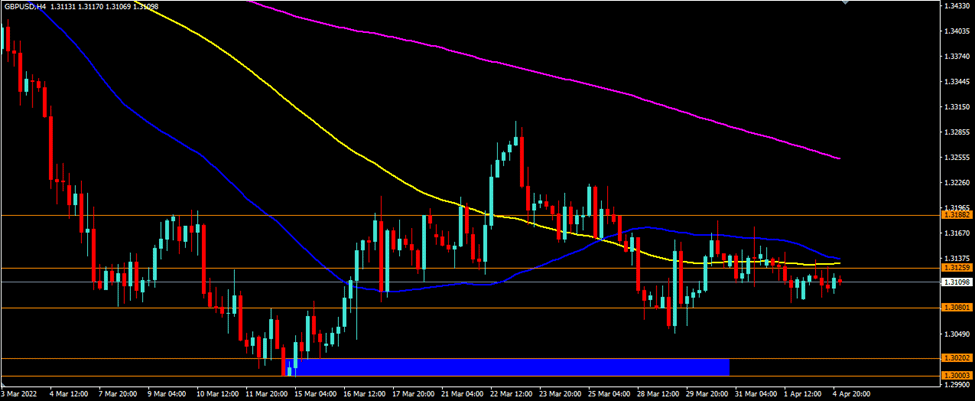
GBPUSD (4-Hour Chart)
GBPUSD is consolidating in the range of 1.3080 to 1.3126. GBPUSD remains trapped between resistance levels of 1.3126 and 1.3188, with support at 1.3080. On the four-hour chart, GBPUSD is trading below its 50-day, 100-day, and 200-day simple moving averages (SMAs).
Resistance: 1.3126 | 1.3188
Support: 1.3080
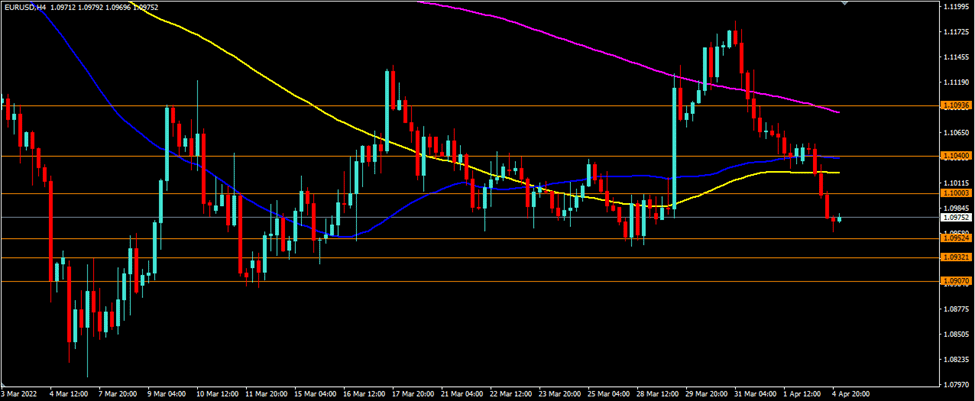
EURUSD (4-Hour Chart)
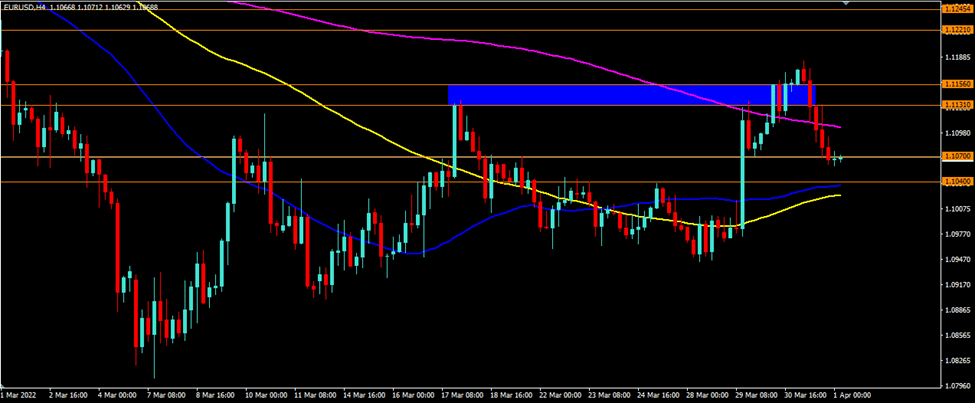
EURUSD is continuing its drop, having breached and fallen below the support level of 1.1000. The 1.1000 level becomes resistance, with the possibility of further EURUSD weakness. The support levels intended are 1.0952 and 1.0932. On the four-hour chart, the EURUSD is trading below its 50-day, 100-day, and 200-day simple moving averages (SMAs).
Resistance: 1.1000. 1.1040
Support: 1.0952, 1.0932
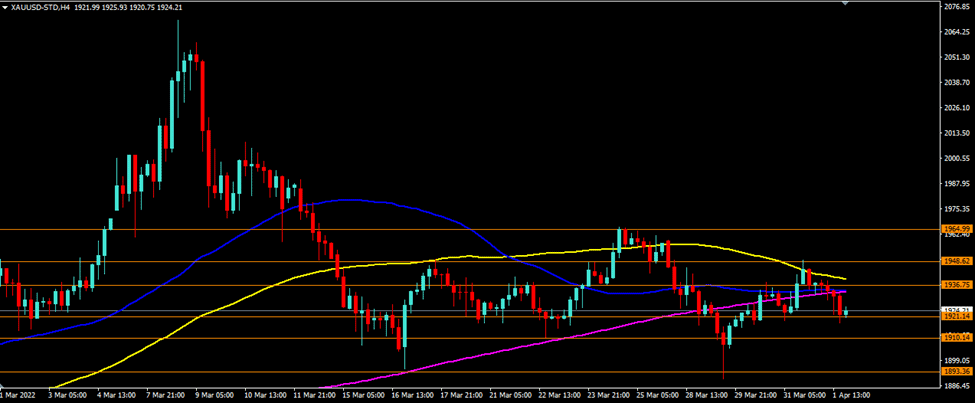
XAUUSD (4-Hour Chart)
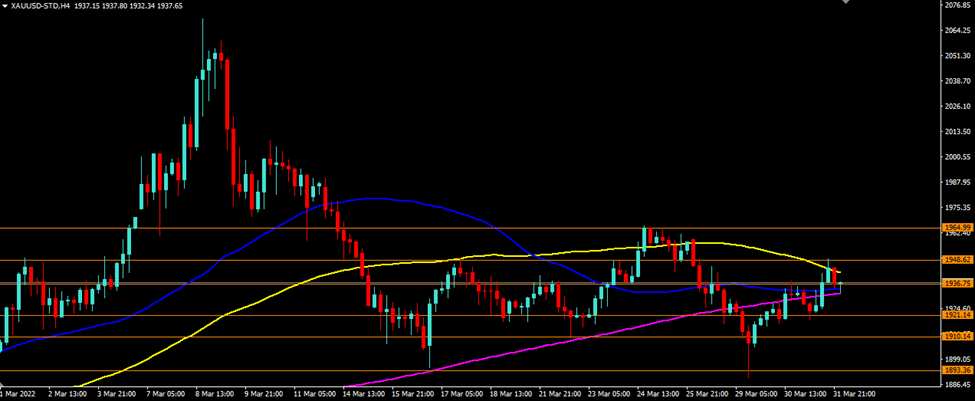
XAUUSD has been unchanged over the last week, trading between $1921 and $1948, with resistance near $1936. XAUUSD is still clinging to $1921 as a support level, with $1910 and $1893 is the next two levels of support. Meanwhile, the resistance levels of $1936 and $1948 remain in play. XAUUSD is currently trading below its 50-day, 100-day, and 200-day simple moving averages on the four-hour chart.
Forex orders are an essential part of the trading process. An order is a request to buy or sell a currency at a given price. The type of order you use can affect how quickly you get your desired currency and how much you pay.
This lesson will teach us about the different types of forex orders.
Market Order
A market order is a direct execution. Once you see the price you want, click buy or sell in your platform’s order window.
If you think the price will go up and you want to buy, click “Buy by Market.”
You must remember though that you might get a slippage if you buy something on the market.
What is slippage?
Slippage refers to the contrast between the expected price of a trade and the price at which it was executed. The term is used in all trading markets but is most common in Forex and futures markets.
This difference can be due to many factors, such as market volatility, liquidity issues, or high-frequency trading. Slippage can also occur when there are too many orders to fill at one time.
For example:
Let’s say the price is 0.71533, and you want to sell at that price. When you click “Sell by Market”, you would expect the same price at 0.71533. But because of slippage, you’ll get 0.71534 instead, which is slightly better. This is because the market moves so quickly that the price already shifted when you clicked.
To close a position using the market order, you can open the same order page by clicking on the open position in the terminal section on the MT4. The exact order page will open up.
Source: VT Markets MT4
The image above says, “Close #18501322 sell 1.00 AUDUSD-ECN by Market” in yellow. Click on that, and remember that when you close a Sell position, you will get the Ask price, which is, in this case, 0.71504 (take note that it may get slippage too).
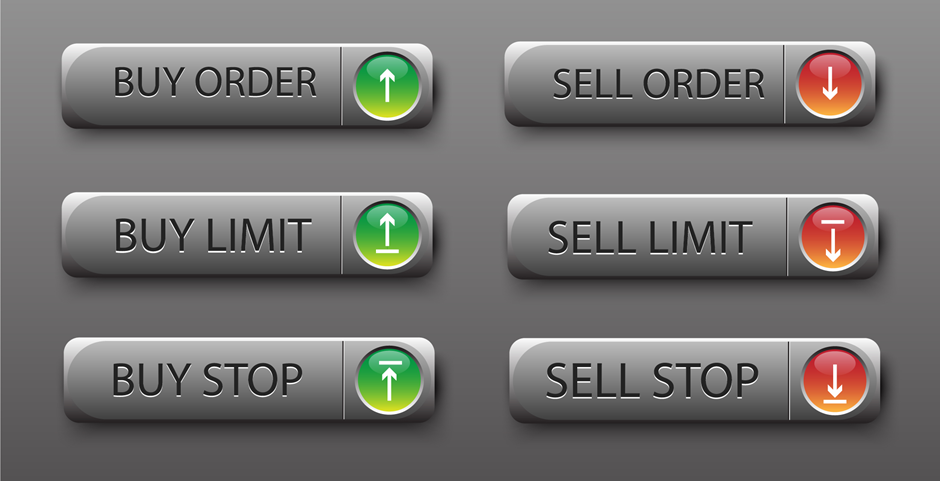
Limit Order
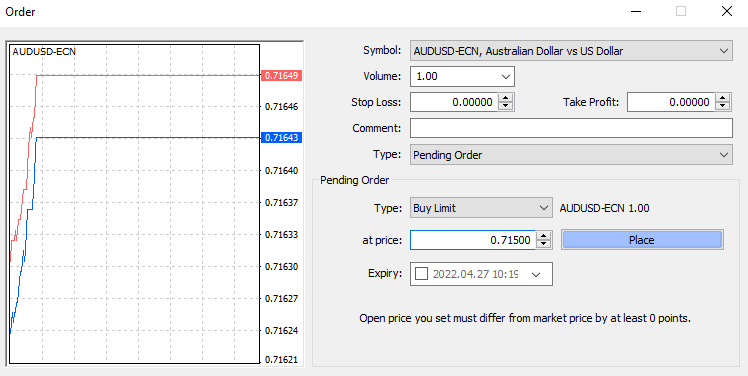
A limit order is a pending order you place when seeking a better entry price. There are two options: Buy Limit and Sell Limit.
Source: VT Markets MT4
Buy Limit Order – Set a Buy Limit if you wish to buy below the current price.
Source: VT Markets MT4
Sell Limit Order -Set a Sell Limit if you want to sell above the current price.
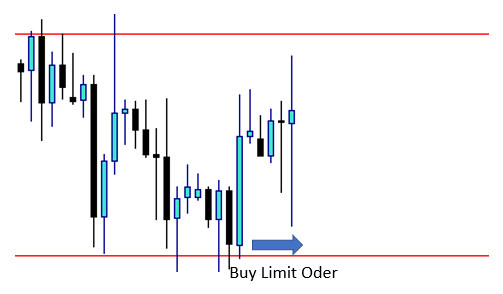
For example, if the market is moving in a range, you may notice that they always rebound at similar price levels.
As shown in the illustration, the price always bounces back up when it reaches a lower level and then falls when it comes to a higher level.
After some research, you might find out that this range movement will continue for some time, and you wish to benefit from it.
The price is now trading in the midway of those levels. So, rather than waiting for the price to reach those levels, you can set a Sell limit at the higher level or a Buy limit at the lower level.
Consider the following example:
Source: VT Markets MT4
As you can see from this chart, there is a range movement with some higher and some lower highs and lows.
It also shows that the price is currently moving in the middle. Supposing you want to open a buy position, but you want to buy near the lower levels. So you decide to put a Buy Limit Order above the lower levels.
Source: VT Markets MT4
After the price moves, as shown in the chart above, you may have correctly analyzed it. Your Buy Limit Order has converted to a Buy Order automatically.
Stop Order
A stop order is a pending order that you place when you feel a particular price will result in market continuation. There are two options:
Place a Buy Stop if you want to buy above the current price.
Place a Sell Stop if you want to sell below the current price.
Source: VT Markets MT4
As a result, when the price reaches specified levels, the position will automatically open for Buy or Sell at a price stated in the orders.
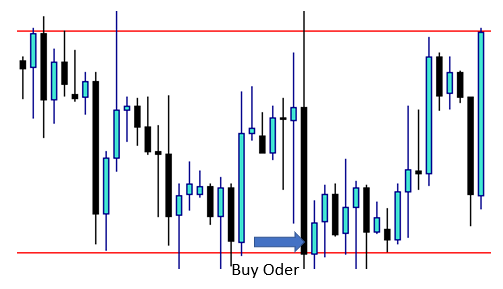
Therefore, if we look at the sample above, we can see a ranging movement and two borders, one higher and one lower. That border will eventually be broken if the price begins to trend.
After some analysis, you concluded that if the price breaks through the upper border, it will continue to rise until it reaches the target level. Thus, you can place a Buy Stop order above the higher border, assuming that you will automatically open a Buy position if the border breaks. If the market continues to rise, you will profit.
You may also have determined that if the price breaks through the lower border, it will continue to rise until it reaches the target level. Therefore, you can place a Sell Stop order for this below the lower border, assuming that if the border breaks, you will automatically open a Sell position. If the market continues to decline, you will profit.
Source: VT Markets MT4
Consider the following example:
Source: VT Markets MT4
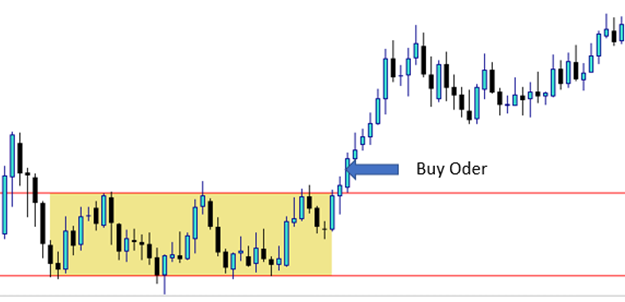
As you can see from this chart, there is a range movement with some higher and some lower highs and lows.
Assuming that the price would rise when it breaks through the higher levels, you place a Buy Stop Order above the higher levels.
Source: VT Markets MT4
After the price moves in the way shown in the chart above, you may have correctly analyzed it. Your Buy Stop Order has converted to a Buy Order automatically.
These higher and lower levels are commonly referred to as Support and Resistance Levels, which will be tackled in the next lesson.
It is critical to observe the movement of prices in Forex trading. There are several ways to accomplish this, including seeing the ticker in real-time. But the most popular method is to display prices on a chart, which enables you to observe how prices respond at crucial moments.
Traders use prominent chart types, including line charts, candlestick charts, and bar charts. Each chart type presents data uniquely and has distinct advantages.
Line Charts
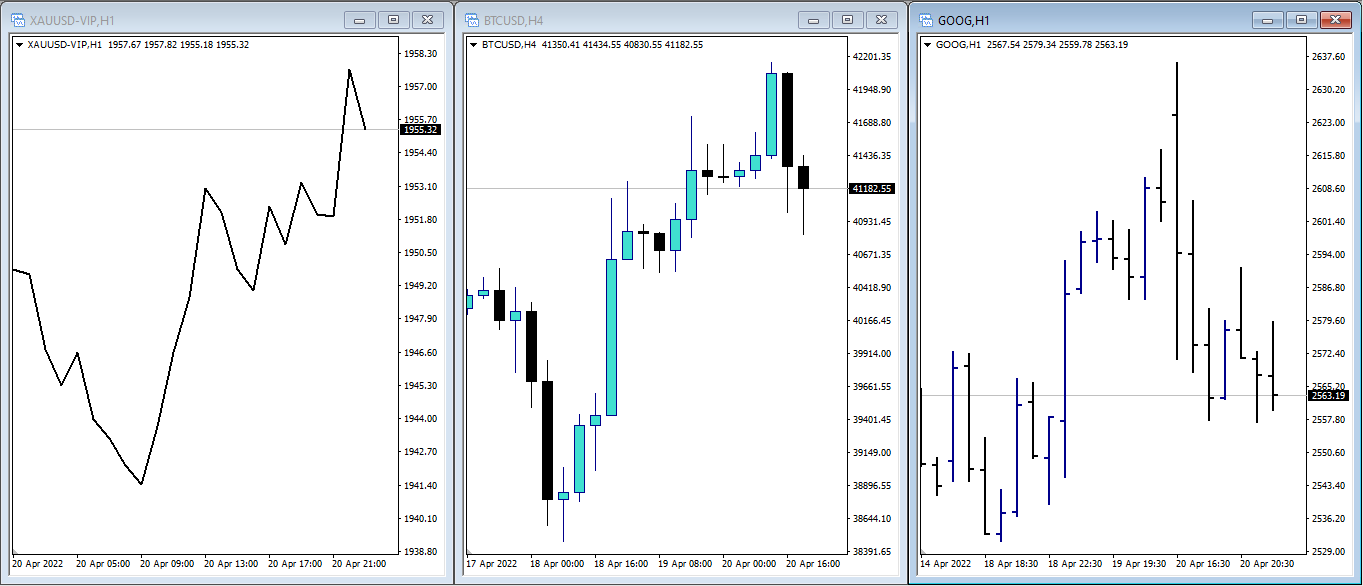
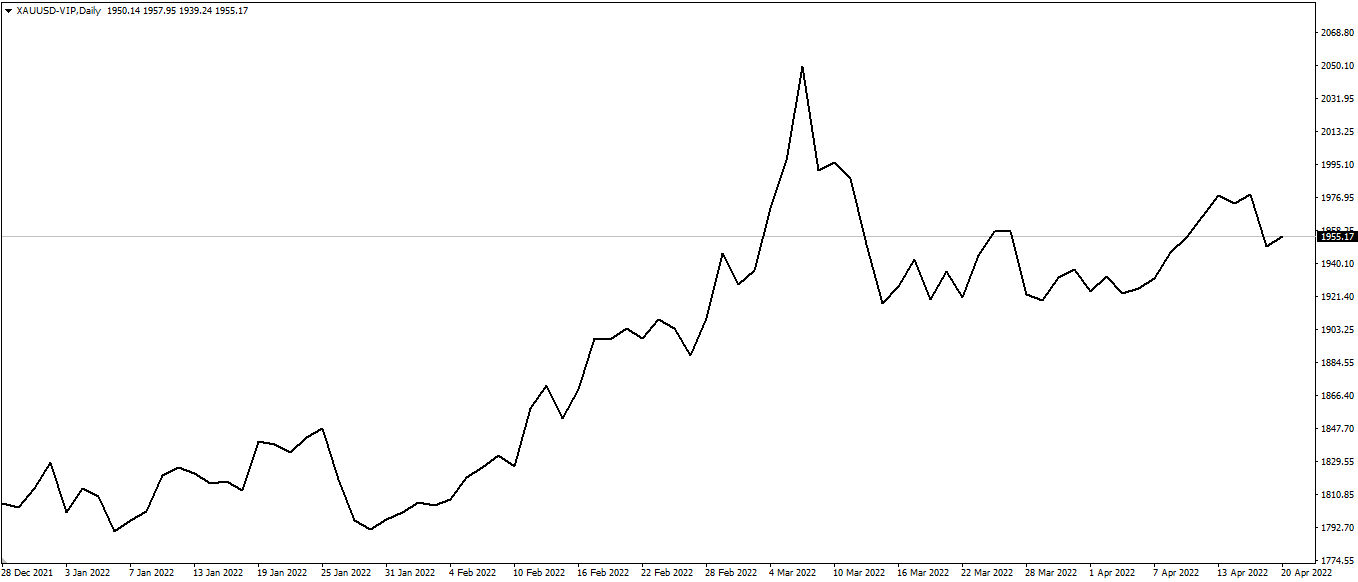
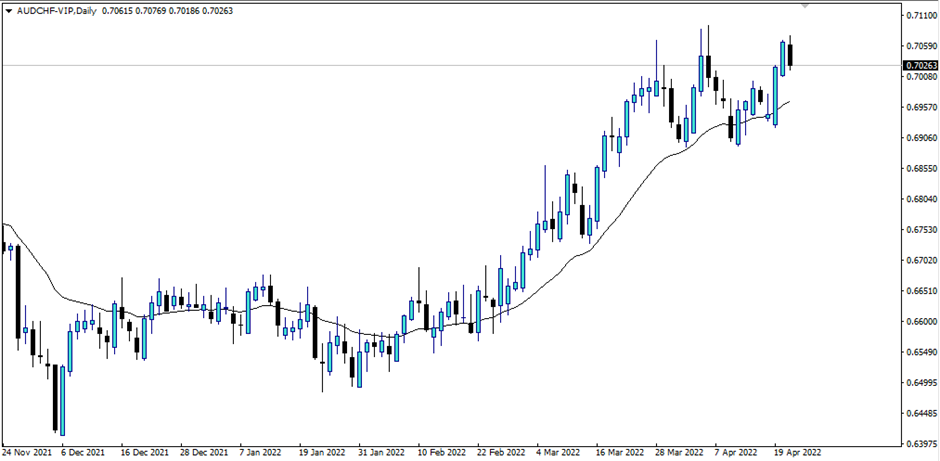
Line charts are the most straightforward to understand, primarily because line charts only display closing prices. Thus, they eliminate “noise” generated by less crucial trading times of the day, such as the open, high, and low. Line charts typically depict a single line that connects all of the period’s closing values – the following is an example of how the XAUUSD daily line chart looks:
Source: VT Markets MT4-VIP
Since closing prices are often seen as the most relevant, it’s easy to see why investors and traders like line charts.
Line charts provide a concise, simplified snapshot of the current market condition and are typically the best choice for individuals seeking a fast glimpse of the market’s direction.
Bar Charts
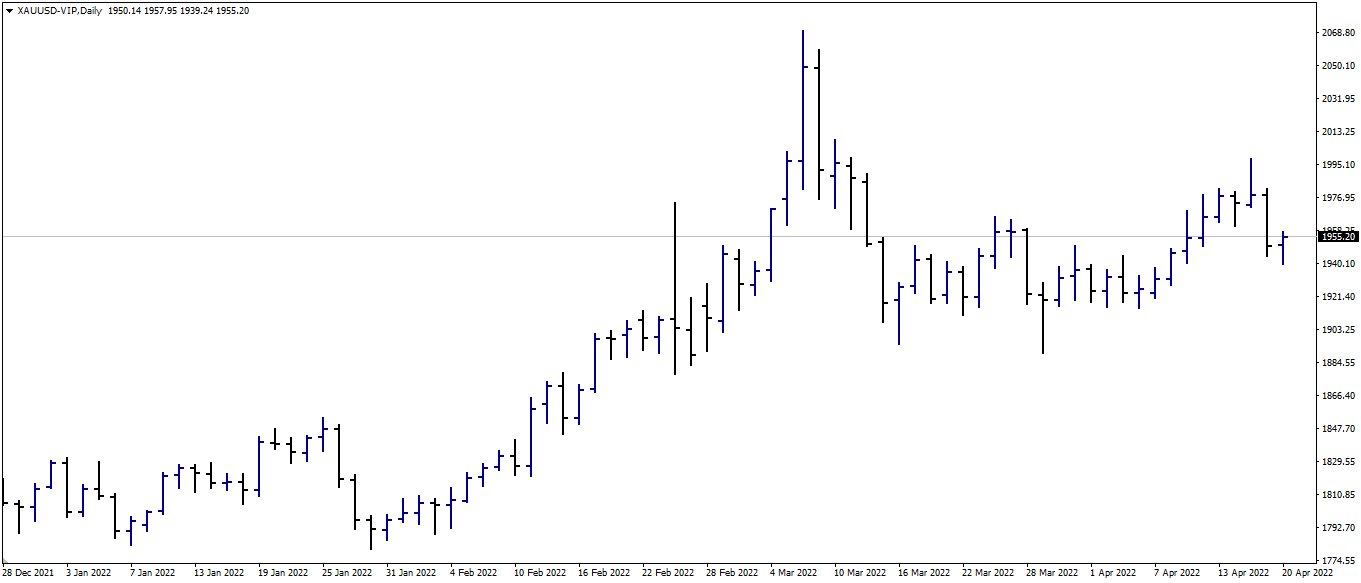
Bar charts, commonly called OHLC charts, depict four critical points: the Open, High, Low, and Close (OHLC) of a given period. Consider it an enhanced version of the line chart, as it reveals additional information that can be used to aid in trade research and uncover additional information about specific price moves.
For instance, if the space between the Open and Close bars is vast, it indicates that the price made a significant move during that bar. Combining a few of these might indicate a period of extreme volatility.
Source: VT Markets MT4-VIP
Not only can you see how prices are displayed in terms of bars in the same XAUUSD chart example above, but you can also see how there are periods of high and low volatility. This is very important in trading because it identifies periods and locations of high interest and indecision.
Candlestick Charts
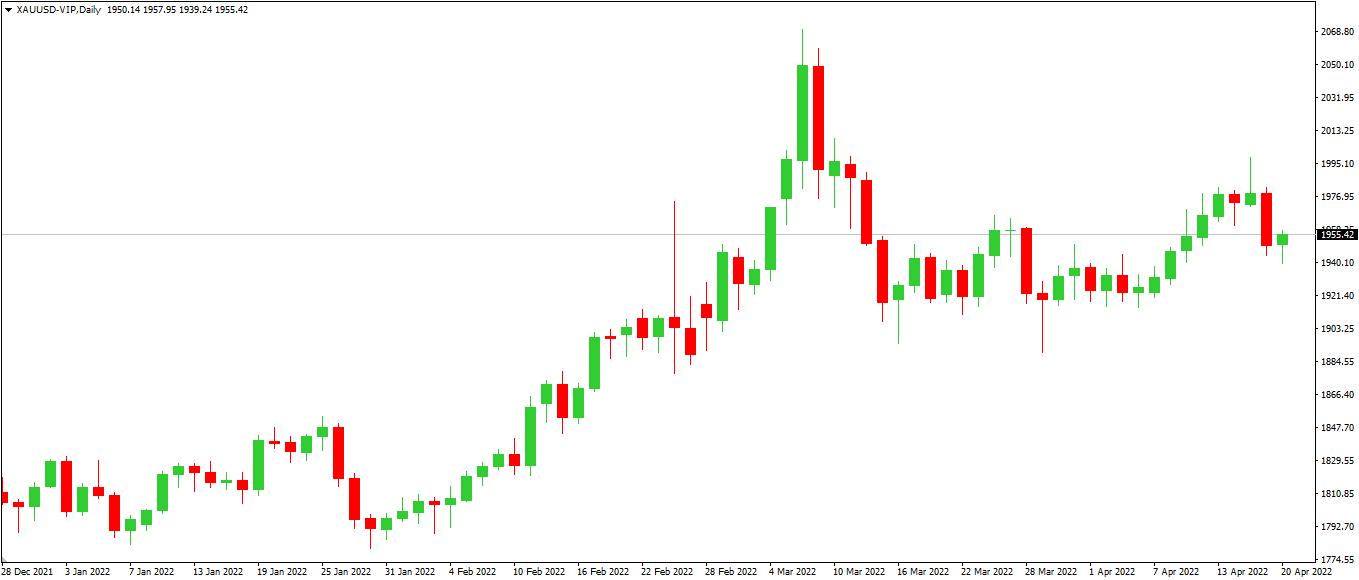
The candlestick chart is the most popular type of chart. Candlestick charts are composed of two distinct components: the body and the shadows (wick). The top and bottom of the body provide information about the opening and closing prices over the specified period. The shadows at the top and bottom indicate the highest and lowest prices reached within the specified period.
Candlestick charts, like bar charts, display the Open, High, Low, and Close in a different format. Indeed, many traders regard the candlestick chart as an enhanced version of the bar chart, as the additional information displayed allows for the creation of candlestick patterns (more on that later), which enables us to read the markets in ways that bar charts and line charts do not.
Typically, the candle body will be red if the closing price is less than the opening price. The body will be green if the closing price exceeds the opening price. In this scenario, red candlesticks indicate a price decline, while green candlesticks indicate a price increase.
Source: VT Markets MT4-VIP
Using the same XAUUSD example, you can observe how prices seem different on a candlestick chart.
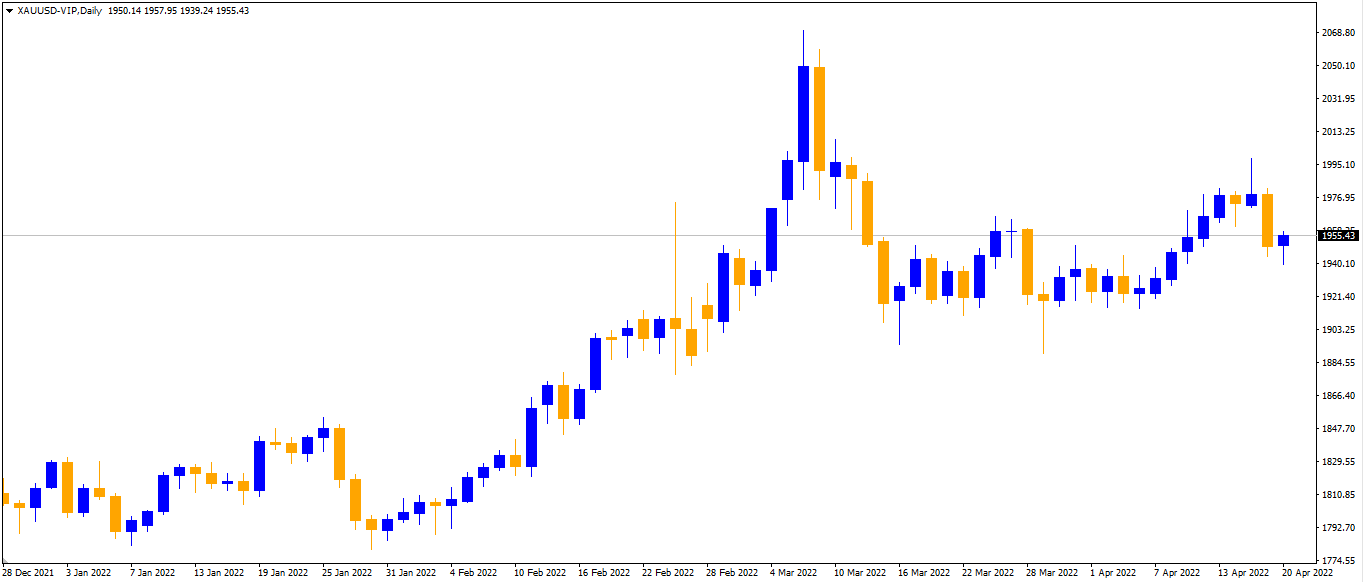
Important note: While red and green are typical colours for displaying falling and rising values, additional combinations such as black/white or blue/orange (like the sample below) may exist.
Source: VT Markets MT4-VIP
The most important thing is to know why they are formed so that the colours representing them can make it easier for us to figure out what they mean.
US equity markets remained stable on Friday following the release of US job data, but the NAS100 dipped as some technology firms declined. According to MT4 VT Markets data, the SP500 closed flat at 0.00 percent, the DJ30 gained 0.01 percent, and the NAS100 fell 0.42 percent.
Source: Shutterstock | Will the FED become more aggressive as a result of the US job data?
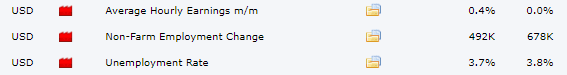
The USD ended the week on a strong note following Friday’s US jobs report. Non-Farm Employment Change increased by 431K, albeit at a slower pace than the previous month’s 750K, while the Unemployment Rate increased by 3.6 percent, above forecasts and the previous month’s figures. The average hourly earnings m/m statistics came in at 0.4 percent, compared to 0.1 percent in the previous month.
This report increases market expectations for the FED to boost interest rates even higher, possibly by as much as 50 basis points.
Main Pairs Movement
AAPL was down 0.59 percent to close at $172.87, while INTEL and NVIDIA were both down, with INTEL down 4.04 percent to $47.80 and NVIDIA down 3.74 percent to $263.27.
With a 1.89 percent loss on Friday, USOUSD (WTI Texas) closed below $100, its lowest in two weeks.
The USDX (USD Index) gained 0.22 percent because of the US jobs data. The US jobs report boosted the USDJPY by 0.76 percent, while the EURUSD declined by 0.16 percent.
XAUUSD (Gold) also decreased by 0.67 percent.
Technical Analysis
GBPUSD (4-Hour Chart)
The GBPUSD dipped slightly on Friday as a result of US employment data. GBPUSD is trading below its recent average level of 1.3126, with a chance of falling to the 1.3080 support level, with resistance levels at 1.3126 and 1.3188. GBPUSD is trading below its 50-day, 100-day, and 200-day simple moving averages on the four-hour chart (SMAs).
Resistance: 1.3126 | 1.3188
Support: 1.3080
EURUSD (4-Hour Chart)
The EURUSD is still falling, approaching the 1.1040–1.1070 support zone. The EURUSD appears to be capped at 1.1040, but if that level is breached, the next support level is at 1.1000. The resistance level is at 1.1070, with a continuation at 1.1093. The EURUSD is trading above its 50-day and 100-day simple moving averages (SMAs) on the four-hour chart but below its 200-day SMAs (SMAs).
Resistance: 1.1070. 1.1093
Support: 1.1040, 1.1000
XAUUSD (4-Hour Chart)
On Friday, the XAUUSD fell due to a good market reaction to US job statistics. Currently, XAUUSD is locked around $1921 as a support level, with $1910 and $1893 as the next support levels. The $1936 and $1948 resistance levels are still in play. On the four-hour chart, XAUUSD is currently trading below its 50-day, 100-day, and 200-day SMAs.
When it comes to trading, you’ll likely often hear about MT4. What is it exactly?
MetaTrader4 (MT4) is a popular online trading platform that traders can use to automate their trading. Its simple user interface gives access to advanced technical analysis and flexible trading systems.
Here’s a guide on what MetaTrader 4 is and how to use it.
MT4 is an acronym for MetaTrader 4, one of the world’s most widely used trading platforms for Forex trading. Indeed, you may trade a wide variety of items on it, including:
Indices (such as S&P 500, Nasdaq, etc.)
CFDs on shares (such as Apple, Netflix, Tesla, and Amazon)
Commodities (such as Soybean, Coffee)
Precious Metals (such as Gold, Silver, Platinum, and Copper)
Bitcoin and other cryptocurrencies (such as BTCUSD and ETHUSD)
MT4 includes all of the standard trading platform functionalities you’d expect, including products/symbols, various chart types and customization options, useful entry options, and comprehensive and accurate historical trade tracking. It also features a handy back tester for evaluating how different trading strategies would have performed against historical data.
Most importantly, it’s effortless and straightforward to use.
Once you’ve mastered the basics of MT4, you’ll want to explore further the platform’s technical indicators and trading robots (known in the industry as Expert Advisors).
Numerous traders prefer to use the company’s popular coding language (MetaQuotes Language) to develop their specialized tools and algorithms for trading.
This has resulted in the development of a booming marketplace where you can purchase automated trading programs suited to specific techniques that will assist you in trading!
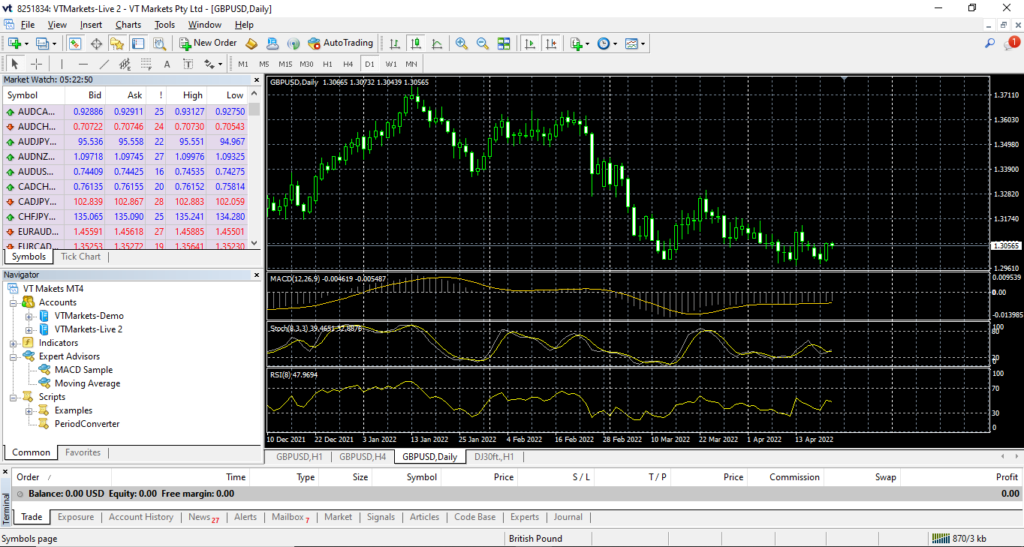
After you install MT4 on your computer desktop/laptop, you will be prompted to an initial display. See below:
VT Markets MT
Menus and Toolbars
The first is the menu and toolbar section. In this section, you can see all the tools and features available at MT4.
Menu – File
On this menu, you can find commonly used tabs, such as:
New Chart – to open a new chart by choosing the desired instrument.
Profiles – to open the profile.
Save as Picture – to submit the chart in the form of “BMP” or “GIF”.
Open an account – to open a new account demo, log in to enter the account that you already have.
Menu – View
This menu contains the toolbars we need, such as a market watch, terminal, and change language. All the toolbars we choose will appear on the MT4 main layer, and several toolbars will appear below the menu.
Menu – Insert
This menu is to enter indicator-indicator and object-object needed on the chart section. We can use the indicators available. Even the book of ISA uses the indicator we have.
Menu – Charts
This menu is used to change the display on the chart, tailored to what we want, such as choosing a chart type, selecting a timeframe, zooming in, chart shift, and others.
Menu – Tools
This menu is used to access history libraries, do new orders, and open the Metaquotes Language Editor. We can also change the password, set the server, and others in the options section.
Menu – Window
Use this menu to set the main screen display, especially if you have several charts that are open simultaneously.
Menu – Help
This menu is the Help menu in general which contains all the things you need to know about MT4.
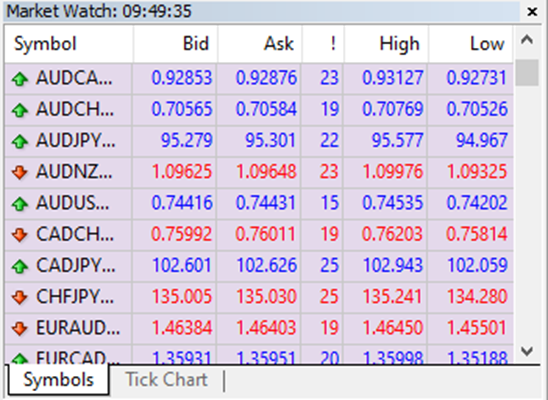
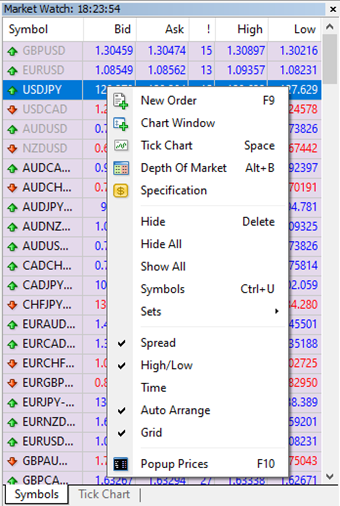
Market Watch
Market Watch is a part that displays prices from instruments available on the broker. You can access this display through the View menu or “Ctrl + M”.
Market Watch is a part of MT4 that contains information for you to trade, such as placing your first trade through MT4 and choosing from Forex, commodities, indices, CFD equities, and even crypto.
It also contains other features, such as opening a new position, the window chart, and looking for symbols.
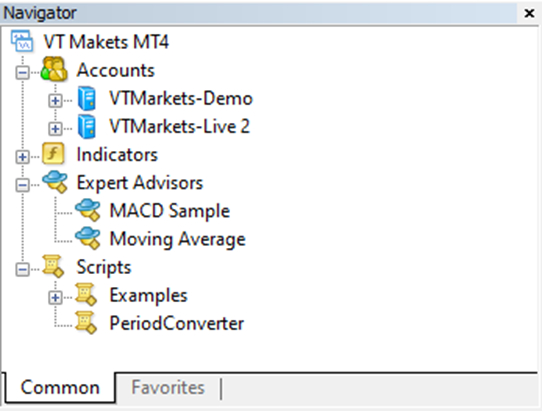
Navigator
This part gives you quick access to various features of the terminal. This window can be opened/closed by pressing Ctrl + N by the “View – Navigator” menu OR by pressing the “Navigator” Window Button of the “Standard” Toolbar.
The list of features is accessible through a dropdown arrow and contains five groups: Accounts, Indicators, Expert Advisors, Custom Indicators, and Scripts.
Accounts
The “Accounts” group includes the list of Open Accounts. One can open a new demo account or delete the old one.
Indicators
Indicators are primary tools for analyzing price movements, which include built-in indicators, community indicators purchased from the market, custom indicators, and more.
Expert Advisor
This menu contains a list of all available expert advisors. Expert advisors in the terminal are programs that allow automating analytical and trading activities.
Terminal
The terminal menu is a multifunctional window allowing access to various terminal features. This window allows control over trading activities, views news and account history, sets up alerts, and works with the internal mail and system journal.
The window can be opened by the “View – Terminals” menu by pressing Ctrl + T or the “Terminal” window button of the Standard Toolbar.
Several tabs are found here:
Trade: Traders can view the status of open positions and pending orders as well as manage all trading activities here. The total financial result for all open positions is also published in this tab.
Exposure: This tab contains the summary information about the state of assets by all open positions.
Account History: This tab shows the history of all performed trade operations and balance without considering open positions. One can estimate the efficiency of all trade activities with the results given in the tab.
Alerts: Various alerts can be viewed and set here. Any files executable in the operational environment (including wave files) and messages sent by email can be used as alerts.
Signals: This tab displays trading signals of the “Signals” service, which are available for subscription.
CodeBase: Here, you can download any application published in the “CodeBase” section of the MQL5 community website.
Expert Advisors: Information about the functioning of the attached expert, including opening/closing of positions, order modifying, the expert’s messages, etc., are published in this tab.
Journal: Information about terminal launching and events during its operation, including all trade operations performed, is stored in the journal.
Chart Window
In this section, you can see the price movement in the form of a chart. You can add indicators, Expert Advisor, or object that you feel can help your trading journey.
Now that you know more about the MT4, you can start navigating your way and use these features when trading.
In this lesson, we will talk about leverage and how it affects your trading.
What is Leverage?
In simple words, leverage is a facility allowing traders to trade with less capital.
As we explained to you previously, 1 standard lot equals 100.000 units. If you buy 1 lot of USDCAD, you are purchasing 100.000 USD and exchanging this for CAD. Another example is that if you buy 1 lot EURUSD, you are buying 100.000 EUR and exchanging this for USD.
However, not everybody has 100.000USD to trade 1 lot. When leverage comes in, a facility from a brokerage provides a “loan” to retail traders so they can join in buying 1 lot with a smaller amount of capital.
Most brokerage firms provide various types of leverage. Some offer leverage of up to 1:500, which is 500 times your money to enter a position in Forex. If you have $1,000 in your account, you can trade up to 500,000 USD or 5 lots, depending on the currency pair.
Here’s an example:
You see a USDCAD pair going higher. You decided to buy 1 lot at the price of 1.2500 (1 USD = 1.2500CAD).
If you do a non-leveraged transaction, you will be buying 100.000 USD, which means now you own 100.000USD in your hand after you exchange from the amount of 125.000CAD.
After some movement from the USDCAD, you decide to close the position (selling back the 100.000USD to CAD), only this time, the USDCAD price has already gone up to 1.2600.
Your 100.000USD has a value of 126.000CAD, meaning you get a 1,000CAD difference.
Now let’s do the Leveraged transaction of 1:100.
You bought 1 lot of USDCAD at the price of 1.2500 and decided to sell at the price of 1.2600.
Because your account is leveraged this time, you get a “loan” from the brokerage to buy a 1 lot equal to 100.000USD. Therefore, you will only need an amount of 100.000USD divided by 100.
This means you’ll only need 1,000USD to buy 1 lot.
So you own 1 LOT USDCAD, which equals 100.000USD in your account. Instead of using 100.000USD or 125.000CAD, you only need 1,000USD or 1,250CAD. When you decide to close the position, you will get the 1,000CAD as profits.
In comparison:
In a non-leveraged transaction, you get a profit of 1,000CAD using a 100,000USD or 125,000CAD, which is equal to 0.8% profits.
In a leveraged transaction, you get a profit of 1,000CAD using a 1,000USD or 1,250CAD, which equals 80% profits!
Now, let’s look at another example:
You want to buy 2 lots of EURUSD at the price of 1.1500 and close the position at the price of 1.1550, which is equal to 50 pips (explained in our previous lesson).
So, you buy 2 lots of EURUSD to “own” 200,000EUR at 1.1500 or equals 230,000USD.
How much will you need when using the leveraged account of 1:100?
You will need 200,000EUR divided by 100. That is a minimum of 2,000EUR at 1.1500 or 2,300USD.
Now, you are closing the position from 1.1500 to 1.1550 (a profit of 50 pips). You now “own” 200,000EUR at the price of 1.1550 or equals 231,000USD. Your profit is 1,000USD.
So, you only need 2,300USD to buy 2 lots of EURUSD at 1.1500 to get a profit of 1,000USD when you close the position at 1.1550, which equals 43,47%!
There is a huge potential to profit in the Forex market using less capital.
Nice, right? But you must remember this…
Based on the examples above, leverage amplifies the amount in your account when you are doing a transaction.
Leverage amplifies your profit potential. However, it also works the other way, increasing your risk potential!
Using the same EURUSD example above:
You want to buy 2 lots of EURUSD at the price of 1.1500 with the hope that the price will increase and profit from it. However, EURUSD falls to 1.1450.
How much are you losing?
So, you buy 2 lots of EURUSD to “own” 200,000EUR at 1.1500 or equals 230,000USD.
How much do you need when using the leveraged account of 1:100?
You will need 200,000EUR divided by 100, which means you are using 2,000EUR at the price of 1.1500 or equals to 2,300USD.
Now, the price is moving below your buying price to 1.1450, which means you are in a losing position of 50 pips. This means you “own” 200.000EUR at the price of 1.1450 or equals 229,000USD. Your loss is 1,000USD.
Since the price is moving against your position, you are experiencing a loss of 1,000USD or 43.47%.
Let’s see what happens if we only have a 10,000USD account in our leveraged trading account and experience a bigger loss. What will happen with the “loan” amount and the account?
Your starting balance is 10,000USD with leverage of 1:100.
You bought 2 lots of EURUSD at the price of 1,1500, which means you need 2,300USD from your balance to make the trade. Your balance is 7,700USD.
The price is going lower, which means you are experiencing a loss.
If the price goes down to 1.1450, you will lose a 1,000USD,
If the price goes down to 1.1400, you will lose a 2,000USD,
If the price goes down to 1.1350, you will lose a 3,000USD. The loss exceeded your capital for buying 2lots EURUSD in the first place.
This is also eating your remaining balance. Now you have only 7,000USD left in your account.
If the price goes down to 1.1300, you will lose 4,000USD and be left with a 6,000USD account balance.
If the price goes down to 1.1250, you will lose 5,000USD and be left with a 5,000USD account balance.
What happens if the price reaches 1.1000 and you still haven’t closed the position?
You will lose 10,000USD.
Maybe you are thinking, “but I own a 200.000USD for 2 lots!”.
Remember that it was a “loan” from the brokerage, and your real initial balance is 10,000USD. Therefore, if you lose 10,000USD, the market will eat all your initial balance. Based on the broker’s account rules, the brokerage has the right to close your position before it exceeds your balance.
Takeaway
Based on the above examples, it is a must to understand that leverage is a double-edged sword; on one side, you can get a high-profit potential transaction. On the other, your risk potential can get high.
When you enter the forex market, you will come across a lot of jargon that might catch you off guard, including bulls and bears, hawks and doves, pips and ticks, and more. To understand the market, you must have a solid knowledge of regularly used market jargon.
Here are several terms you will encounter when foraying into the world of trading.
Long/Short
Going long means you are “buying” when you expect a price to increase.
Going short implies you are “selling” when you expect a price to decline.
Price Bid/Ask
The Bid price is the price taken when placing a Sell position.
The Ask price is the price taken when placing a Buy position.
Spread
The spread is the difference between the Bid and the Ask Prices. In forex, a lower spread is considered preferable. Generally, when a market is “liquid” (there are a large number of traders), spreads are lower.
Usually, Major currencies have a lower spread because it’s more popular. On the other hand, exotic currency pairs have a wider spread because there are fewer traders.
Bullish/Bearish
Market sentiment provides insight into the performance of an individual asset or the broader market. When the market sentiment is bullish, the price is increasing. When the market sentiment is bearish, the price is declining.
Hawkish/Dovish
Unlike Bullish and Bearish, Hawkish and Dovish refer to the central bank’s attitude toward the country’s monetary policy. When the central bank takes a Hawkish stance, such as allowing higher interest rates to achieve the central bank’s inflation target, the market sees this as something positive and generally causes prices to rise.
On the other hand, when the central bank takes a Dovish stance, such as keeping interest rates low to stimulate the economy, the market sees this as something negative and generally causes prices to fall.
Safe-Haven
As the name implies, a safe-haven means “safe assets”. Traders and investors seek them out to limit their exposure to or losses during a market slump. The US Dollar and the Japanese Yen are examples of safe-haven currencies. An instrument that is most often considered a safe-haven is Gold.
Hedging
Hedging is when you start a new trading position on the same currency pair in the opposite direction of an existing position. Traders frequently do this to hedge against or limit prospective losses.
Rollovers
This is the procedure by which an open position’s settlement date is extended. If you want to hold a position overnight, rollover fees are determined at the end of each trading day.
Leverage
Leverage enables you to take on larger positions than would be achievable with your limited capital. For instance, if you wish to start a position on AUD/USD with $100 of your capital, 100:1 leverage allows you to open a position worth $10,000 ($100*100).
Naturally, traders must utilize this with caution. While leverage can dramatically boost earnings, it can also magnify losses.
Commissions
Commissions are the payments to a forex broker when you trade. Varying accounts frequently charge different commissions, so be sure to select the one that is most advantageous to you.
Now that you’ve deciphered the perplexing world of forex jargon, it’s time to learn more about the fundamentals of forex trading: when to buy and when to sell.
There are always two prices when you trade the forex market, the stock market, or any other financial market.
Bid Price – The price that you use as your reference when you are going to enter a Sell position.
Ask Price – The price that you use as your reference when you are going to enter a Buy position.
So, just like going to a money changer to exchange your money, you will see that they have both the Sell and Buy prices for a specific currency.
Let me explain further using this chart:
This chart features the EURUSD, and you can see two prices: the Bid price on the left and the Ask price on the right.
If you want to open a Sell position, you can use the Bid Price as your reference. If you want to open a Buy position, you can use the Ask Price as your reference.
Let’s use that as a guide.
There is a Bid Price of 1.07962 and an Ask Price of 1.08008 for EURUSD.
When you click Sell, you need to focus on the Bid Price (1.07962) as your reference.
Let’s say the price goes down to Bid 1.07500 and Ask 1.07523. This means you are getting a profit. When you click close for this example, which means that you are “clicking” Buy to close the position, you must focus on the Ask Price as your reference.
The same concept applies when you plan to Buy EURUSD. When you click Buy, the price you must focus on is the Ask Price (1.08008).
If you want to close the position, click Sell to close the position and focus on the Bid Price as your reference.
Spread
Now that you know what Bid and Ask Prices are, it’s time you learn about the spread: the difference between the prices.
From this example, you can see that the EURUSD has a spread of 4,6 pips.
The spread plays an important role in your trade because this will affect your result. Some brokerage firms may charge you a little, and some don’t charge any fees to trade. In this case, your transaction cost will be in the form of a spread.
Let’s explore further.
If the spread is your transaction cost, then a wider spread between the Bid and Ask price means the transaction cost is higher.
Example:
If you refer to this EURUSD spread, the transaction cost is 4,6 pips when buying or selling 1 standard lot of EURUSD. Because the pip value of EURUSD is 10USD per pip per lot, your transaction cost will be 46 USD.
Every time you enter a position in EURUSD, you must pay this transaction cost first before getting the profit from the price movement. Remember that the spread may change wider or tighter based on the market volume.
Note that your transaction cost to cover is higher if you have a wider spread. If your spread is tighter, your transaction cost to cover is lower.
To answer the question, you’ll need this information: the lot size you’re trading, the quote currency, and your account currency.
Allow me to explain.
The Lot Size
As you are probably aware, there are many lot sizes in the forex market, such as standard lot, mini lot, and so on.
1 standard lot is comparable to a hundred thousand units and is worth 10 dollars each pip.
1 mini lot equals 10.000 units and is valued at 1 dollar per pip, while
1 micro lot equals 1.000 units and is worth 10 cents per pip or 0.1 dollars per pip.
One thing to remember is that 10 mini lots equal 1 standard lot, as 10.000 units multiplied by ten equals 100.000 units.
And 10 micro lots equal to 1 mini lot, as 1.000 units multiplied by ten equals 10.000 units.
However, this calculation is only valid when the Quote Currency is in US Dollars.
Quote Currency
So, what is Quote Currency?
In direct and indirect currency pairs, the Quote Currency serves as the second currency and is utilized to value the Base Currency. For example, for GBPUSD, the base currency is the pound sterling (GBP), whereas the quote currency is the dollar (USD).
USDJPY The base currency is the USD, while the quote currency is the JPY.
GBPJPY The base currency is the GBP, while the quote currency is the JPY.
In that case, what if the quote currency isn’t the US dollar? If you’re trading a currency that isn’t the US dollar, then the calculation will follow the quote currency instead of the US dollar. When you’re trading, for example, the EURAUD, then the calculation will look like this:
1 standard lot is 10 Australian Dollars for 1 pip
1 mini lot is 1 Australian Dollar for 1 pip
1 micro lot is 0.1 Australian Dollars for 1 pip
The same calculation if we trade in GBPJPY,
1 standard lot is 10 Japanese Yen for 1 pip
1 mini lot is 1 Japanese Yen for 1 pip
1 micro lot is 0.1 Japanese Yen for 1 pip.
If we calculate using the lot size, we simply multiply it by the lot size we are using. For example, if we enter two standard lots in EURAUD, the pip value will be 20 AUD per 1 pip.
If we enter 2,7 standard lots in GBPJPY, we will receive a pip value of 27 JPY for 1 pip.
But then, how do you use this in real-life trades?
To put it into practice, you’ll need to calculate using the currency of your account.
Account Currency
When we open an account with a broker, we have to deposit our money in one type of currency for each account. You can open an account in USD, AUD, or another currency, depending on your brokerage. When you try to open an account with VT Markets, for example, you can only open an account with these currencies.
In this lesson, let’s try out the USD and CAD accounts.
Open a $1,000 USD account. The calculation will be simpler because most significant currency pairs, such as EURUSD, GBPUSD, and AUDUSD, use the USD as the Quote Currency.
The calculation for these pairs is as simple as adding the total value to your balance.
For example, if you earn 20 pips on a 1 standard lot of EURUSD, you earn a total profit of 20 pips multiplied by the 10USD pip value, for a total of 200USD. If you enter a 2 standard lot, you will receive 20 pips multiplied by ten dollars, then multiplied by 2 lots, resulting in a total of 400 dollars.
To add this profit to your balance, simply multiply your initial amount of 1,000 USD by 400 USD, resulting in a balance of 1,400 USD. This will be different the next time you open an account using CAD as the account currency.
Assume you have a 1,000CAD balance in your account. If we use the same profit as in the sample above, 400USD, then the profit cannot be added immediately to the CAD balance, simply because the currencies are different. To accomplish this, you must first convert the profit from USD to CAD. You must be aware of the exchange rate at the time of position closure.
Consider the following example: the exchange rate between USD and CAD is 1,25, which equals 1USD to 1,25CAD. Thus, 400USD multiplied by 1.25 equals 500CAD. Then you can add this to your balance: your initial balance of 1,000 CAD will be increased by 500 CAD (converted from 400USD), bringing your total to 1,500 CAD. It may appear hard, but there is no need to be concerned because all trading platforms nowadays provide an auto-calculating tool. This implies that your earnings will be calculated automatically using the currency associated with your account.