Daily Market Analysis
Market Focus
While the US stocks market retreated from session highs after protestors stormed the US Capitol, forcing a lockdown that interrupted certification of the presidential election, the equity market still managed to stabilize in the green. The SP 500 trimmed its advance to 0.6% at the close of trading in New York, after rallying as much as 1.5% earlier today. Equities had been on track for a record, buoyed by likely Democratic control of Congress that could unleash a torrent of spending to revive growth. That sparked a relation trade, with investors pouring into small caps and banks, companies that benefit from an economic rebound. Tech shares lagged behind.
The buoyant mood was pierced, but not sunk, when Vice President Mike Pence left the floor of Congress as hundreds of protestors swarmed past barricades surrounding the building where lawmakers were debating Joe Biden’s victory in the Electoral College.
Democrats claimed one of the two Senate seats contested in Georgia and led in the other tight race. Two wins would giver Biden’s party control of Congress and smooth the path for some of his spending policies. That’s fueled bets that increased stimulus will boost the economy and spark inflation. The 10-year Treasury yield climbed past 1% for the first time since March.
Congress passed at year’s end a $900 billion spending deal to bolster an economy showing signs of slowing as the raging virus prompts stricter lockdowns across the country. The number of employees at US businesses unexpectedly declined in Dec for the first time since Apr. US 10-year breakeven, a market gauge of inflation expectations over the next decade, topped 2% this week for the first time since 2018.
Market Wrap
Main Pairs Movement
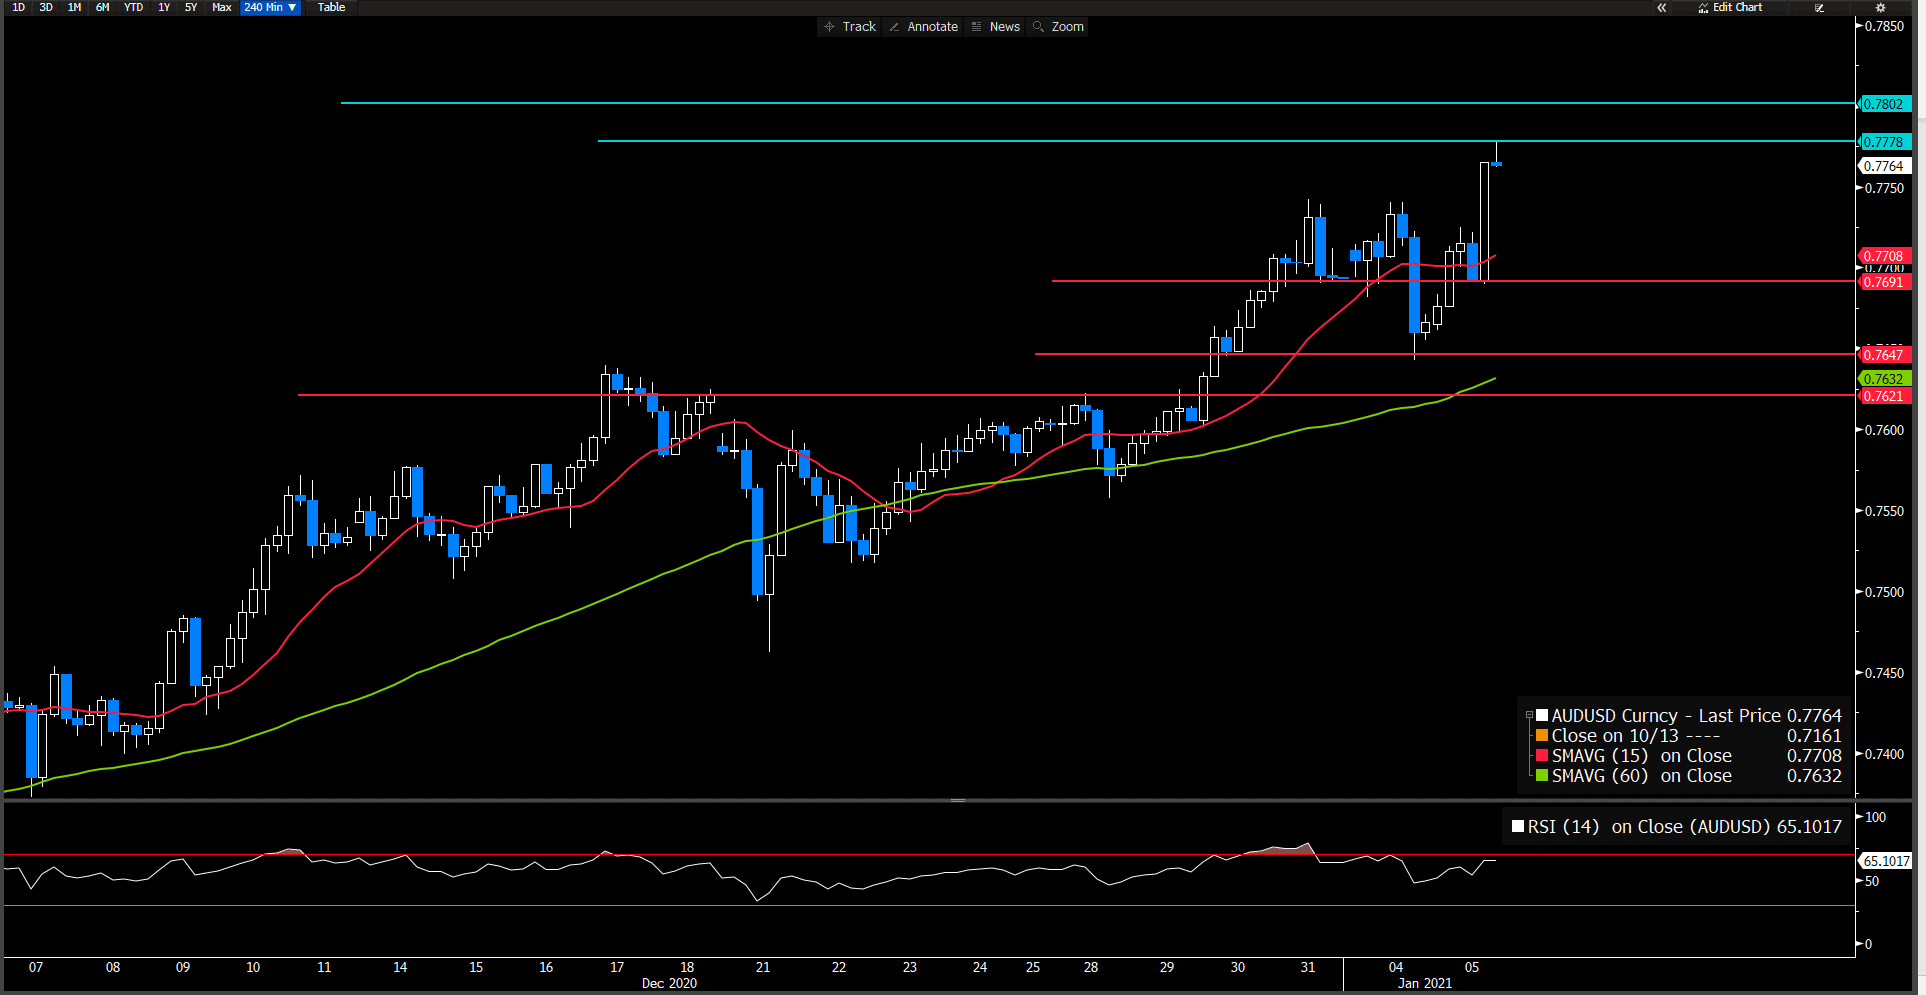
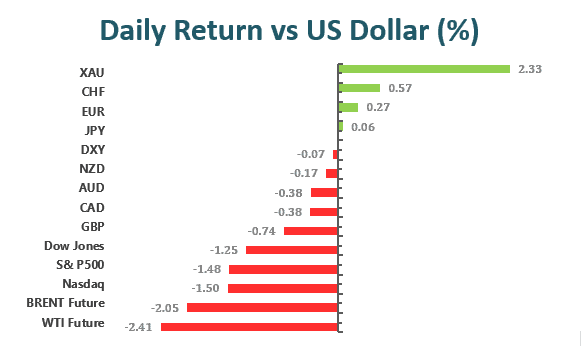
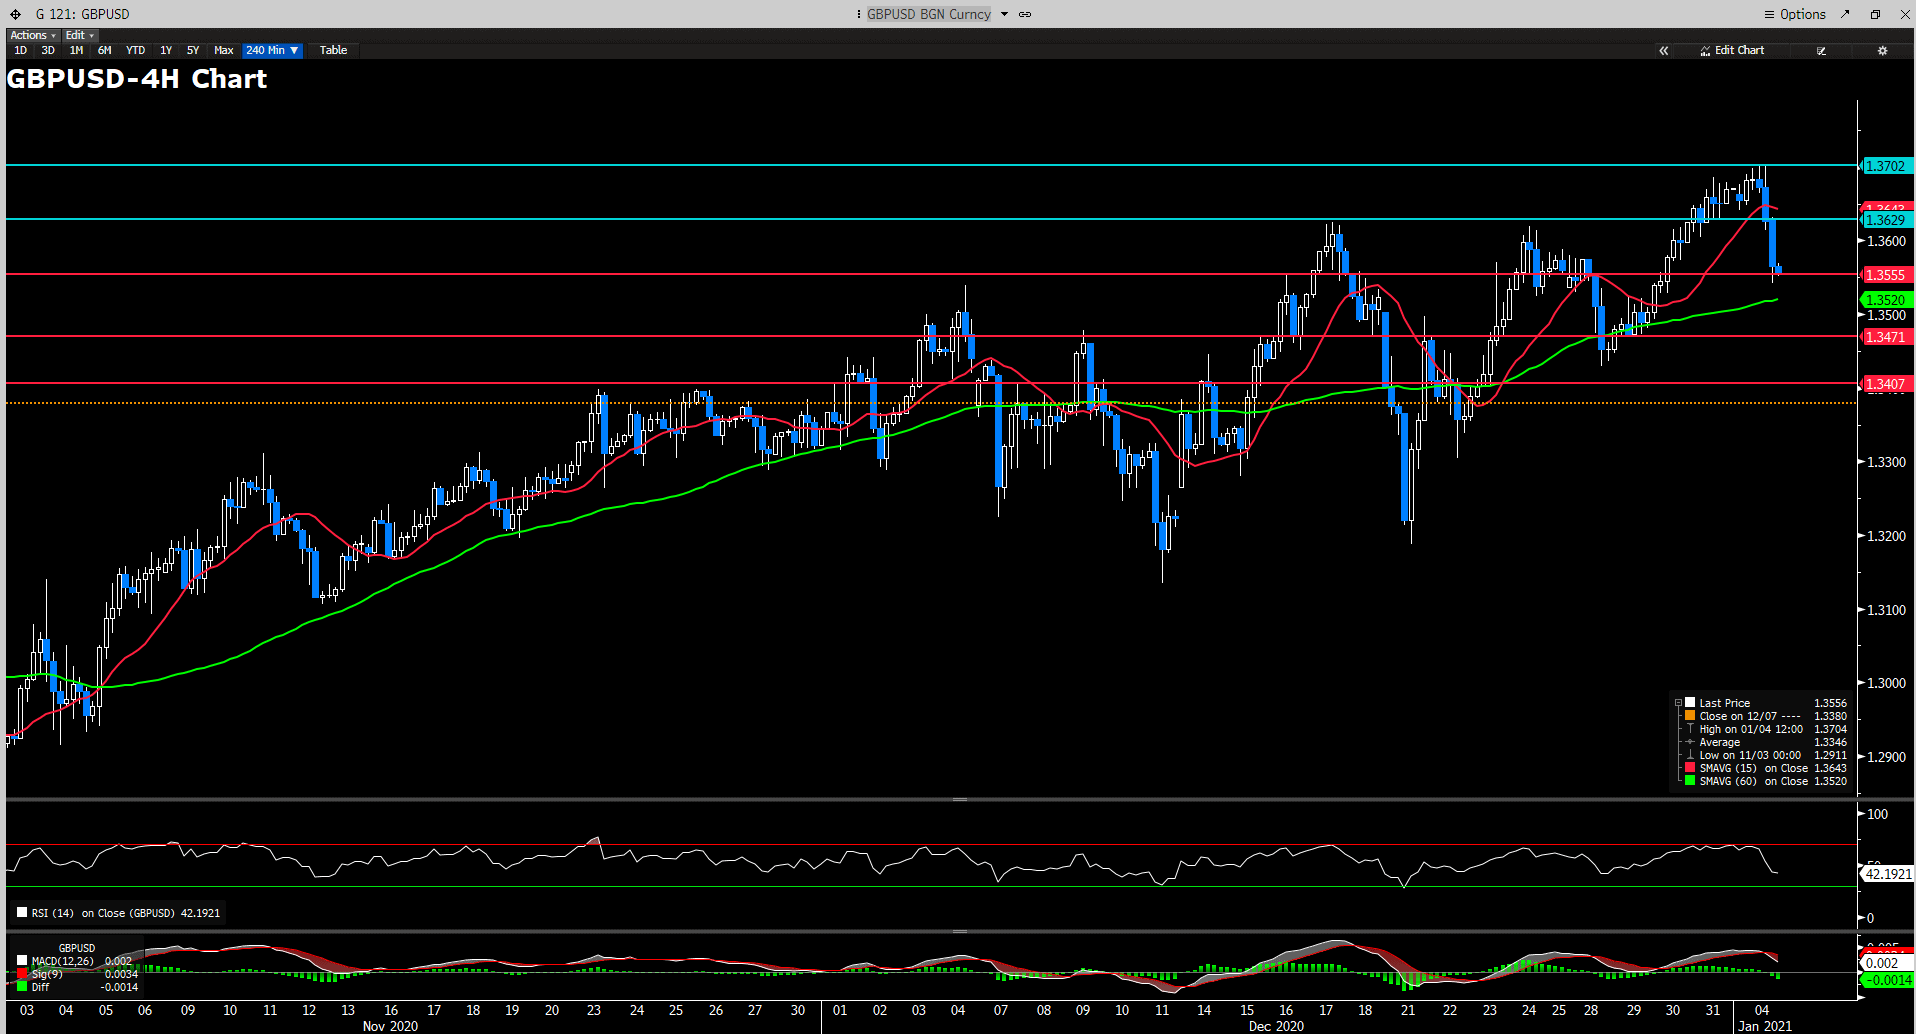
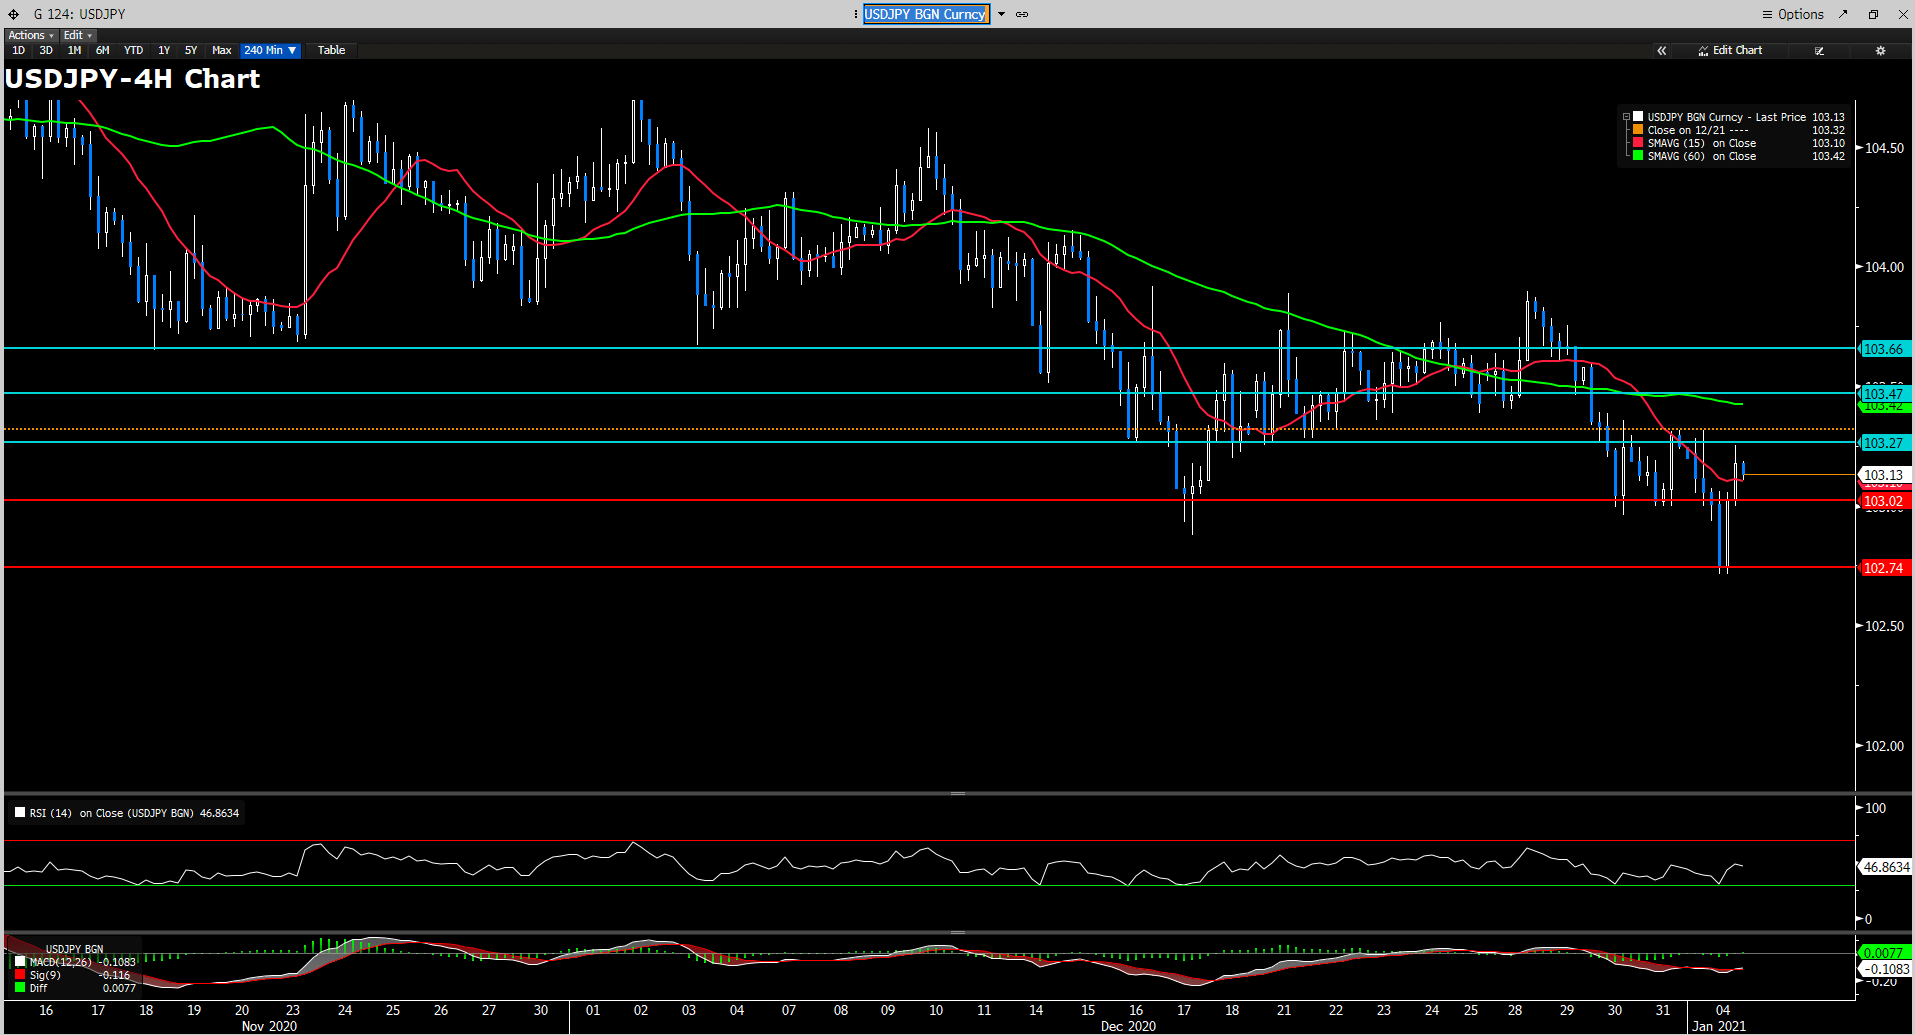
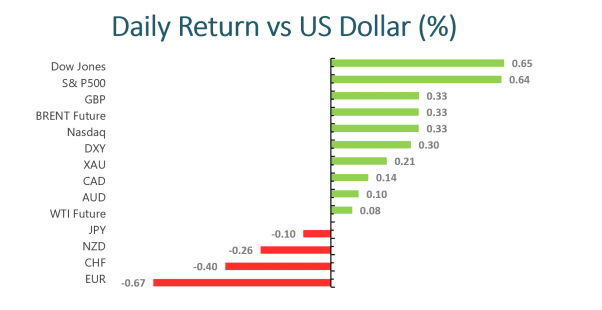
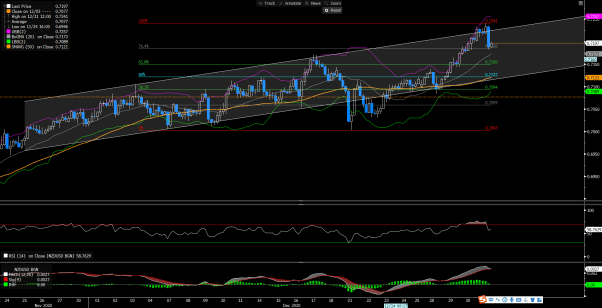
Risk-appetite pushed the aussie higher against its American rival, with the pair nearing April 2018 high at 0.7812. USDJPY, on the other hand, stages a modest recovery from multi-month lows set earlier this Wednesday. The underlying bullish tone undermined the safe-haven JPY and remained supportive. The prevalent greenback selling bias might cap gains as the focus shifts to FOMC minutes. Cable has recovered above 1.36 as the risk appetite put a cap to the greenback’s advance.
The pessimism surrounding the dollar remains well and sound early in 2021, with DXY dropping to new lows in the 89.20 area on Wednesday. The front-month futures contract for the American benchmark for light sweet crude oil (WTI) has survived a brief pre-US session dip below the $50 level and has recently recovered back above the $50.50 level to set fresh highs since Feb 2020.
Technical Analysis:
EURUSD (4 Hour Chart)
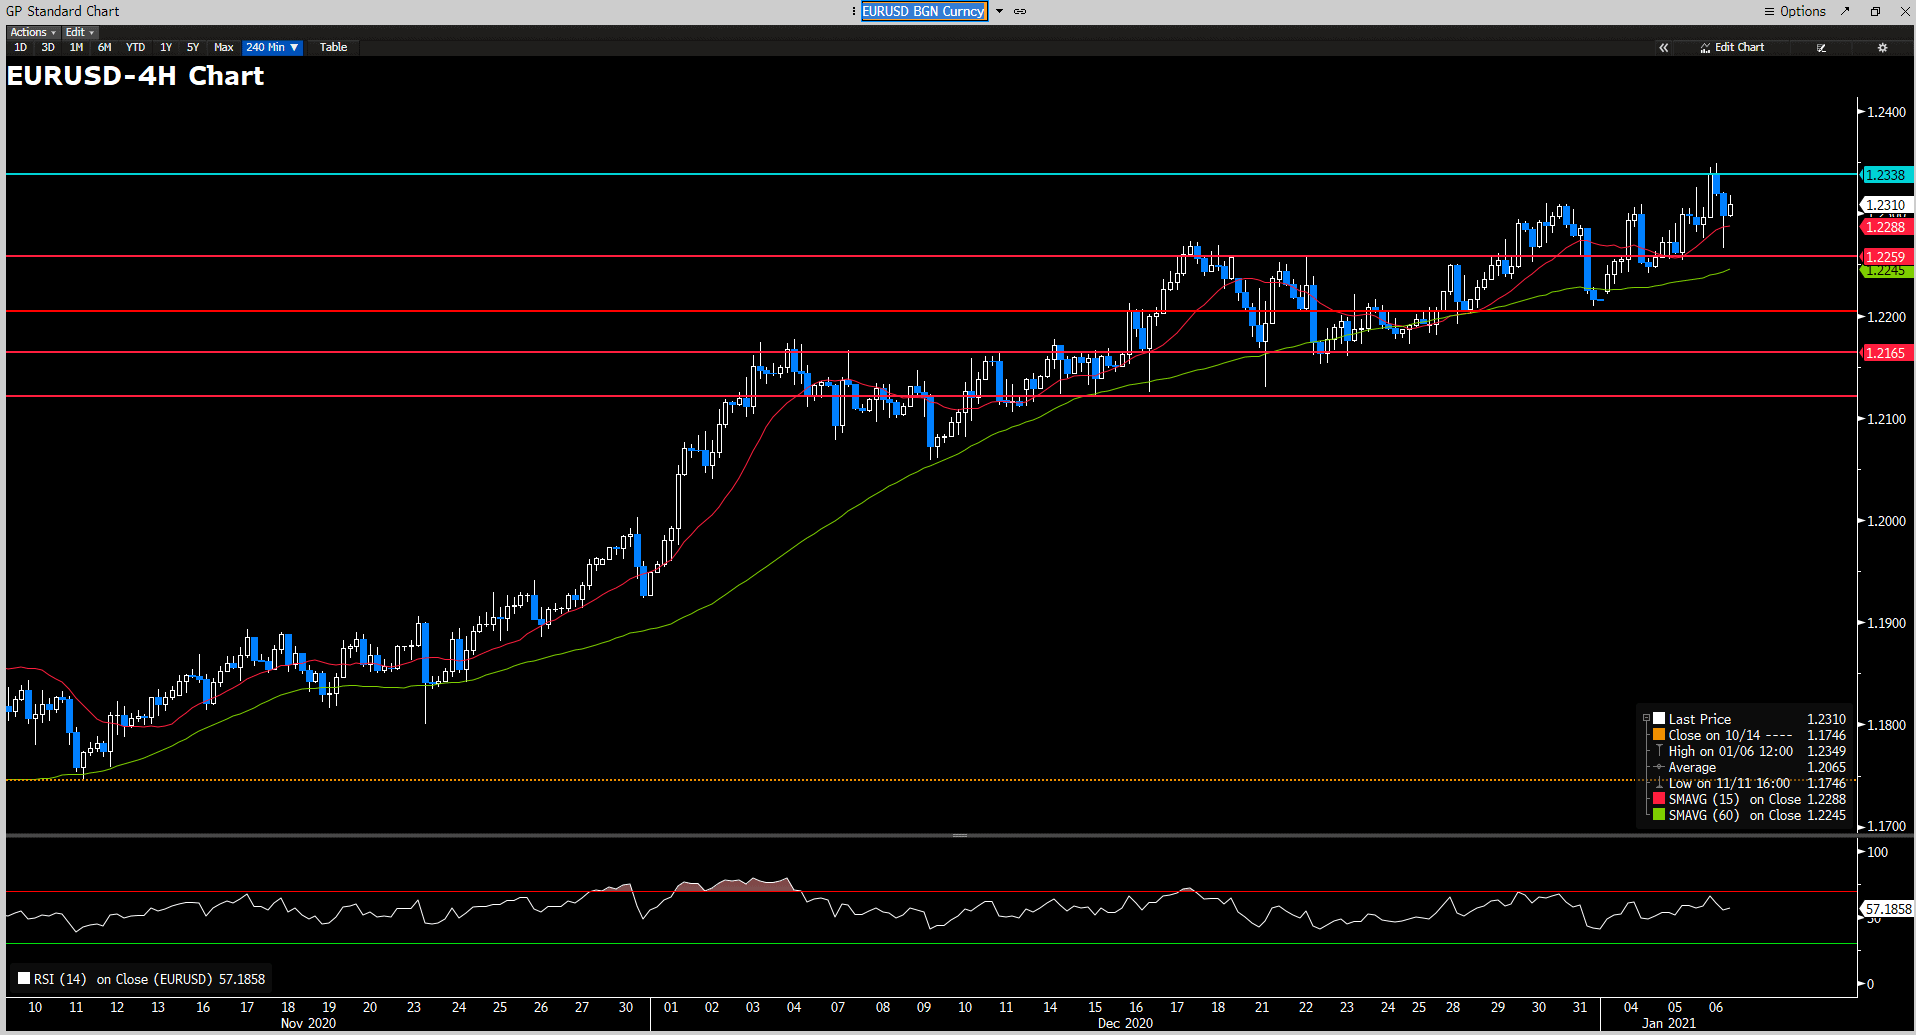
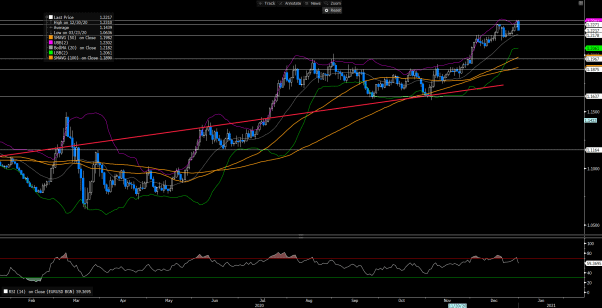
EURUSD has retreated from the highs above 1.23 zone earlier Wednesday, but immediately regained its bullish movement as the pair was last seen trading around 1.2288 at the time of writing. The bearish theme surrounding the greenback continues to be the main driver for EURUSD’s upward trend. However, given that the uncertainty that revolves around the coronavirus situations is a huge factor that can deteriorate the market sentiment instantly, the demand for safe-haven asset still has the ability to revive the greenback during times of worsening global pandemic situations. Overall, the EURUSD is likely to advance further as its upward trend is supported by the 15-Day SMAVG. On top of that, with the RSI now sitting around 60, room has been cleared for the pair to proceed upward. If the EURUSD can find acceptance above 1.2338, the next resistance would be found around 1.23765 (a price zone last seen in Apr 2018). On the flip side, a strong support can be seen around 1.2259, followed by 1.2205.
Resistance: 1.2338
Support: 1.2259, 1.2205, 1.2164, 1.2121
USDCAD (4 Hour Chart)
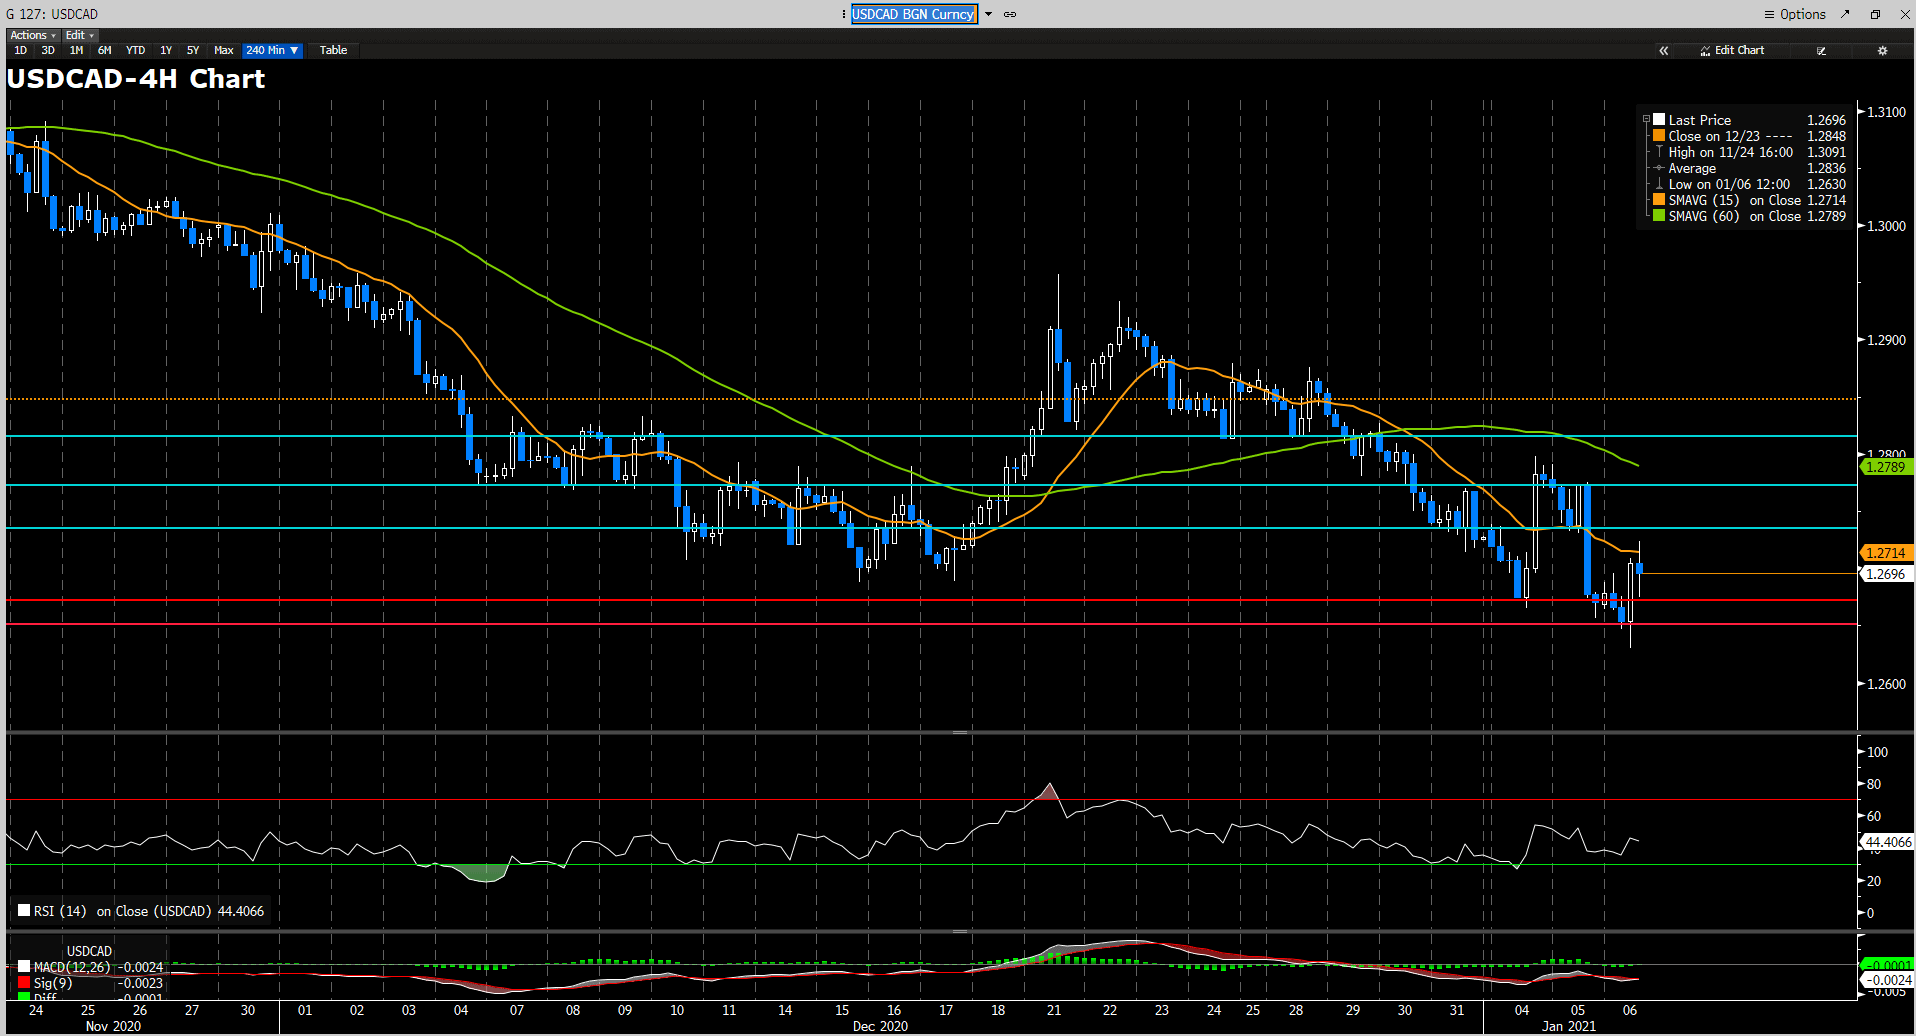
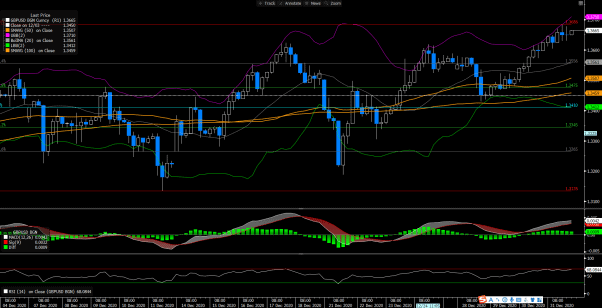
The Loonie recovered substantially from its multi-year lows at 1.2630, which it reached during the early European session, and is currently trading around 1.2715, nearly a 20% bounce back. Nevertheless, in the bigger picture, the Loonie pair remains its downward sloping movement as the Oil continues to surge (the WTI is trading above the $50 territory) and the overall risk-on sentiment keeps weighing down on the demand for the greenback. From a technical perspective, the bearish momentum of the Loonie is supported by the 60-Day SMAVG. But the intersecting MACD line and signal line is indicating that the recent rebound of the pair may have overturned the short-term selloff pattern of USDCAD. A positive move above 1.2735 may trigger a short-term recovery of the bearish Loonie. On the flip side, the short-lived daily lows around 1.2652 would become the most immediate support for the pair.
Resistance: 1.2816, 1.2773, 1.2735
Support: 1.2673, 1.2652
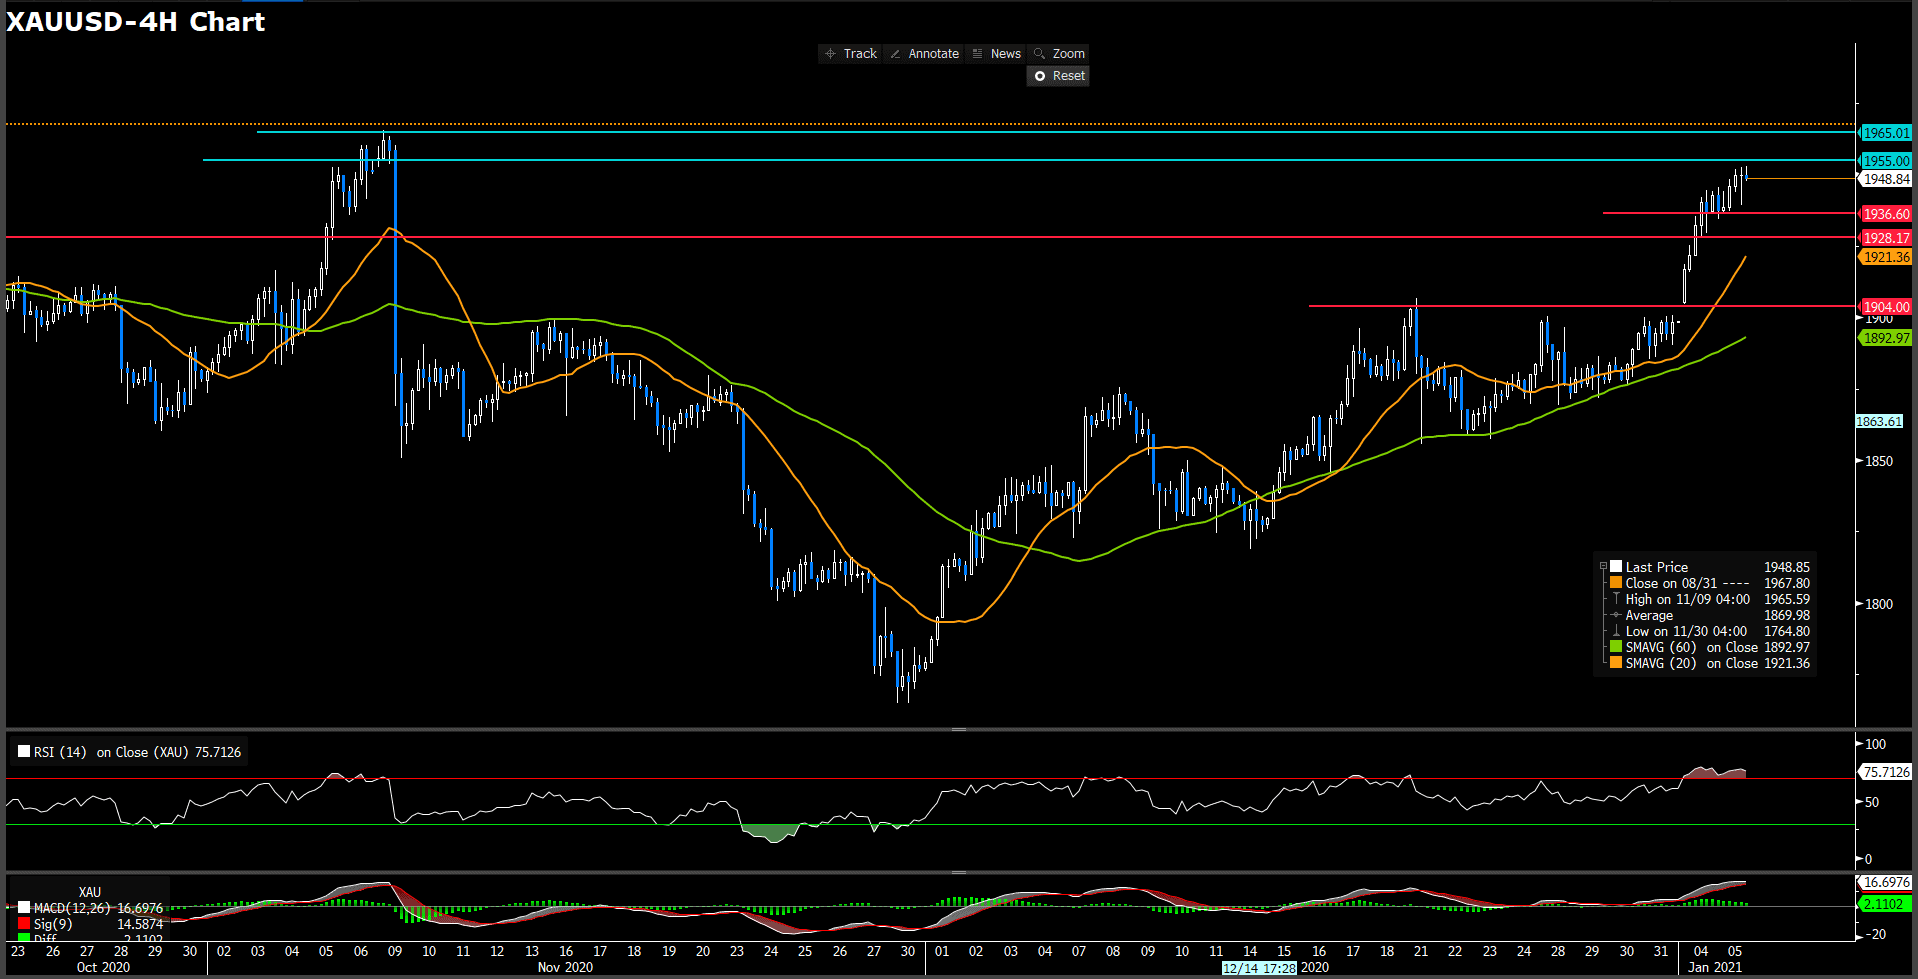
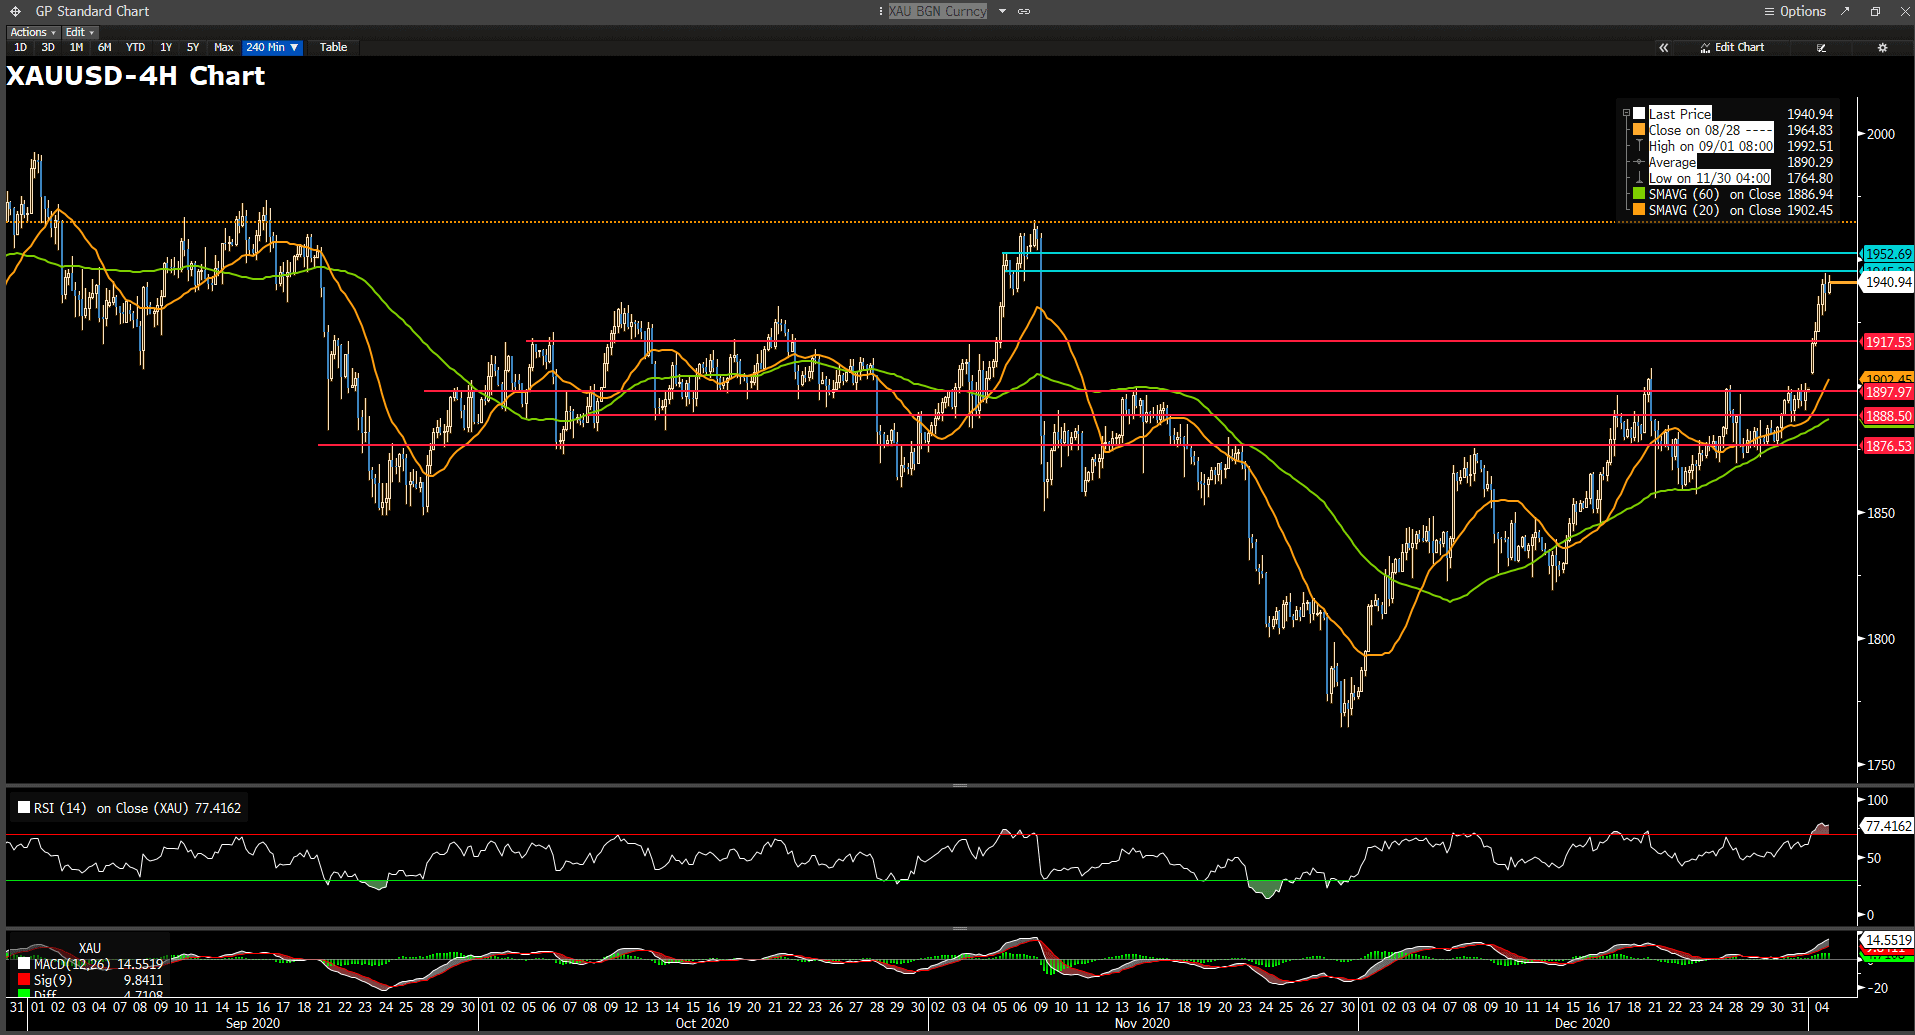
XAUUSD (4 Hour Chart)
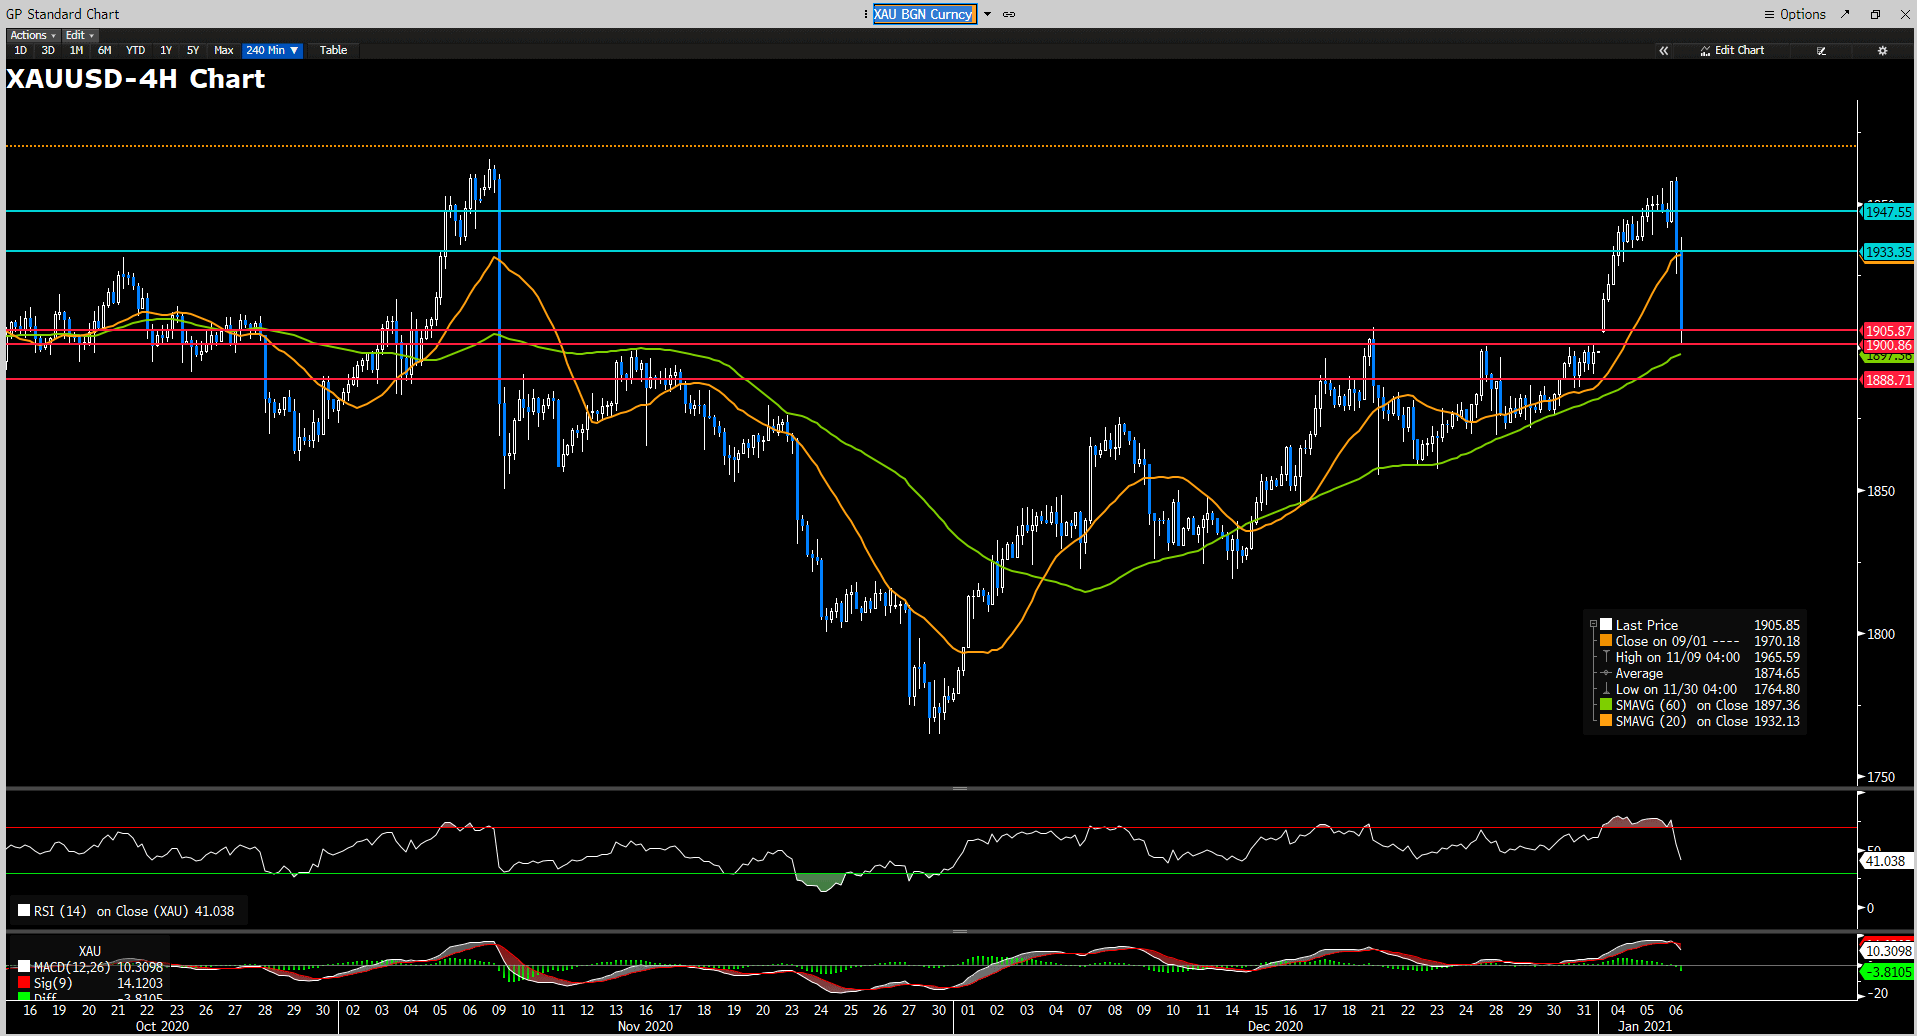
Gold made a sharp correction from its 2-month high, nearing the $1960 zone, to around $1900, which is a strong, psychological support at the time of writing. The news of the Democrats managed to secure control of the Congress by winning both available seats in Tuesday’s Georgia Senate elections spurred the bond market on Wednesday. Essentially, the greater fiscal stimulus from a Democrat-controlled Congress would imply more US government debt issuance, which exerts downwards pressure of US government bond prices and holds upwards pressure on US bond yields. With yields and debt rising, investors are likely to switch their targets from safe-haven metals to US government debt. From a technical perspective, the gold’s bullish movement remains supported by the 15-Day SMAVG. Thus, it is likely that the XAUUSD would resume its upward movement after this round of profit-taking wears off. Conversely, if the bears can find acceptance below 1900, an extensive decline can be expected.
Resistance: 1933.35, 1947.55
Support: 1905, 1900, 1888
Economic Data
Click here to view today’s important economic data.