Daily Market Analysis
Market Focus
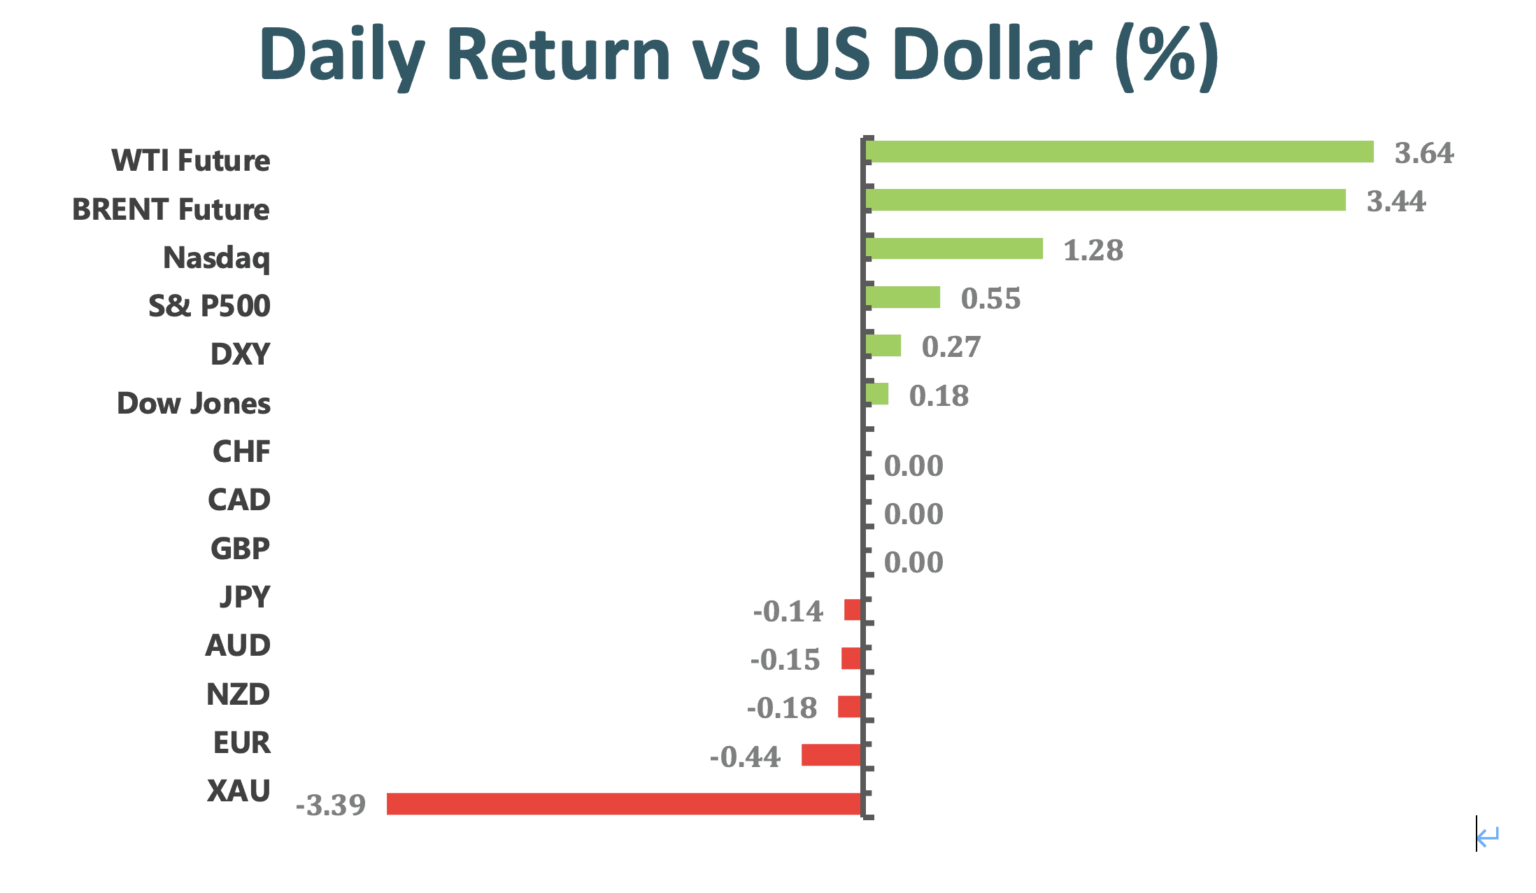
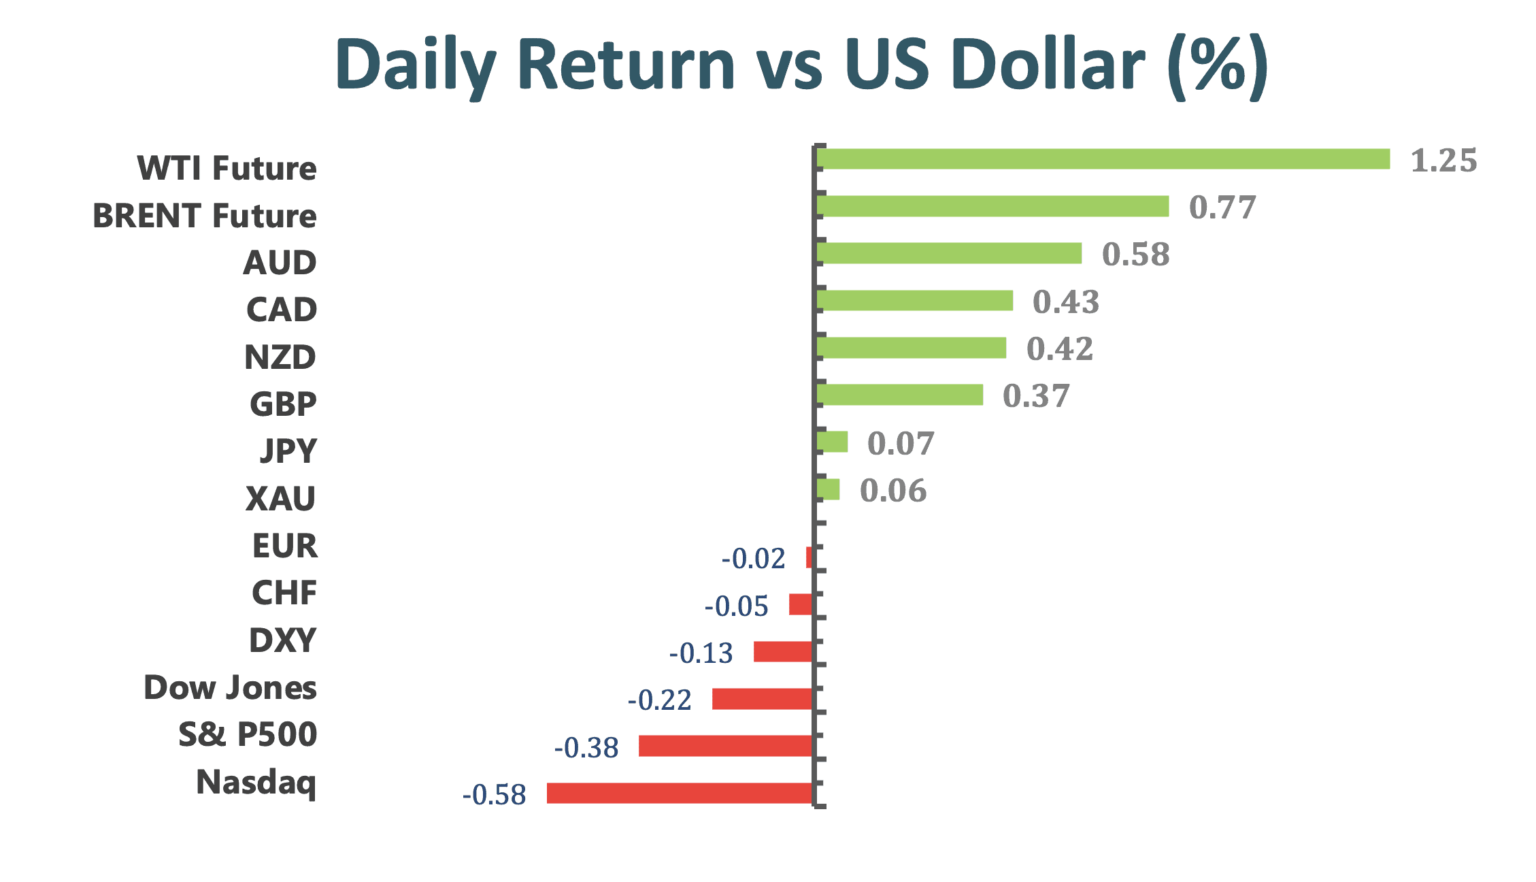
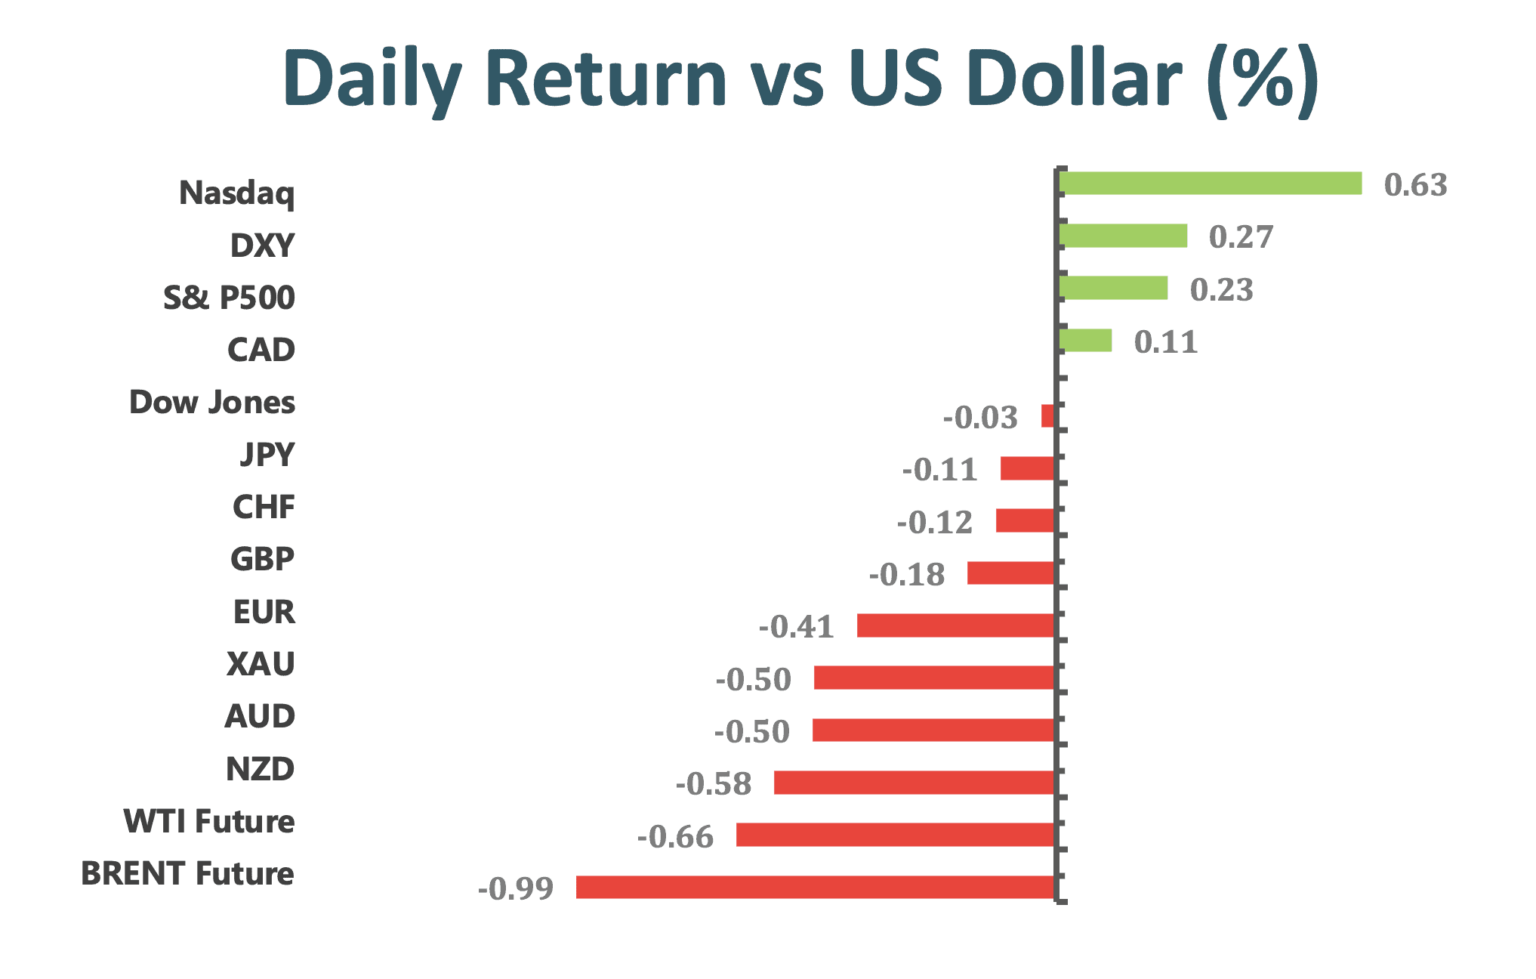
U.S. stocks fell by the most in more than a week after Wells Fargo & Co. dragged down the banking sector in the wake of disappointing fourth-quarter results. Crude oil declined from a 10-month high as the dollar strengthened.
The energy and financial sectors led the S&P 500 into the red for a second day, with Exxon Mobil Corp. dropping 4.8% after a report said the company is being investigated for overvaluing assets. Utilities and real estate shares rose. Stocks were already lower in Europe and Asia as President-elect Joe Biden’s much-anticipated $1.9 trillion Covid-19 relief plan came under scrutiny. Optimism about the U.S. aid package had helped spur the so-called reflation trade, but the plan is far from a done deal. Biden’s proposal could be watered down under congressional opposition, and there’s the possibility that some taxes could rise.
Biden’s “American Rescue Plan” includes wave of new spending, more direct payments to households, expansion of jobless benefits and an enlargement of vaccinations and virus-testing programs as deaths record levels and local governments expand lockdowns.
Attention is now turning to how much of the package will ultimately get passed by Congress, with the go-big price tag and the inclusion of proposals set to be opposed by many Republicans. As lawmakers wrangle over details, U.S. jobless claims published Thursday painted a dismal picture and the U.S. is leading all countries in virus deaths with New York state reporting more than 200 daily fatalities for the first time since May.
Market Wrap
Main Pairs Movement
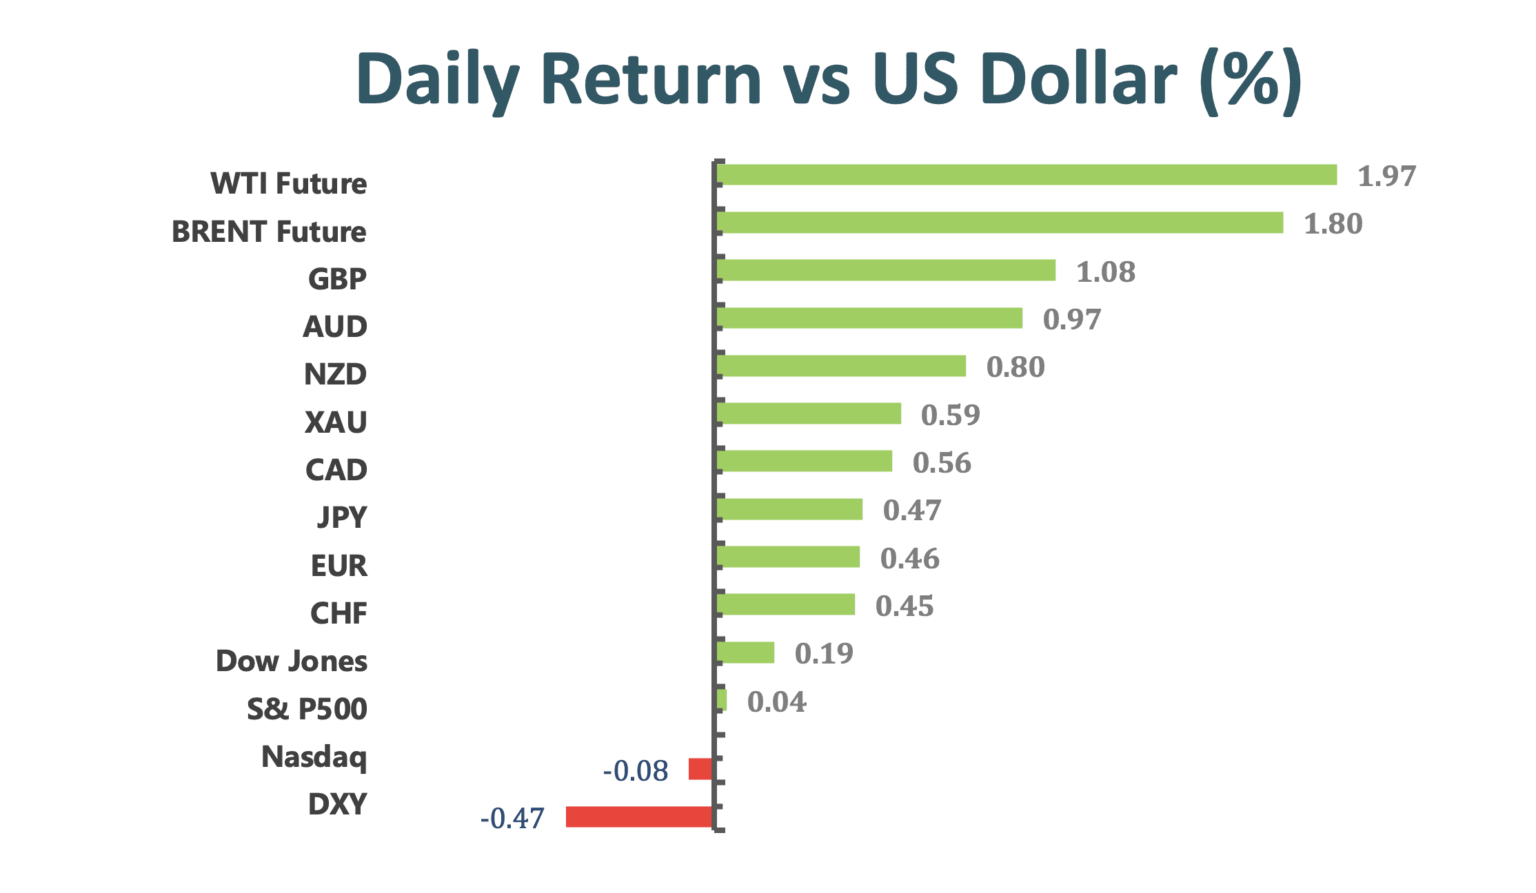
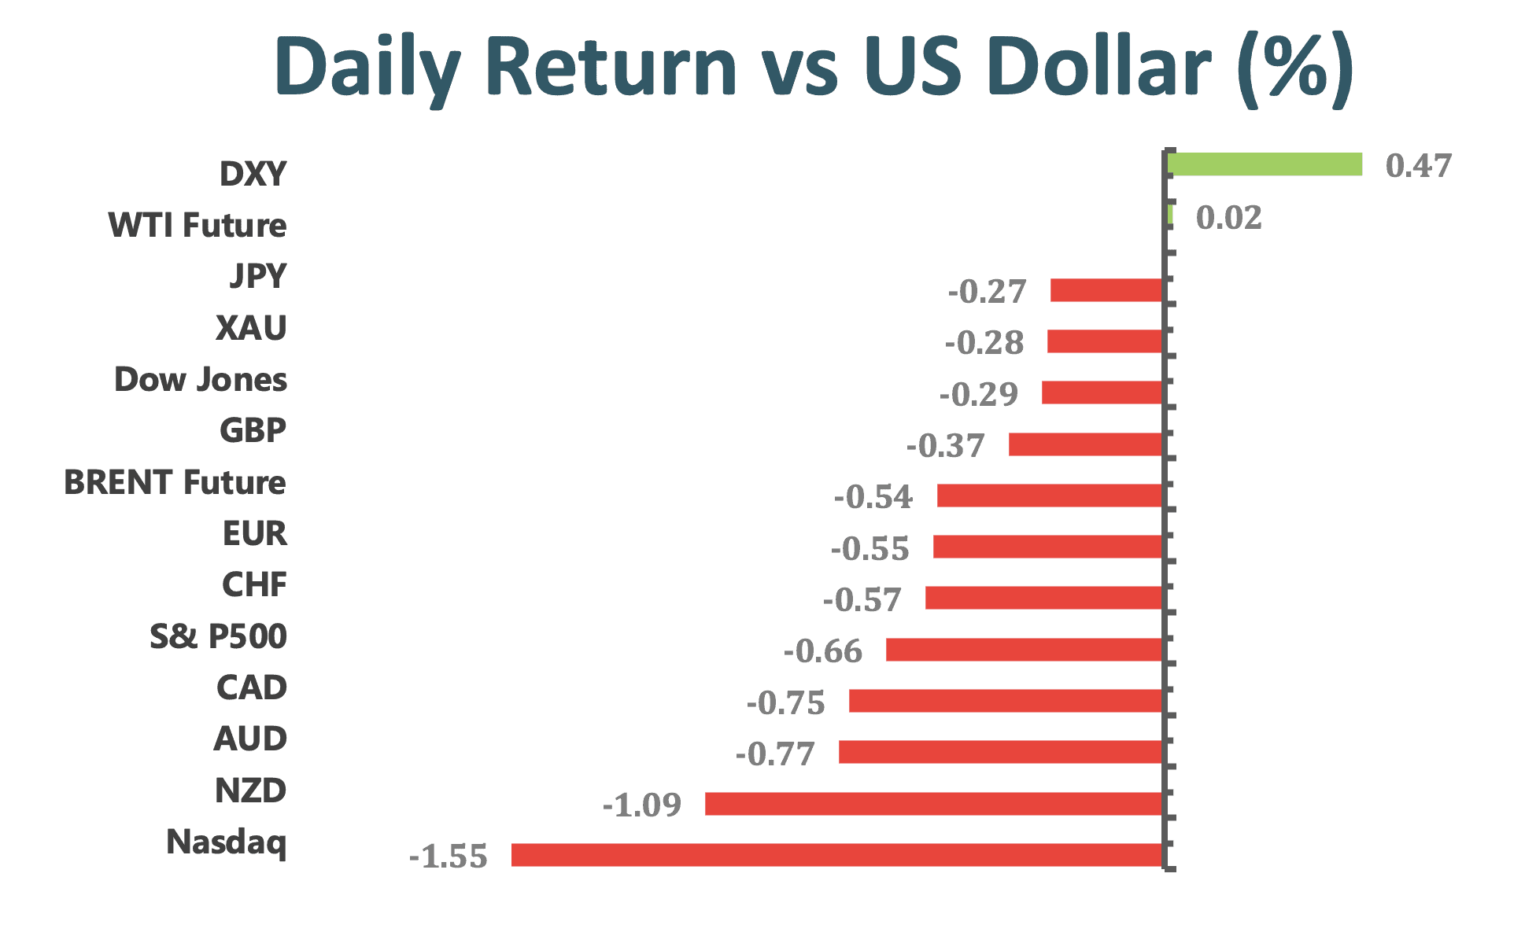
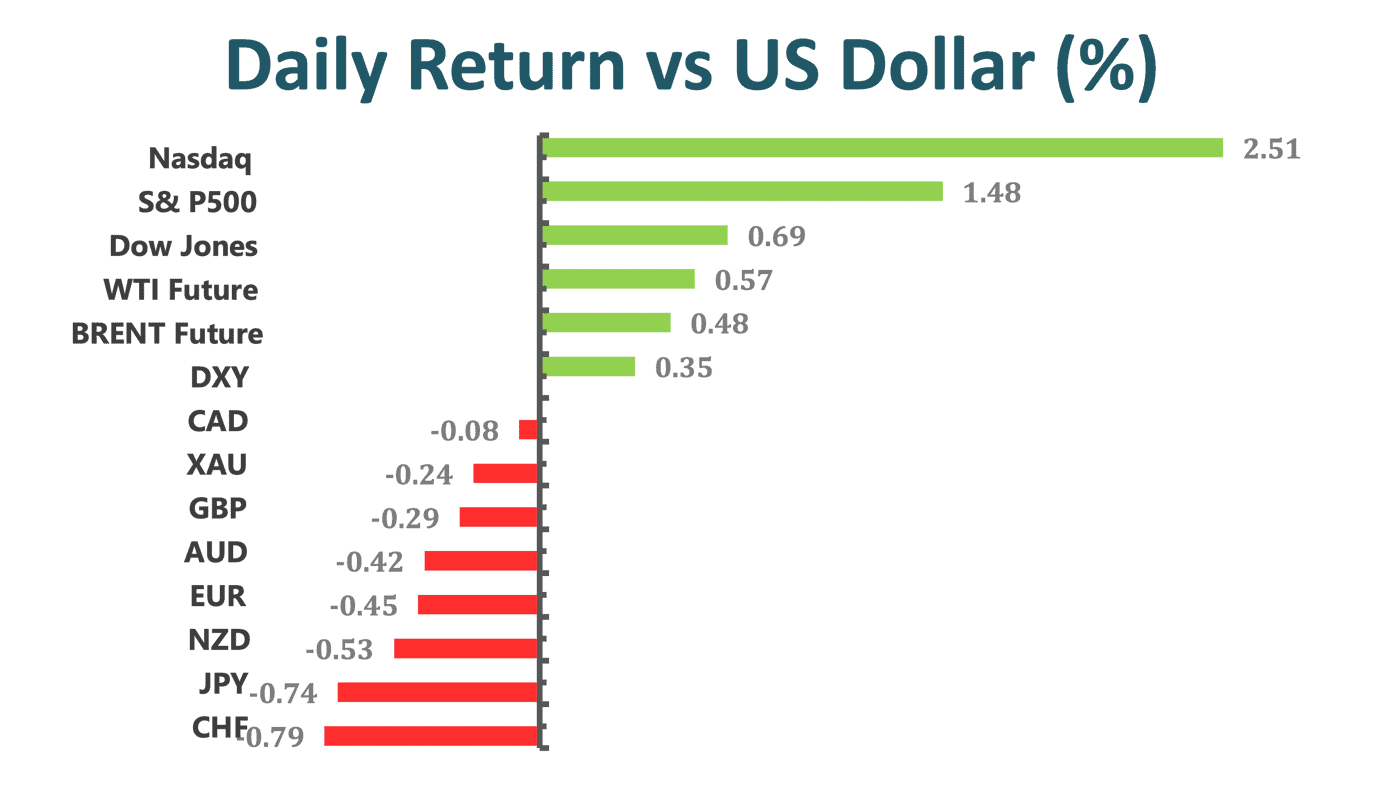
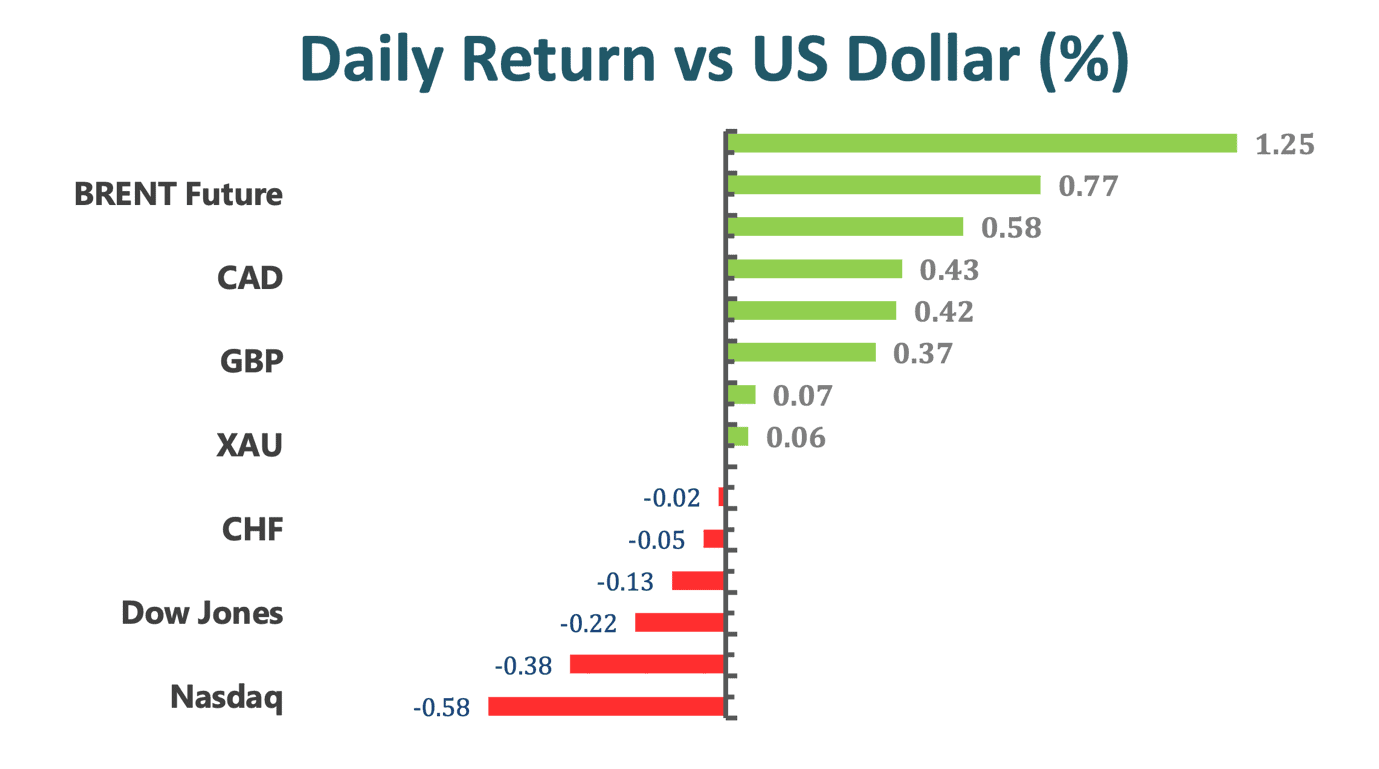
The dollar is poised for the first weekly back-to-back rise since September amid mid-month position adjustments before a long weekend in the U.S. as risk appetite waned ahead of central bank meetings starting next week.
Investors are concerned that the Biden administration’s stimulus plan may struggle to win broad-based support and soft bank earnings. Haven asset demand rose following weaker-than-expected U.S. retail sales and reports the EU was notified Pfizer won’t be able to deliver scheduled vaccine volumes in full during the next 3-4 weeks. Treasury 10-year yields declined 3.7bps to 1.09%.
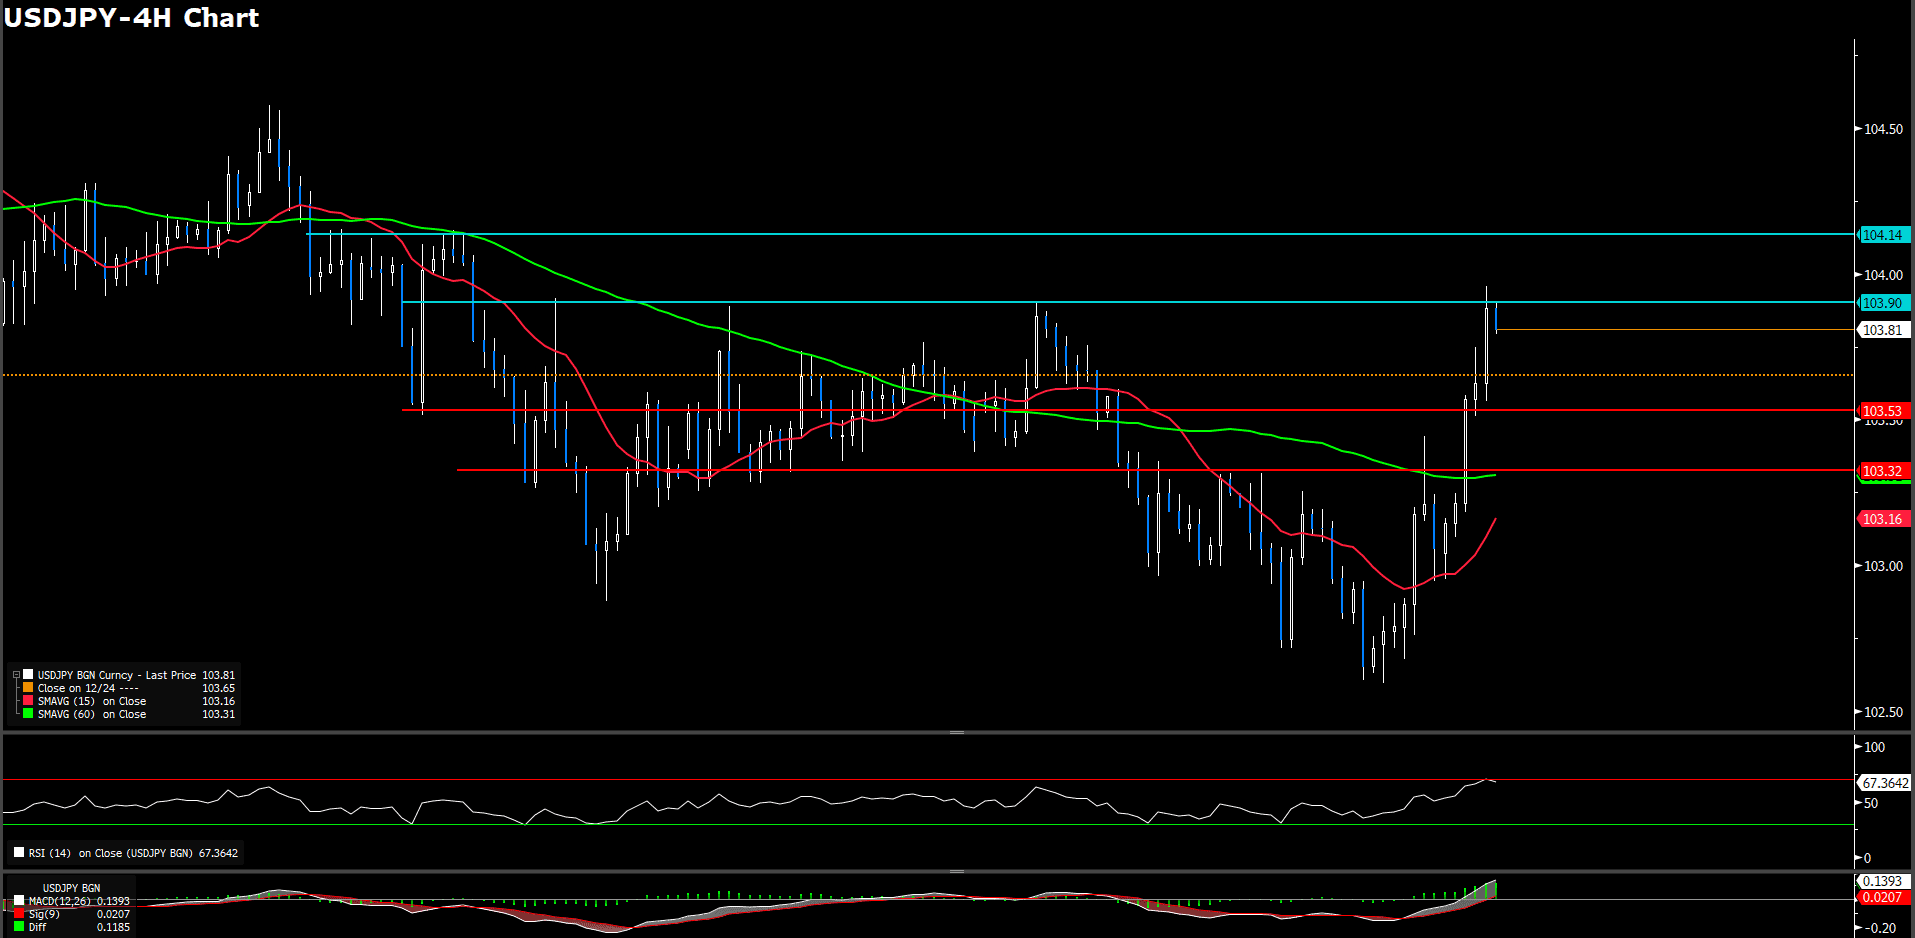
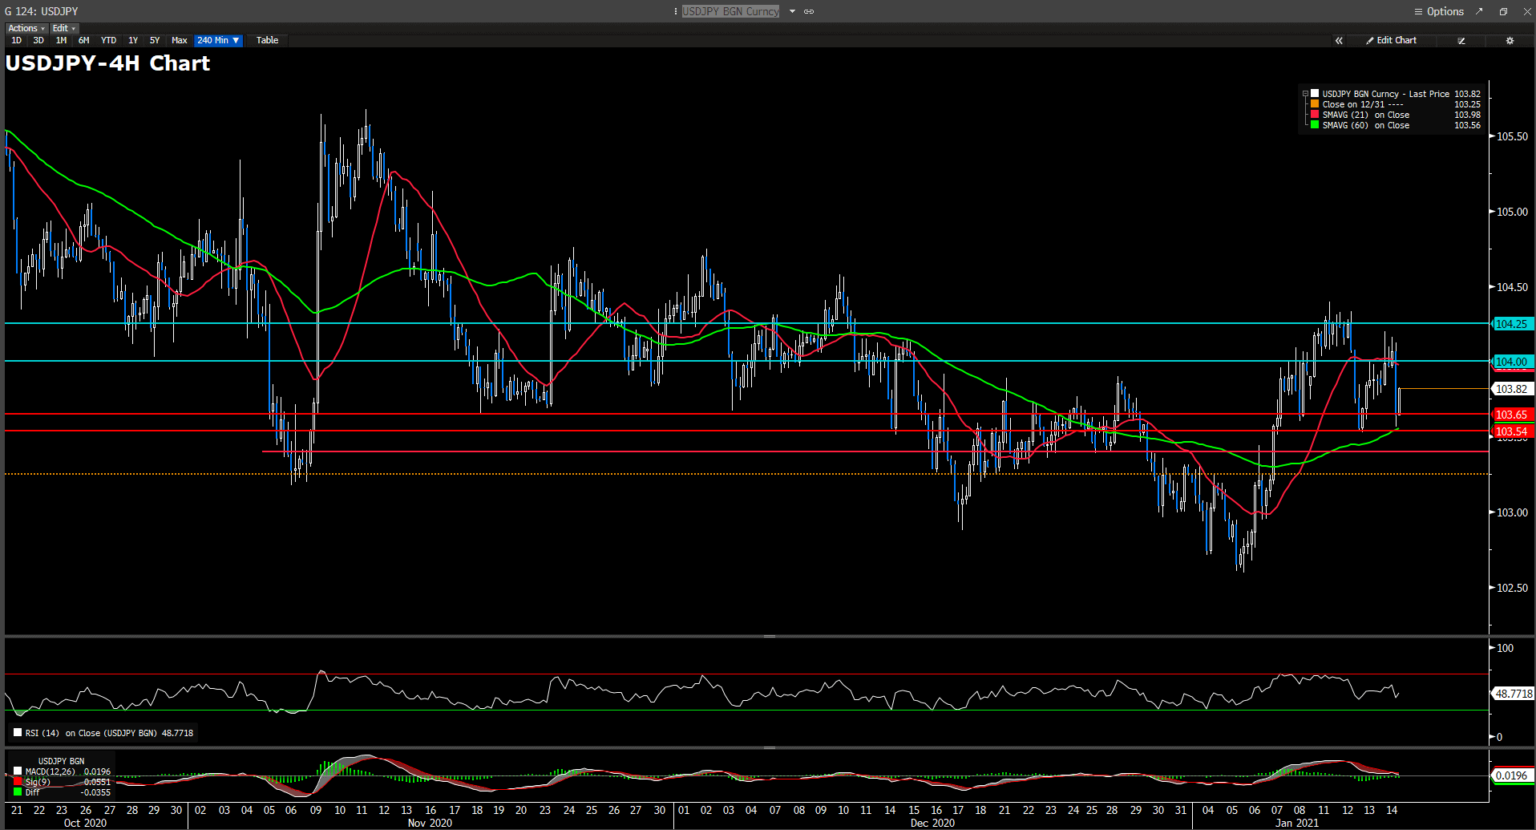
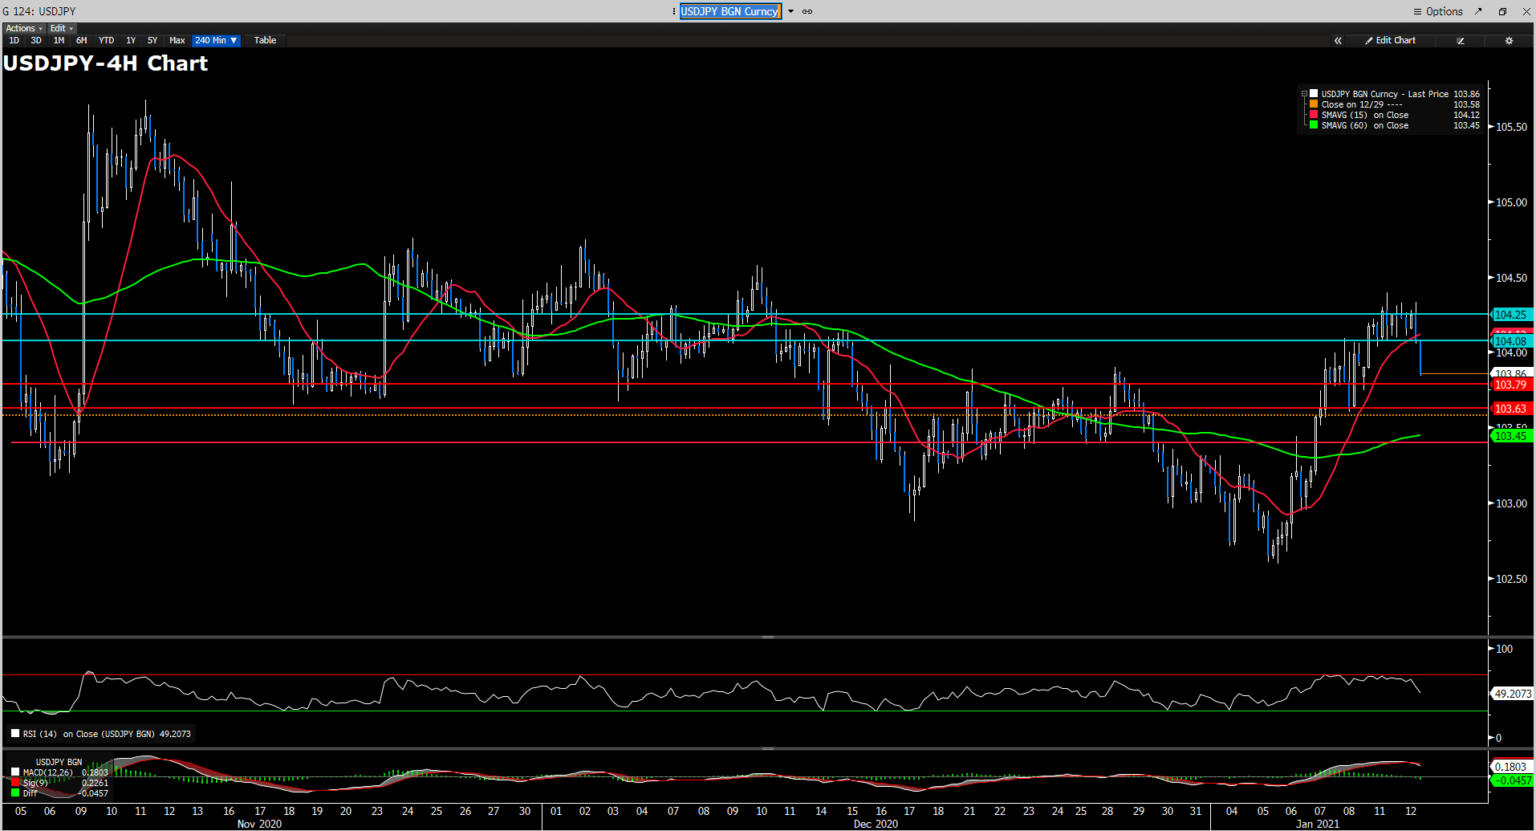
USD/JPY up marginally at 103.86 with pair whipsawed by cross-related selling and broad dollar buying; holds to narrow trading range of 103.62 to 103.90 as implied ease; finishes the week down less than 0.1%; EUR/JPY sinks as much as 0.6% to its lowest level in a month and a half.
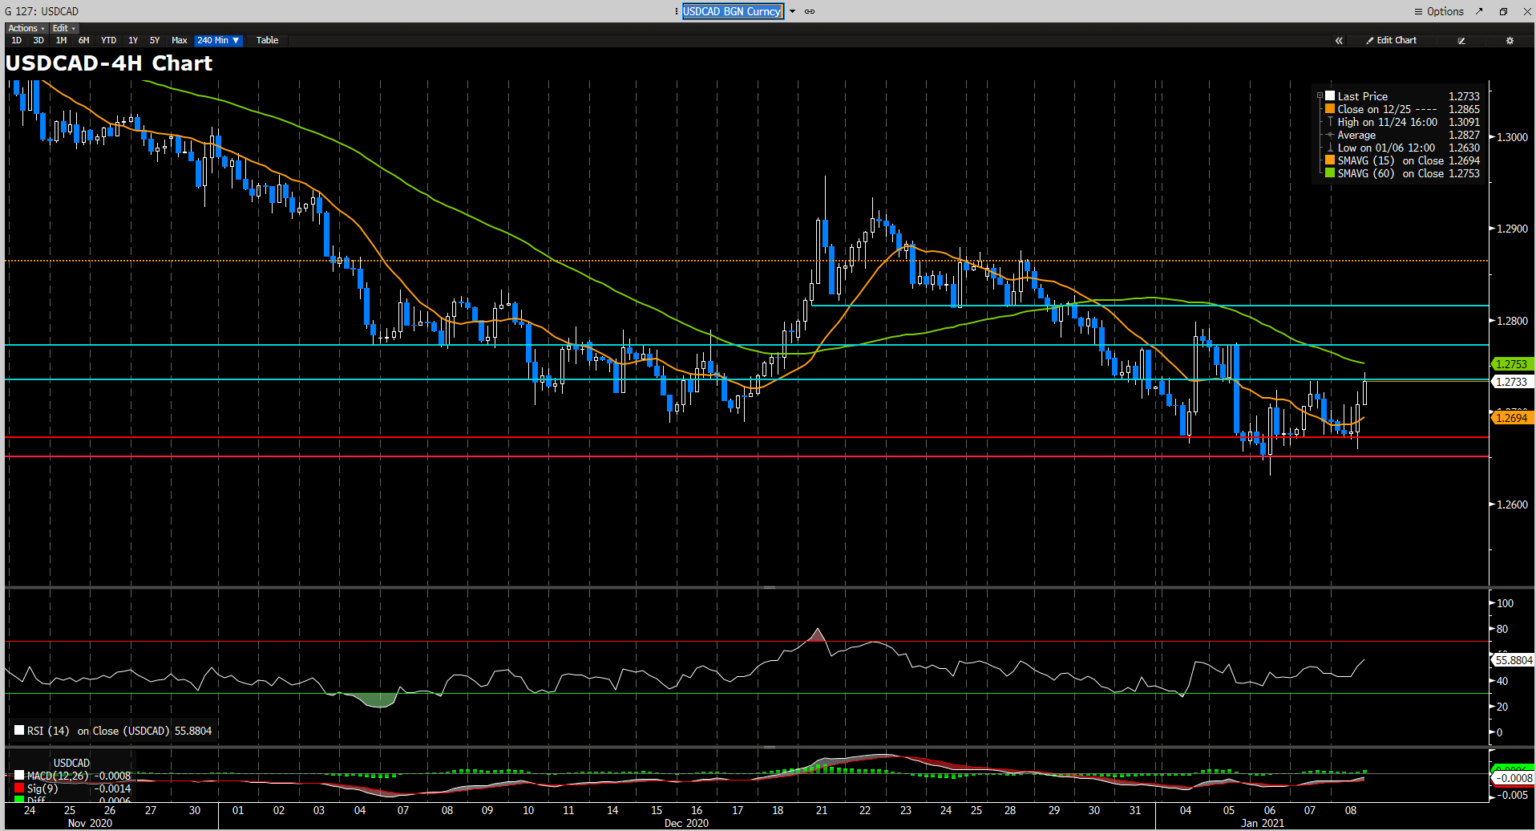
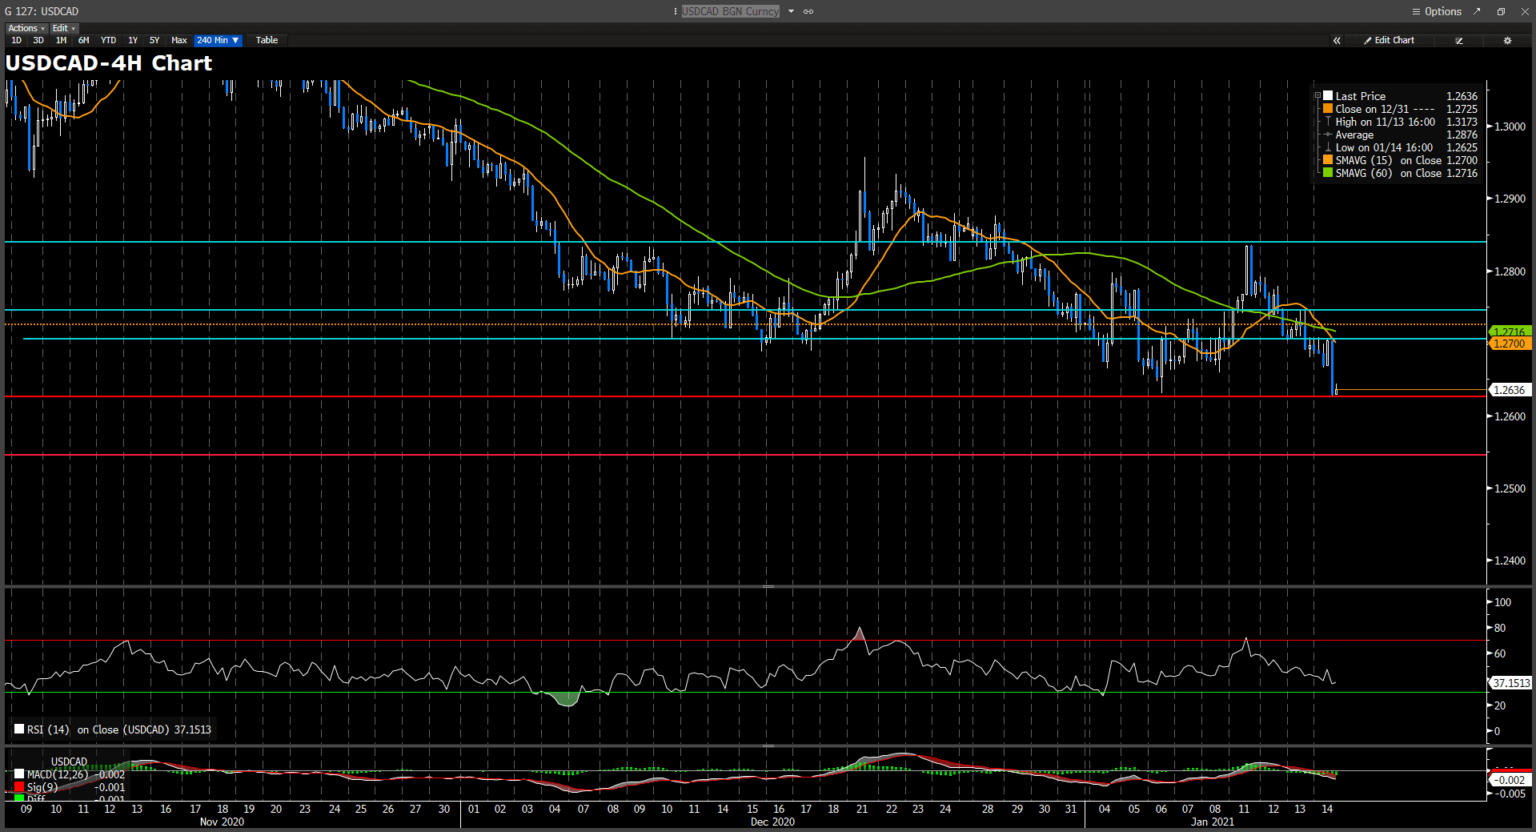
USD/CAD rises 0.7% to 1.2733 after climbing as much as 1% amid a drop in WTI oil prices; pair finishes up 0.3% on the week; 1-week implieds rose to 7.25% ahead of a Bank of Canada meeting next week.
Technical Analysis:
GBPUSD (4 Hour Chart)
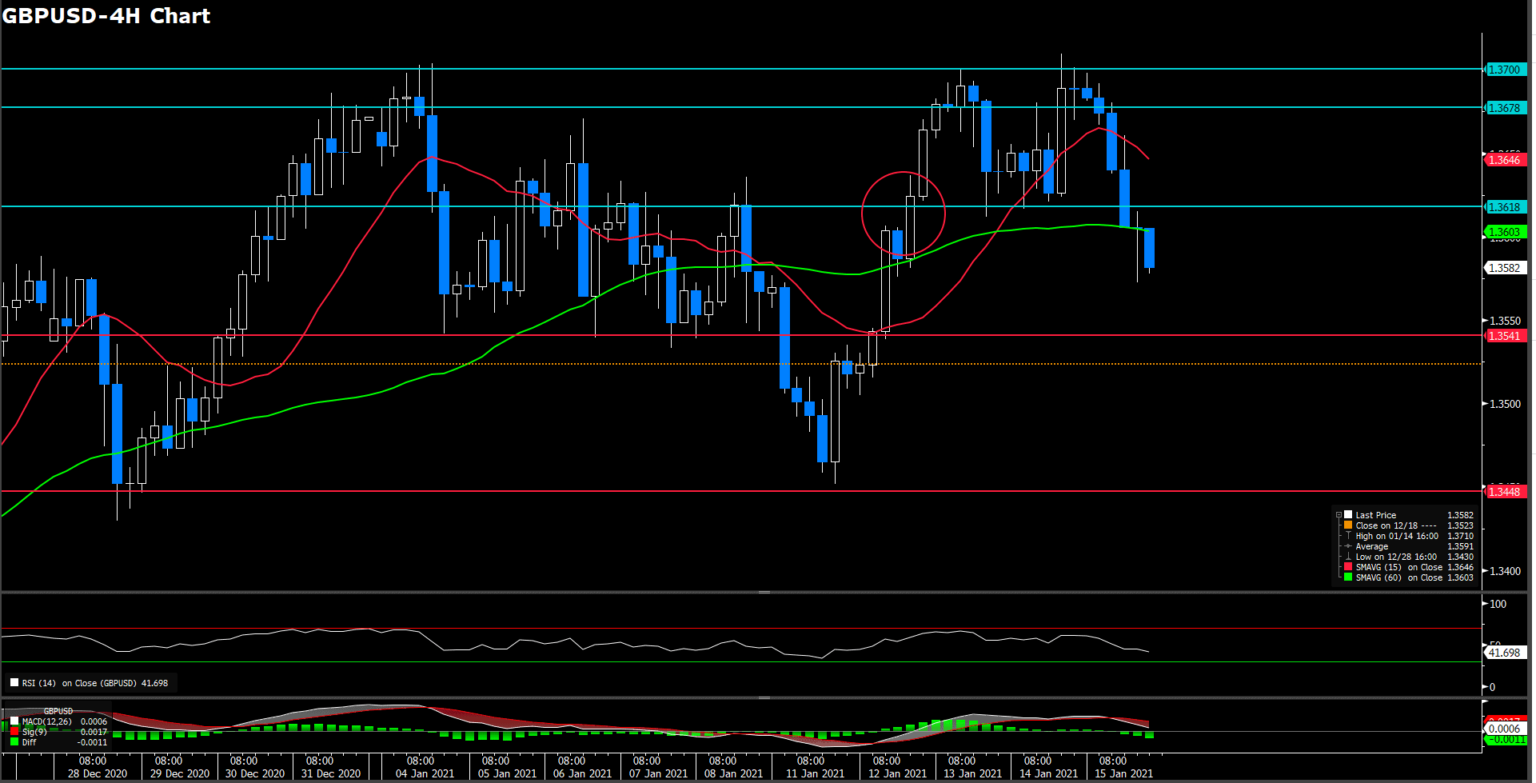
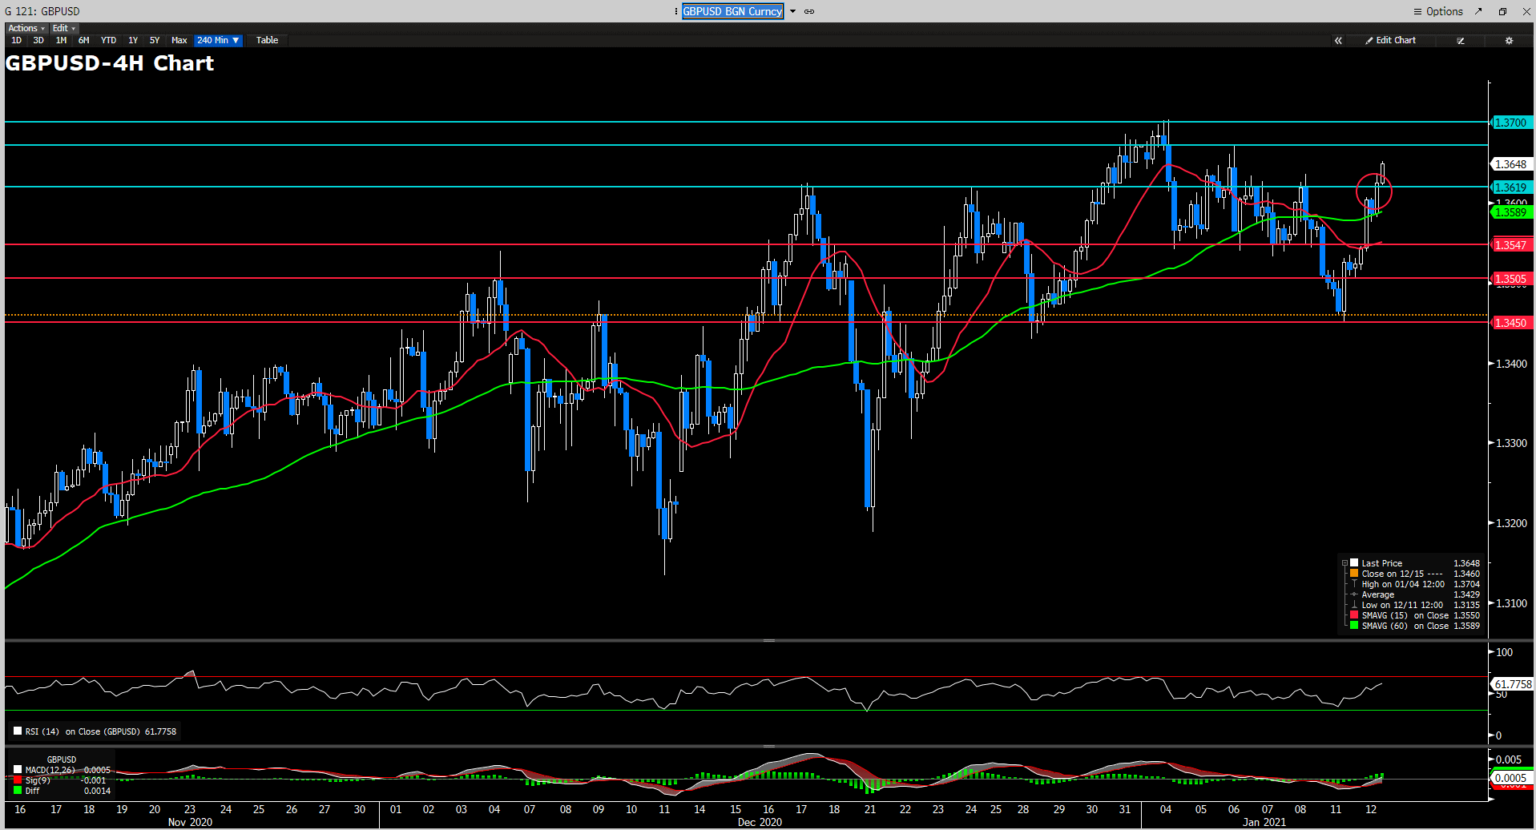
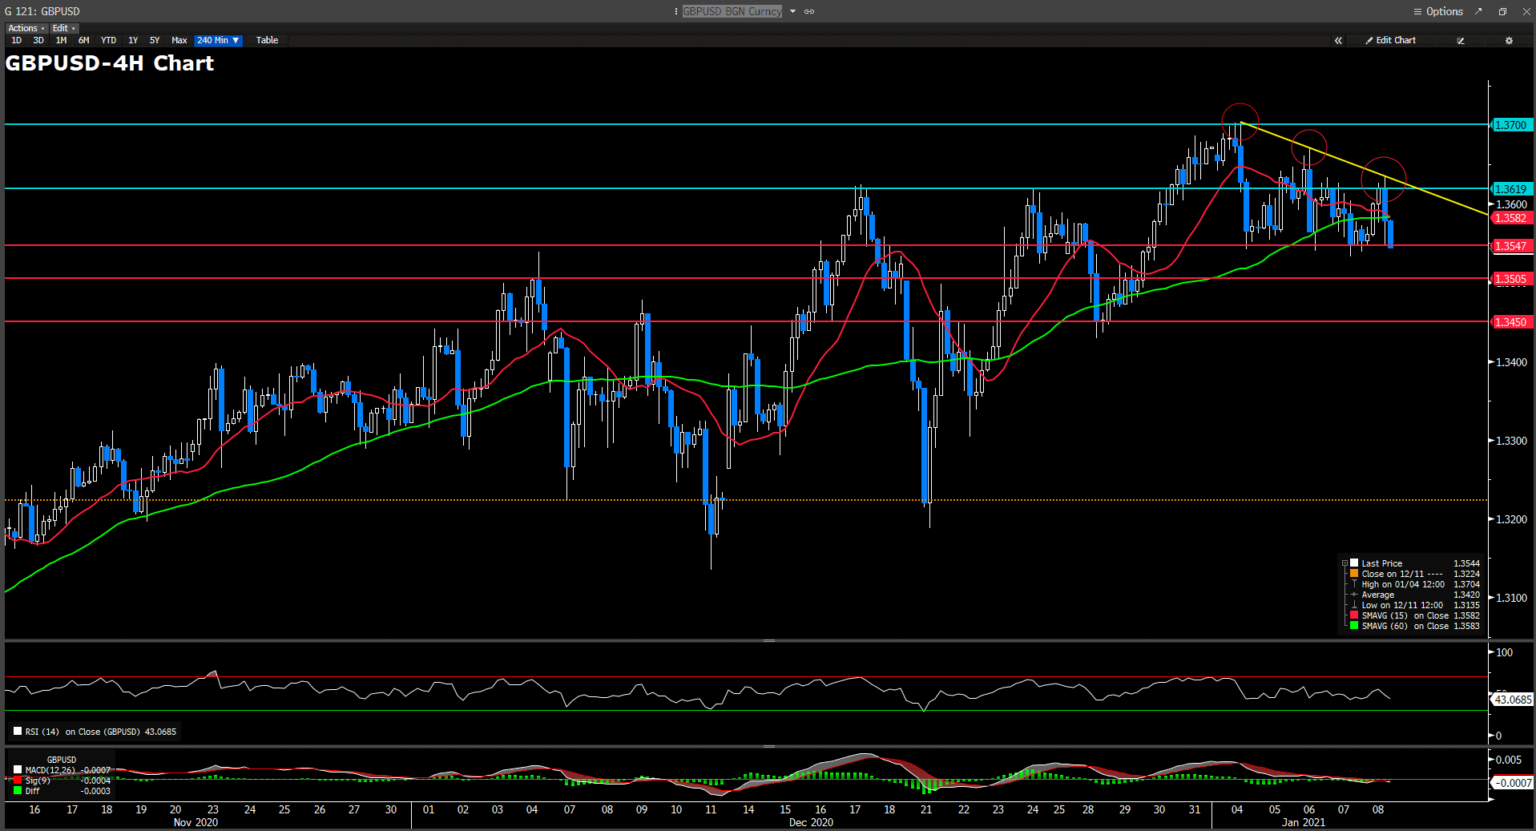
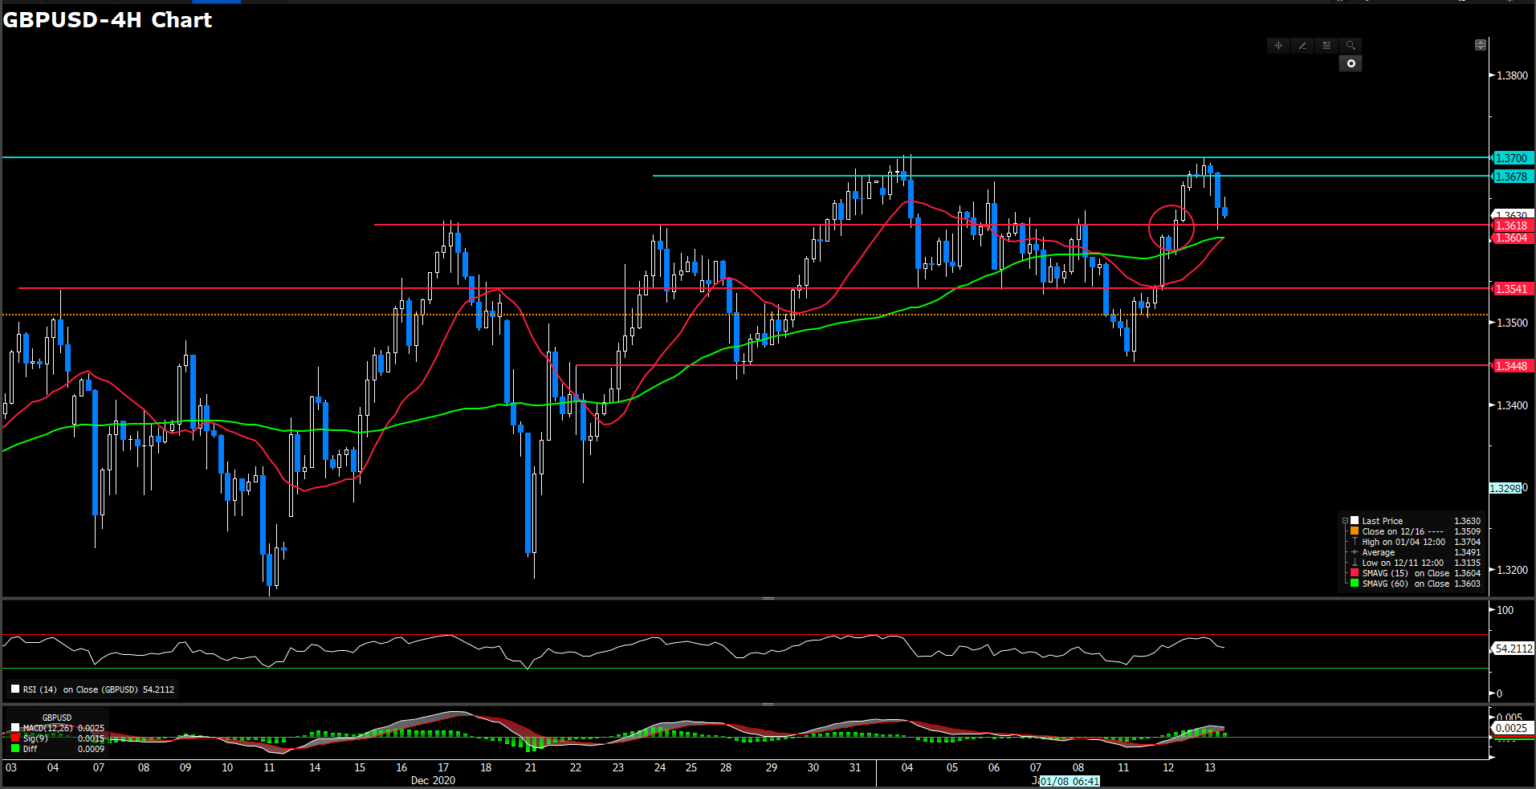
Sterling turn negative beneath 1.36 level from high at 1.37 amid dollar spur by risk sentiment, erasing a weekly gain. At the meantime, pair has also received tailwinds from a repricing of money market expectation for BoE negative interest rate policy (NIRP) in 2021 and beyond. For eco data, U.K. GDP(MoM) shrank 2.6% worse than last time after London lockdown second time. On the other hands, weaker-than-expectation Manufacturing Production record 0.7%.
From a technical perspective, short-term moving average indicator kick-start turn south side and long term moving average indicator slightly turn into downward. For RSI aspect, indicator slid beneath 50 slightly, set 43 as of writing, which suggesting a nascent bearish phenomenon. Due to aforementioned suggestion, we expect sterling will consolidate in range between first pivot support and resistance at 1.3618 and 1.354.
Resistance: 1.3618, 1.3678, 1.37
Support: 1.354, 1.3448
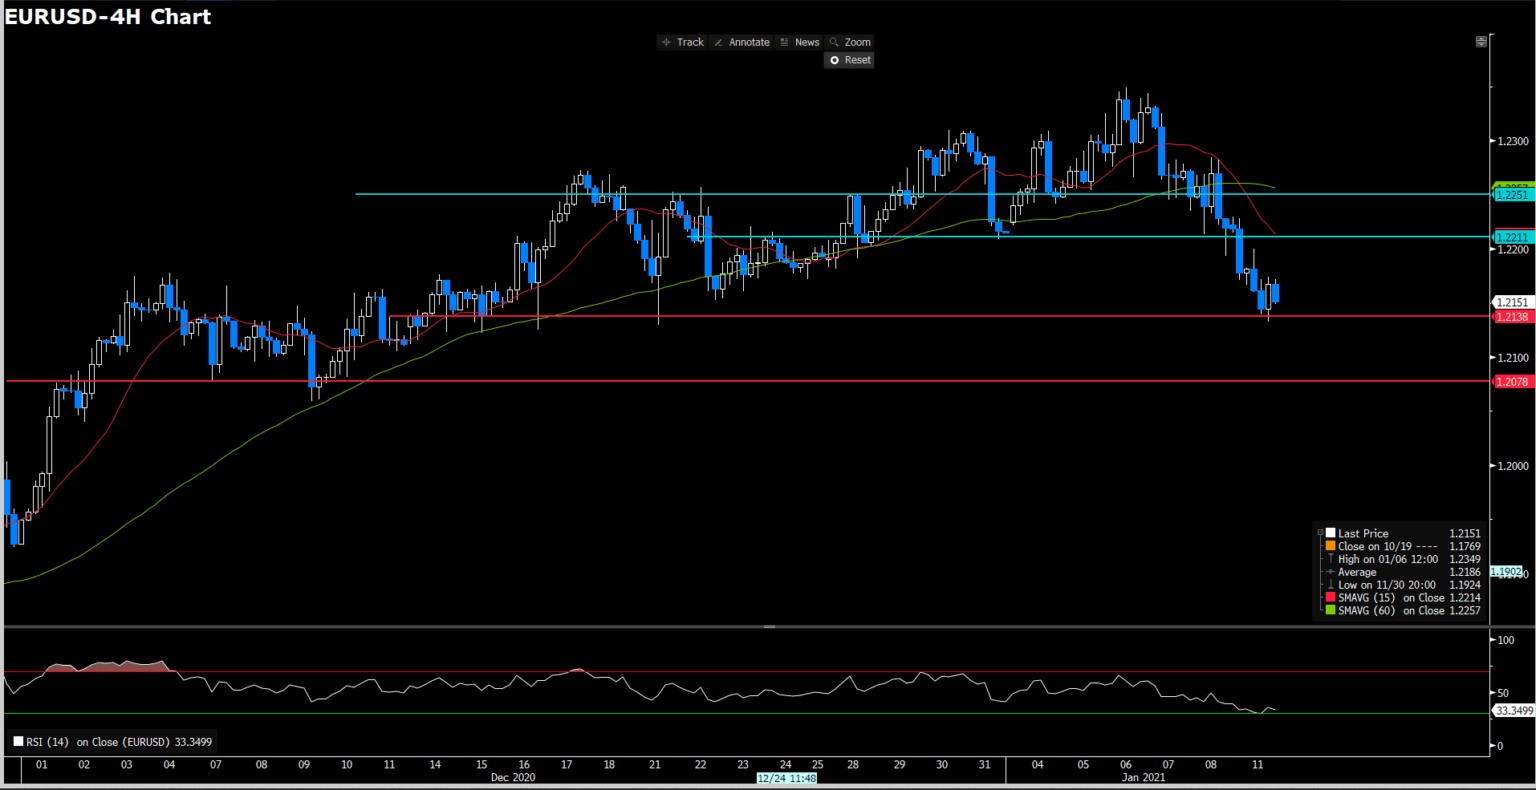
EURUSD 4 Hour Chart)
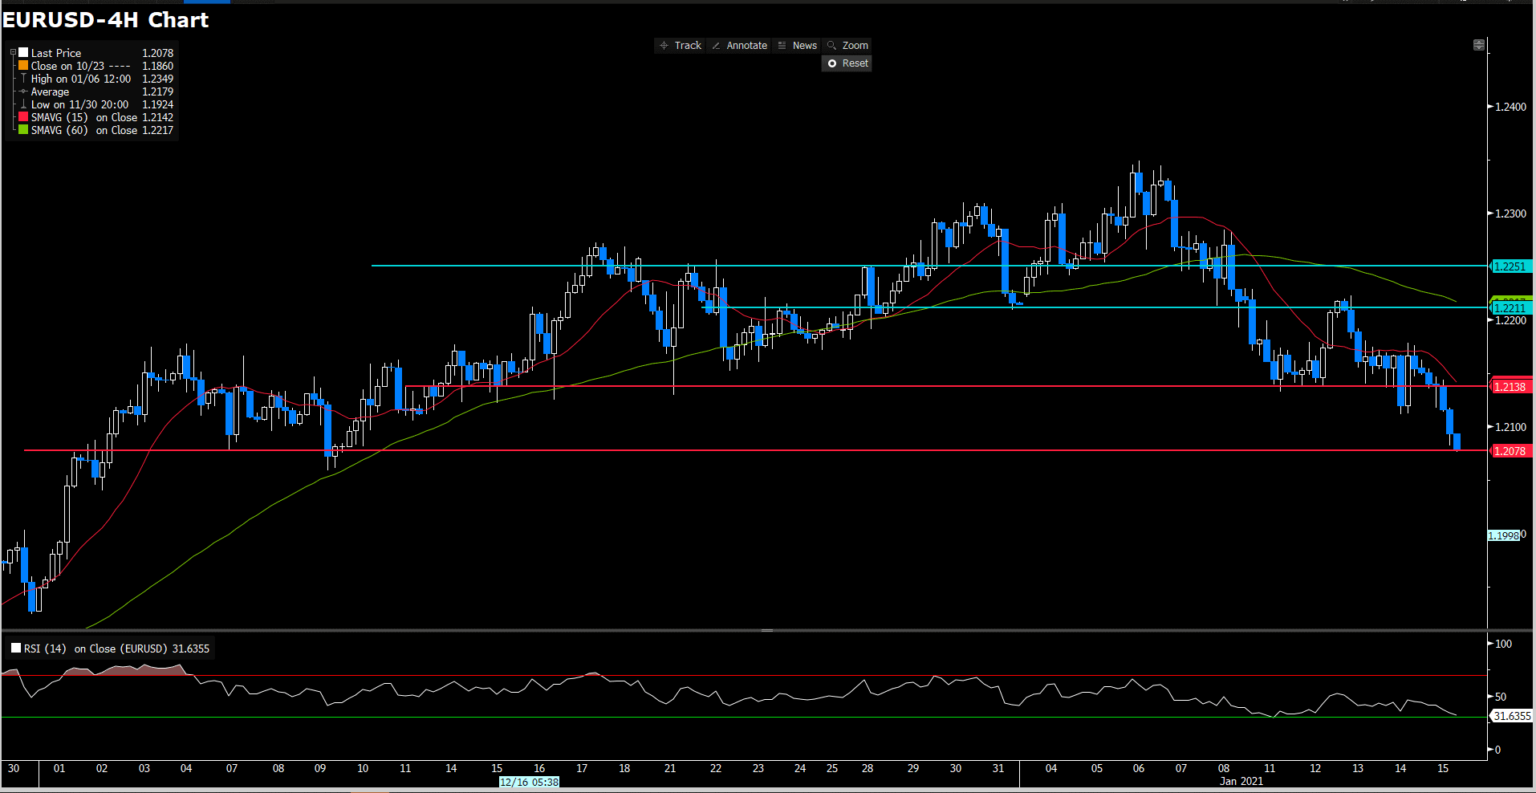
Euro dollars extend downside momentum to nearly one month low at 1.2078 as of writing, amid dollar posting one of its biggest increase since the early days of pandemic. ECB warning the fully effect of the pandemic crisis on euro-area banks has yet to be felt as policy support so far has masked losses, several ECB officials noted. “Euro-area banks are likely to face significant losses and further pressure on their already weak profitability prospect and must be extremely prudent on issuing dividends and ensure their capital is able to absorb their losses”, Irish governor said.
For price action aspect, it’s clearly that euro has tamp down a month-long “double top pattern” after breakthrough right shoulder at 1.2138. For Moving Average aspect, short term indicator consecutive downward slope, long term one as well. For RSI perspective, indicator showed 32 figure and close to over sought zone, suggestion a bearish side.
We could not preclude that euro dollar extended losses scenario combing all suggestion above. However, we still expect 1.2078 would be a critical support for price pattern, If not, the following second pivot support at 1.1995.
Resistance: 1.2138, 1.2211, 1.2251
Support: 1.2078, 1.1195
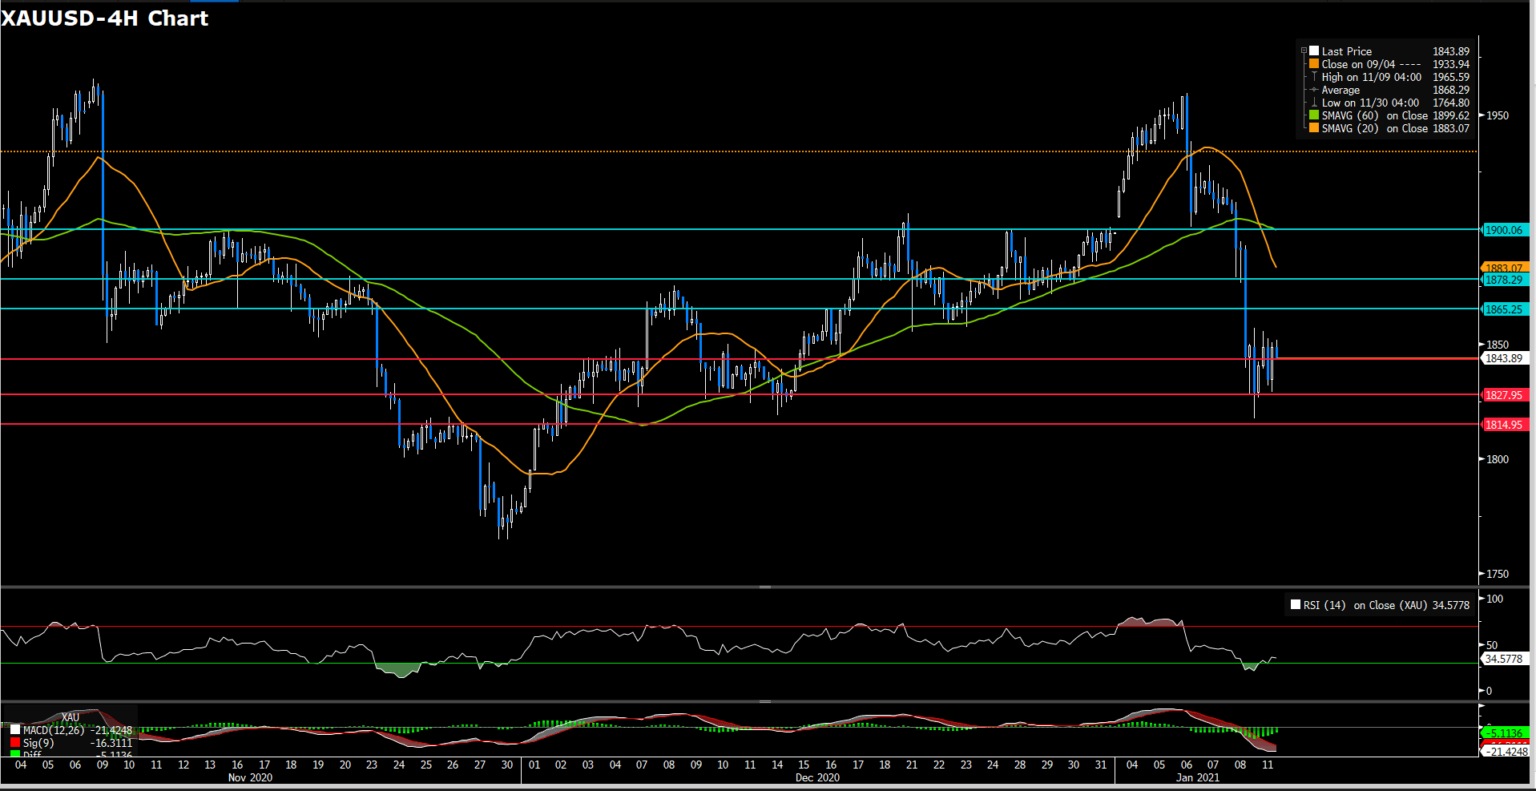
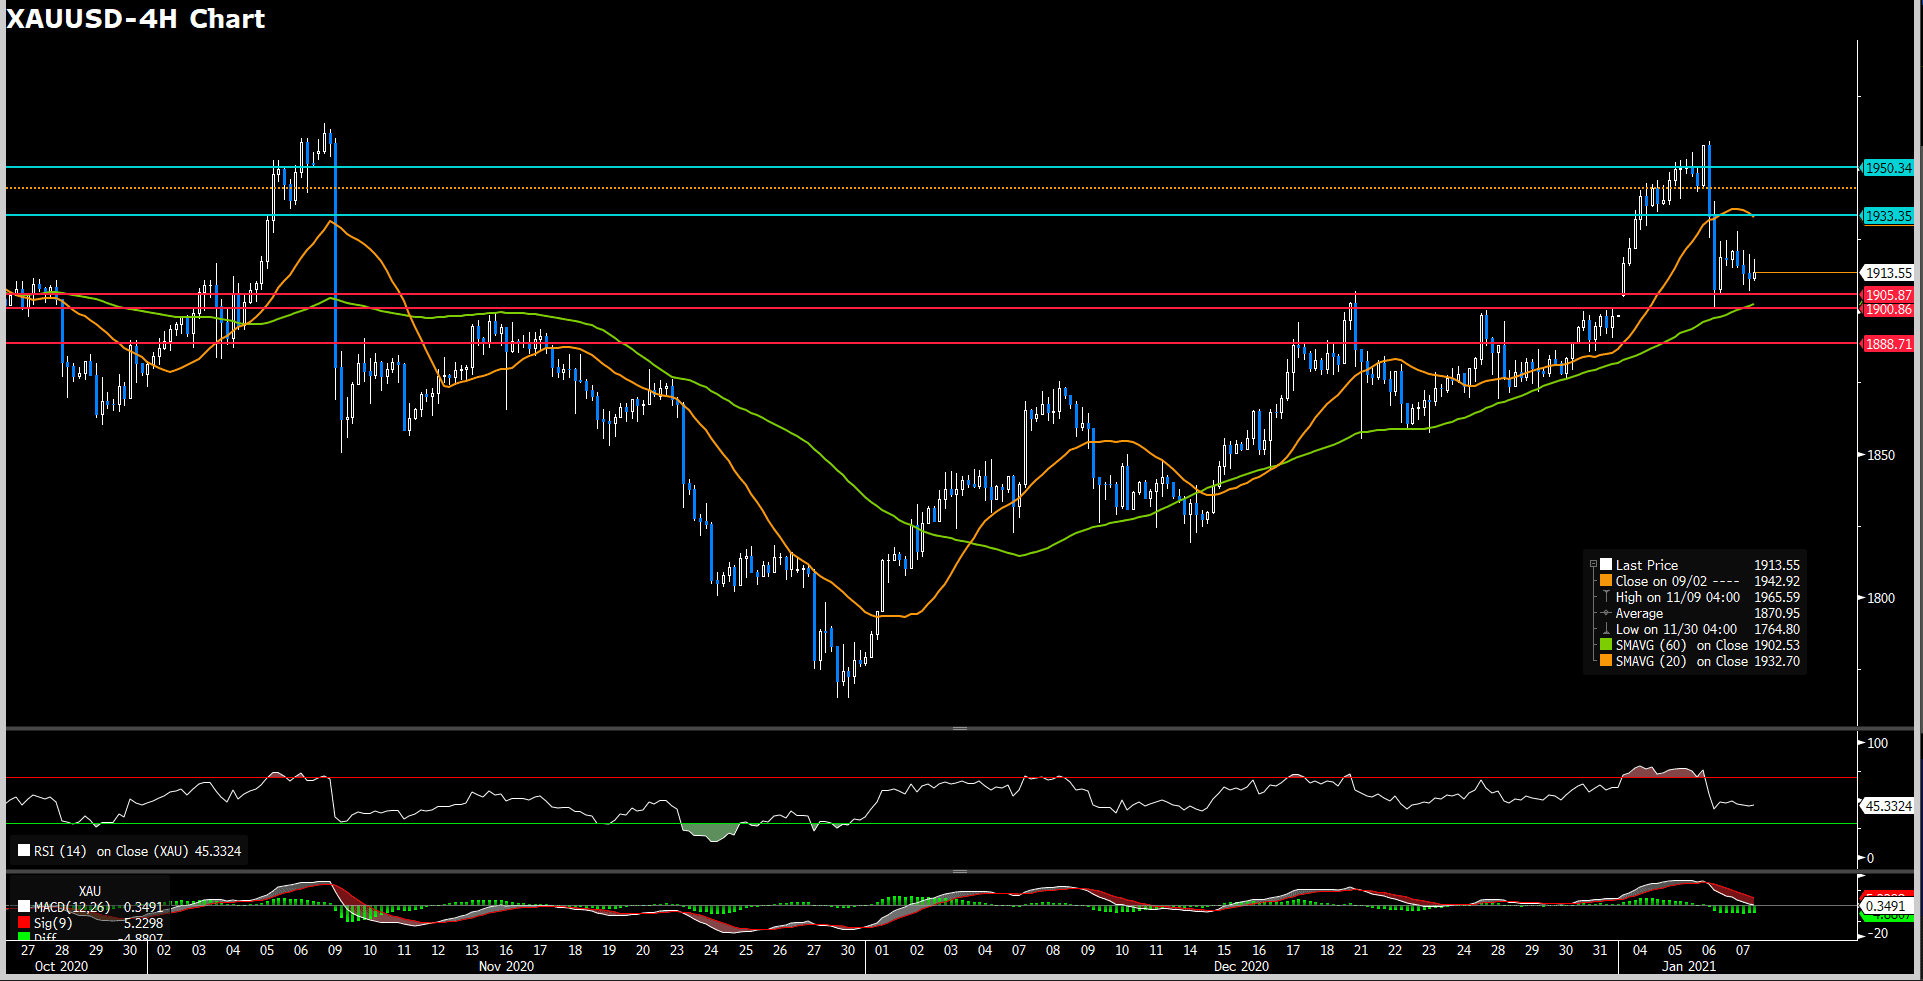
XAUUSD (4 Hour Chart)
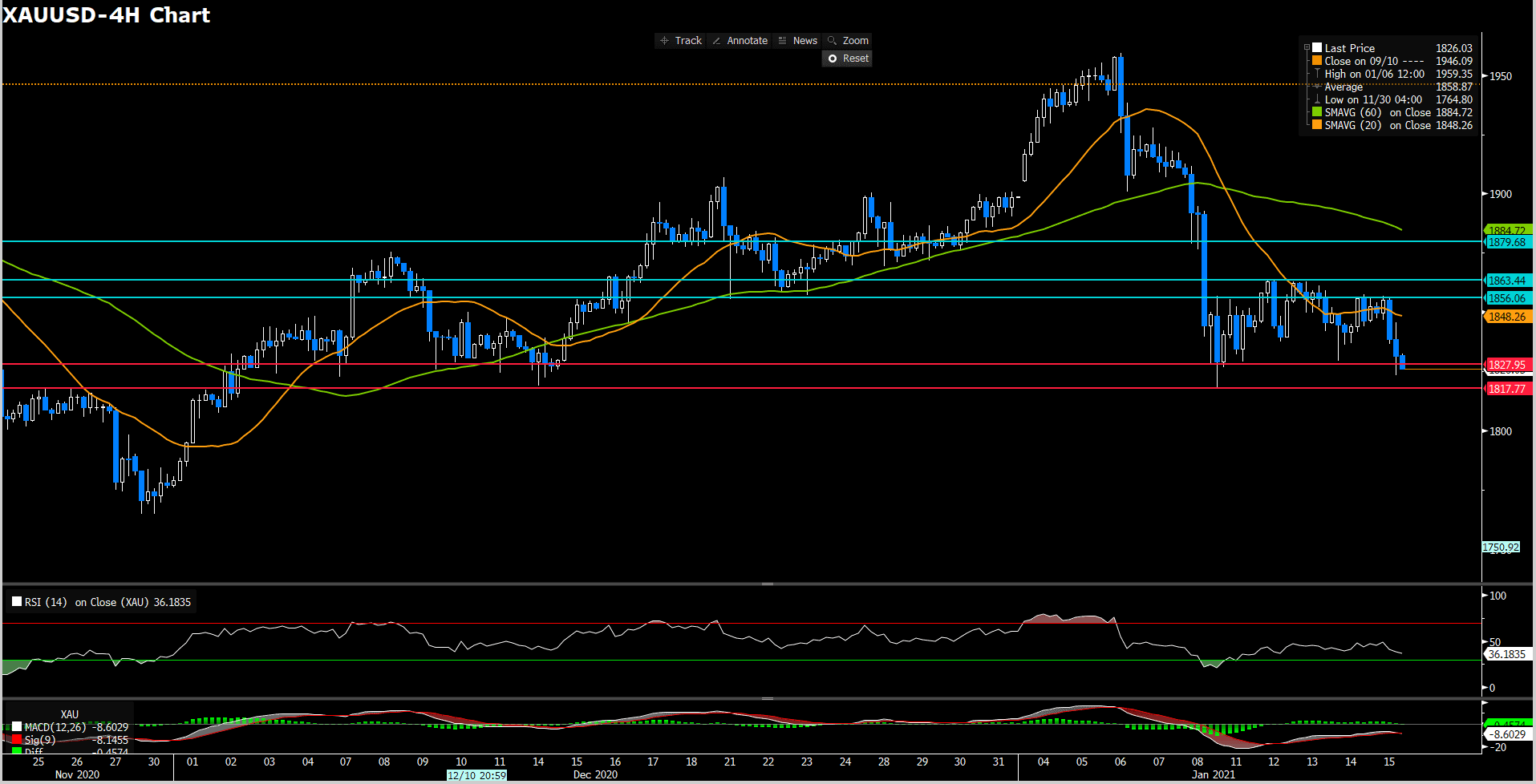
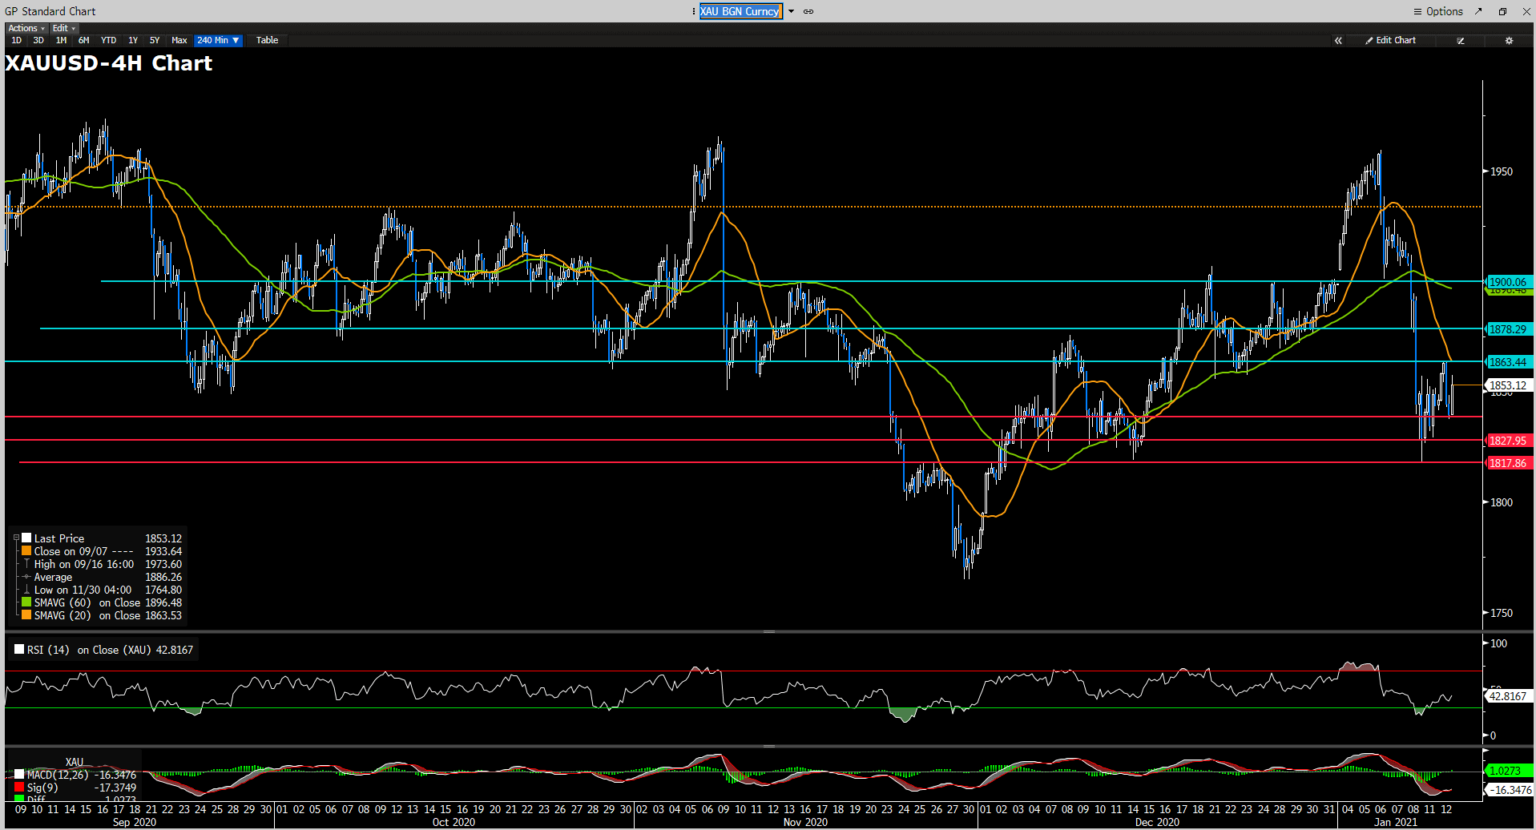
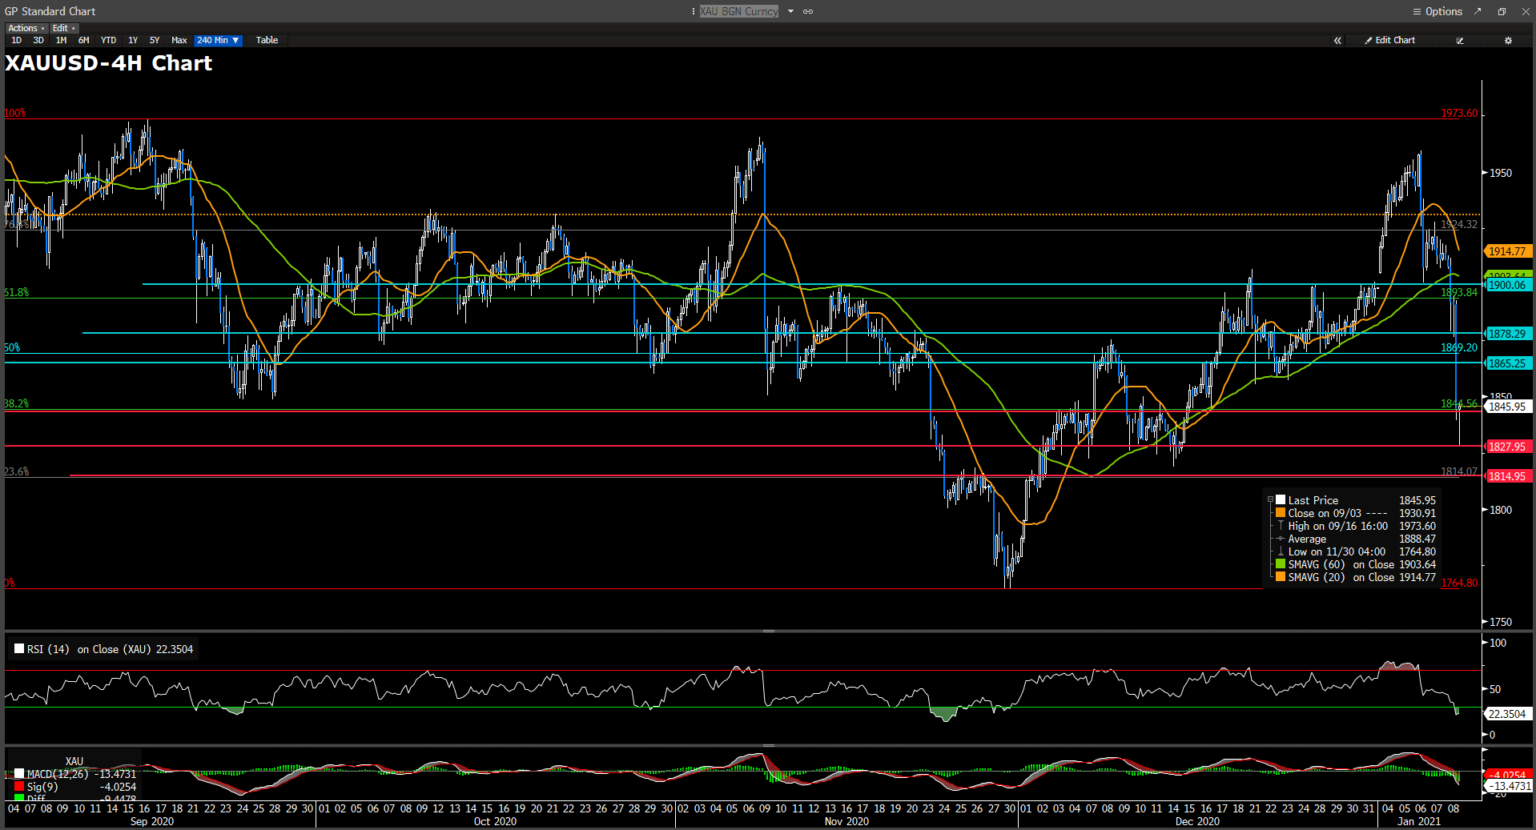
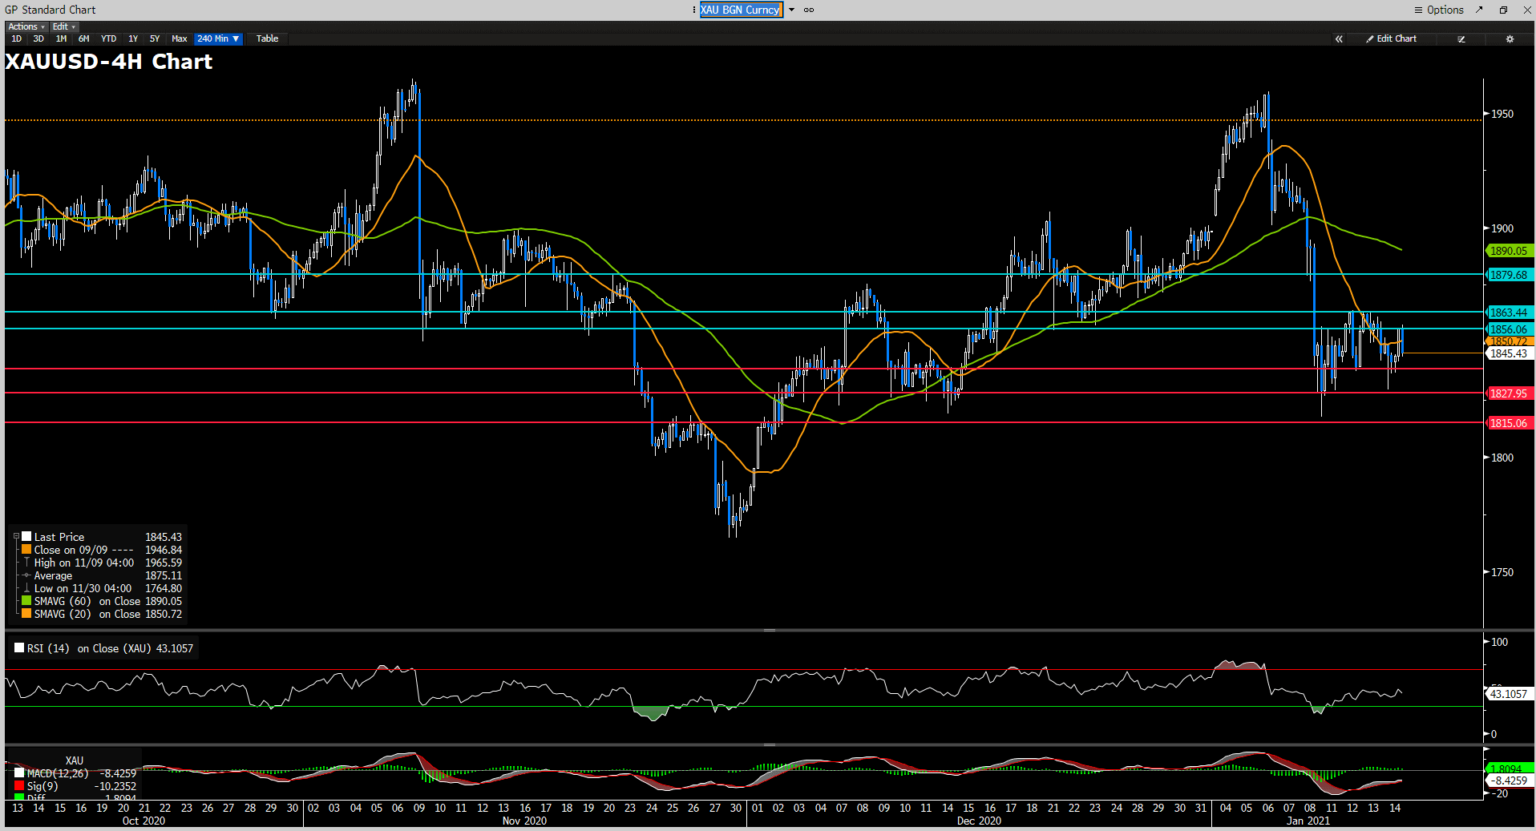
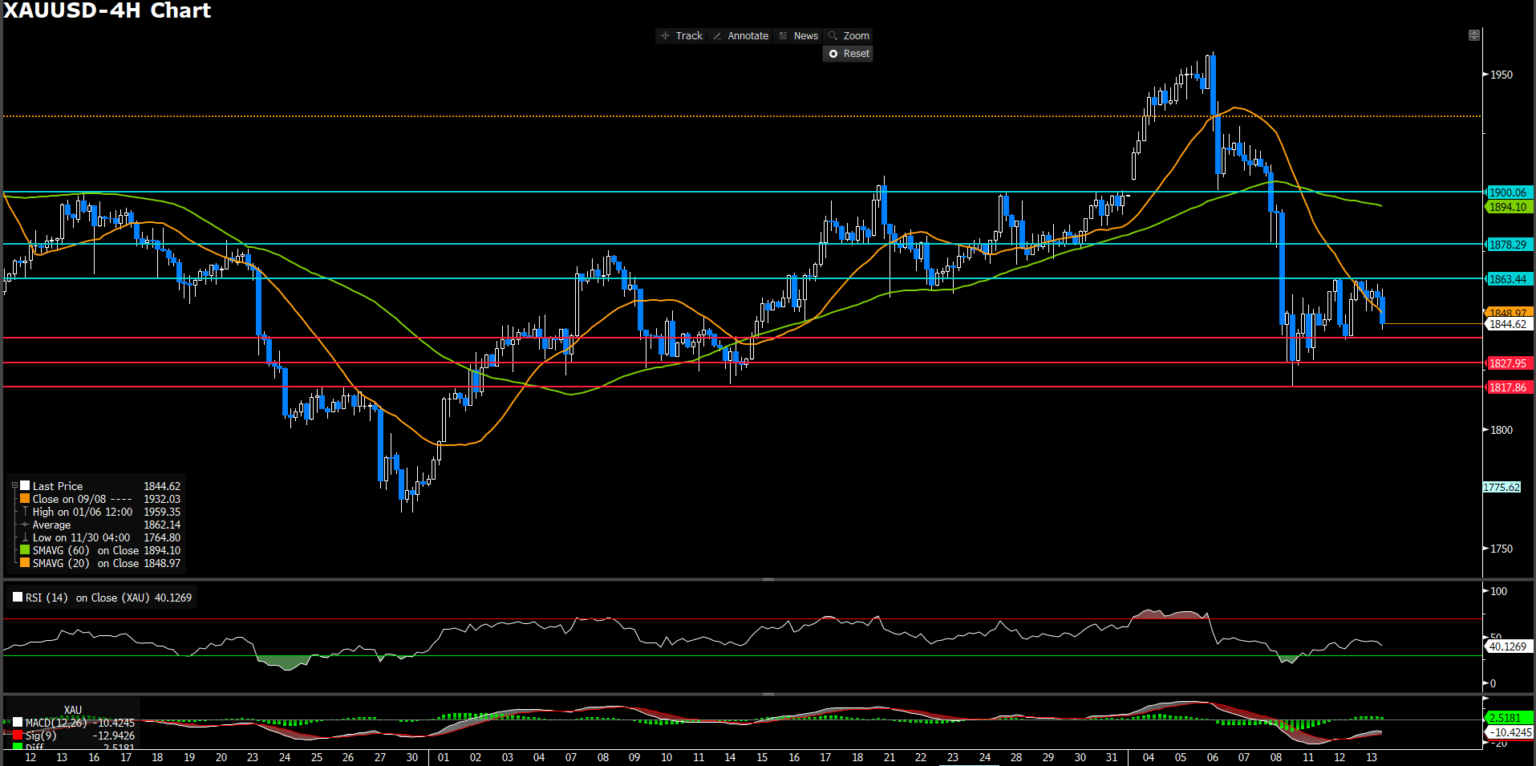
After moved in a tiny gain yesterday, gold had difficultly extended retracement momentum amid lack of event and greenback soared up intraday. Gold continuously slid intraday to 1827.95 which is critical support level, as of writing.
From a technical perspective, gold is still on the way of bearish trend as 15-SMAVG consecutive upwind after it had slightly flat position. Meanwhile, 60-SMAVG indicator remained it descend trend momentum as bias is getting wide. On the other hands, RSI indicator is moving sideway below 50, set 37 girds, suggesting bearish further for short term a least.
We expect that 1817.77 would become a powerful support which is Jan 11 low and shoulder of W shape reverse pattern. Therefore, we believe the tamp down market will get limit while it approach first pivot support. However, if any fundamentally driver drag market down again, last lowest point in 1767 would foreseeable ahead.
Resistance: 1856, 1863, 1879
Support: 1827, 1815
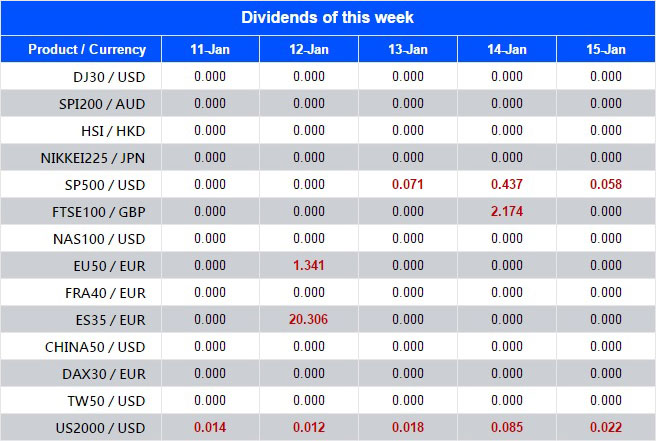
Economic Data
Click here to view today’s important economic data.

 Gold had choppy movement all day between first pivot support and resistance after retreated from last recently low. At the meantime, U.S. 10 years Treasuries yield had a 2-day consecutive slipped which gave gold market a coup for short period. Market participant is looking on bond market of negative correlation that might undermine of gold captive whilst yields creepy up.