Daily Market Analysis
Market Focus
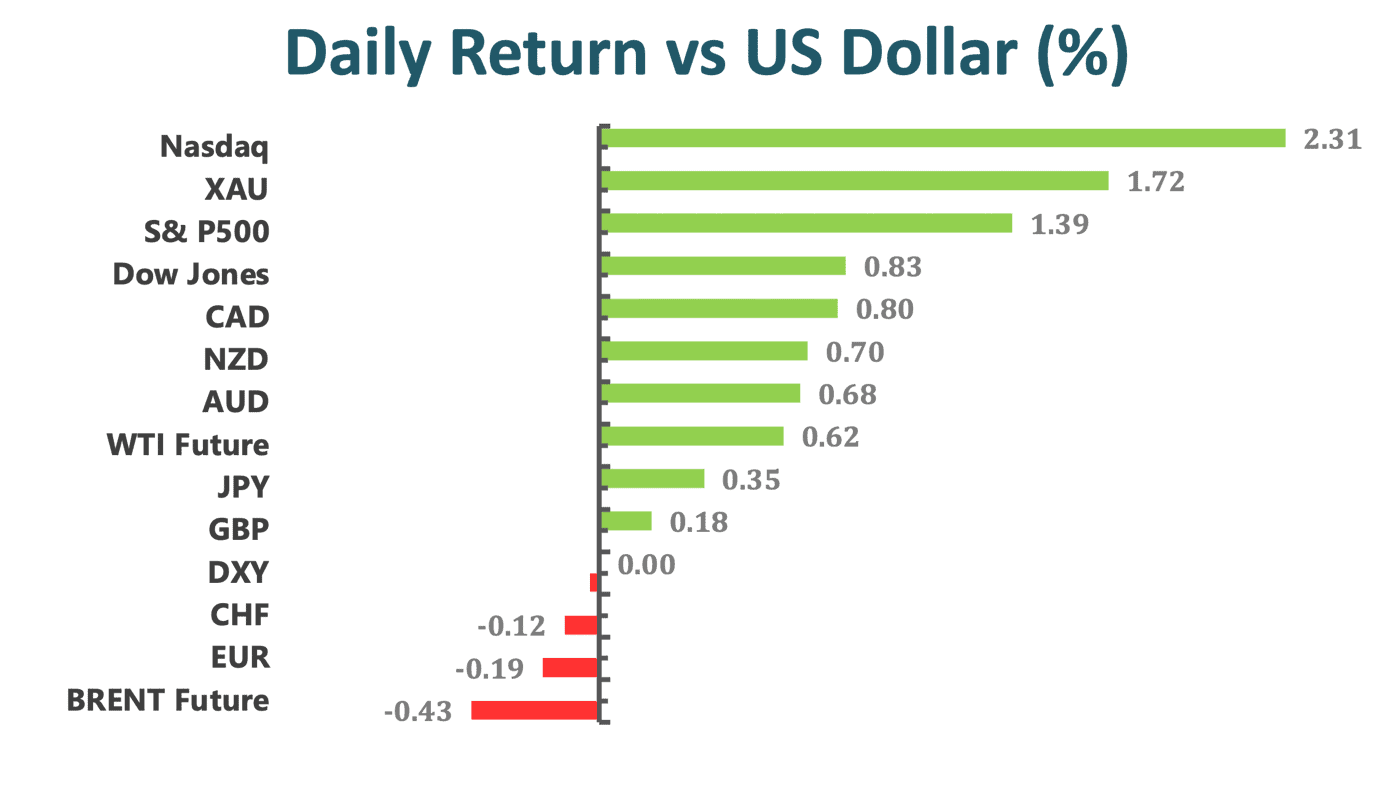
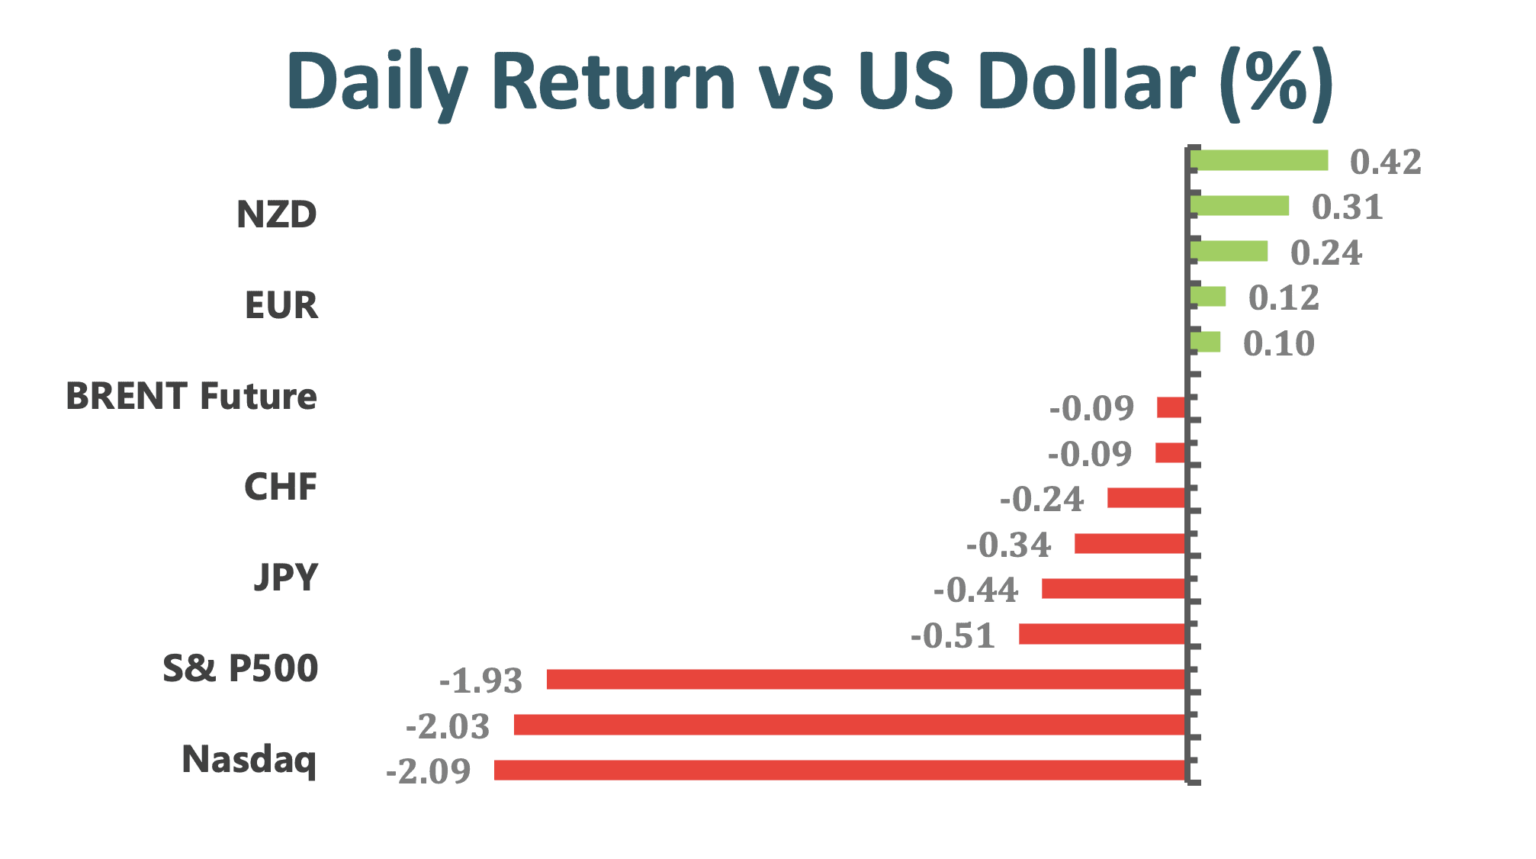
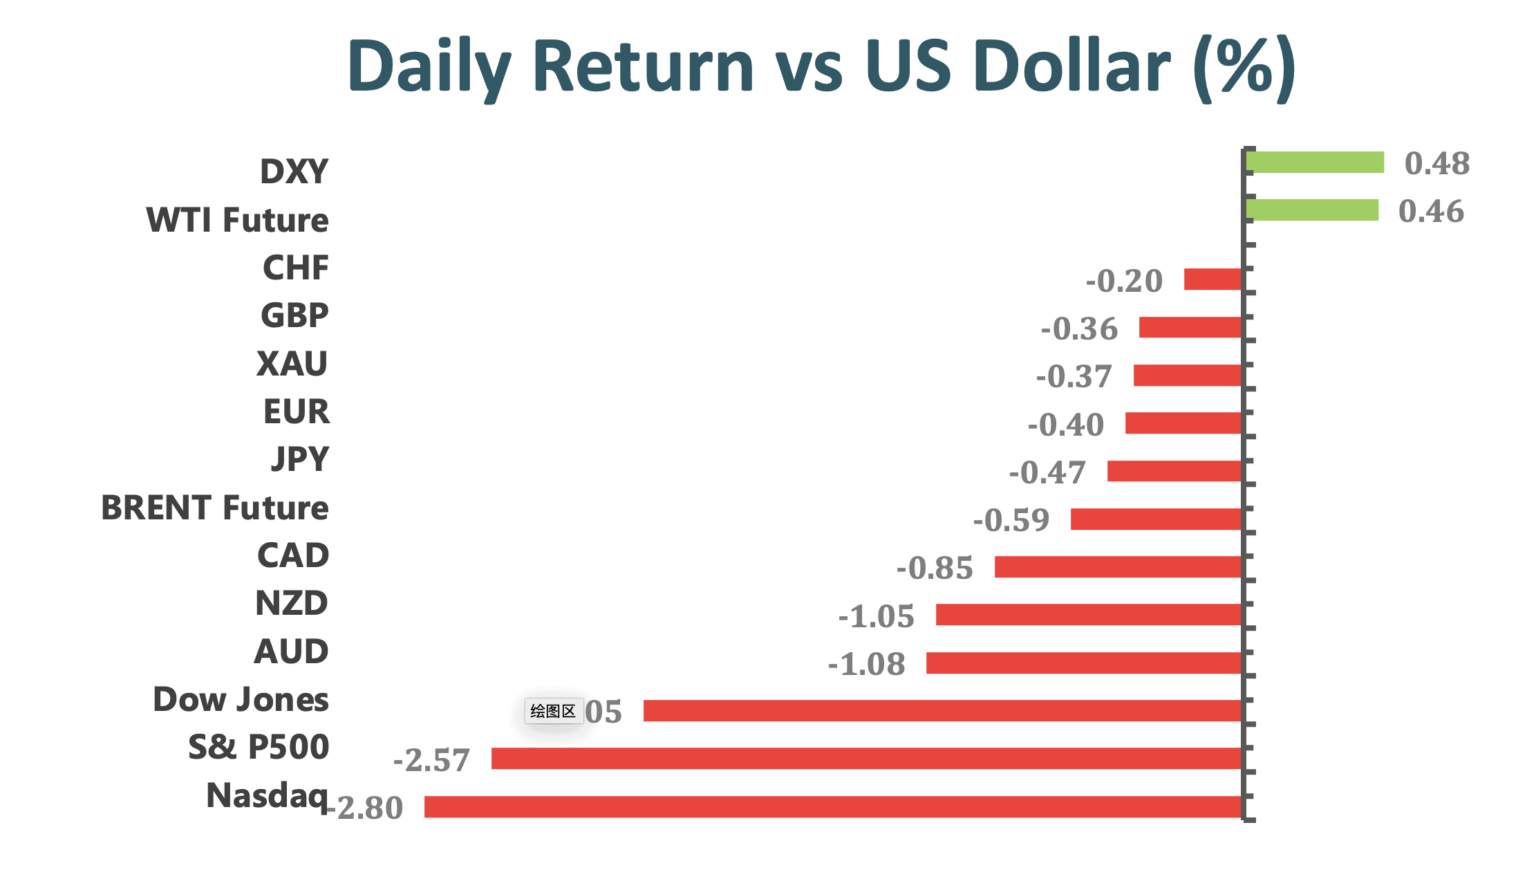
Global equities slumped in a broad retreat that extended across industries amid lingering concerns that retail trading was creating havoc and as traders mulled an uncertain outlook for deploying coronavirus vaccines. Treasury yields rose.
The S&P 500 Index fell almost 2%, turning negative for the year and posting its biggest weekly decline in three months as day traders’ bids for heavily shorted stocks fueled speculation hedge funds would need to reduce their market exposure. GameStop corp. and AMC Entertainment Holdings Inc. soared in a return of volatility for stocks popular in internet chat room as brokerages said they would start to ease trading restrictions imposed after wild swings this week.
Global stocks also fell the most since late October, partly on the turmoil caused by hordes of day traders hatching stock bets that roiled hedge funds and strained trading platforms. Meanwhile, investors were left to ponder the outlook for the pandemic as Johnson & Johnson said its one-shot vaccine generated strong protection against Covid-19, though it was less effective against the South Africa variant. The European Union escalated the fight over vaccine supplies with an emergency plan to restrict exports.
According to Carsten Brzeski, global head of macro at ING Group, “Extended and stricter lockdowns do not bode well for the economy. Demand from China could also weaken on the back of lockdowns.”
Market Wrap
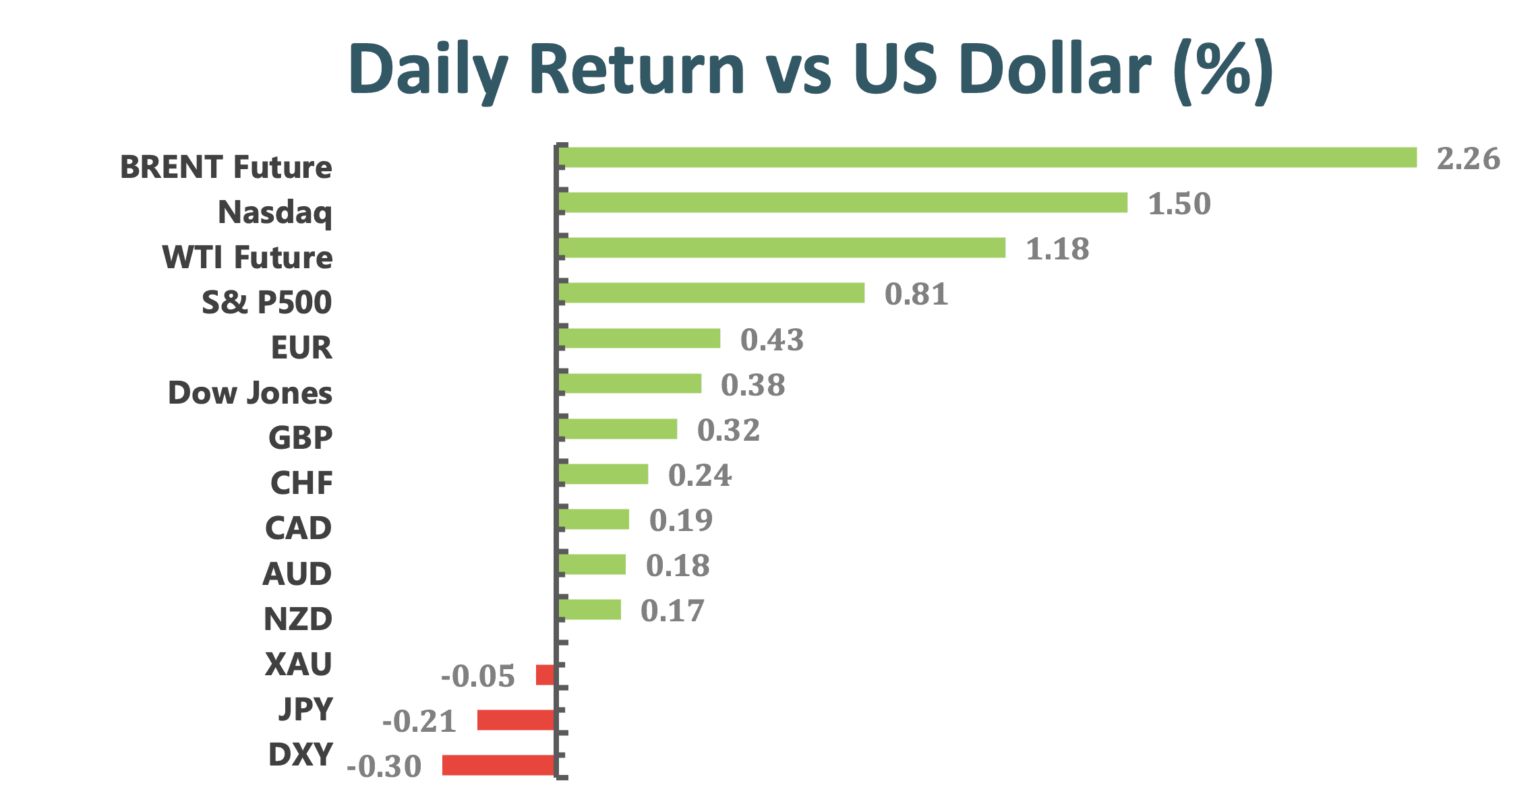
Main Pairs Movement
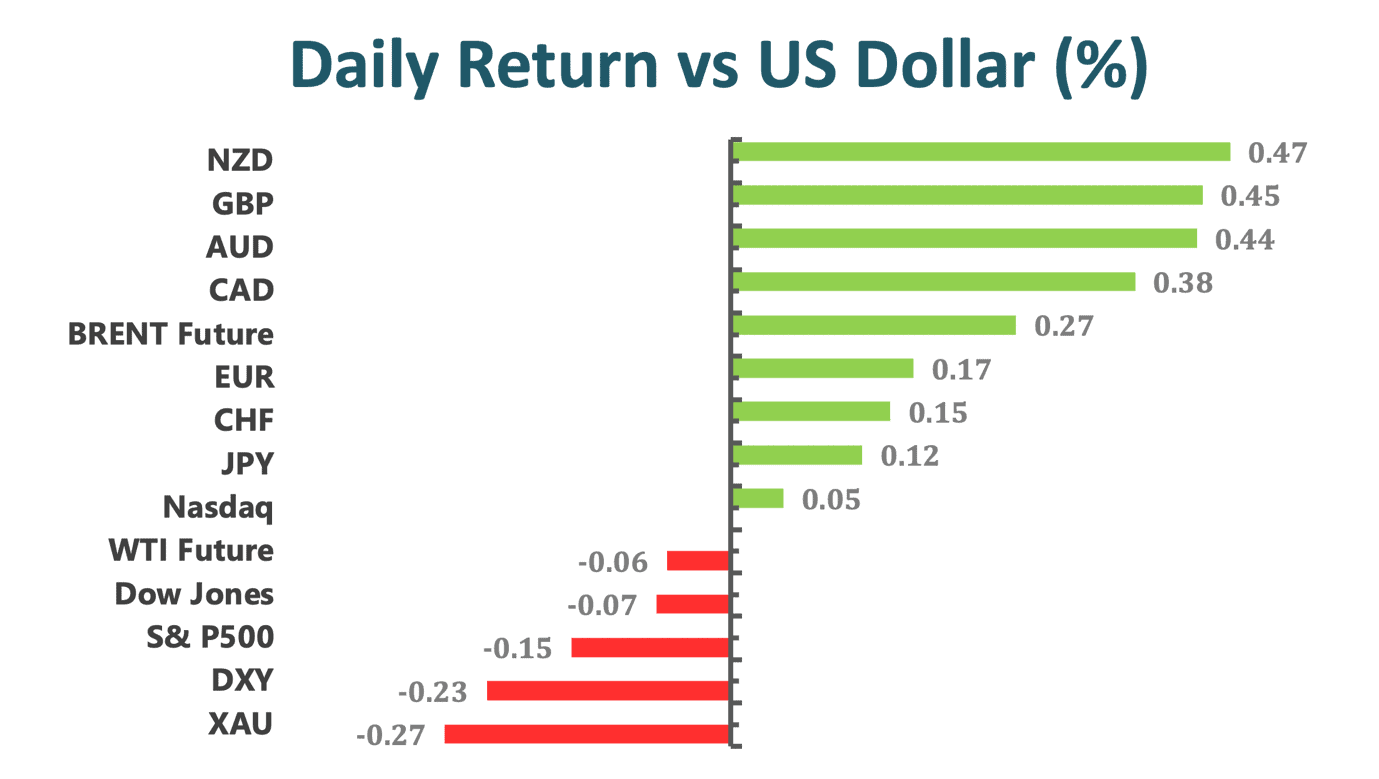
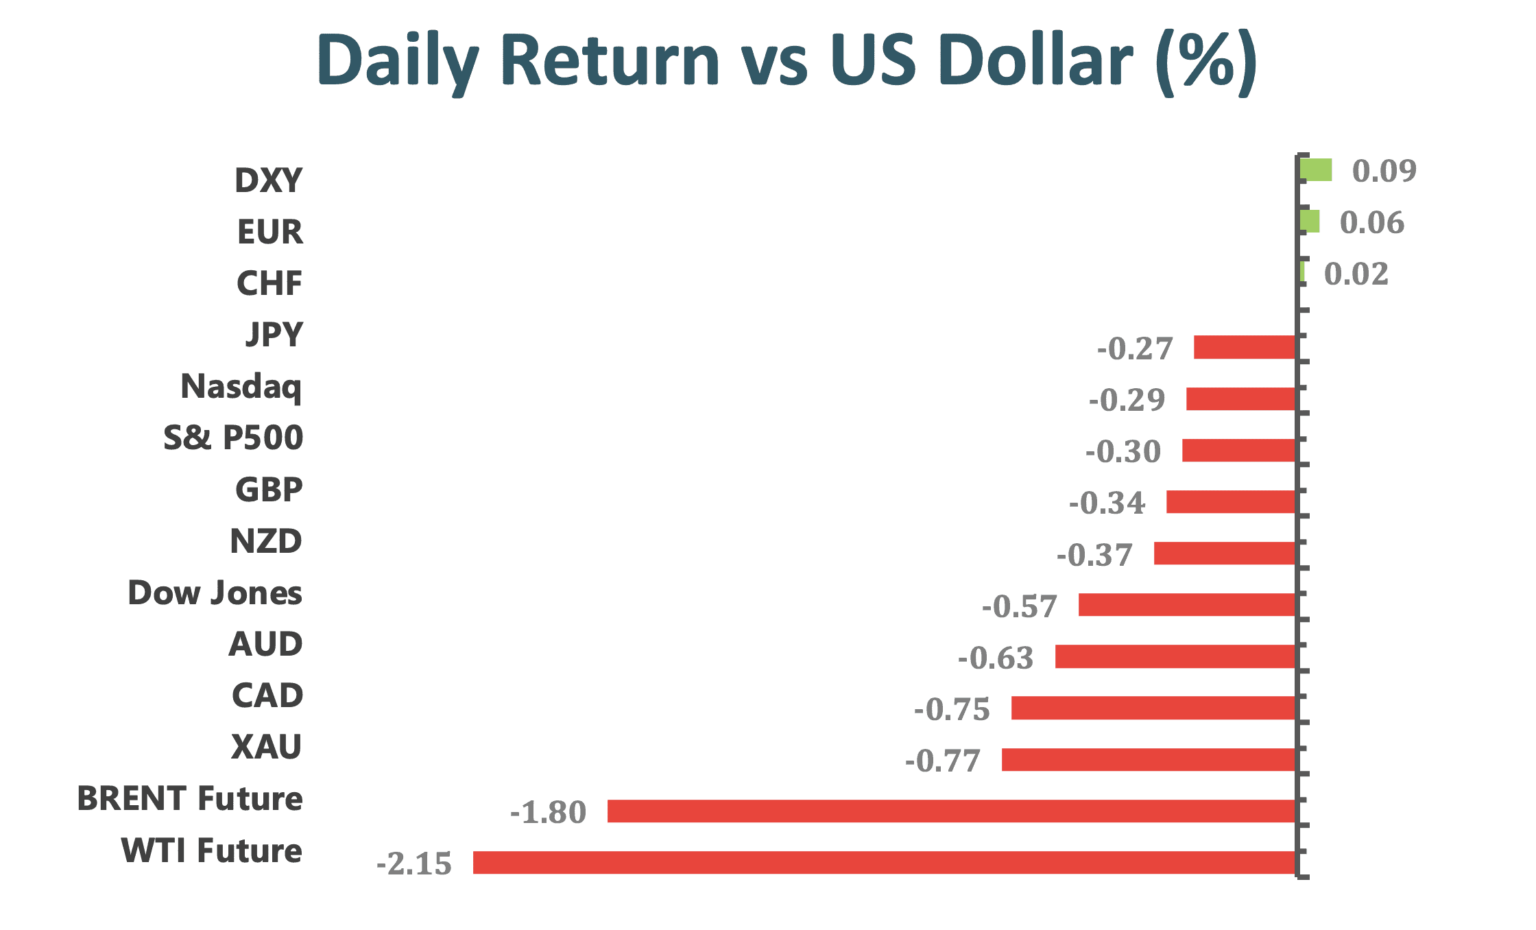
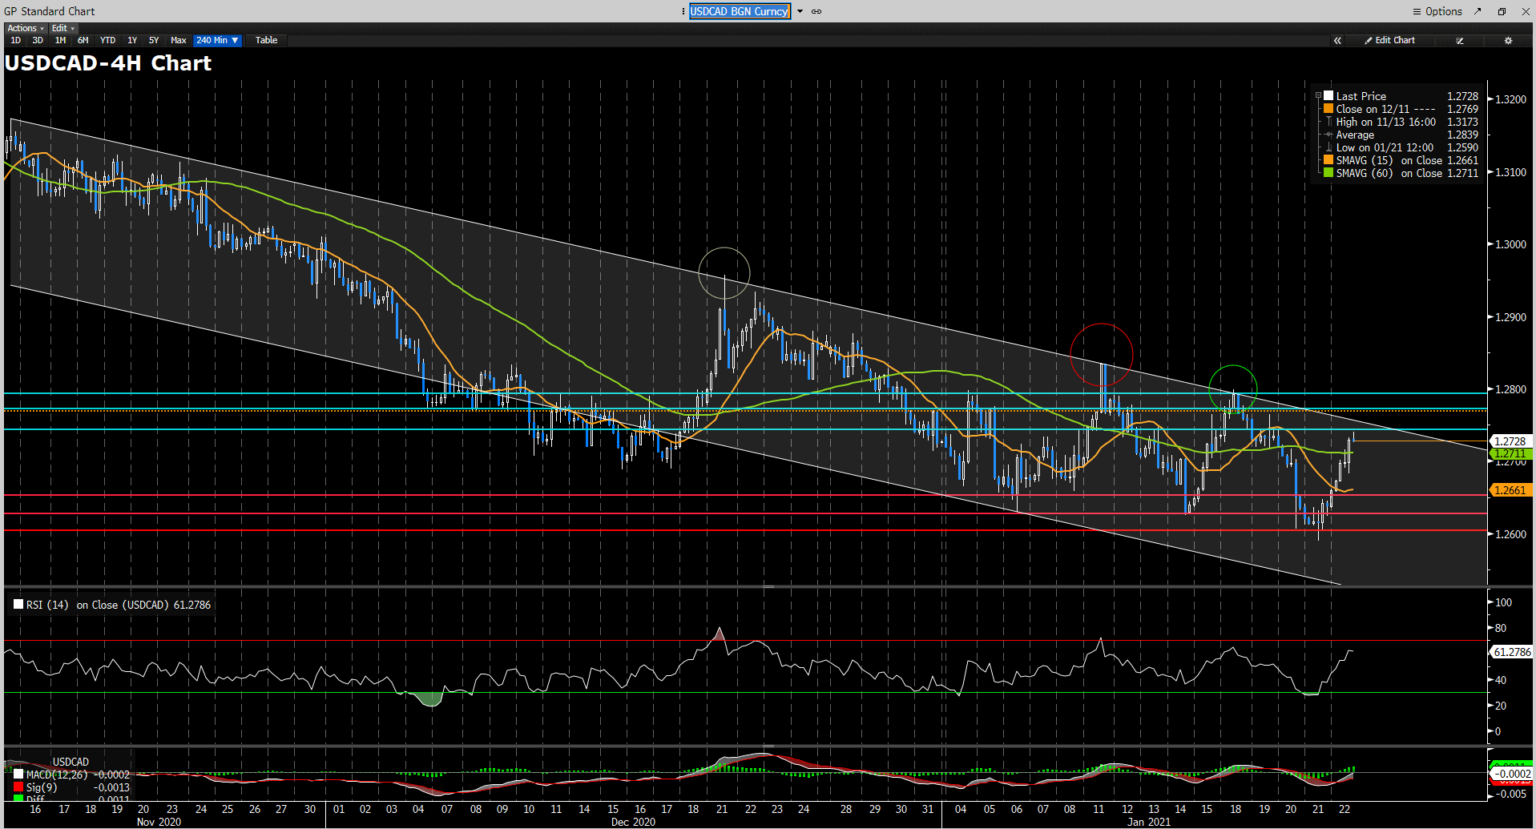
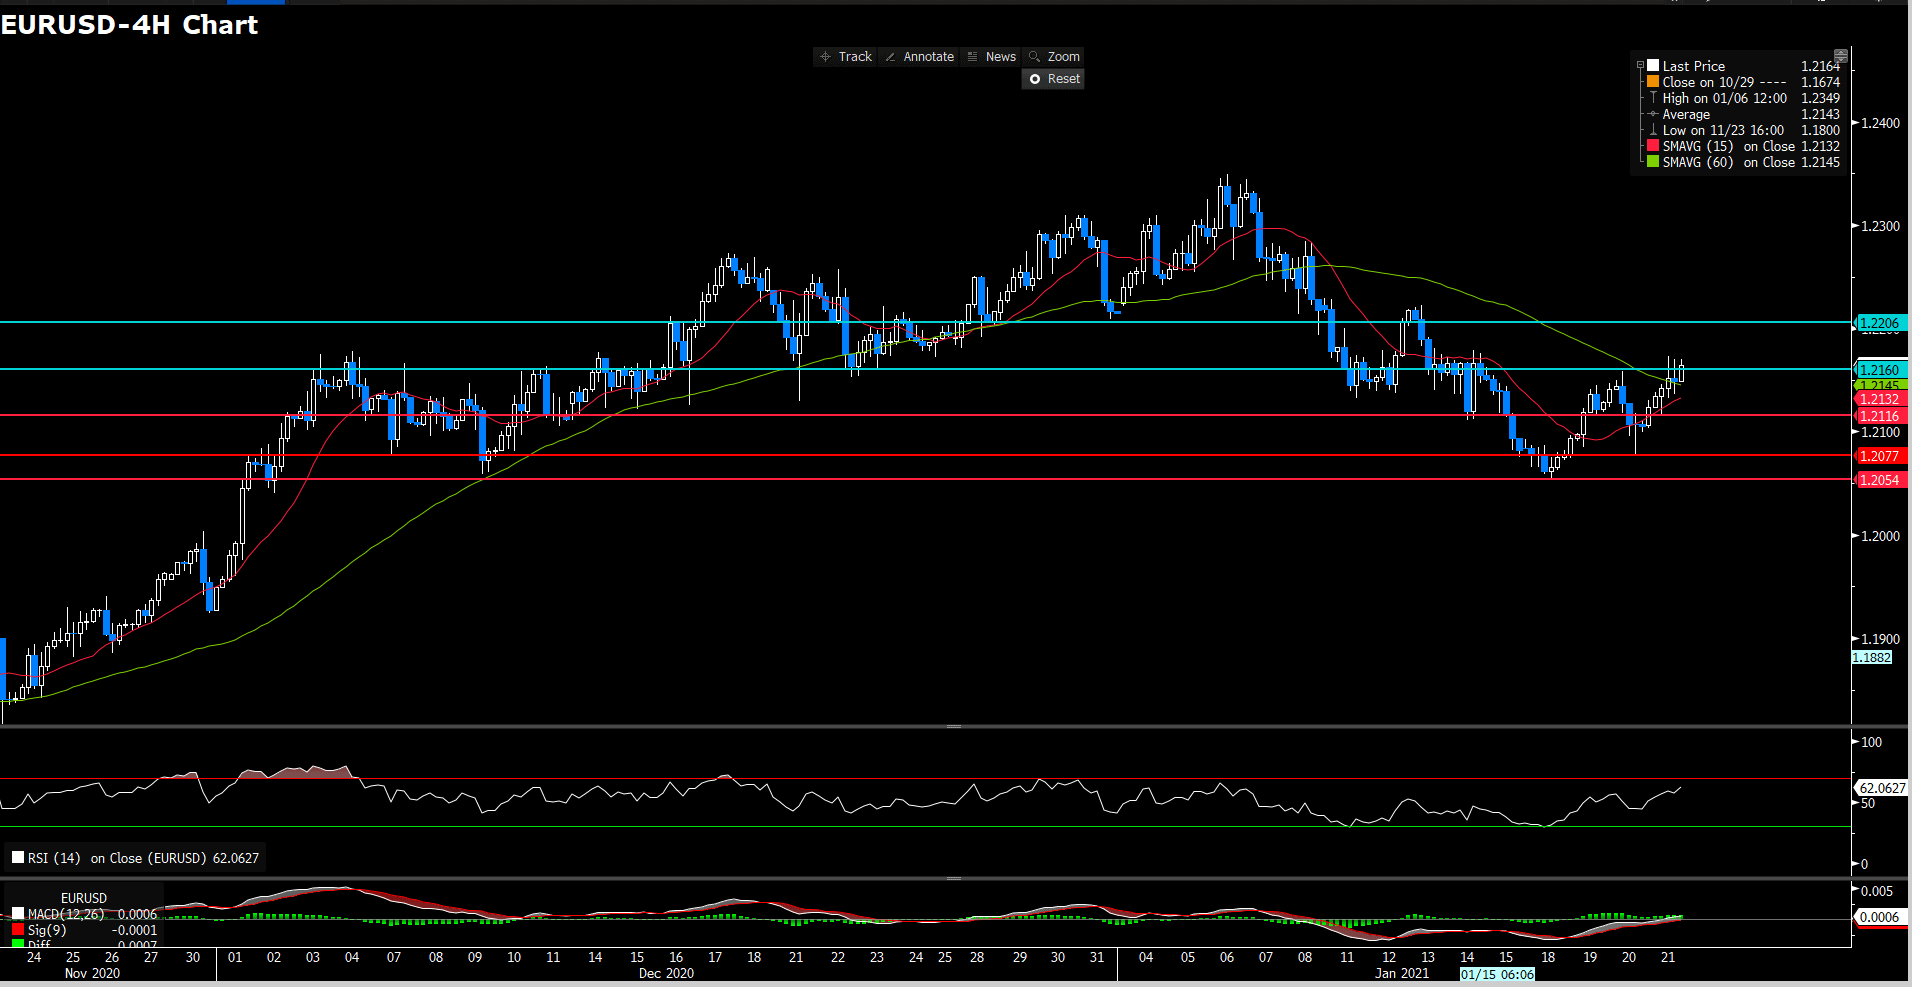
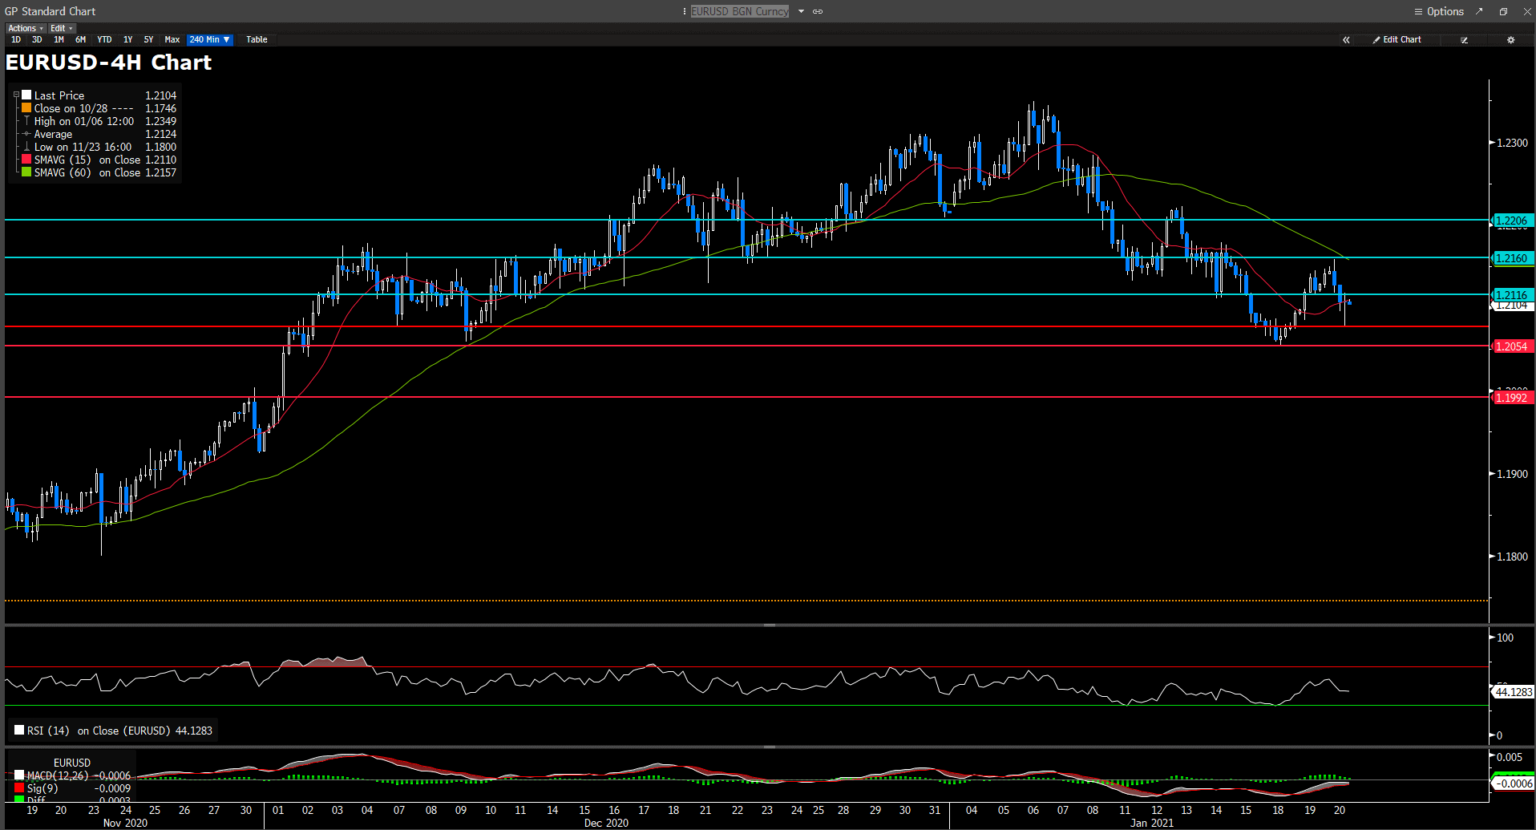
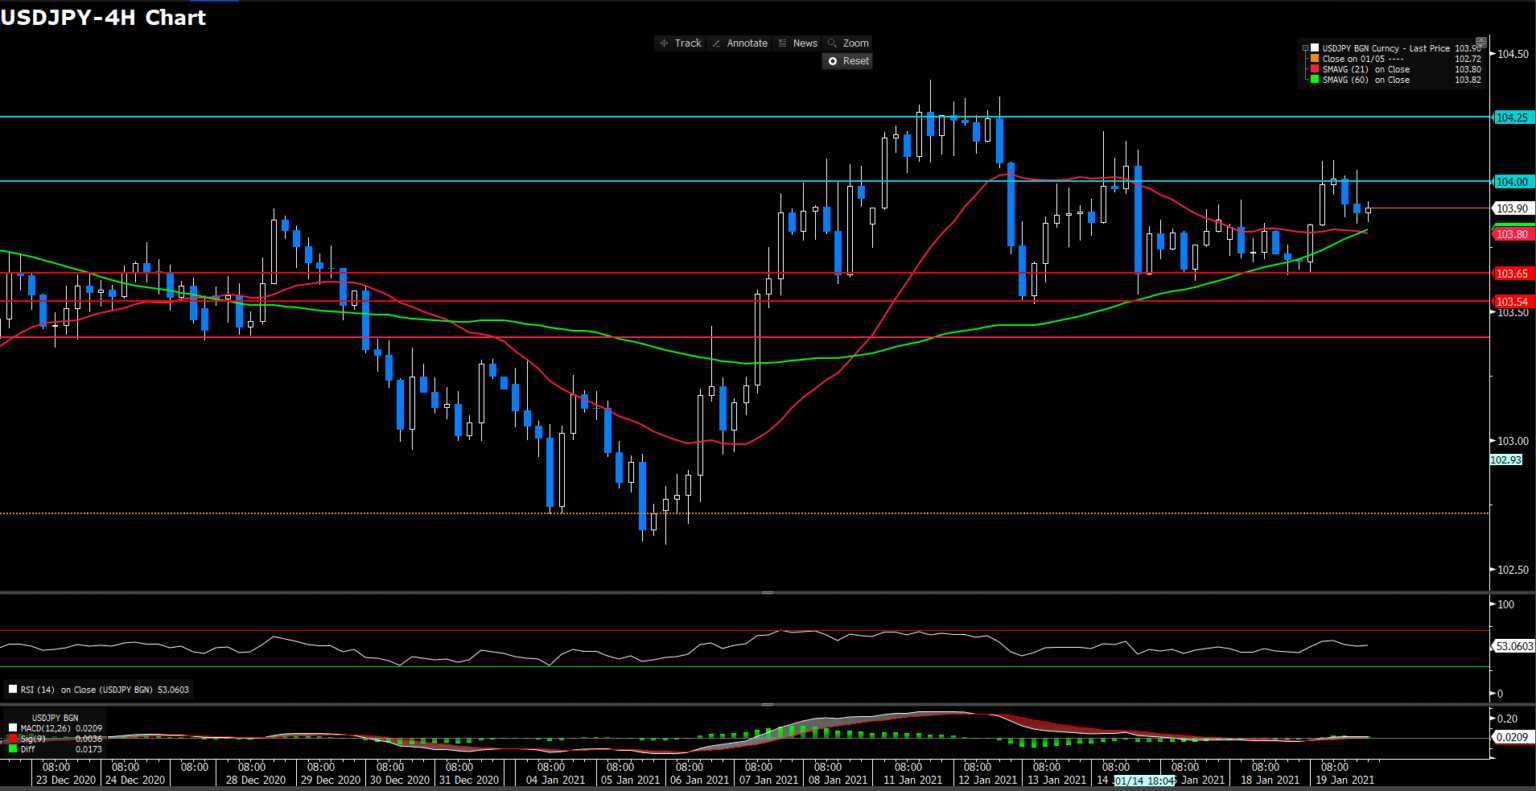
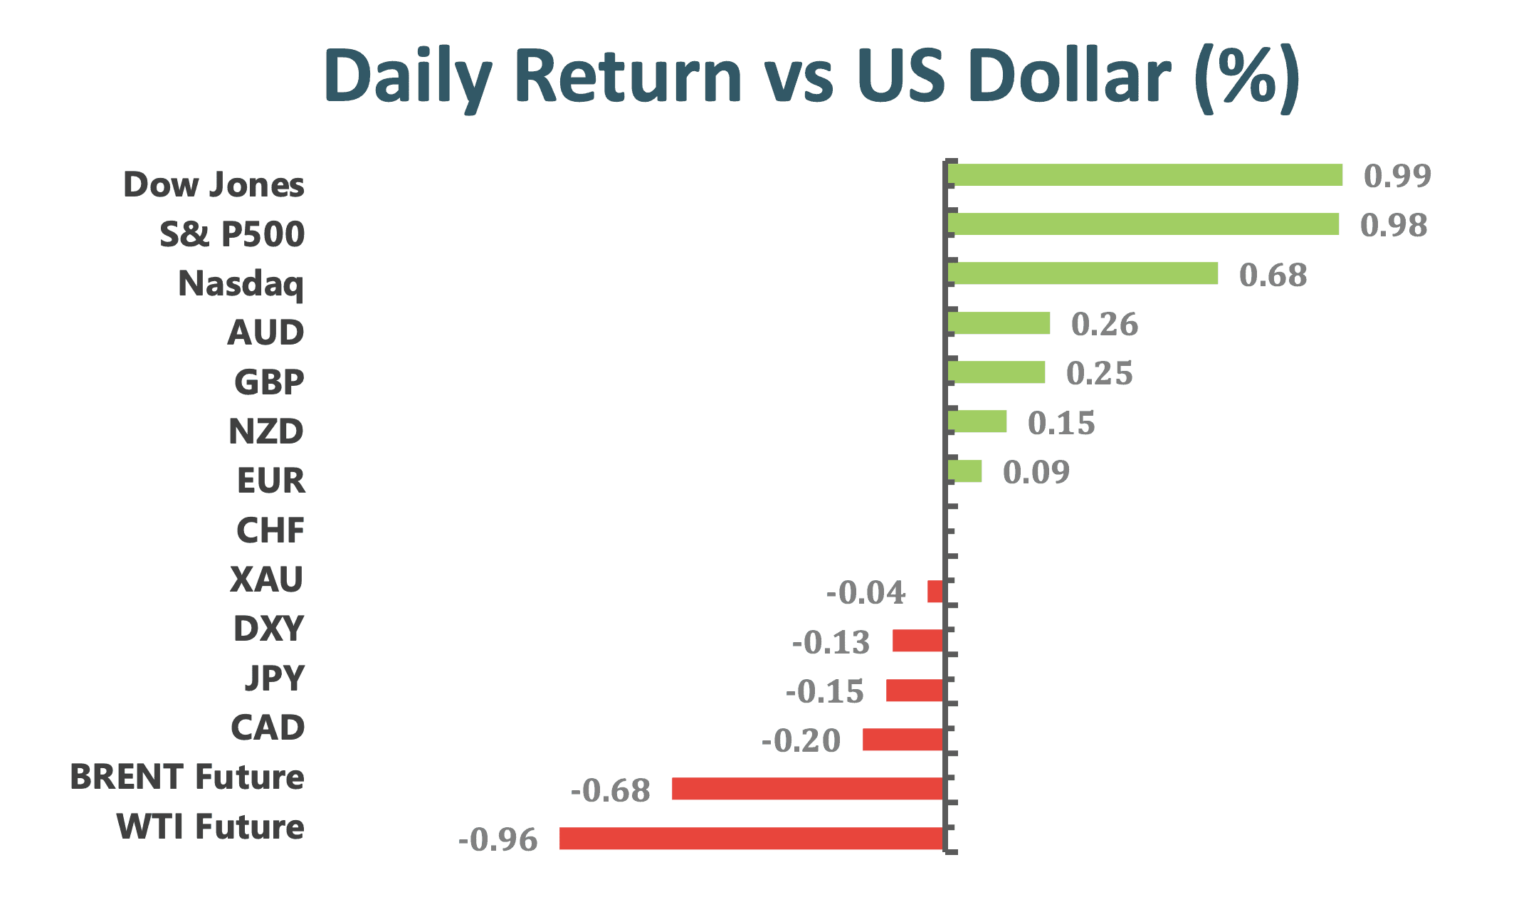
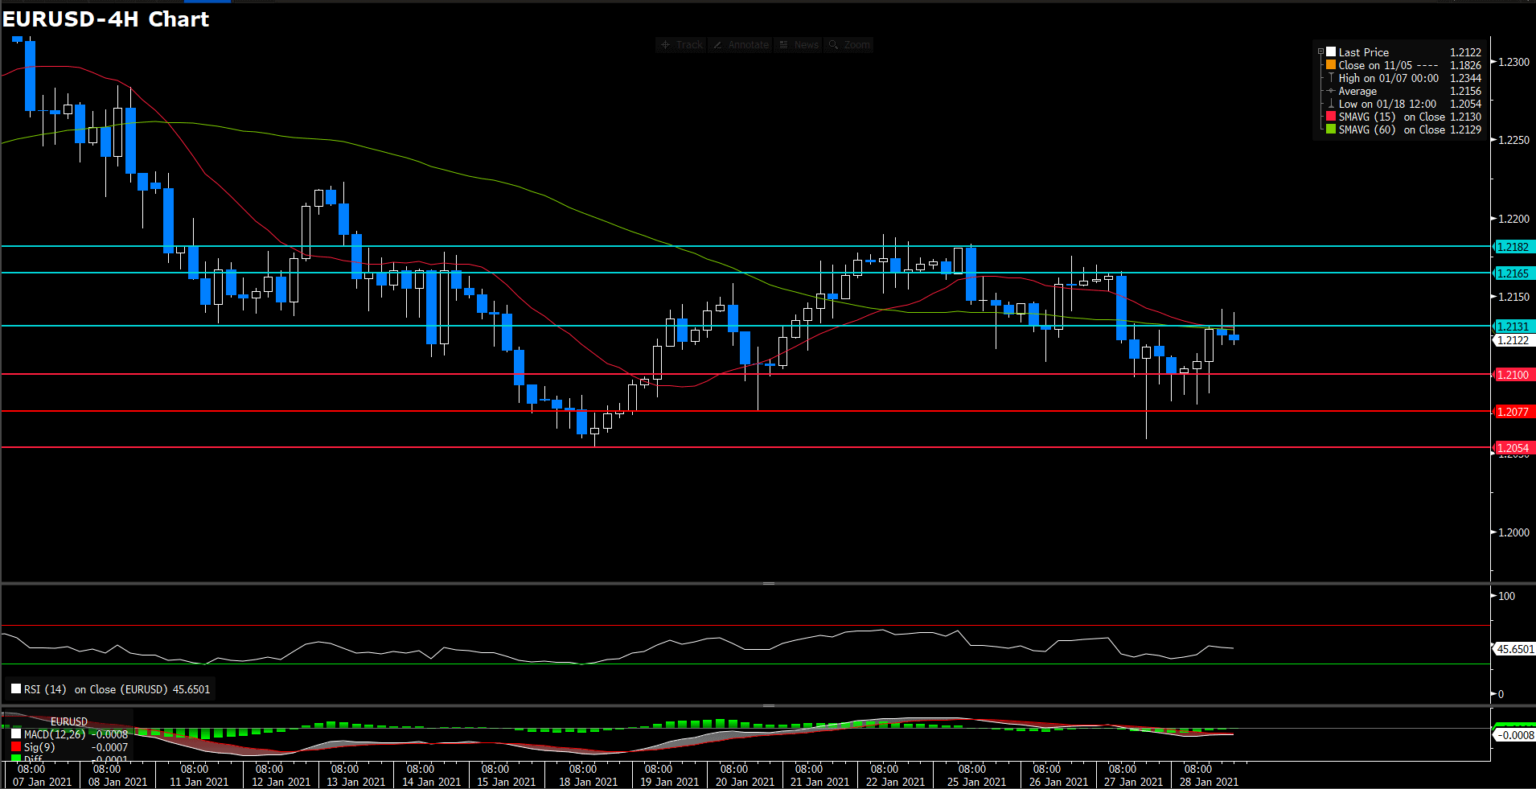
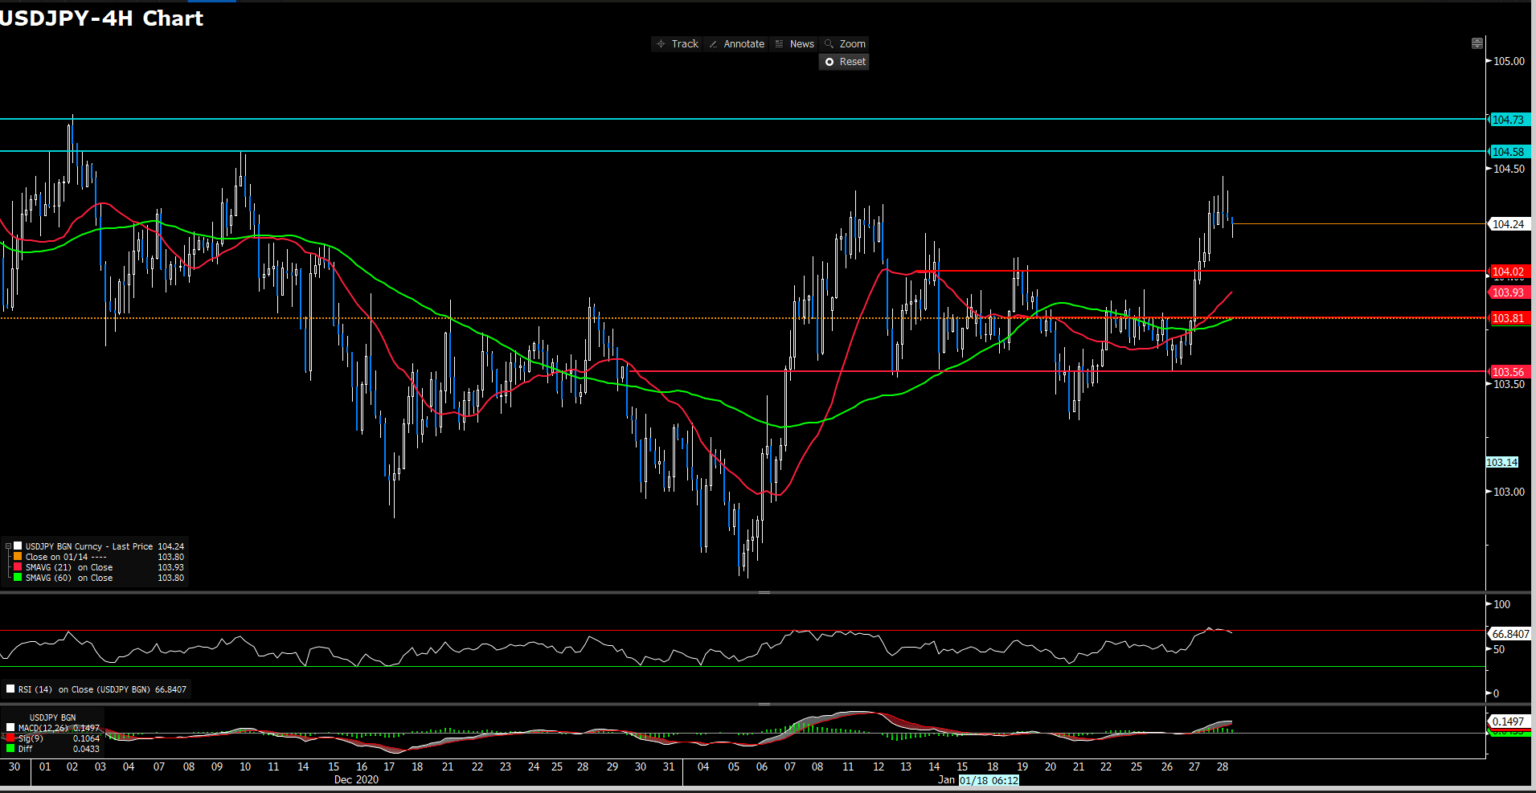
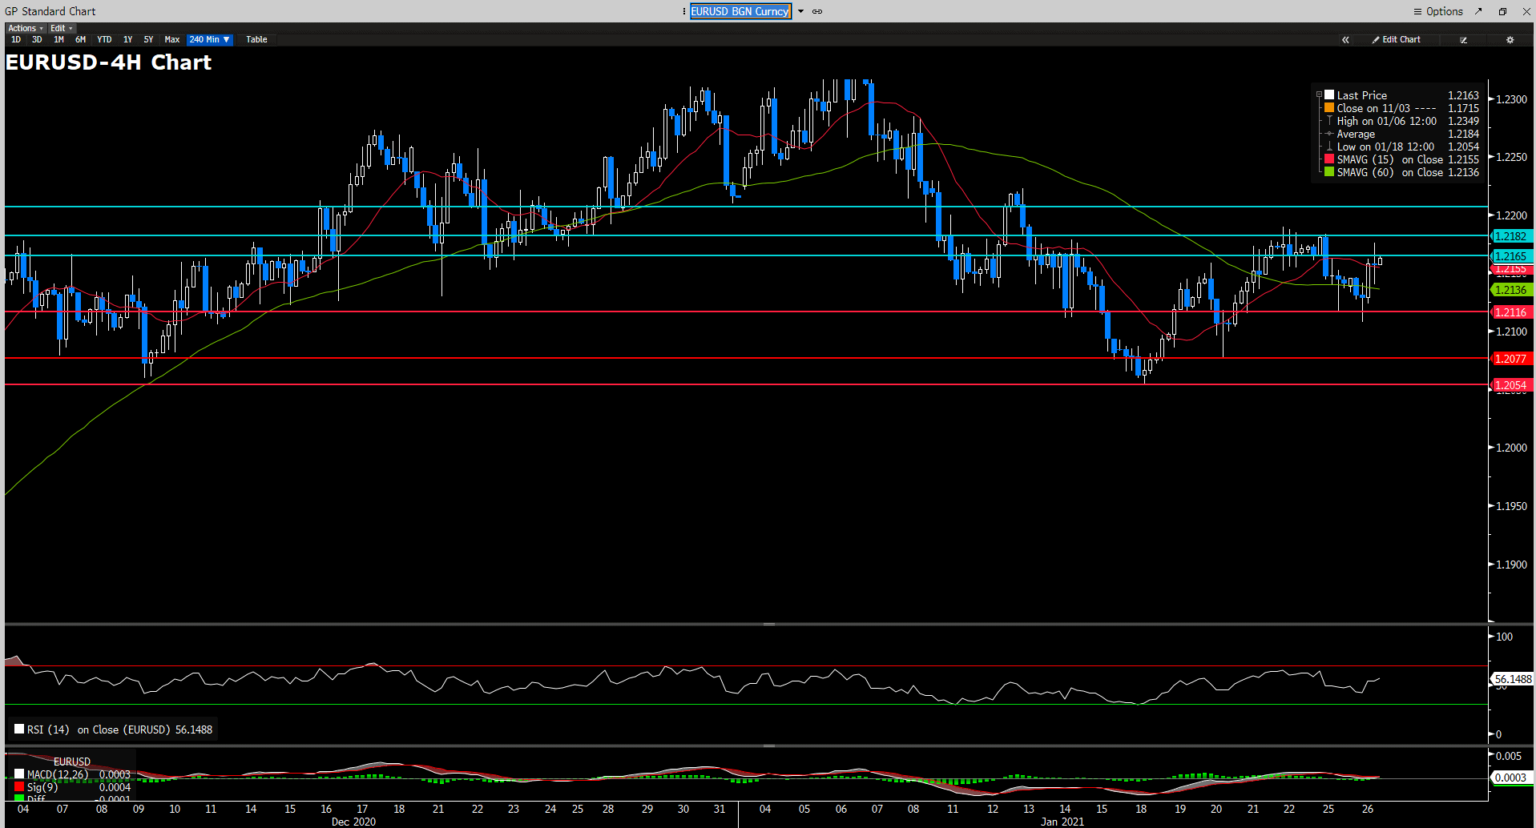
EURUSD is trading above 1.2100, reversing losses after the German GDP beat estimates with 0.1% QoQ in Q4. US dollar clings to gains amid a downbeat mood fueled by the Wall Street retail-trader craze. Focus shifts to the US data, Yellen’s speech. Japan’s Tokyo inflation came in at -0.5% YoY, better than anticipated in January. Equities trade in the red in Asia and Europe amid individual investors’ frenzy. USDJPY rallies despite risk aversion, as demand for the greenback prevails. The USDCAD pair came under renewed bearish pressure in the early American session on Friday and touched a fresh two-day low of 1.2749.
The US Dollar Index extends the rejection from weekly highs below the 91.00 mark, shedding ground for the second session in a row on Friday. Crude Oil market indecision has continued on the final trading day of the week; front-month WTI futures have very much stuck to the week’s prior established range of between the $52.00 and low $53.00s.
Technical Analysis:
AUDUSD (4 Hour Chart)
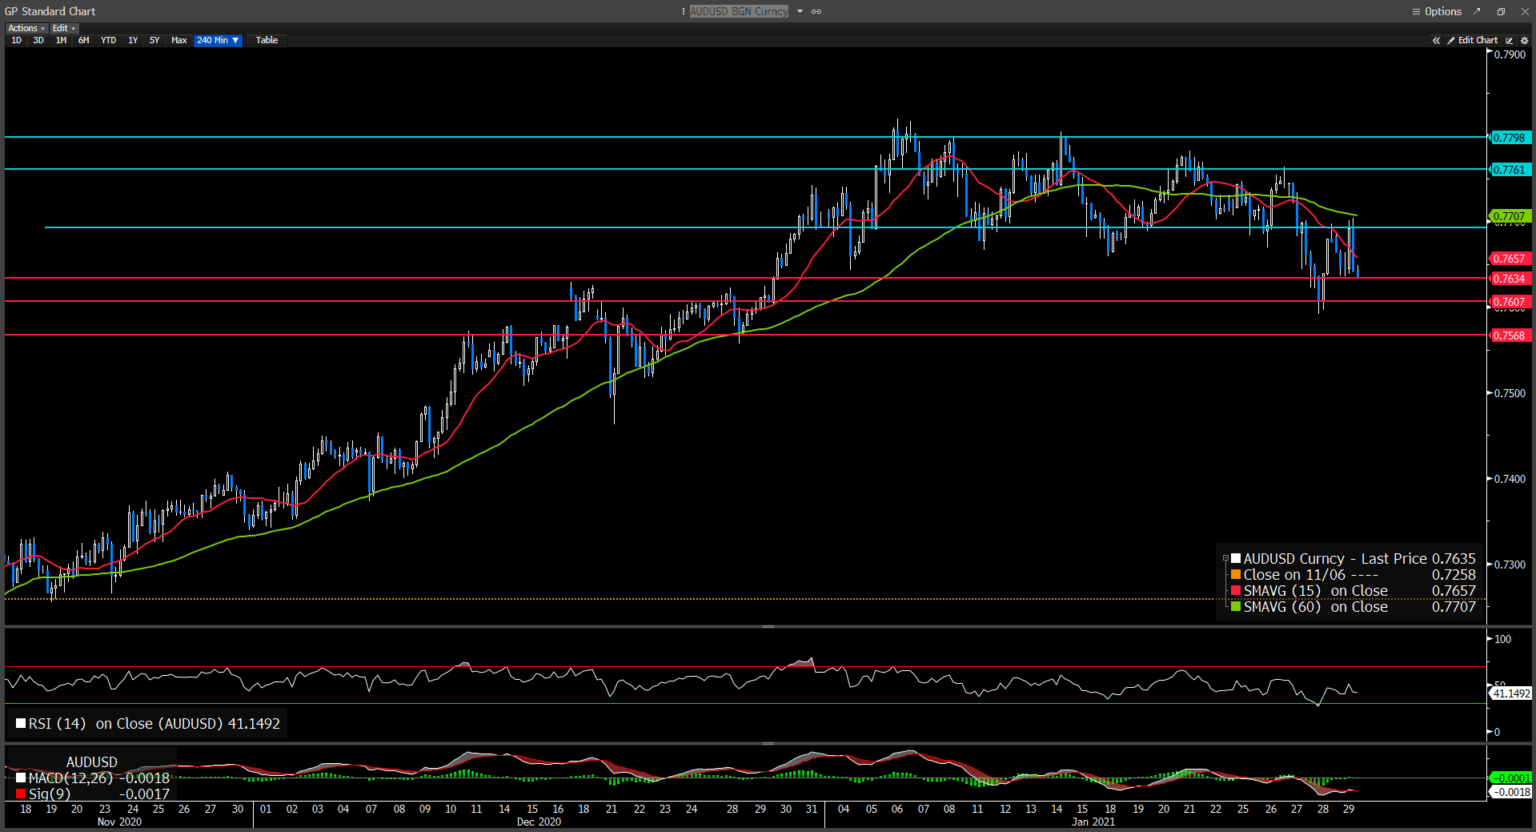
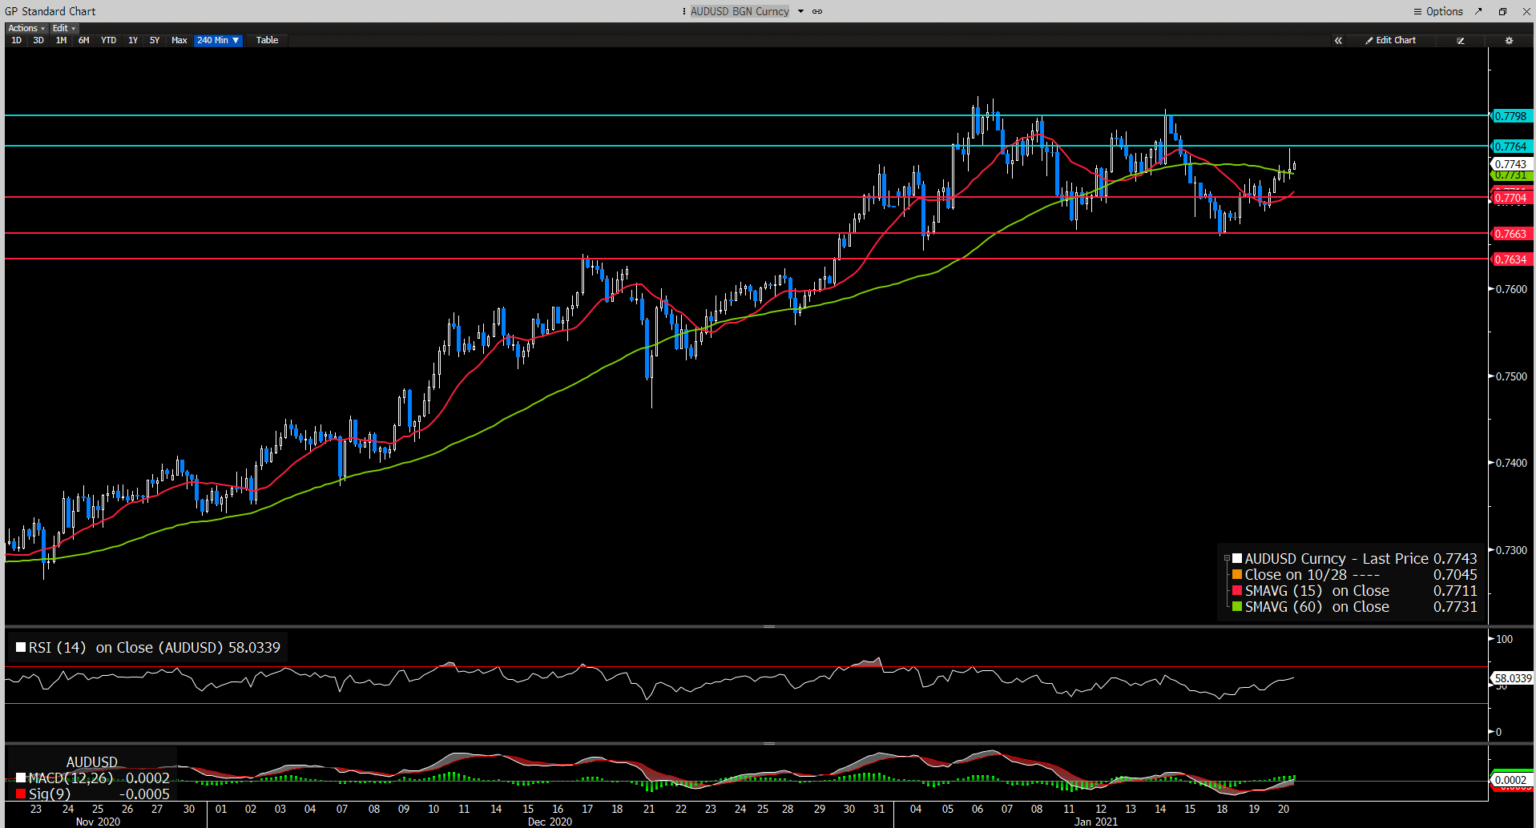
On Friday, the Aussie tumbles to its most immediate support at 0.7634 on the back of the resumption of the demand for greenback with risk aversion sentiment dominating the global markets. The Aussie first began to show signs of losing positive traction in the early American session with the bulls failing to find acceptance above the 0.7700 resistance area. The risk-averse market environment is reflected by the broad-based decline across Wall Street’s main indexes, which in turn, helped DXY to stage a rebound. From a technical perspective, the bearish trend of the pair is supported by the 60-Day SMAVG. The tumbling of AUDUSD has brought down the RSI as the RSI for AUDUSD is now fluctuating around the low 40s, suggesting a bearish bias in investors trading pattern has now been triggered. If the risk aversion sentiment continues, the AUDUSD would be on the back foot and could be forced down to 0.7607 and 0.7568 if the support at 0.7634 is broken below. On the flip side, if the market sentiment is reversed, the Aussie pair would first touch the 0.7696 resistance, followed by 0.7761 and 0.7798.
Resistance: 0.7696, 0.7761, 0.7798
Support: 0.7634, 0.7607, 1.7568
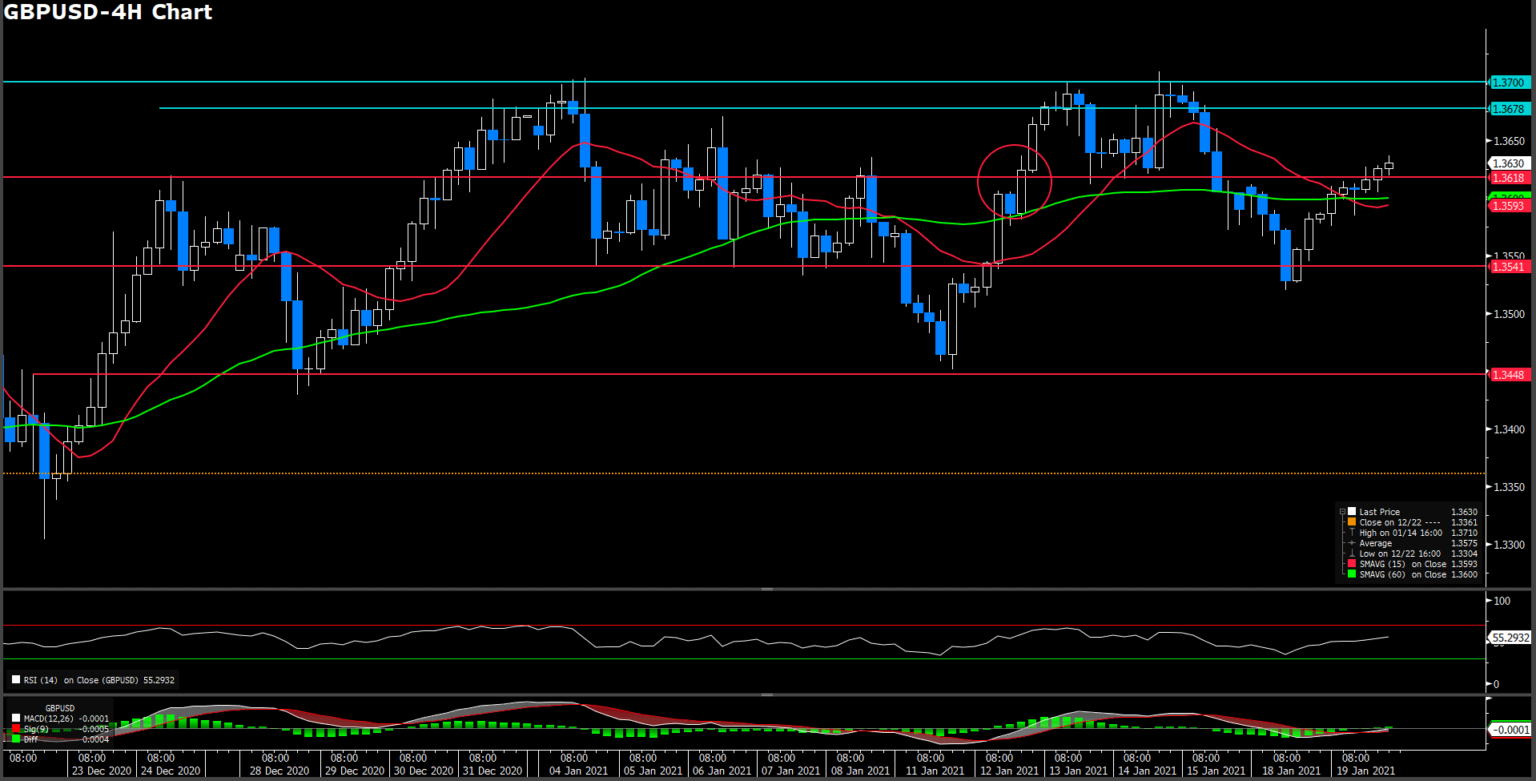
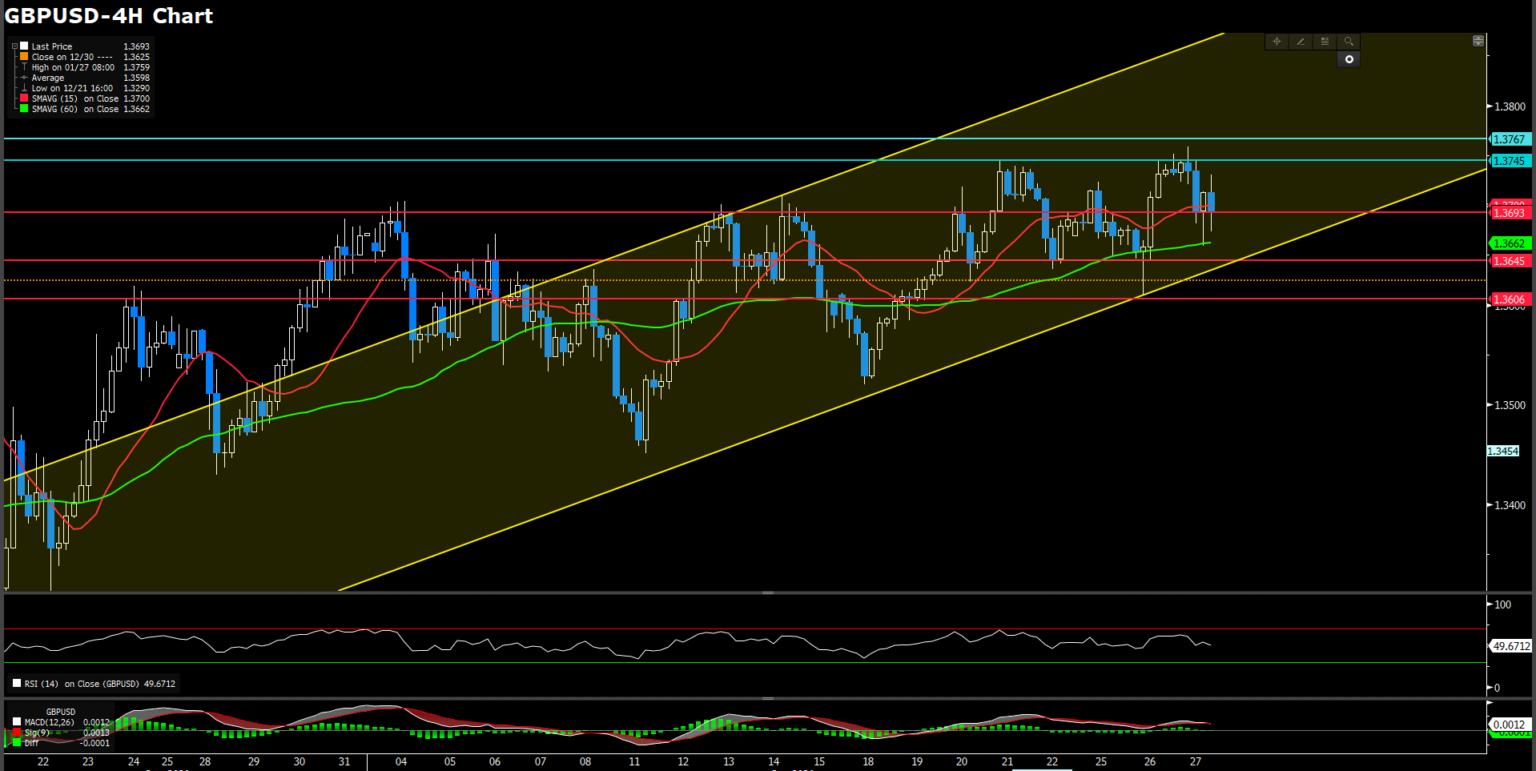
GBPUSD (4 Hour Chart)

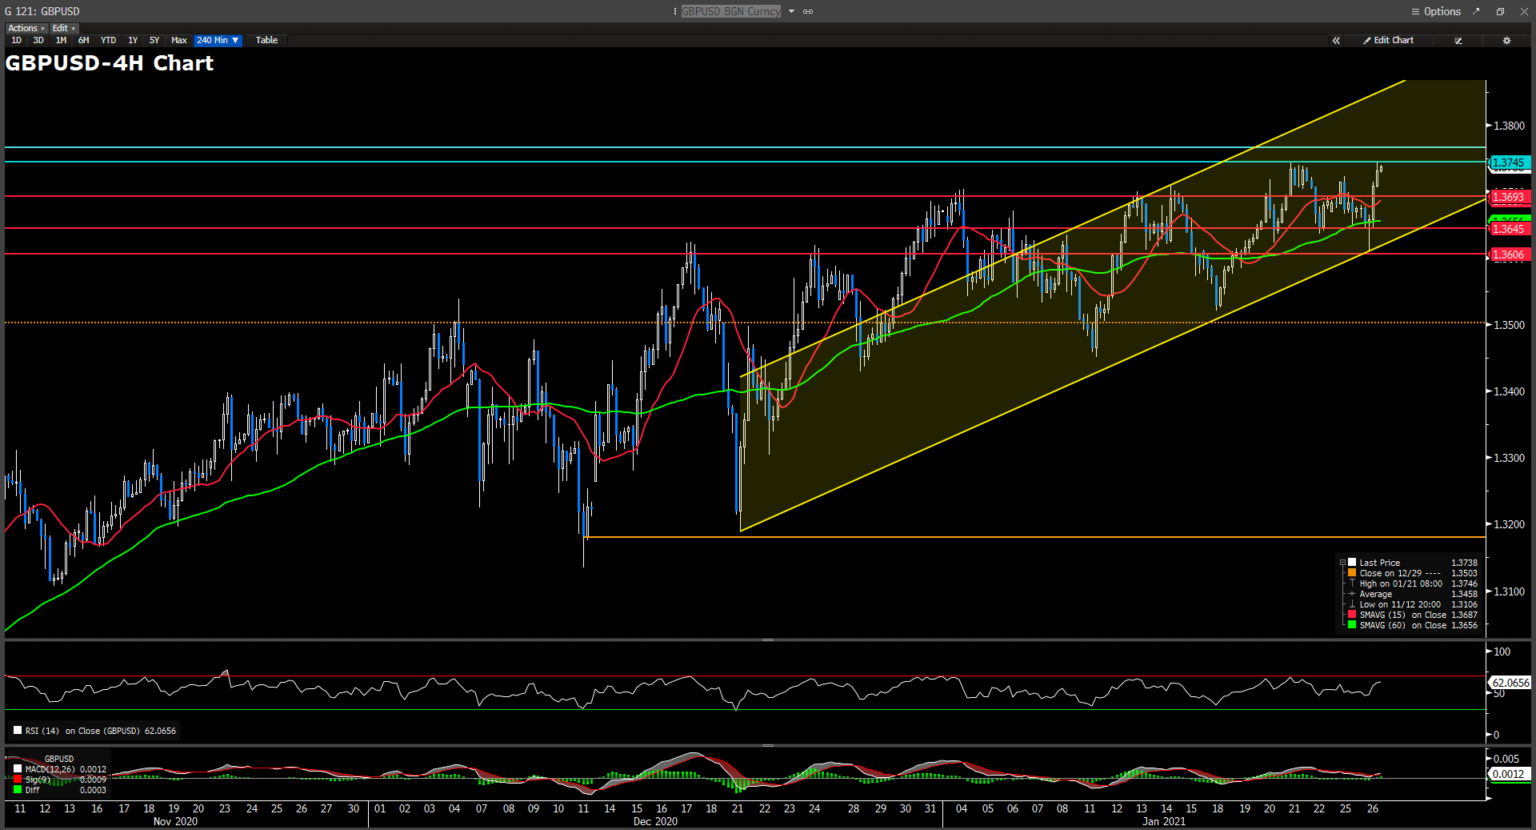
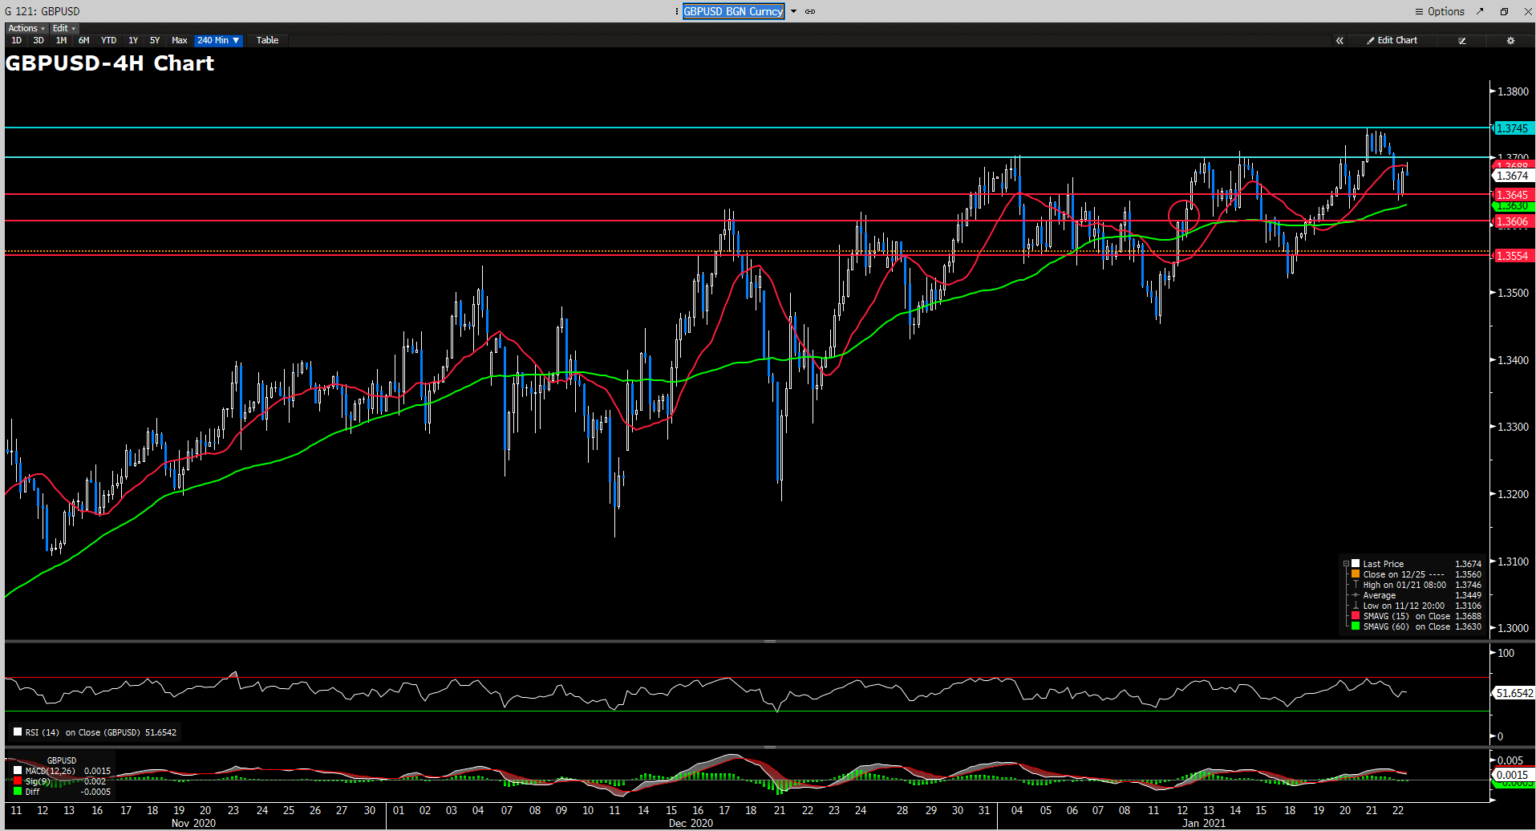
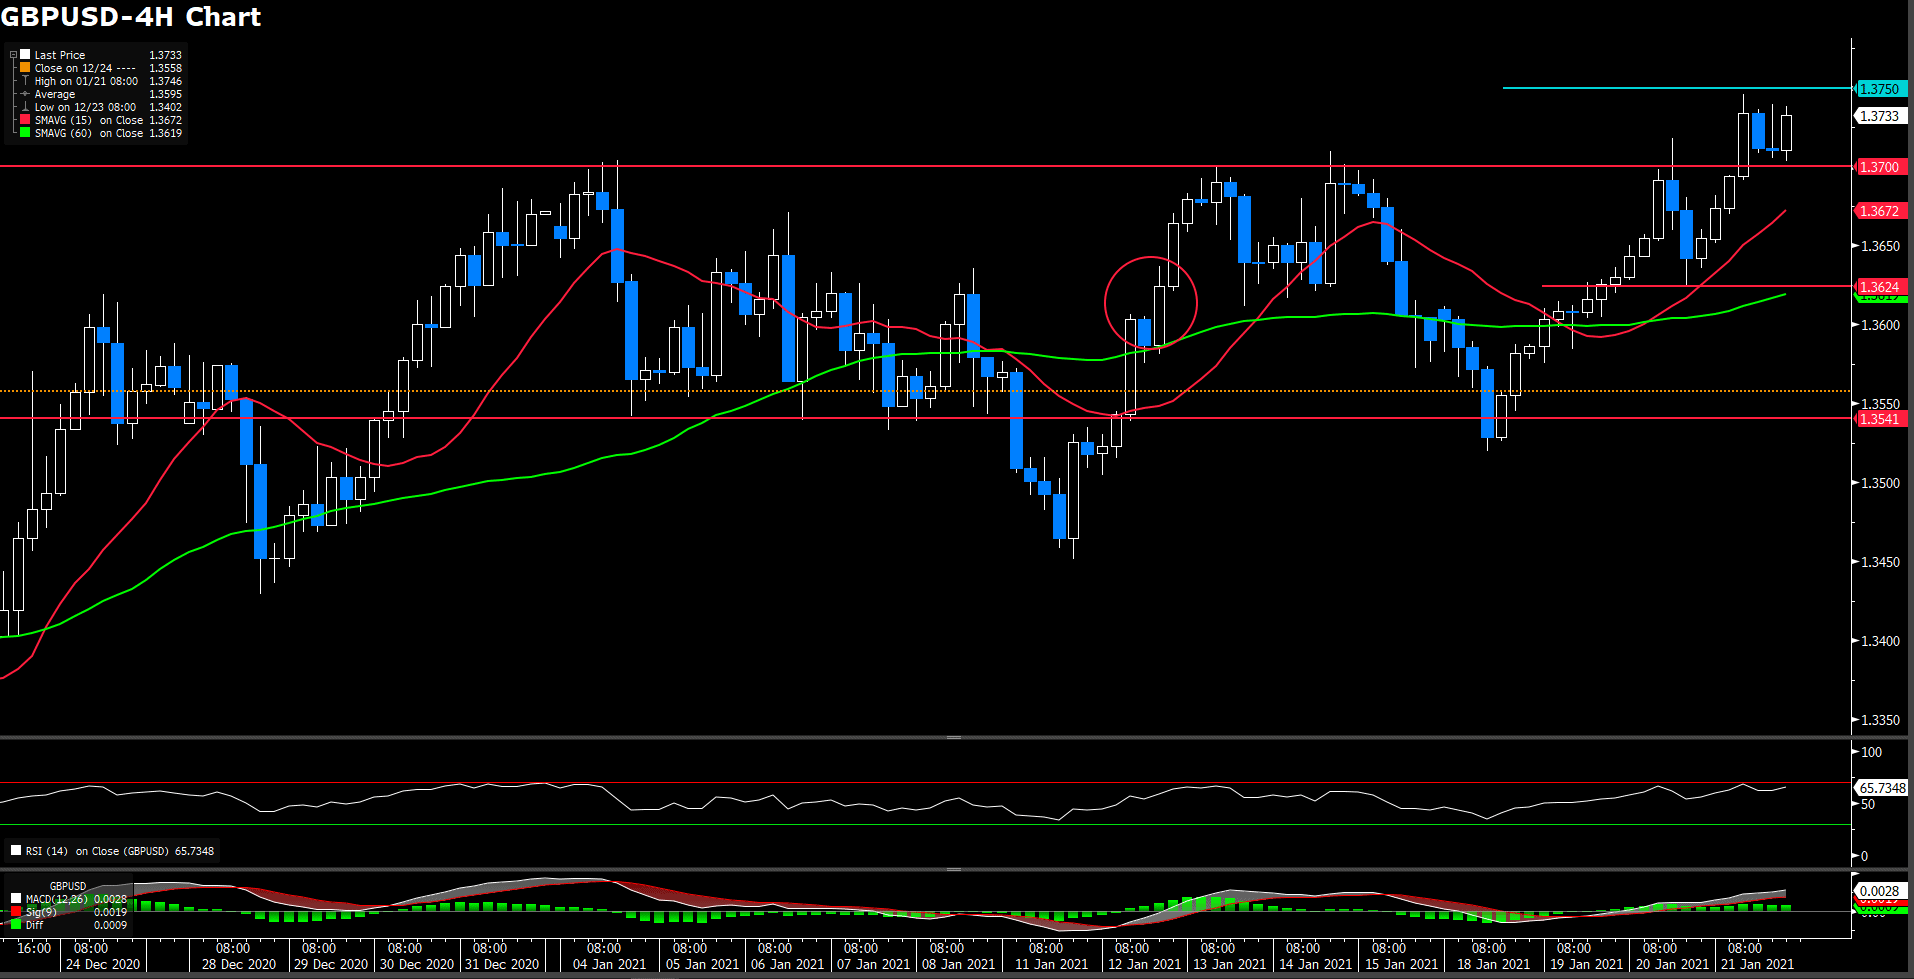
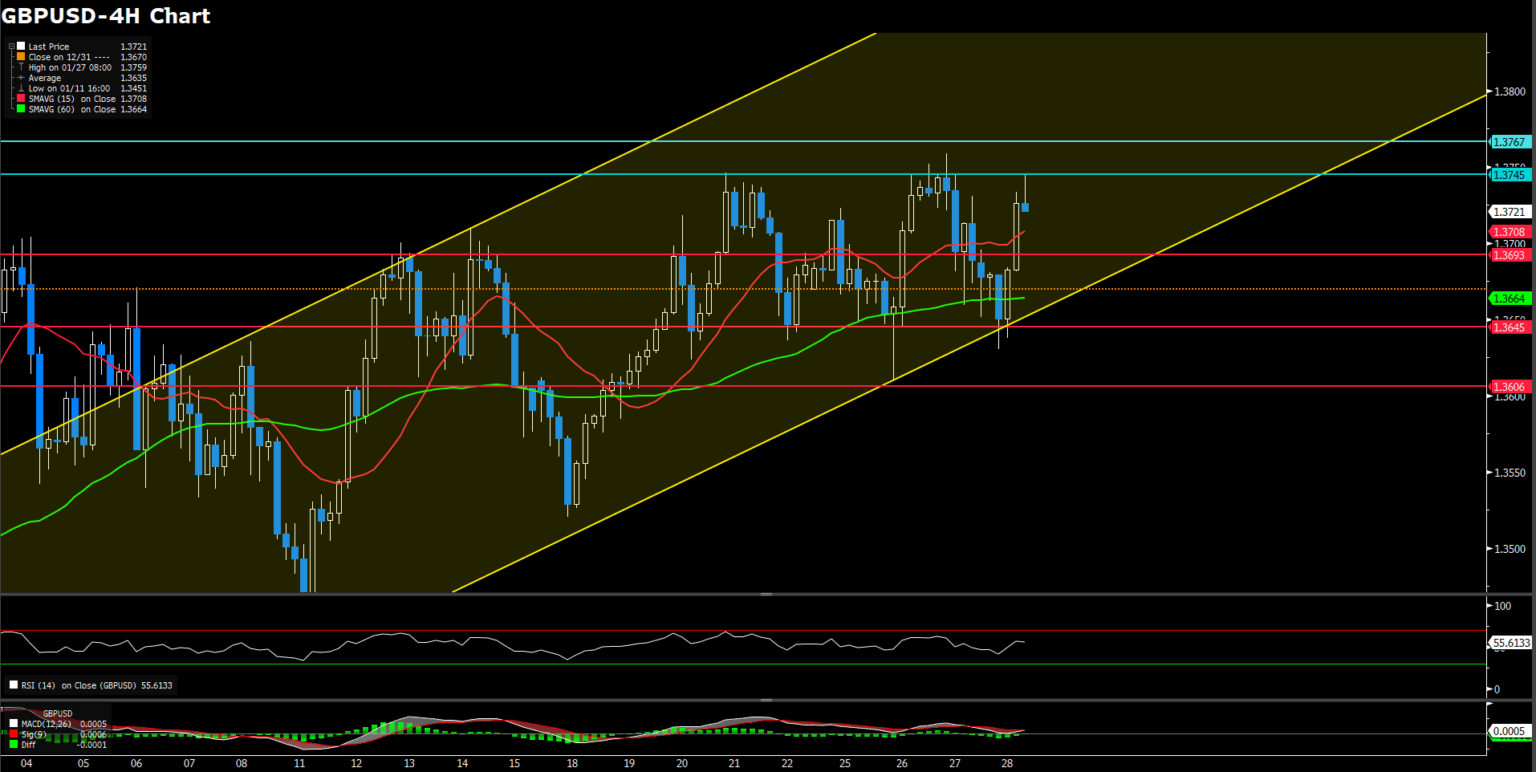
The Cable bulls are eyeing the critical resistance level at 1.13745 once again on Friday as the pair has staged a couple attempts to break above the 1.3745 resistance zones during the early America session. Even though the greenback regained some momentum at the time of writing, the GBPUSD seems less affected than most other greenback’s rivals. The strength of GBP is probably supported by the statements released by UK PM Johnson’s spokesman earlier on Friday. The spokesman reiterated on Friday that “we will continue to distribute vaccines fairly across all UK nations”.
Given that the Cable remains supported by the 15-Day SMAVG and that the GBPUSD pair has been rising on the higher lows since the start of 2021, it is reasonable to expect the GBPUSD bulls are waiting for a sign to break through the 1.3475 resistance level. Conversely, if the pair reverses the trend, a few cushions, which can be found at 1.3694, 1.3643, and 1.3606 would provide some essential support for the investors.
Resistance: 1.3745, 1.3767
Support: 1.3694, 1.3643, 1.3606
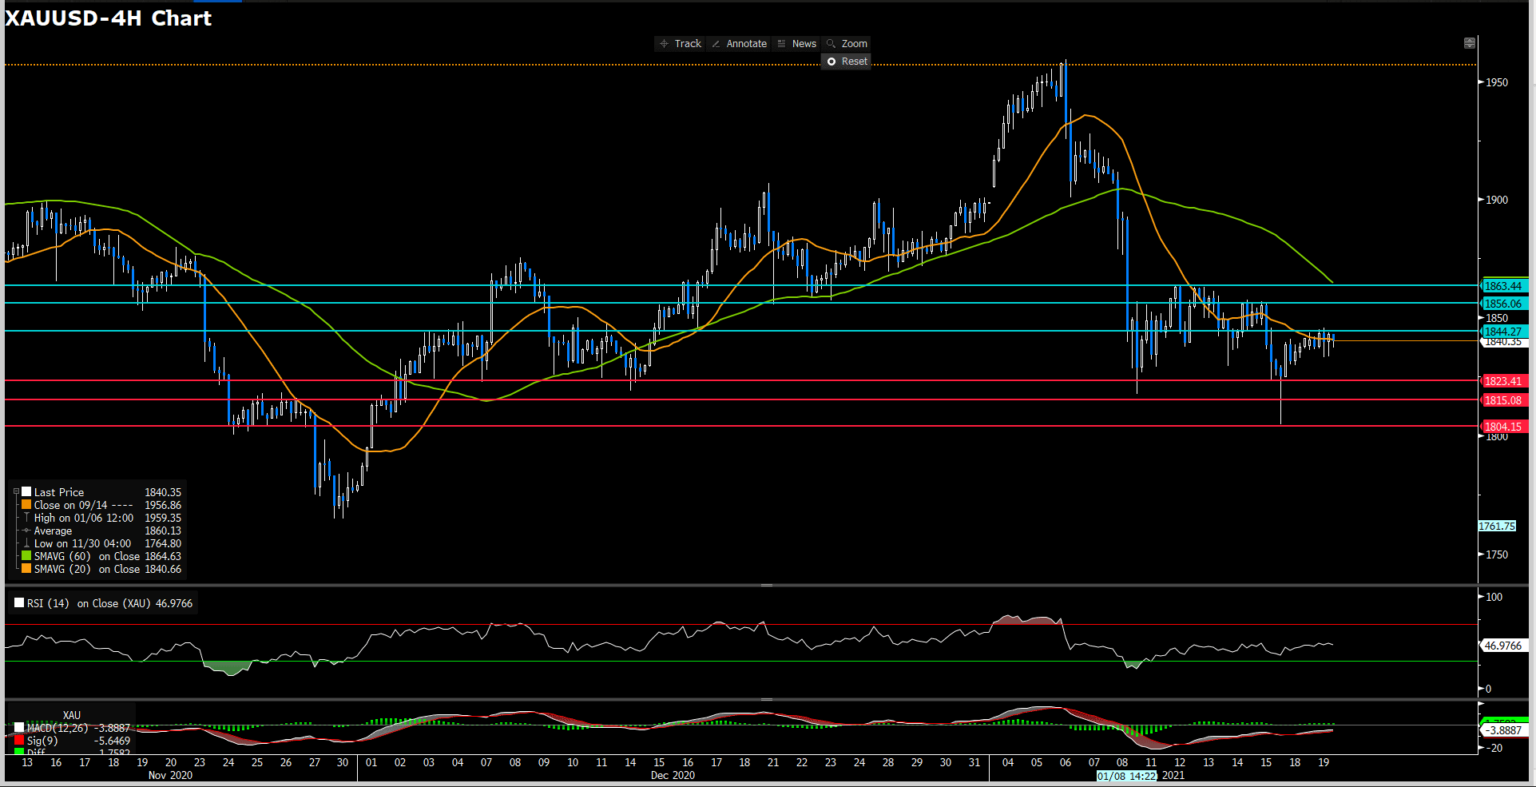
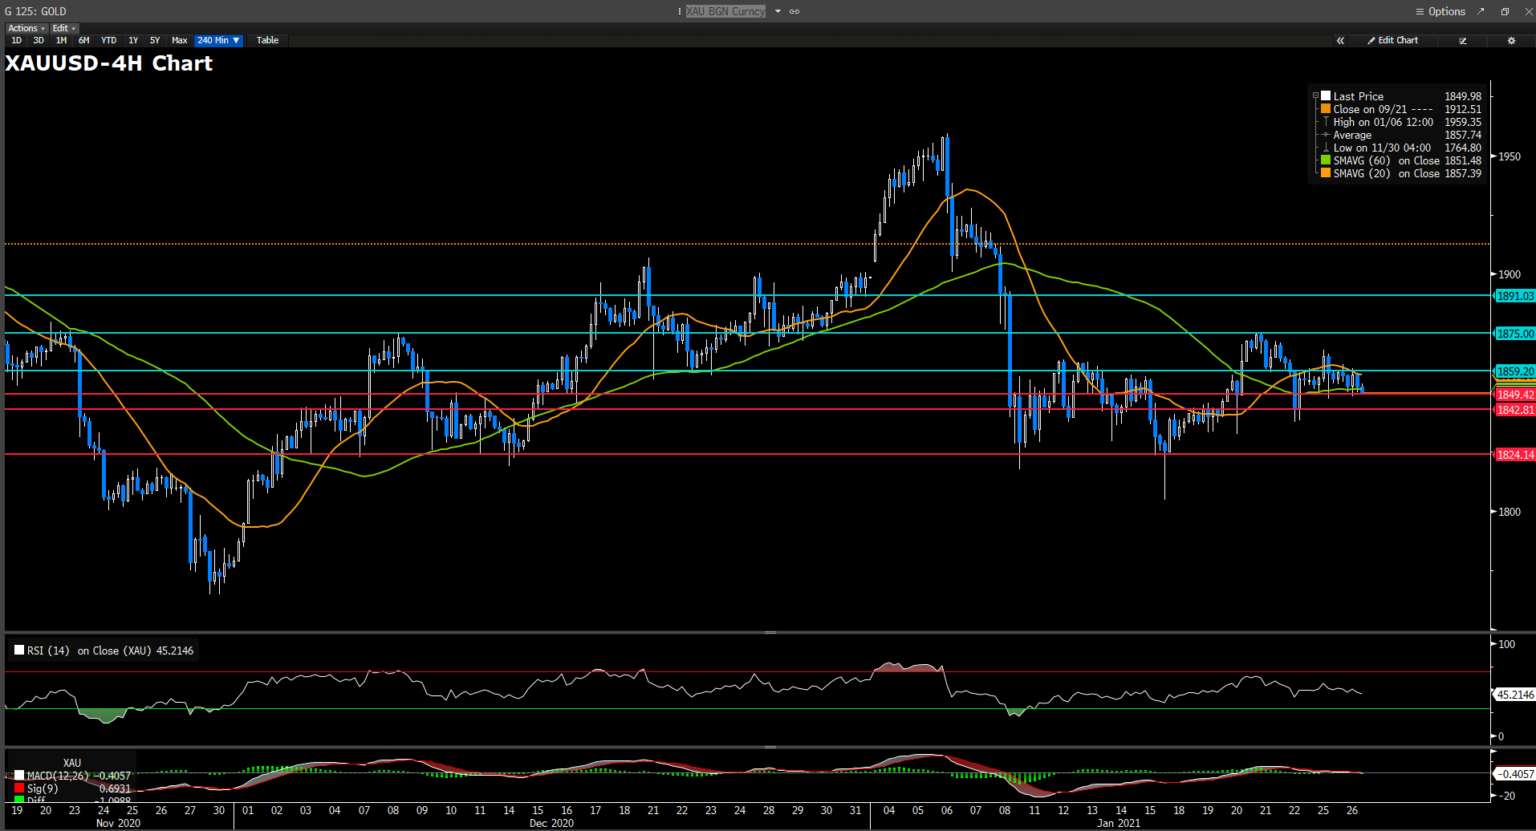
XAUUSD (4 Hour Chart)
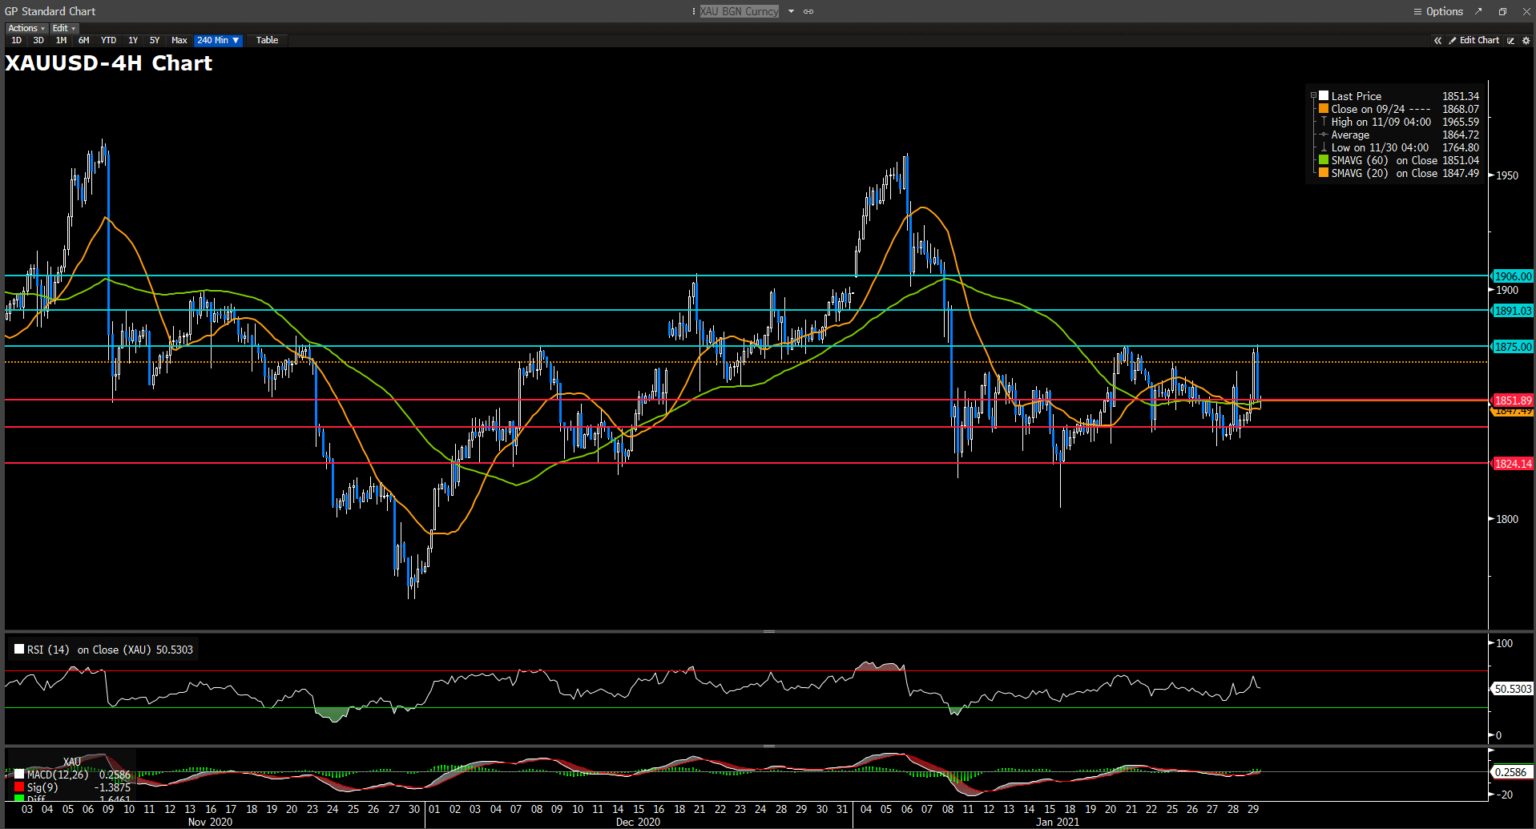
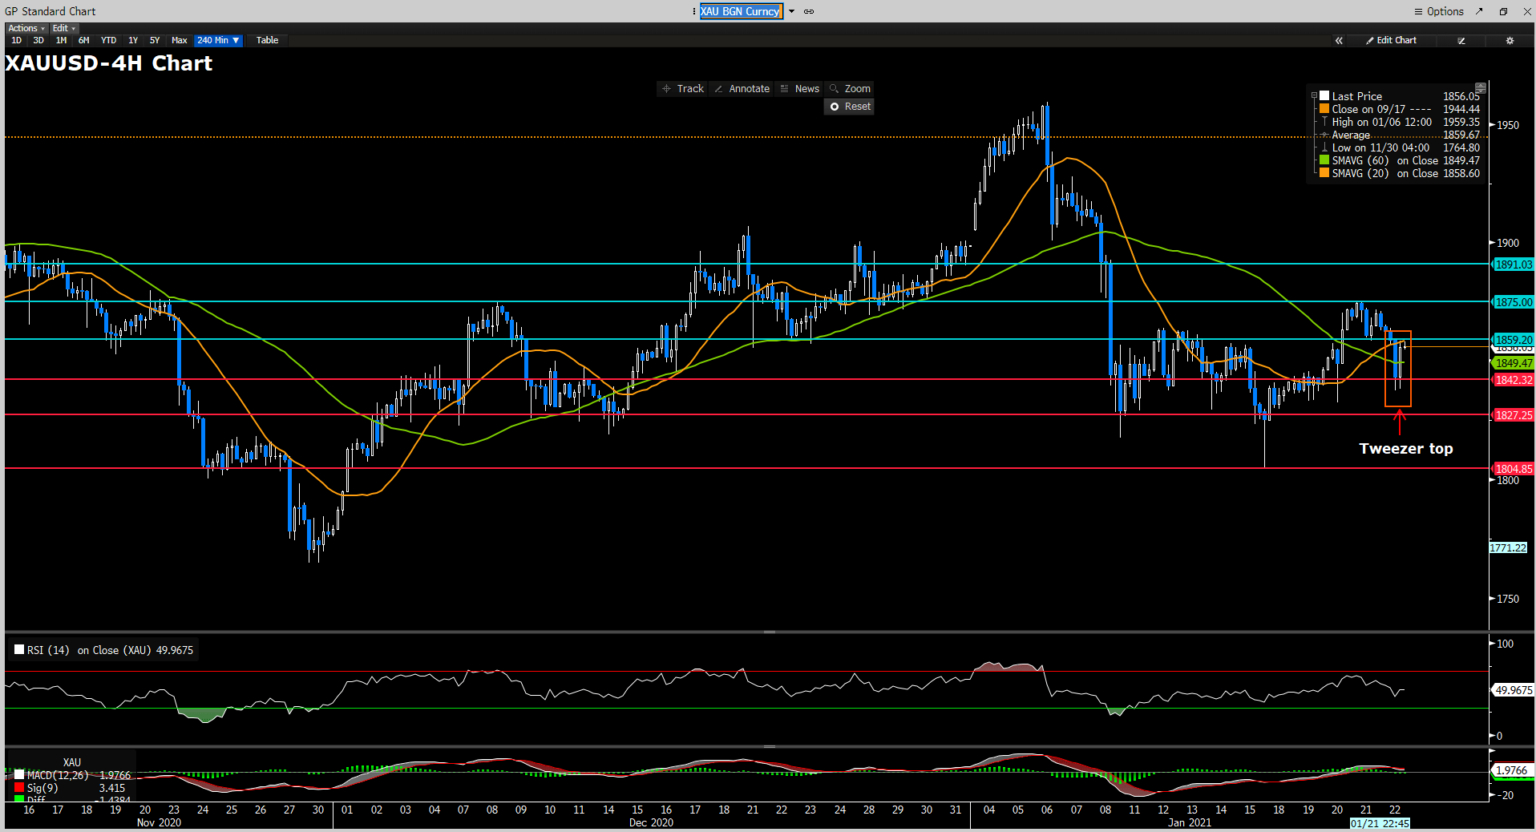
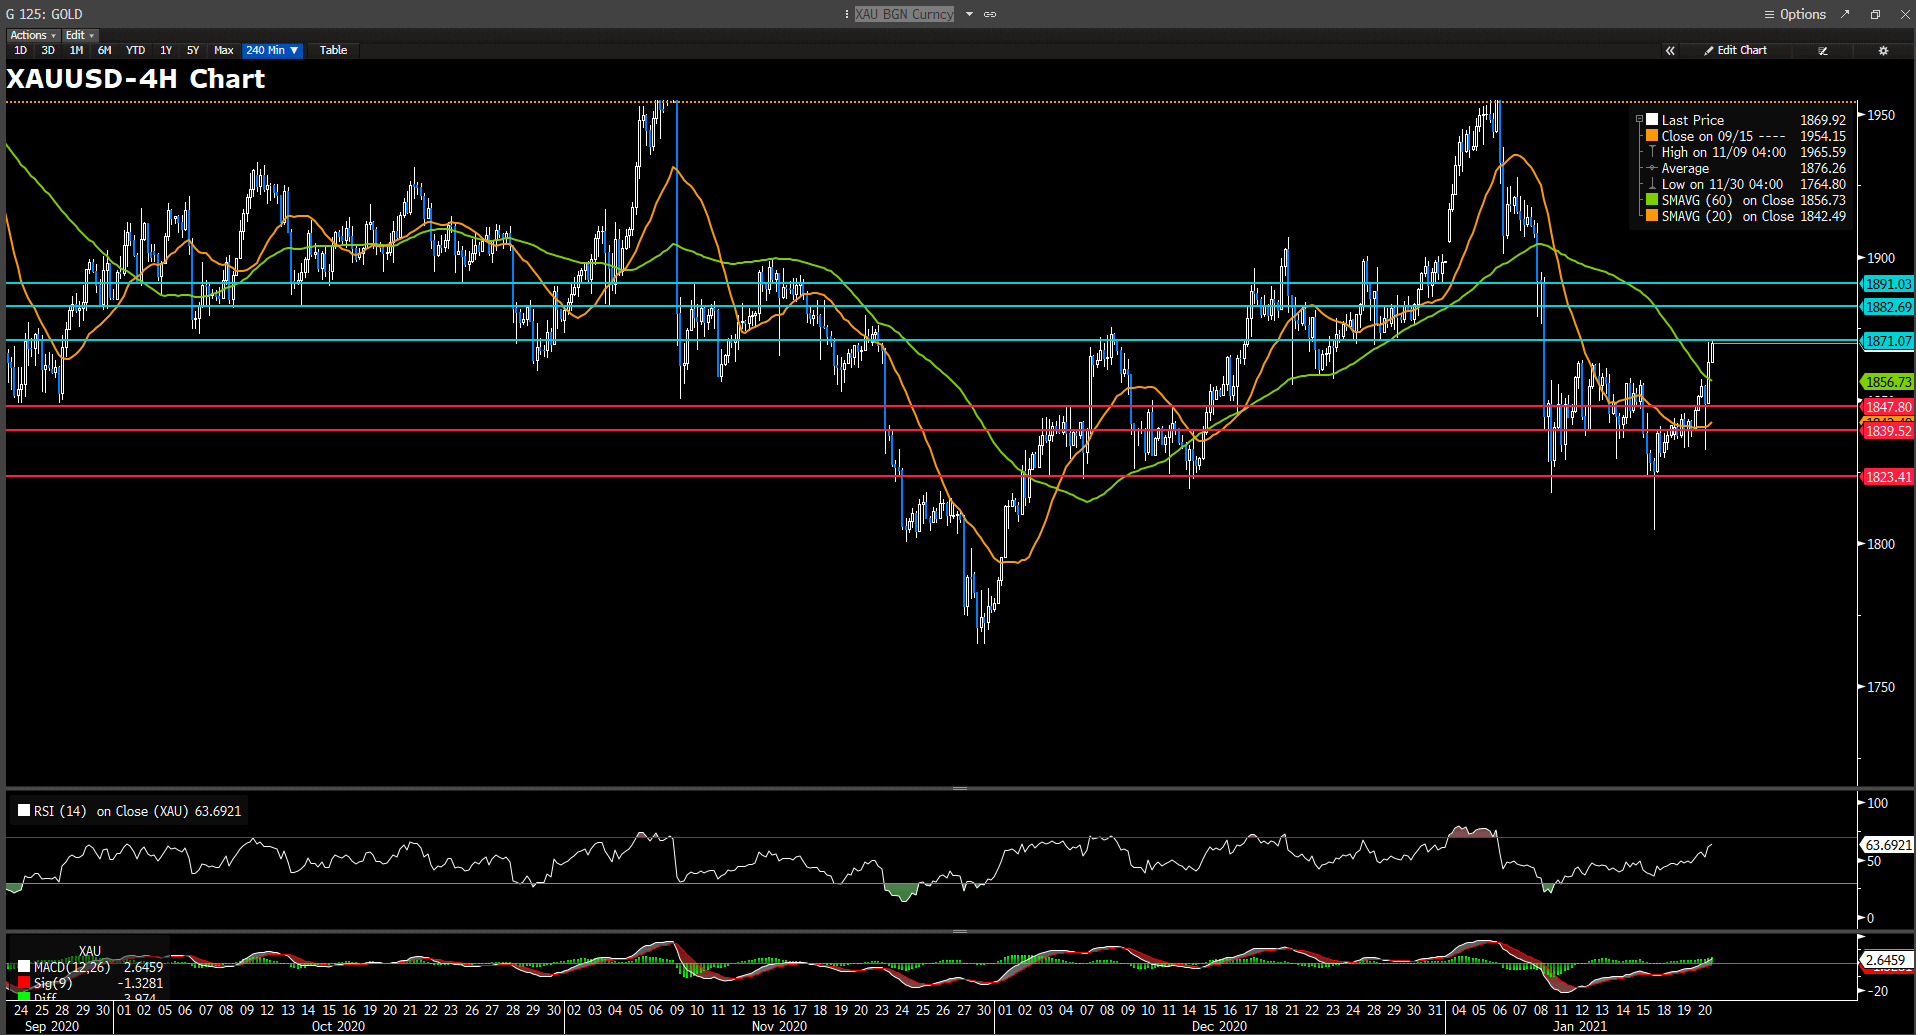
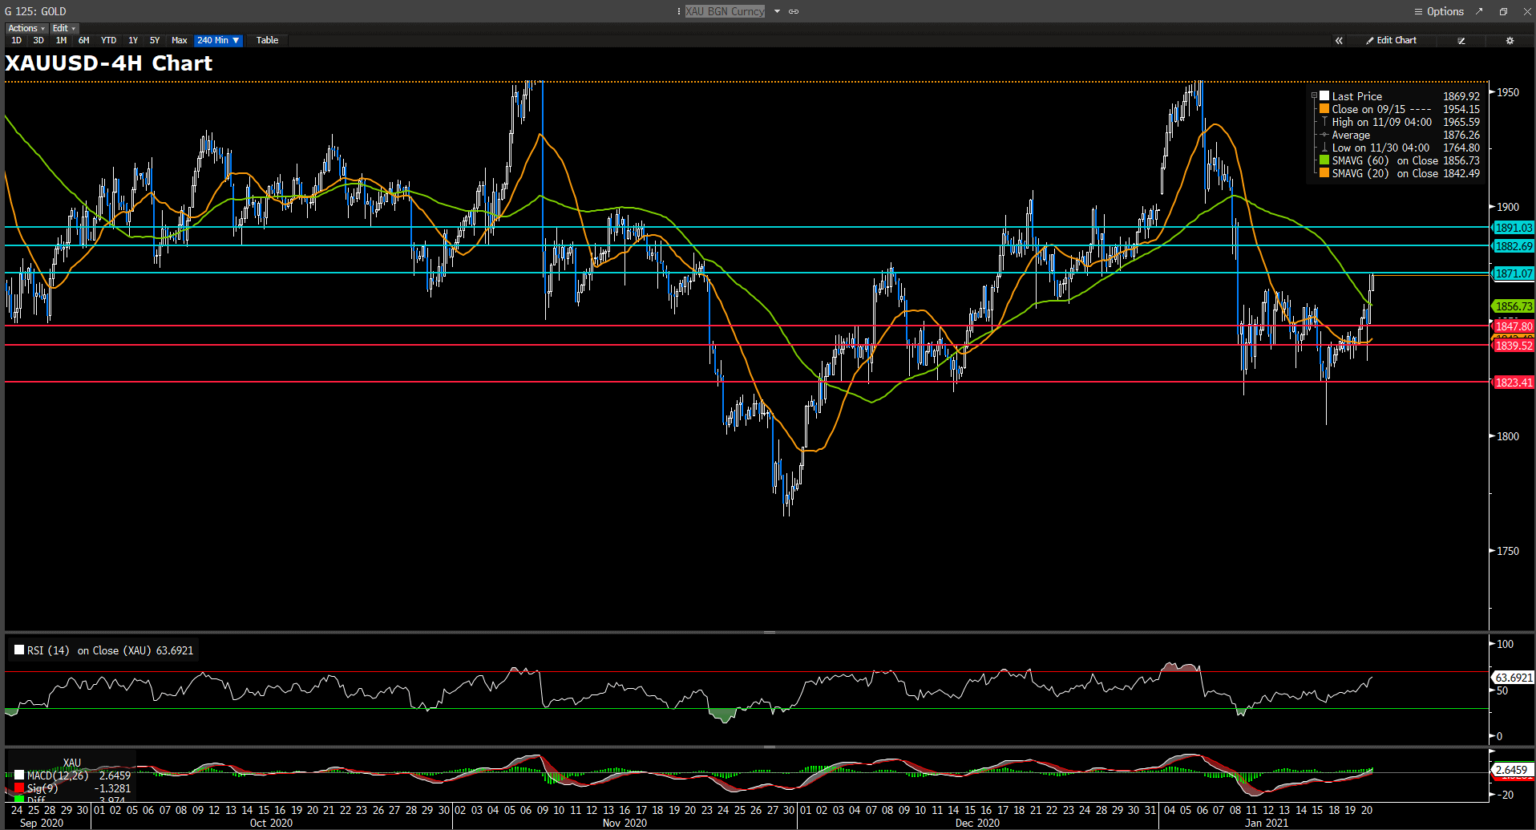
The gold experienced a drastic up-and-downs on Friday, interchanging its daily highs at $1875 to $1847 within an eight-hour span. The broad-based weakness of the greenback earlier today helped boost the XAUUSD, but upon the American session, the risk-averse sentiment immediately kicked off as all three major indexes in the US equity markets today had shown to slump approx. 2% at the time of writing. The change in the market sentiment subsequently increased the demand for the greenback and undermined the early surge of the yellow metal. Technically speaking, the gold is under a slightly bearish trend given that the 60-Day SMAVG has just staged a death-cross against the 20-Day SMAVG. However, because the RSI is now hovering around 50s, it is inferable that the market is trading XAUUSD on a neutral ground. That said, it would not be prudent to place additional short position on the XAUUSD pair before any confirmative signal settles as it seems like the market is now undecisive. On the upside, if the Gold resumes its bullish trend, the bulls will need a break above the $1875 level before they can cap their gains at $1891 price zone. On the downside, if the bears can dive below the $1851 cushion, the next support levels are $1840 and $1824.
Resistance: 1875, 1891, 1906
Support: 1851, 1840, 1824
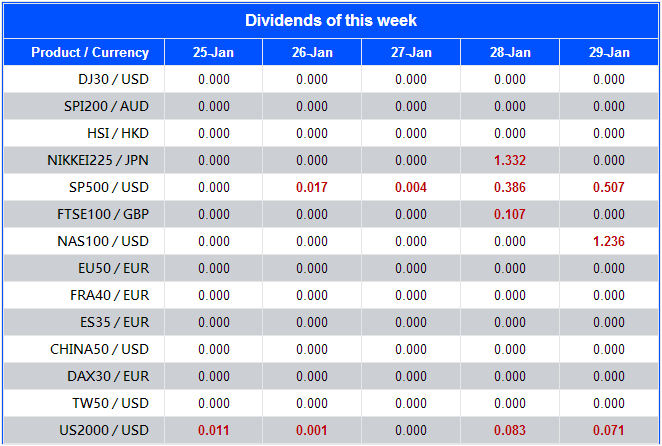
Economic Data
Click here to view today’s important economic data.
 Gold market has tamped down to day-low amid the greenback ticked up once few days high, even 10 years Treasuries yield slid. It seems like pair is having quite difficult for upward momentum. the pair is testing consolidation range between 1859.2 and 1842.8.