Daily Market Analysis
Market Focus
US equity market is refreshing highs on brightening prospects for a robust stimulus package. The S&P 500 Index once hit 3900 after Treasury Secretary Janet Yellen said the US can return to full employment in 2020 with a robust federal paycheck. Meanwhile, Dow Jones Industrial Index extended its rally to six days, also breaking record high of 31263 points. House Democrats released its first draft for the relief bill on Monday. The first committee vote on elements of Biden’s $1.9 trillion relief package begin on Tuesday.
Coronavirus infections continued to slow as countries are pushing for their vaccine rollouts across the globe, more than 131 million shots were given worldwide. There appears to be another virus mutation in South Africa, patients suffers mild symptom from the new variant. AstraZeneca Plc said they are working on a new shot to combat the South African strain.
Bitcoin gained huge traction and soared to $44860 on Monday as Tesla announced they invested $1.5 billion in the leading cryptocurrency. More importantly, it also said that it will accept Bitcoin as a form of payment in the future.
Market Wrap
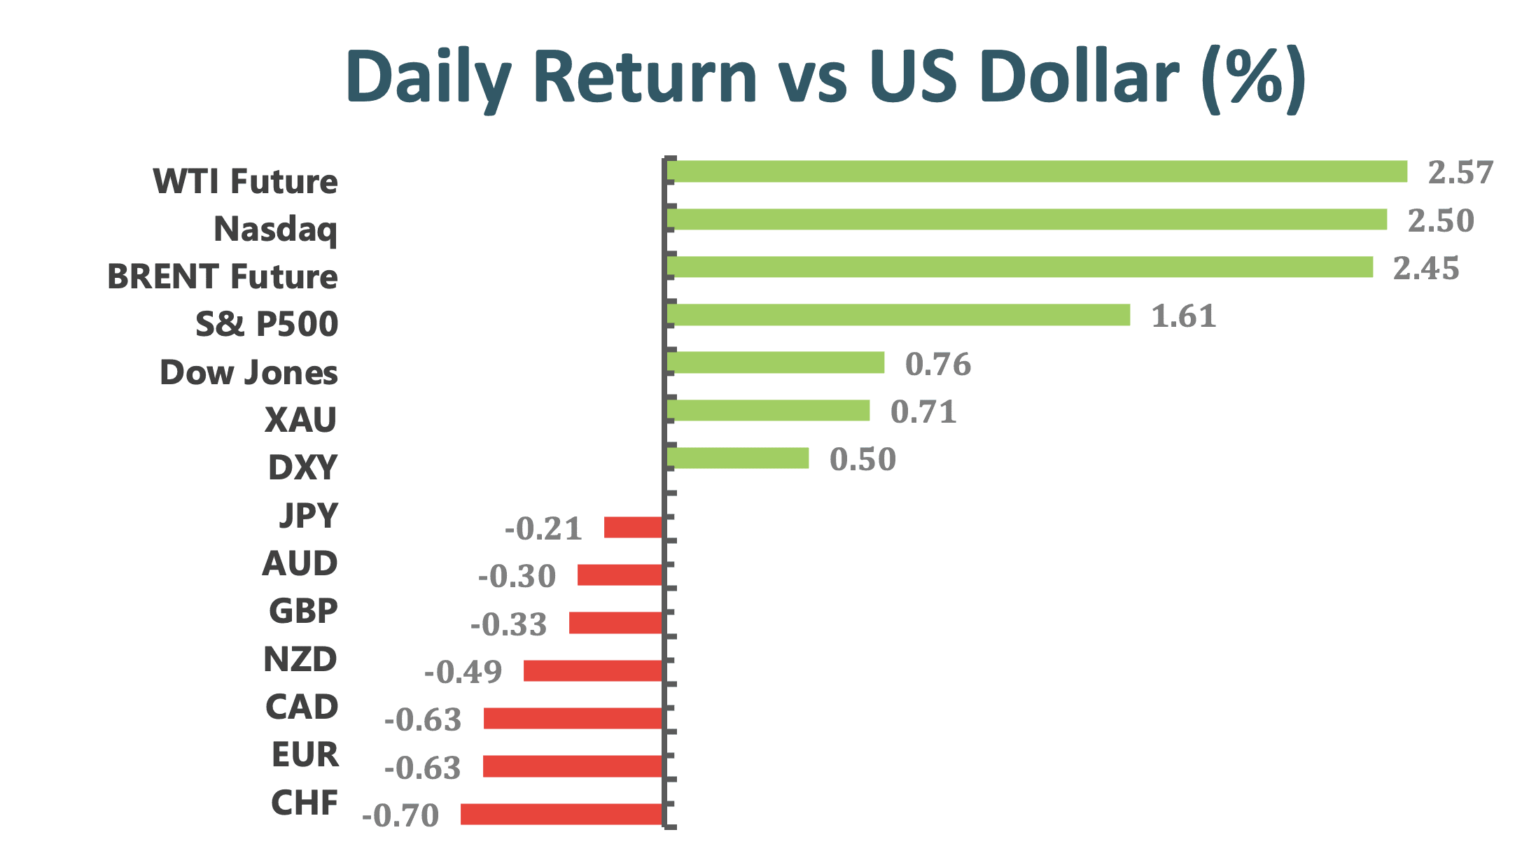
Main Pairs Movement
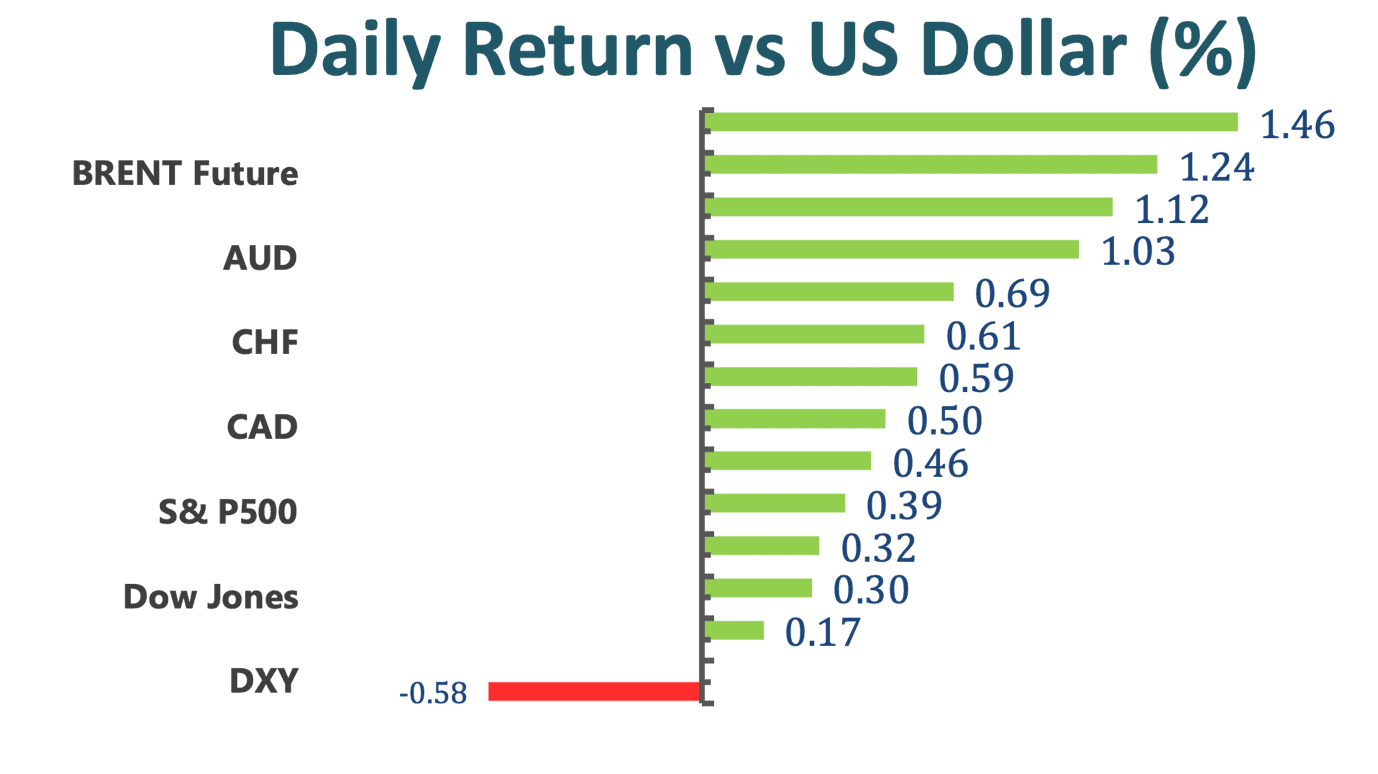
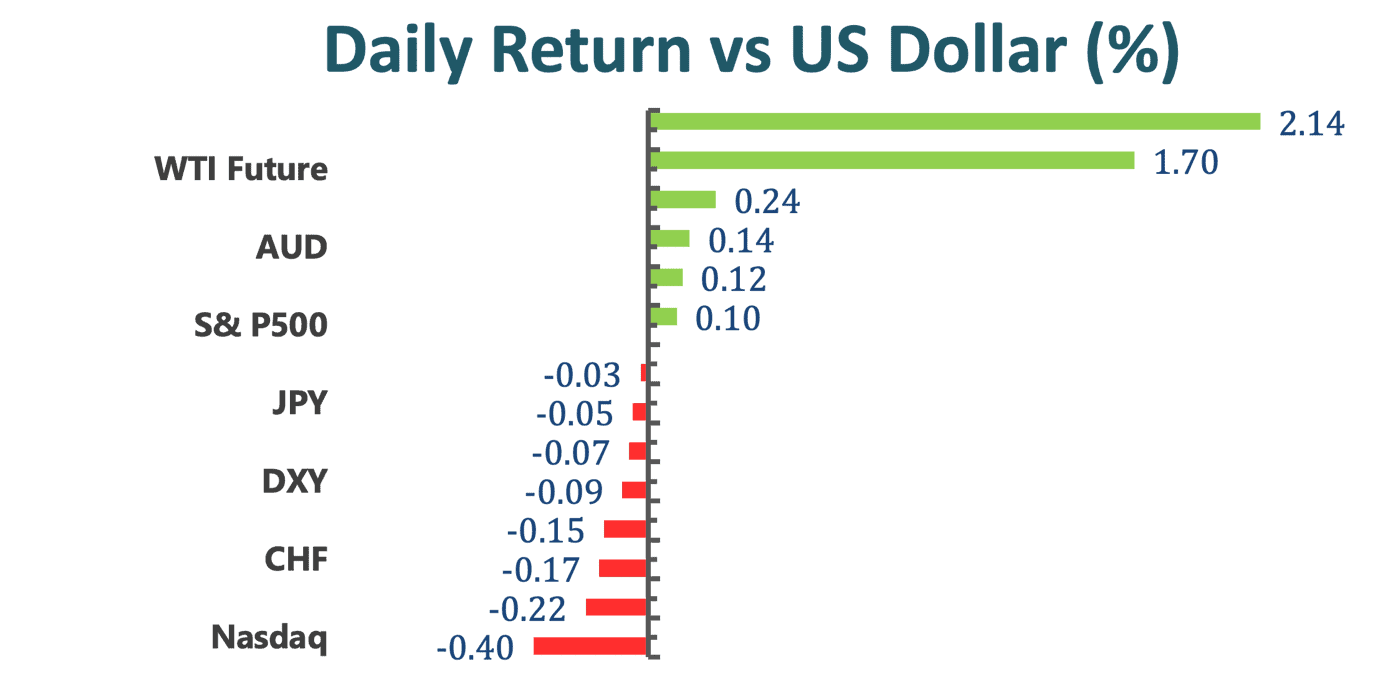
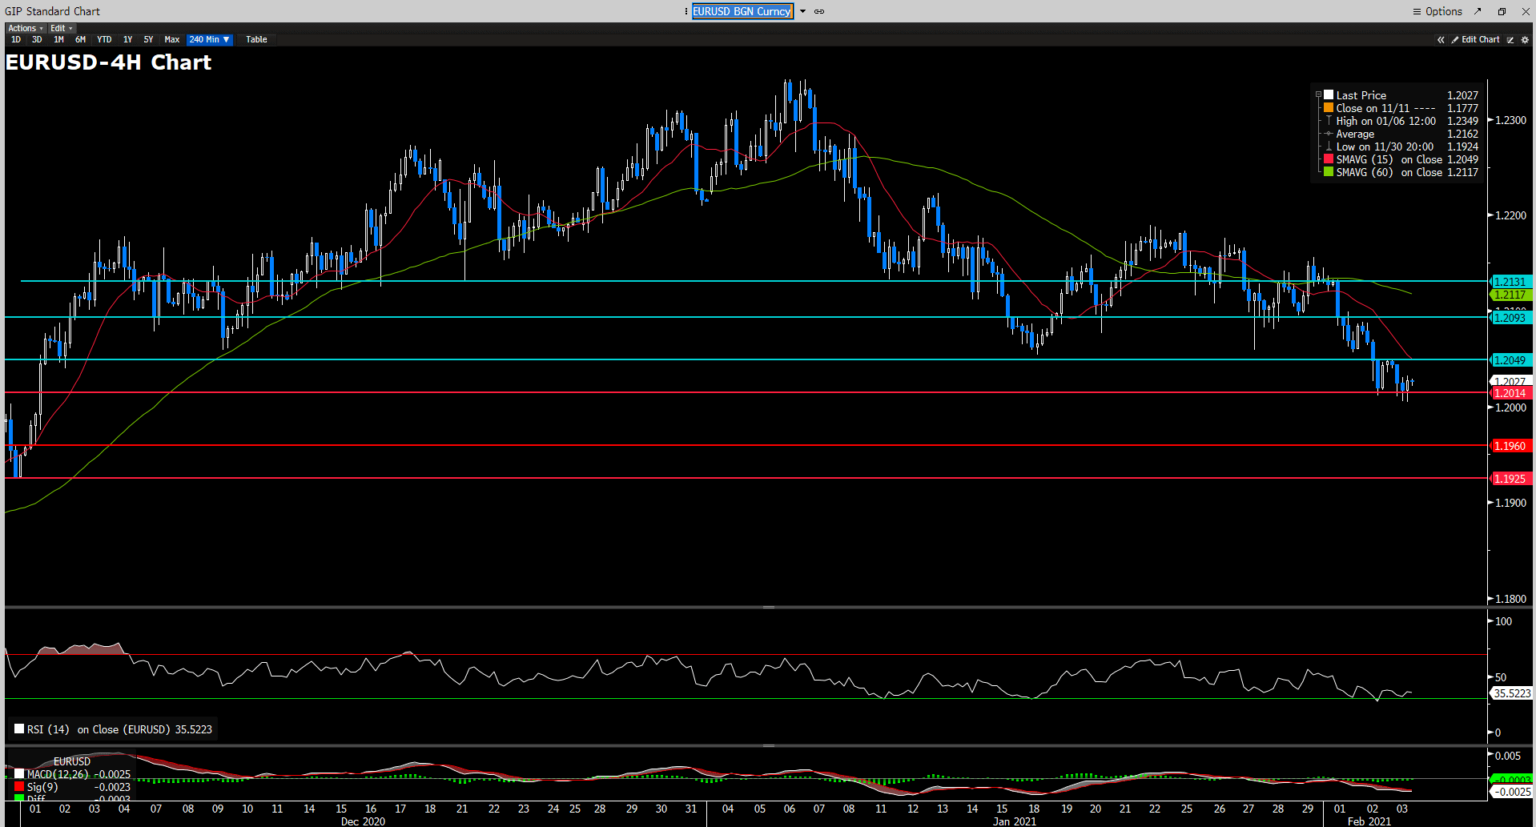
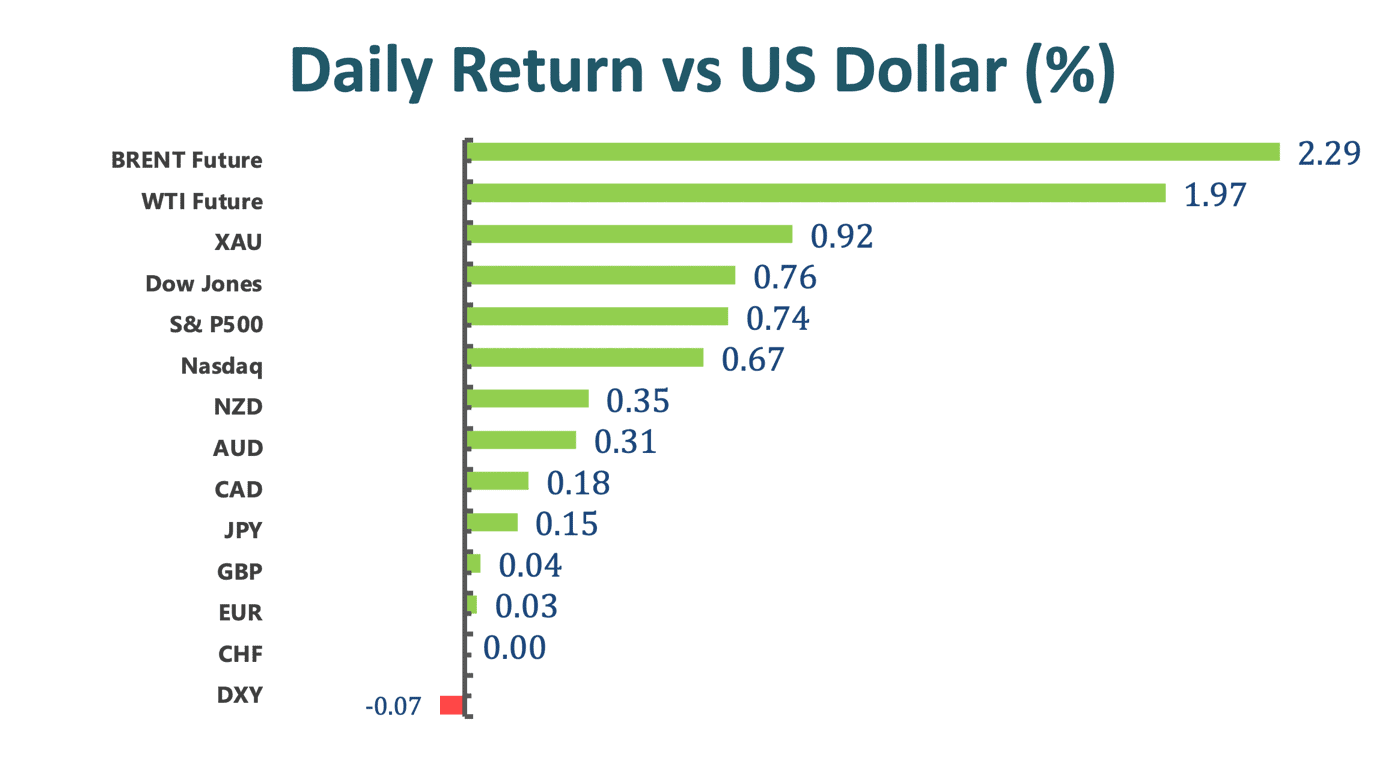
Euro-dollar is little motivated at the start of the week, closed the day up 0.05%. The US greenback was on the back foot against most of its G-10 peers, the dollar index slipped 0.11%. US 10-year treasury yield once hit 1.2%, its highest levels since March 2020.
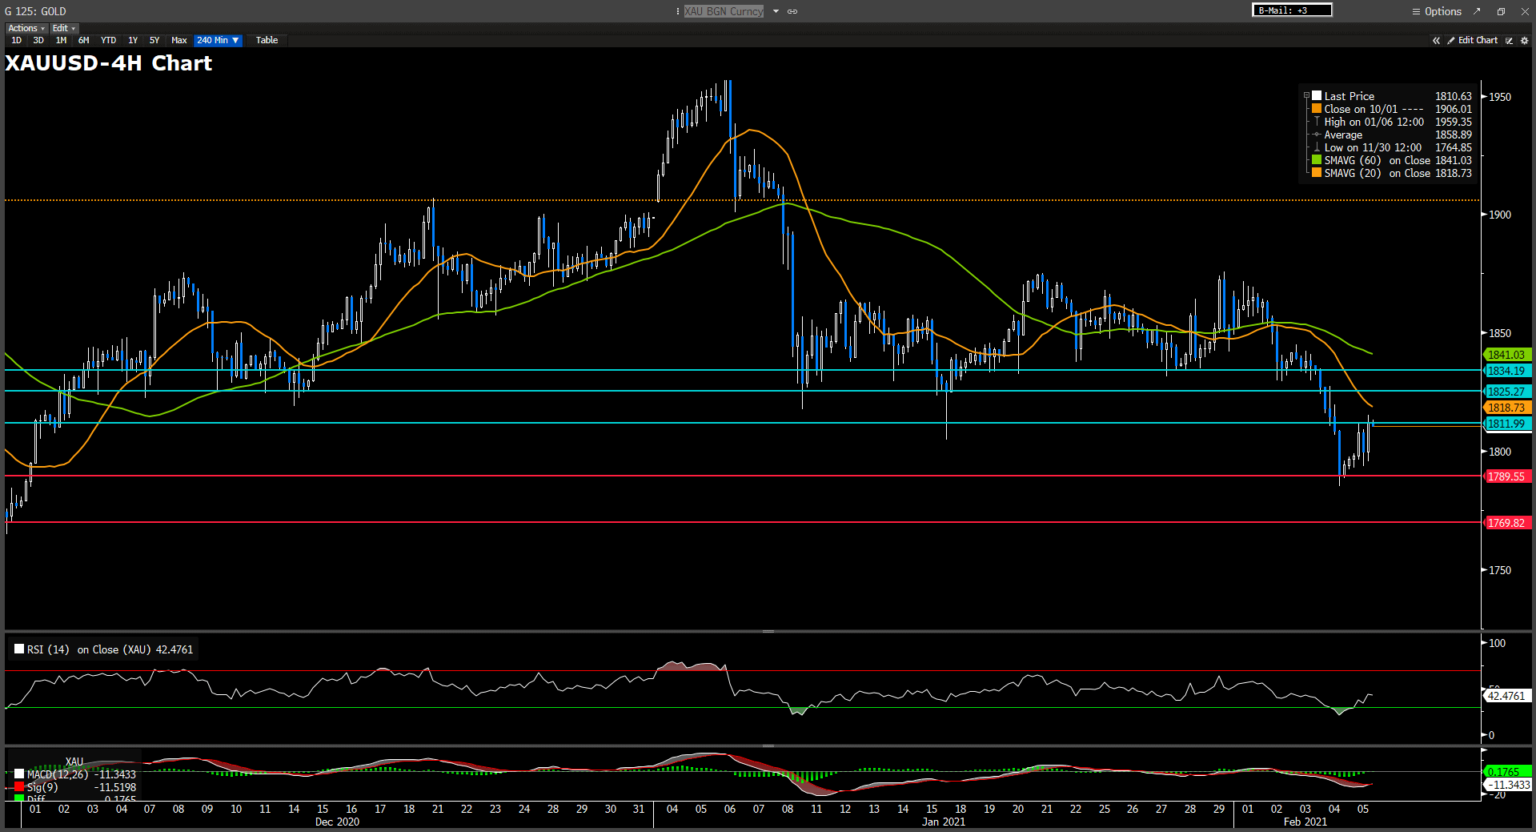
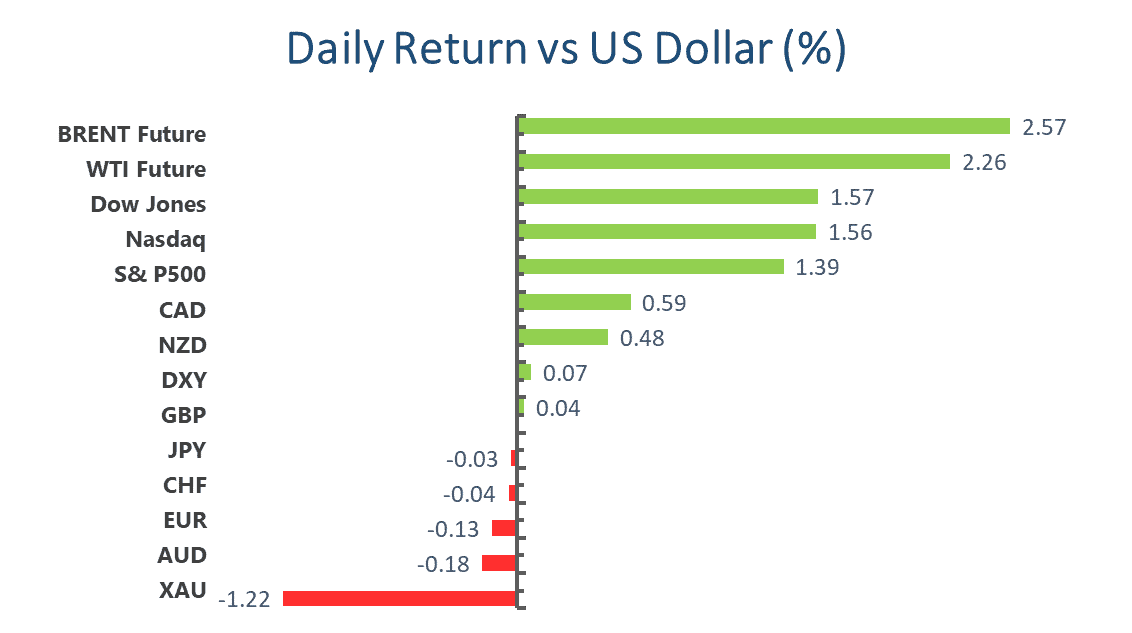
Gold extended its recovery after investors dumped 2.2% last Thursday, rallied 0.92% near market close. Last week’s plunging has prompted some dip-buying around $1806. Surging copper price also help the precious metal to regain some ground, copper’s future spiked 3.34% in the past two trading days.
Cable pared all of its loss after North America session started price was essentially unfazed. Denial of the negative interest rate from BoE continues to underpin the Sterling. It also benefited from successful vaccination rollout program compare to other developed nation. So far, the country has vaccinated 17% of its population, nearly doubling the US figure.
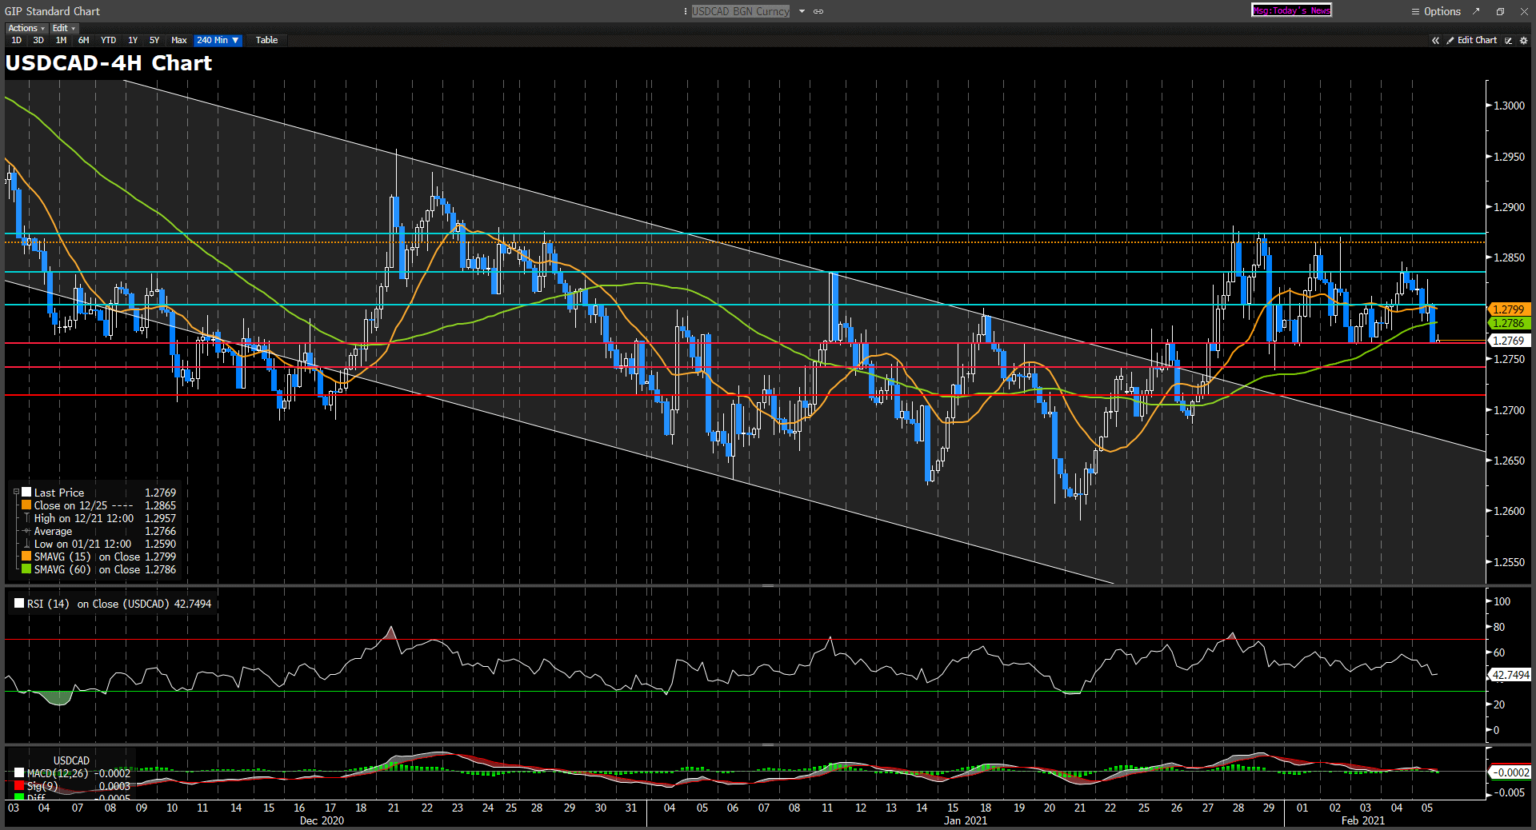
The Canadian dollar gained 0.18% against the US dollar amid rebounding oil price, the Brent oil advanced above $60 a barrel for the first time in more than a year.
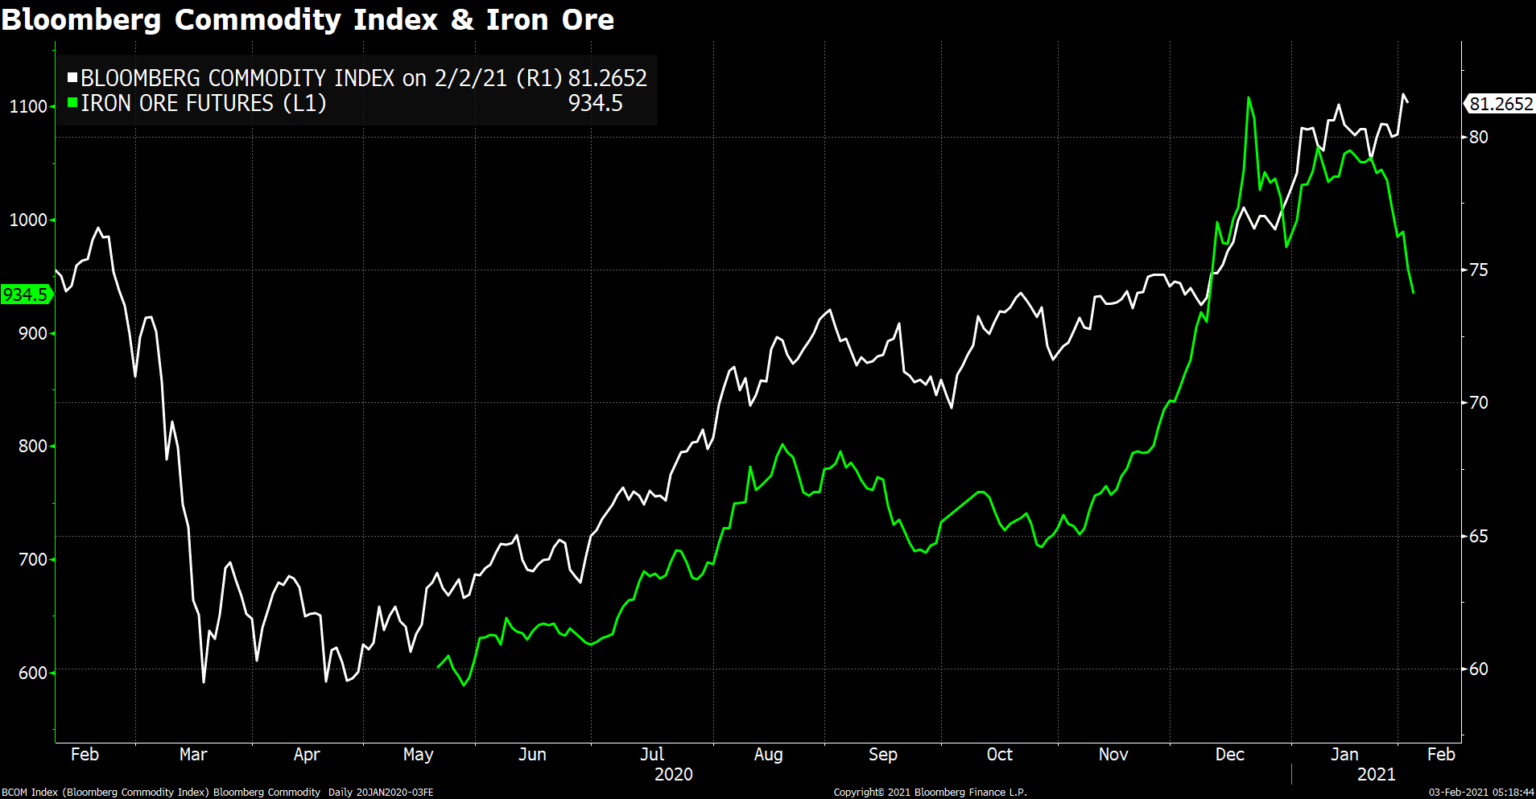
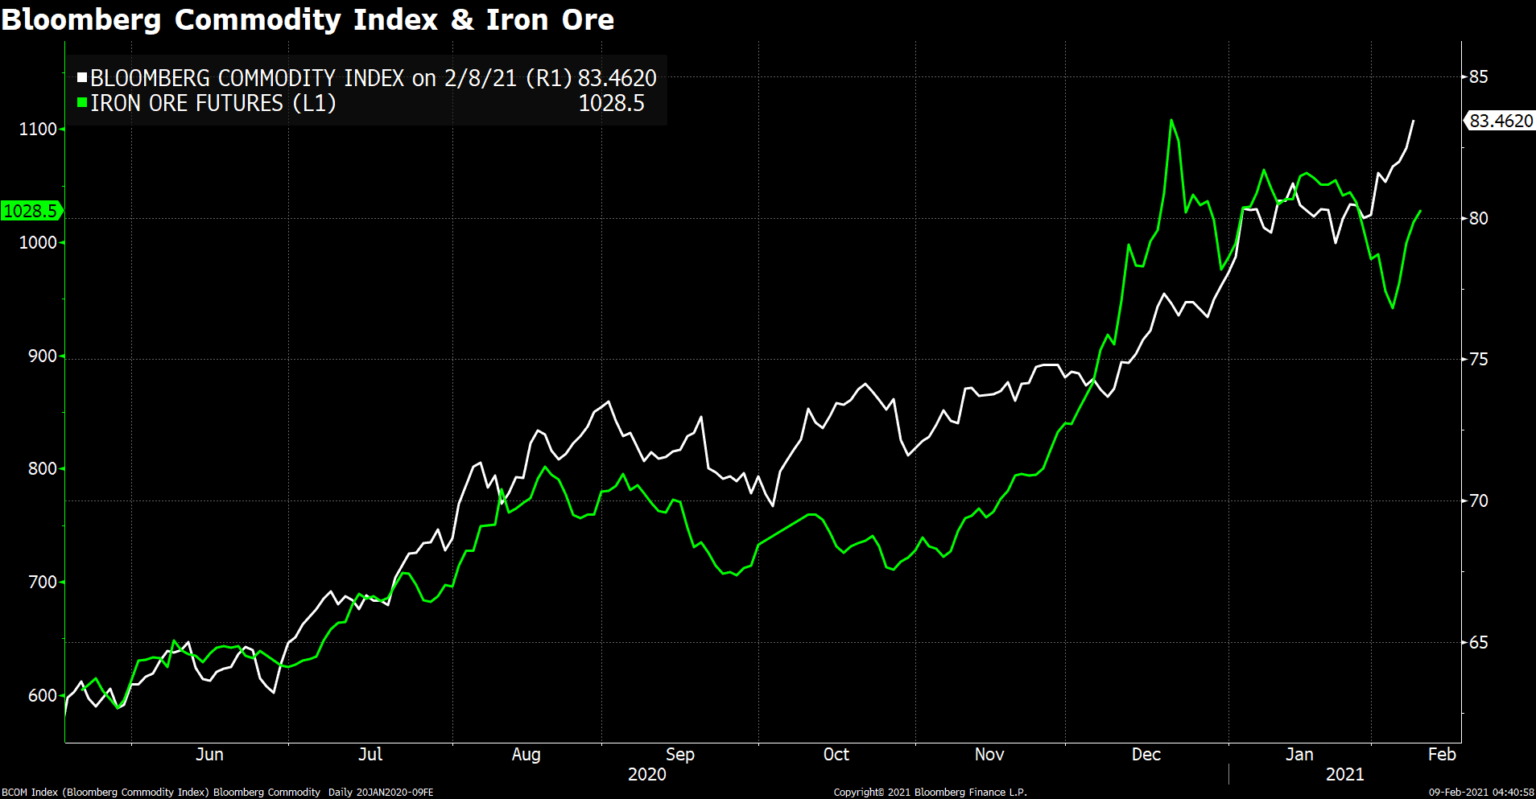
Aussie and Kiwi were the best performers in the G-10 space, rallied 0.31% and 0.35% respectively. The antipodean currencies were supported by renewed risk appetite and rising commodity prices. Iron Ore futures have spiked 5.2% in the past four trading days. Meanwhile, Bloomberg commodity index climbed to highest level since December 2018.
Technical Analysis:
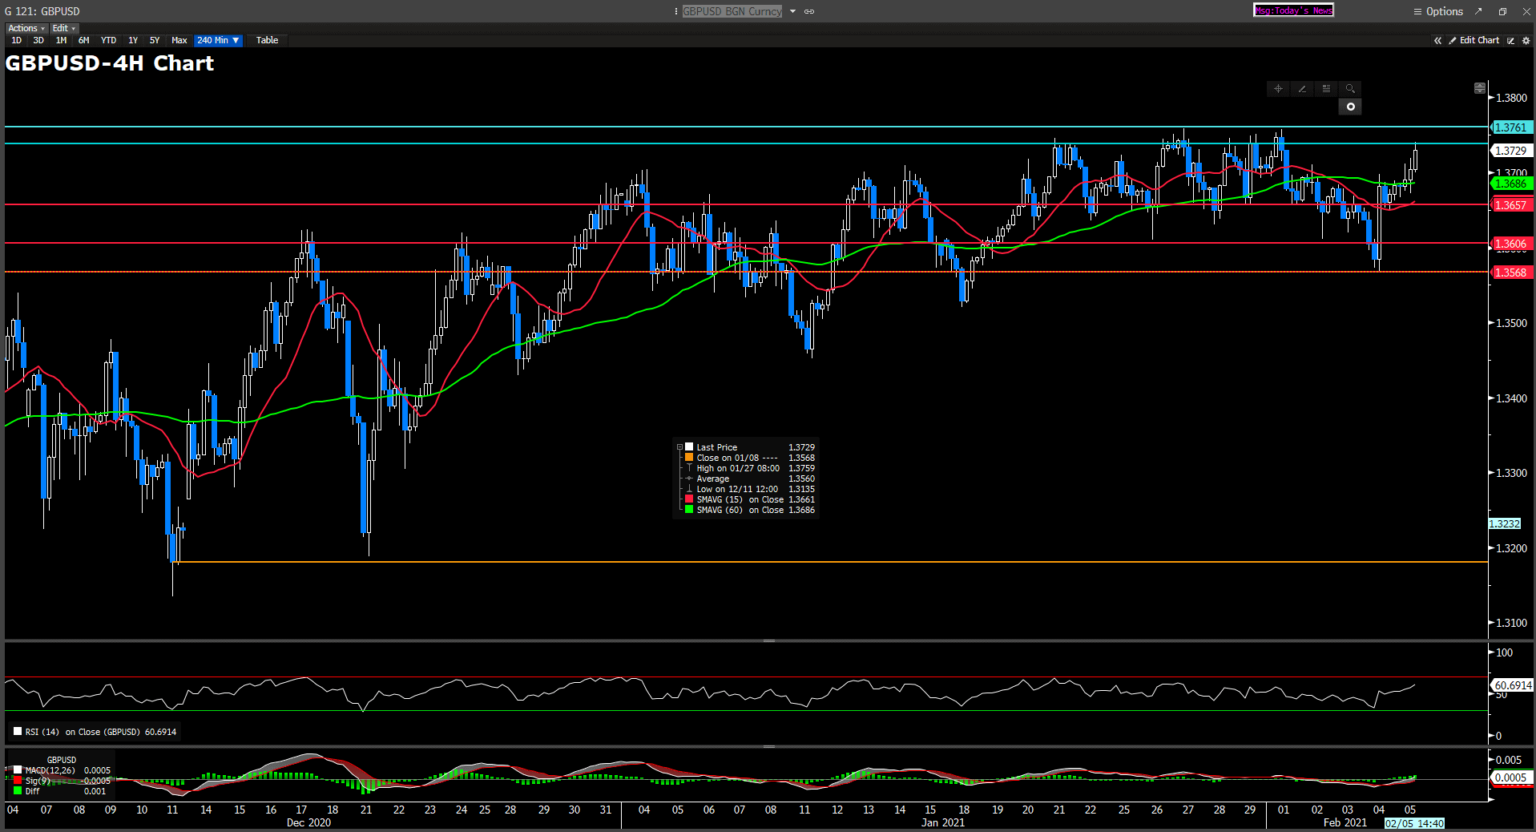
GBPUSD (Daily Chart)
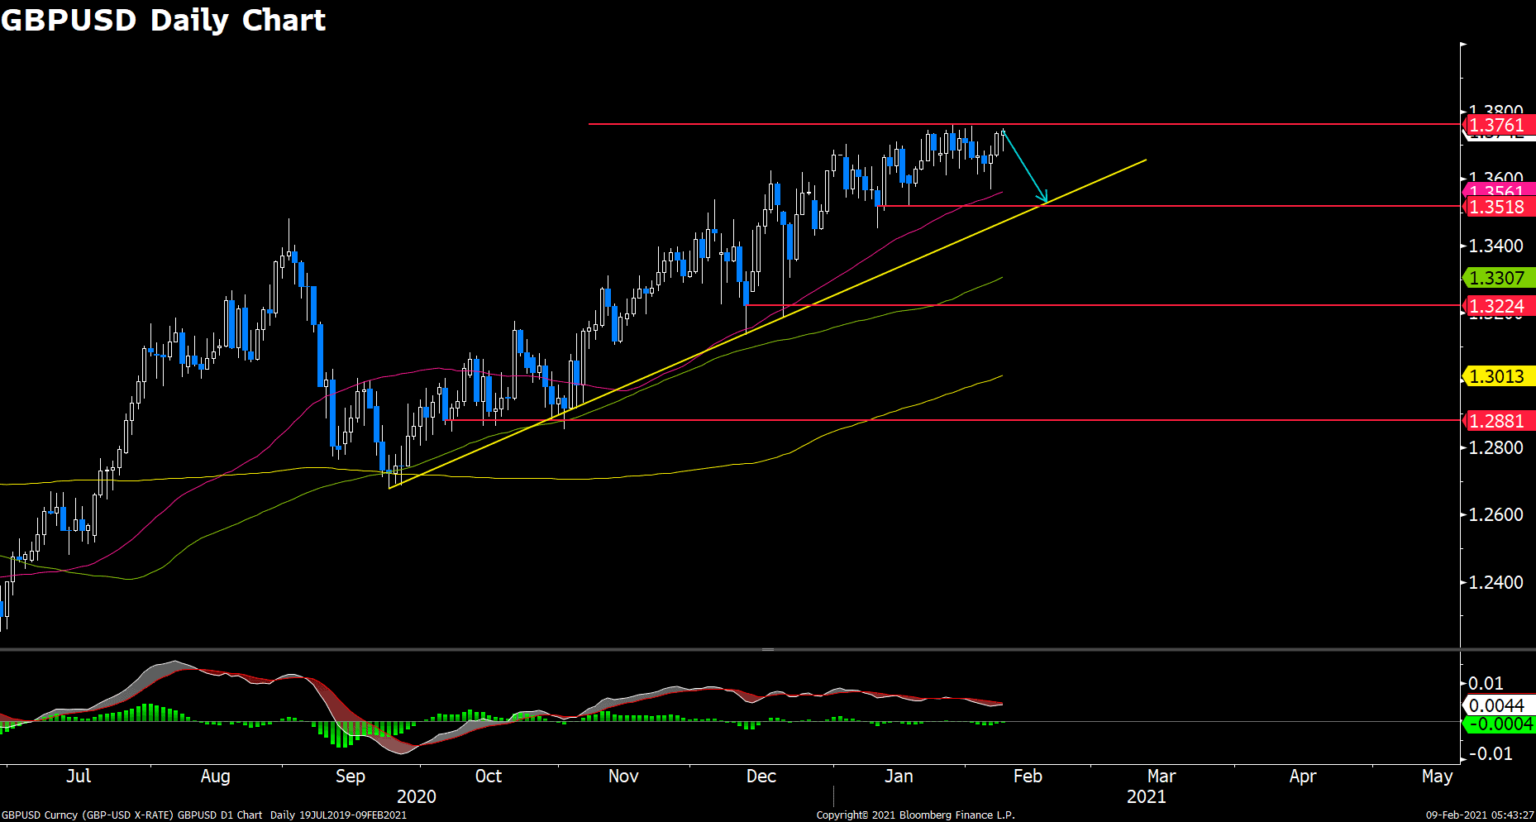
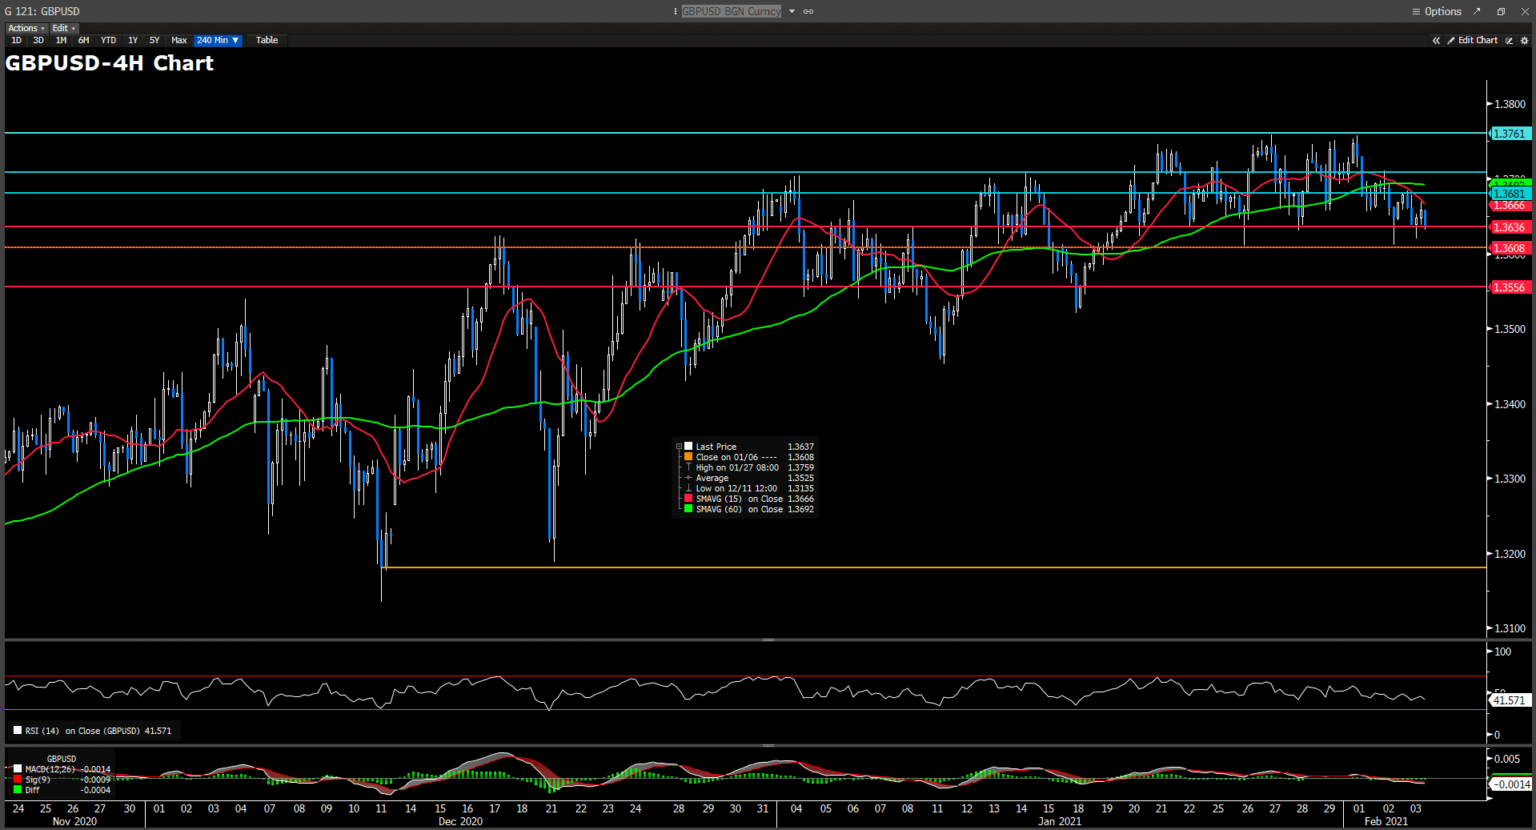
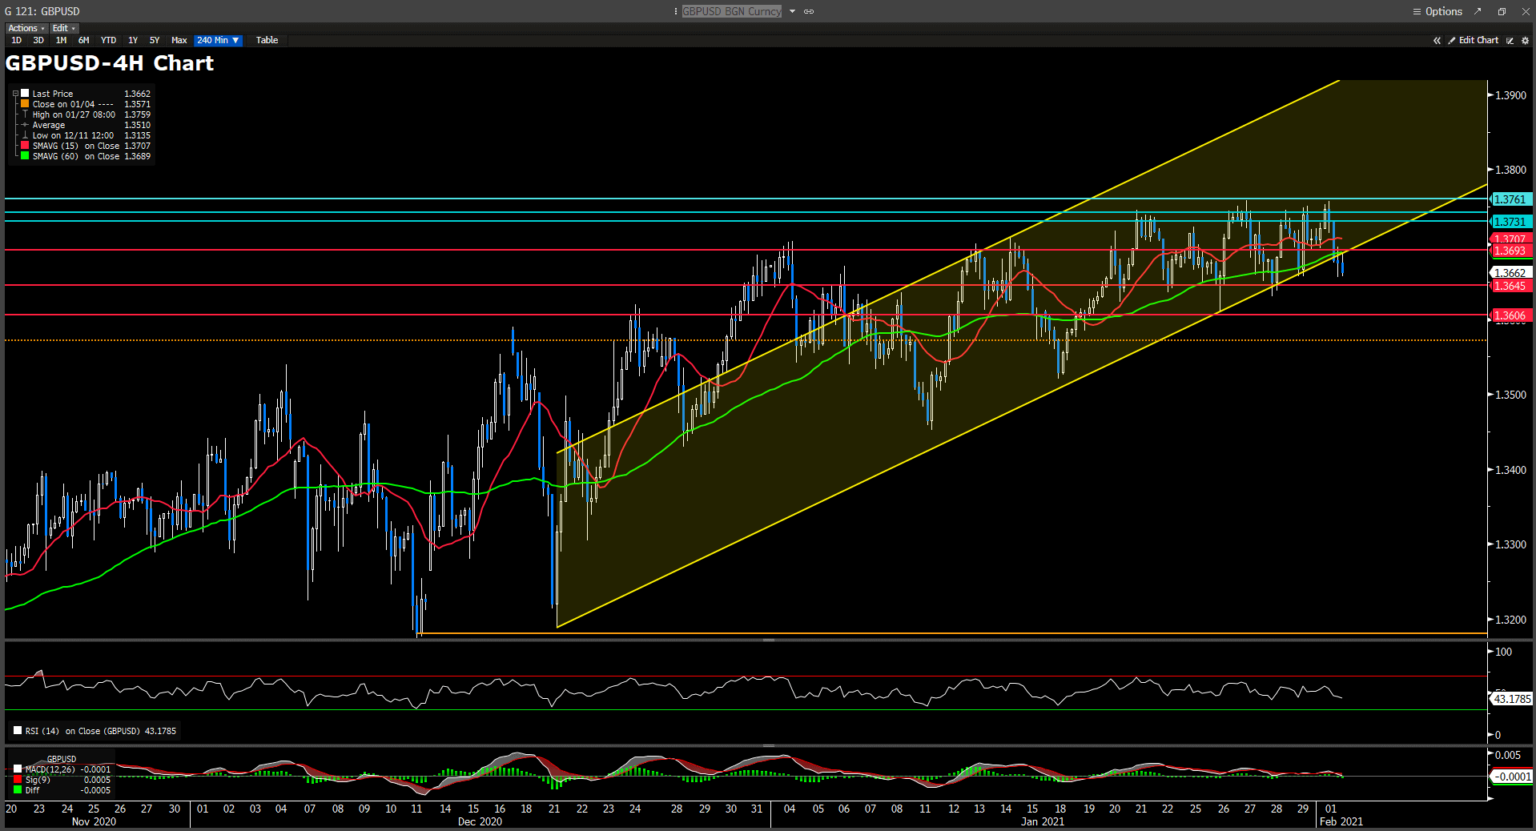
Cable is running into a stubborn resistance around 1.376, which it has failed to conquer in the last three weeks. The pair may struggle to find demand amid recovering US dollar. Intersection between the long term ascending trendline and horizontal support line at 1.352 looks like a good place to retreat if the bulls run out of steam. On the upside, UK’s leading vaccine rollouts could probably lend some strengths to the Pound to break the immediate resistance. Some follow through buying power will push price to 1.3807, highest price not seen since April 2018.
Resistance: 1.376, 1.3087
Support: 1.352, 1.322
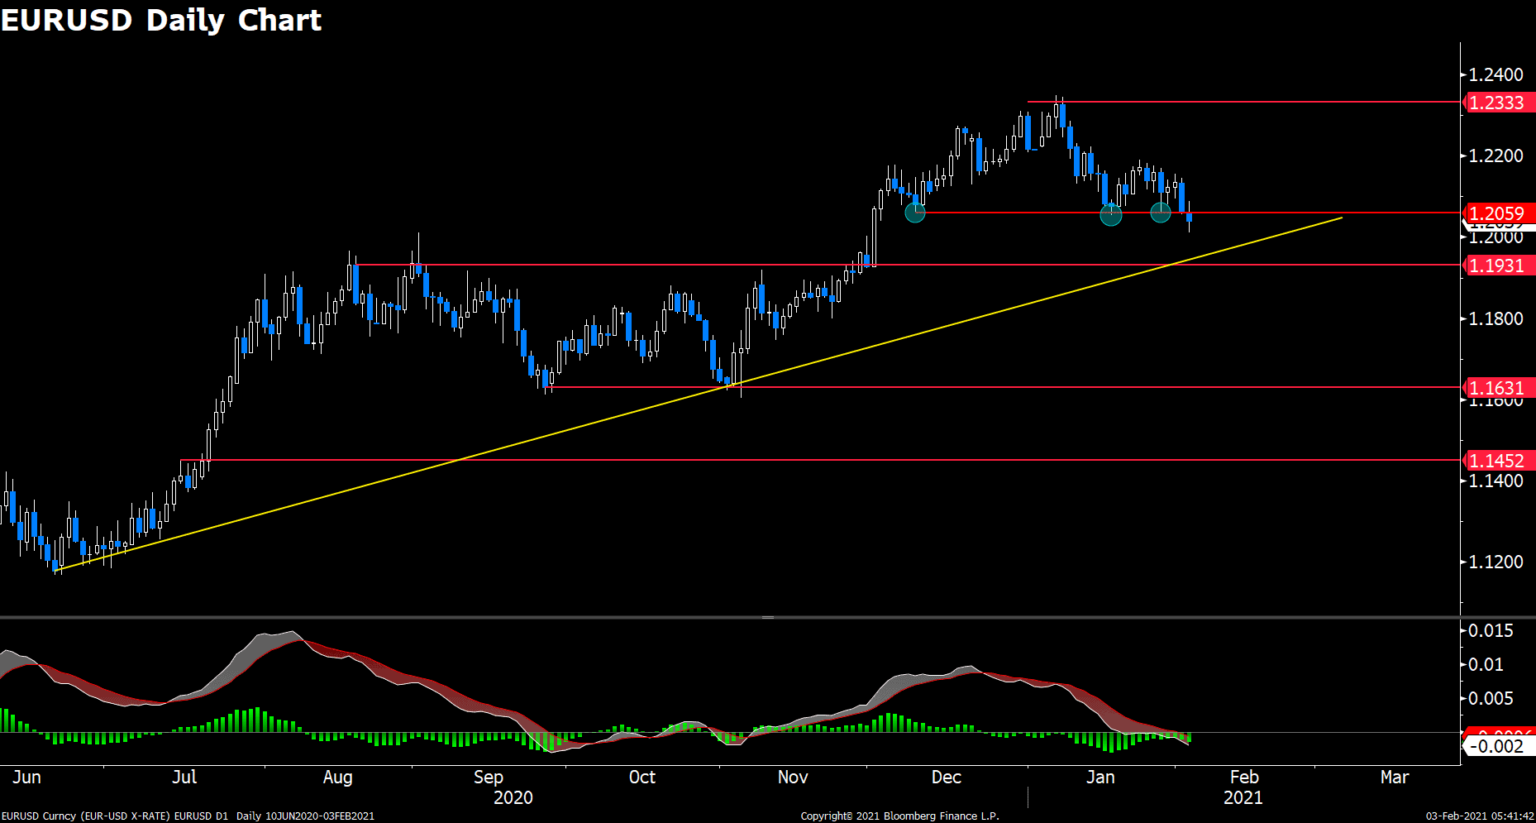
EURUSD (Daily Chart)
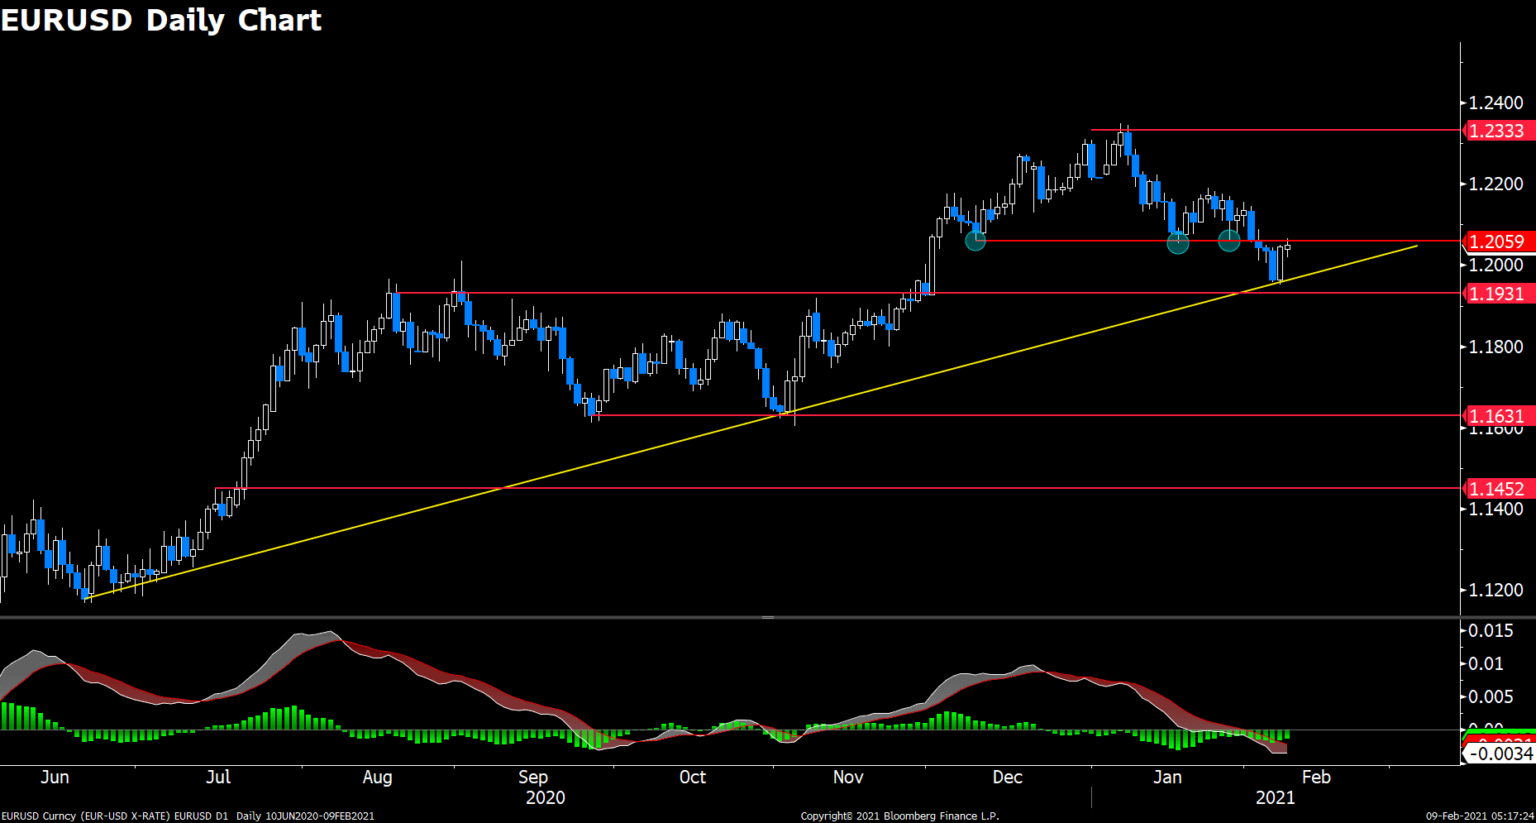
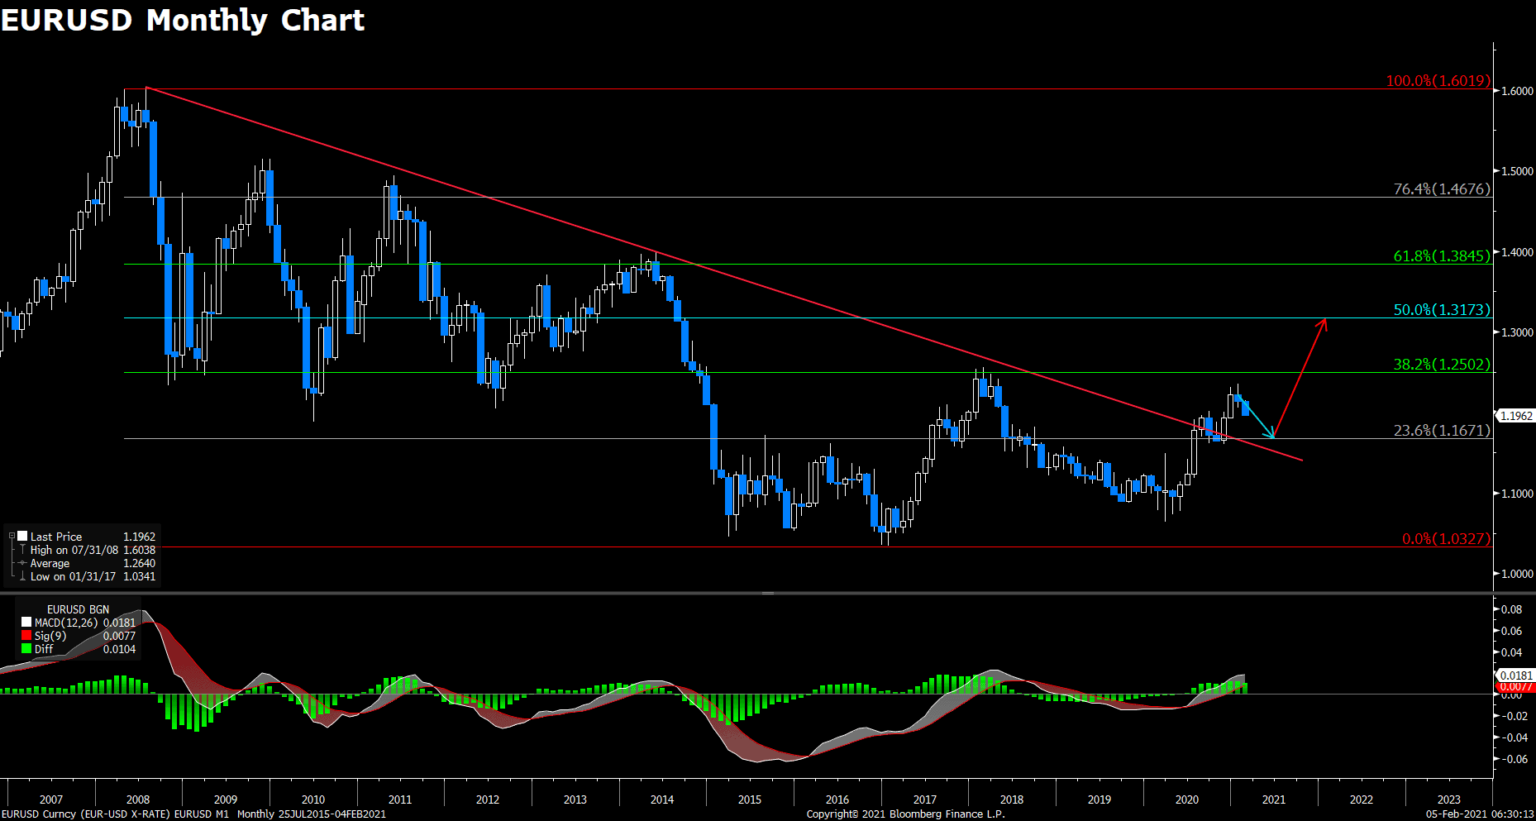
Euro-dollar bounced upon touching the yellow ascending trendline, but failed to overcome previous resistance of 1.206. It will be interesting to see how price could maneuver in such narrow range. If bidders could manage to regain 1.206, then this pair will find itself back into the bullish trend. However, failed to defend the upward trendline will open doors for wide downside space, which has not been touched since last November. MACD on the daily chart favors the bears, which in turn boost possibilities for a bearish run.
Zooming out to the monthly chart, a retreat towards 23.6% Fibonacci at 1.167 looks quite plausible. Such healthy retreat could be beneficial to long-term bidders as more money printing from the Biden’s administration will continue to favor the so-called reflation trades in 2021.
Resistance: 1.2803, 1.2835, 1.2873
Support: 1.2765, 1.2741, 1.2714
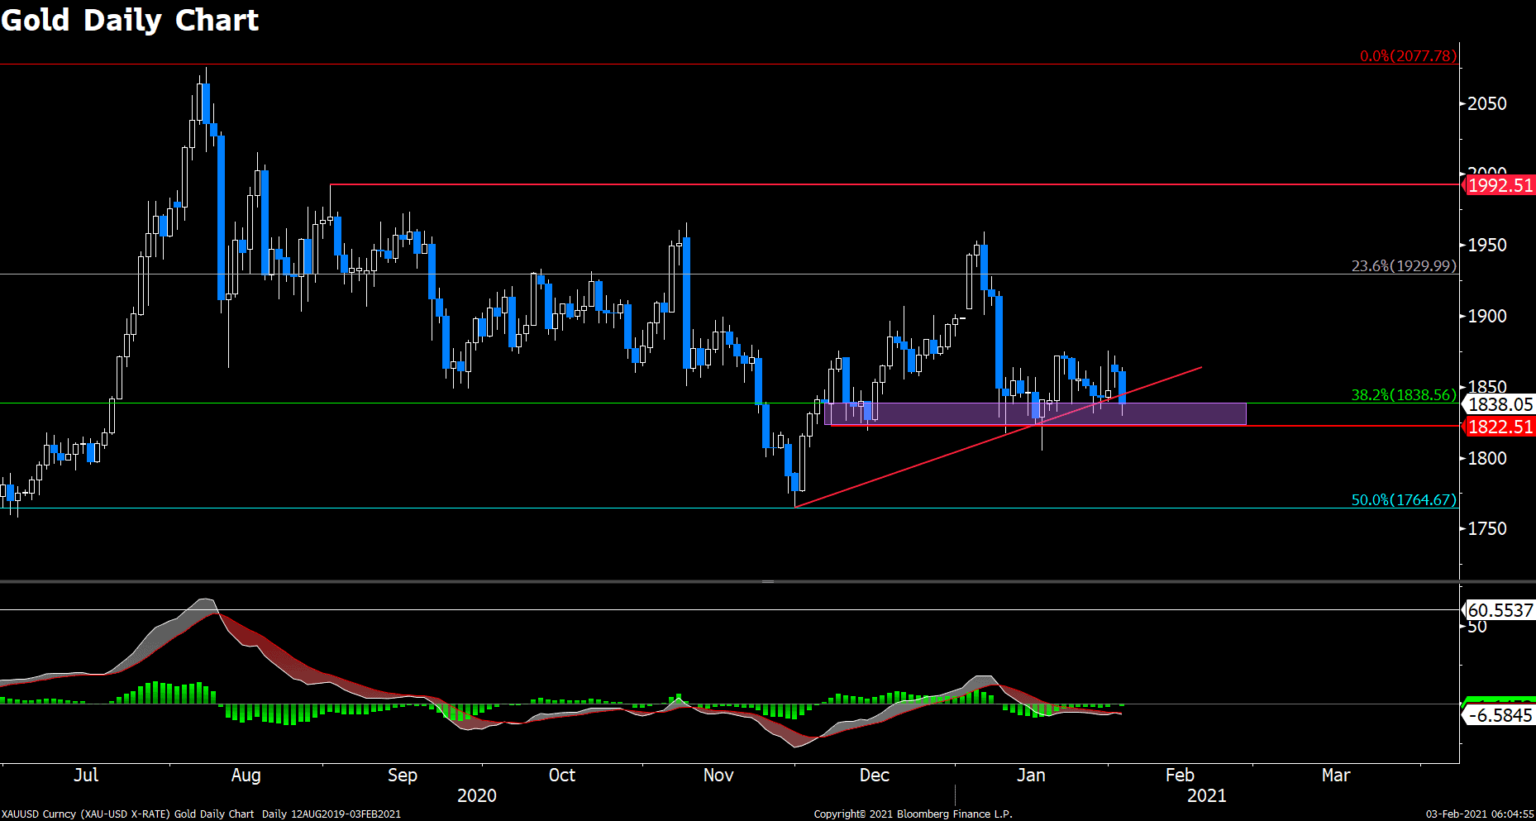
XAUUSD (Daily Chart)
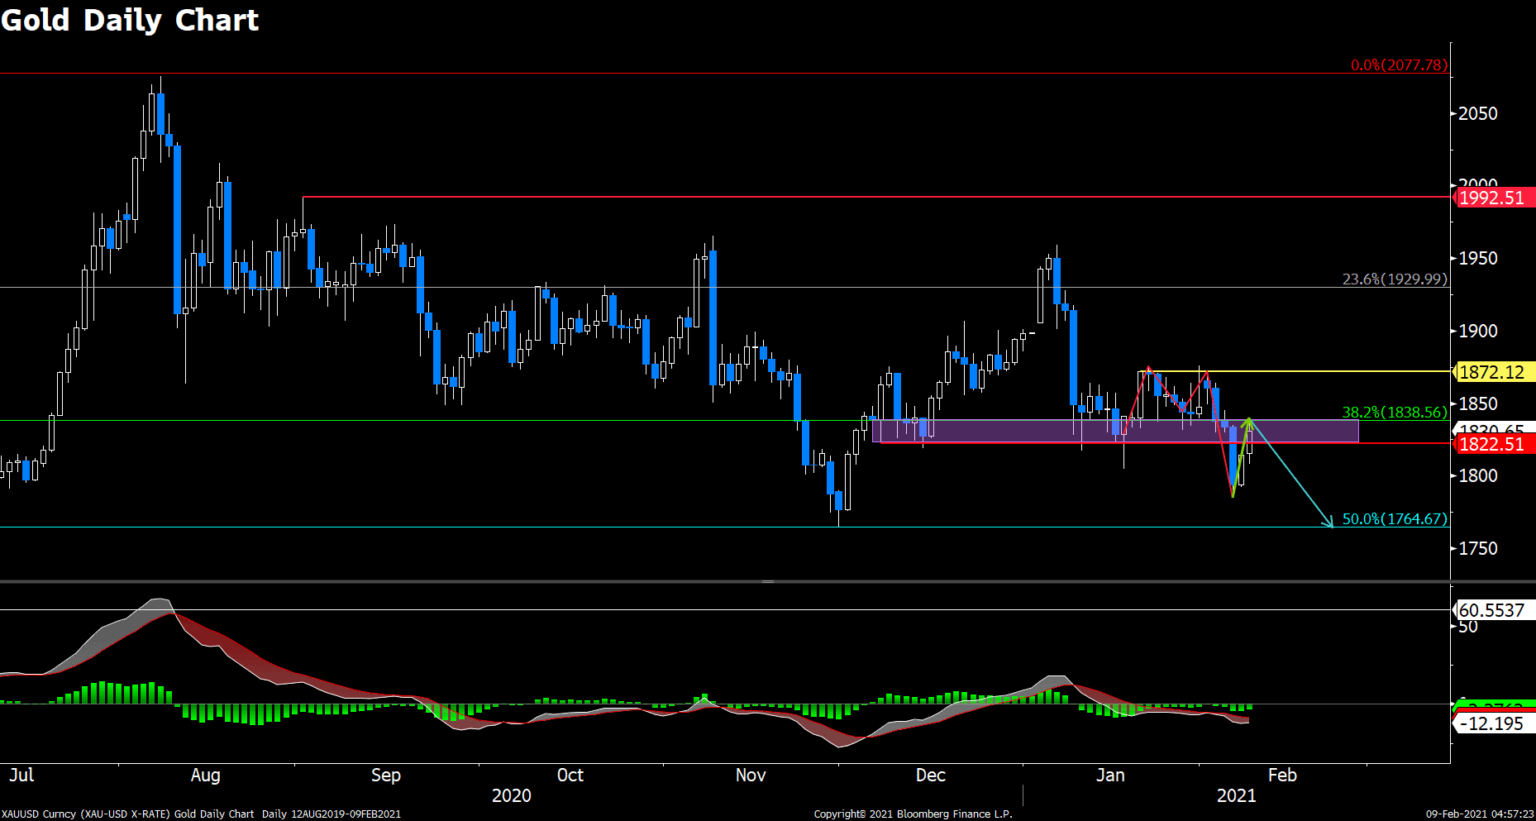
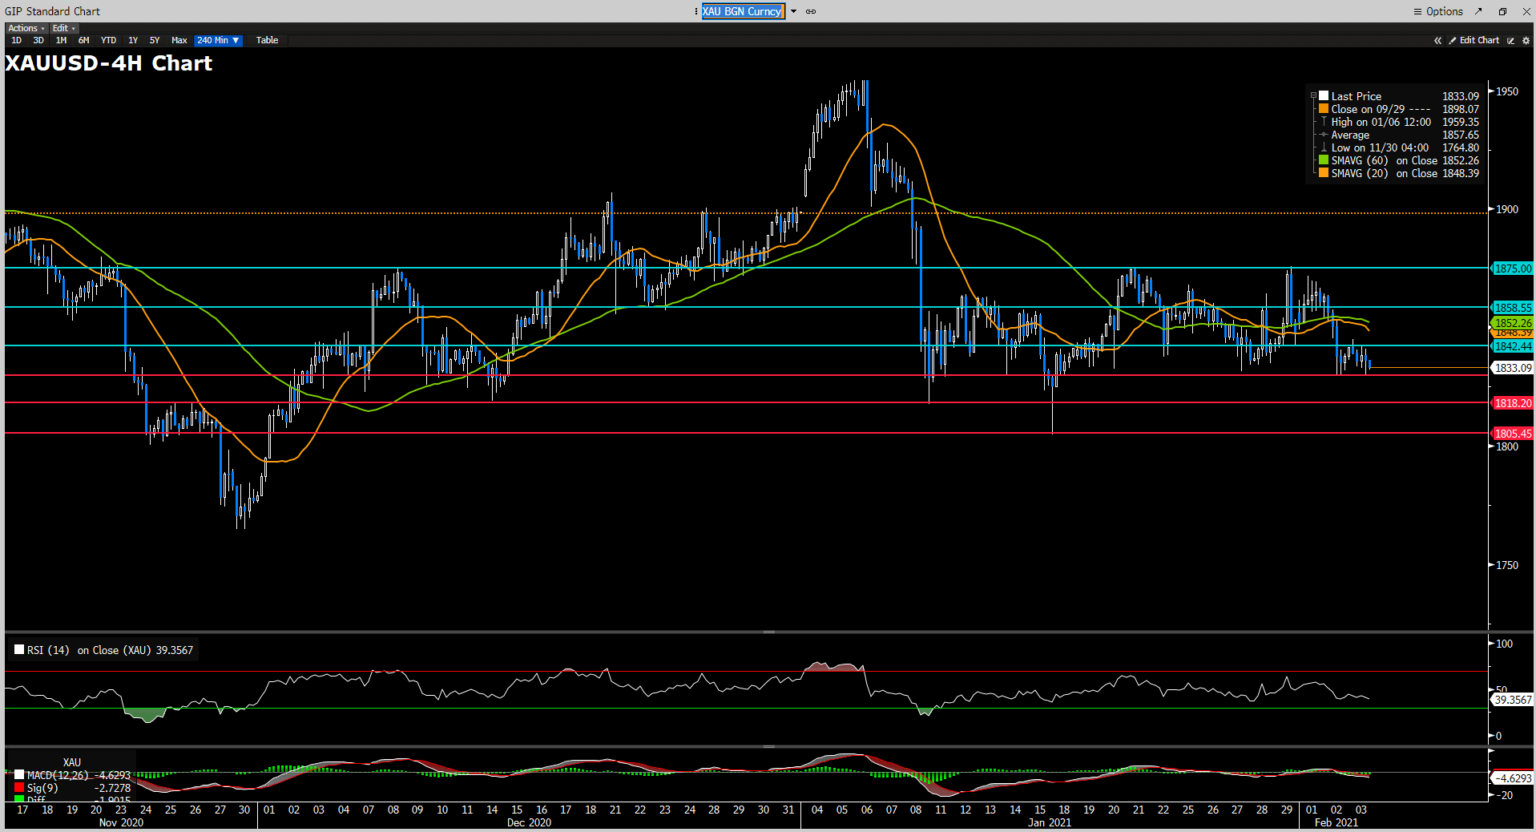
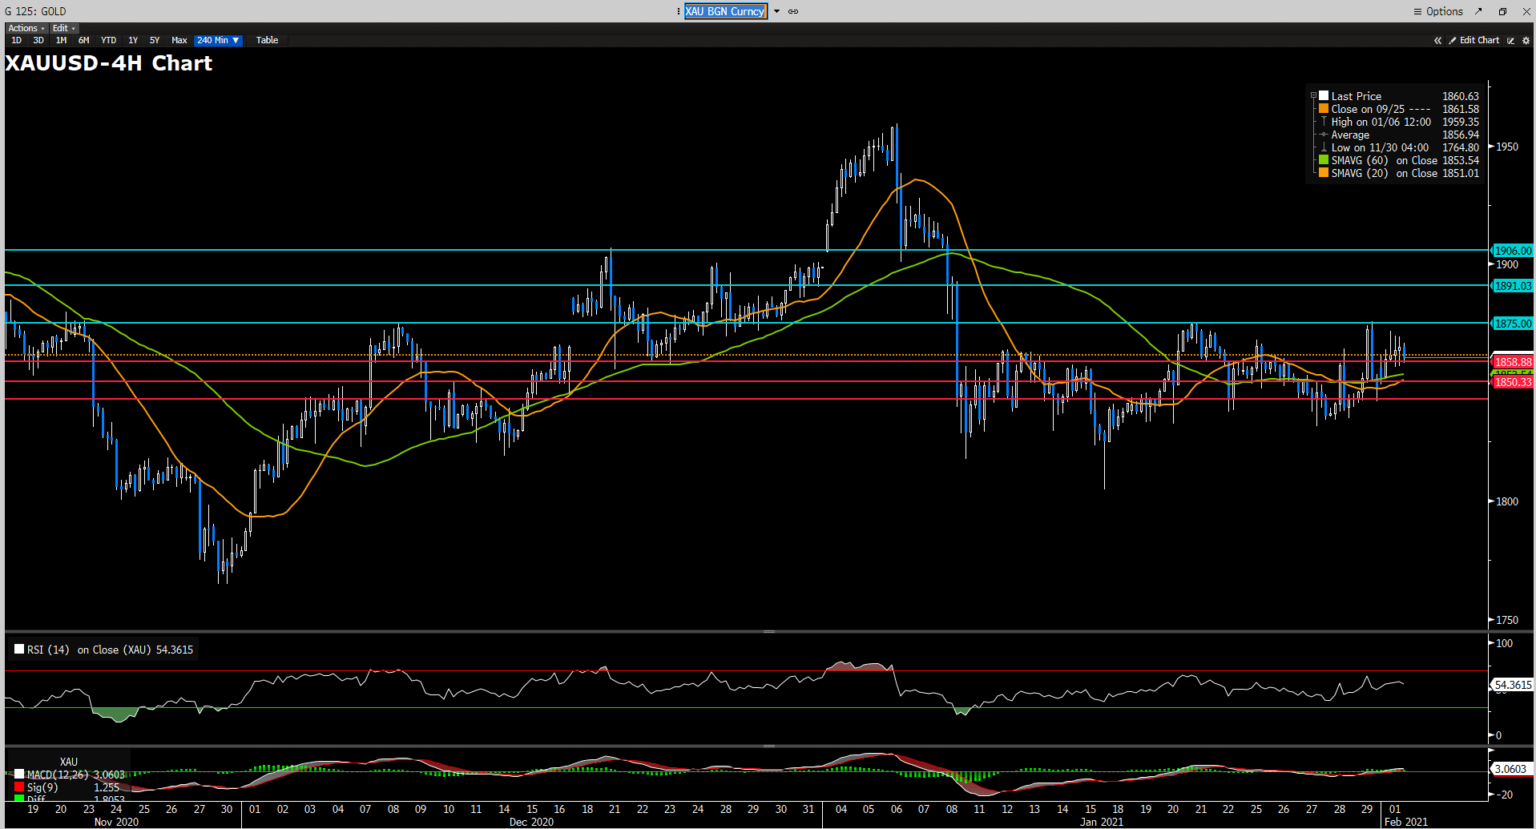
Gold preciously formed a double-top pattern on the daily chart, which usually points to bearish trend. Price has successfully breached the support band between $1839 and $ 1823, but did not quite reach 50% Fibonacci level of $1765. Then some dip buying drives price back to test whether the neck-line resistance is valid. It is currently trapped inside the support band, but judging from Monday’s trading, it’s highly likely this resistance level could block further north move. On the downside, sellers will be eyeing aforementioned $1765 horizontal support. MACD on the daily chart continues to underpin a sustainable bearish trend.
Resistance: 1839, 1872, 1930
Support: 1823, 1765
Economic Data
|
Currency |
Data |
Time (TP) |
Forecast |
||||
|
USD |
EIA Short-Term Energy Outlook |
20:00 |
|||||
|
USD |
JOLTs Job Openings (Dec) |
23:00 |
6.5M |
||||