Daily Market Analysis
Market Focus
US equities swung back and forth, the three big indices closed the last trading day with little gains. Treasury Secretary Janet Yellen emphasized the need for more supportive fiscal stimulus to help recover global economy during her first call with the G-7 group. She also suggested expanding the International Monetary Fund’s resource to help developing nations.
US consumer sentiment unexpectedly dropped from 79 to 76.2, refreshing the six-month low. Personal income deteriorated as Americans expect faster inflation in 2021 and 2022. Elevated unemployment figures, restricted social activity, and a slow vaccination process are destabilizing consumers confidence on future outlook.
The Fed releases its monetary policy report on Friday, it detailed its 2021 testing scenarios while stating the central banks does not yet plan to remove restrictions that has imposed on banks’ dividend payment amid the coronavirus pandemic. In its latest stress tests, the Fed is examining whether banks could keep lending if unemployment rose more than 4% to nearly 11%, and stock lost more than half of their value and commercial real estate valuations declined by 40%. The test results usually determine how much of a bank’s excess cash can be returned to investors through stock buybacks and dividend. Results for this new round of tests will come out by June 30
European Commission President Ursula von der Leyen admitted that the commission underestimated issues that led to inefficient vaccine manufacturing process, thus dragging the vaccination rollout program. Meanwhile, she expects further distribution of the vaccines to smooth out, adding that the time in the regulatory process to approve vaccines could still be reduced.
Market Wrap
Main Pairs Movement
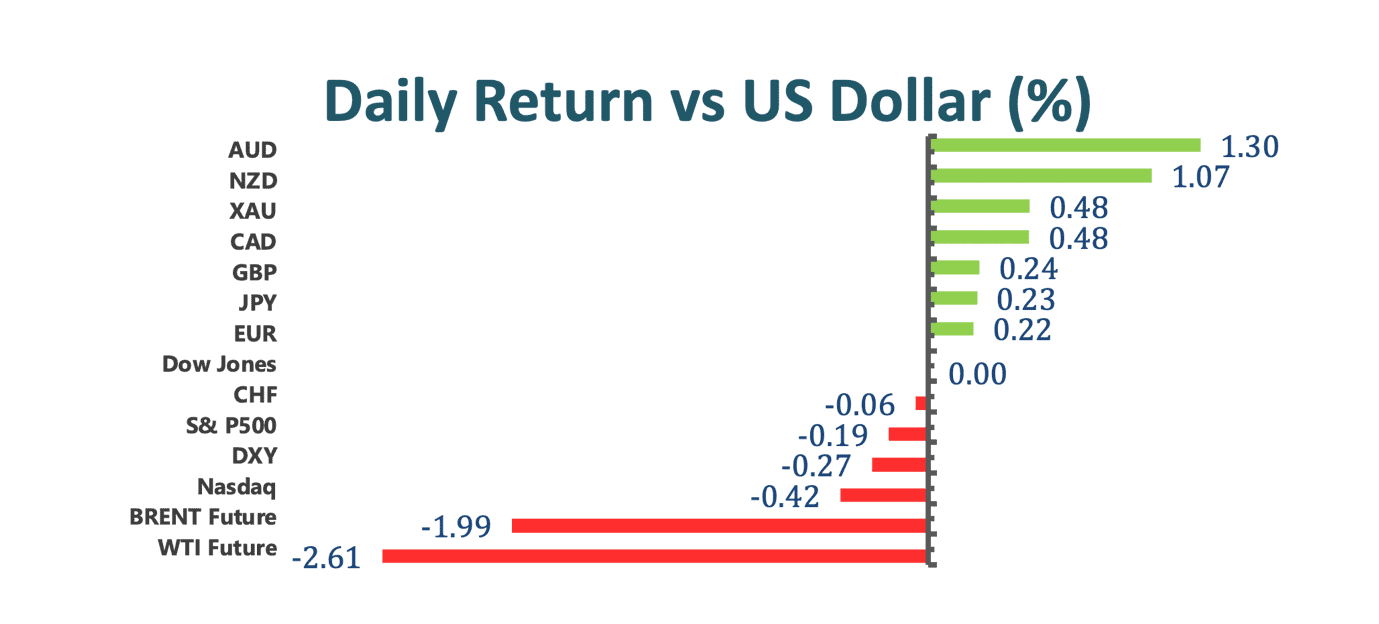
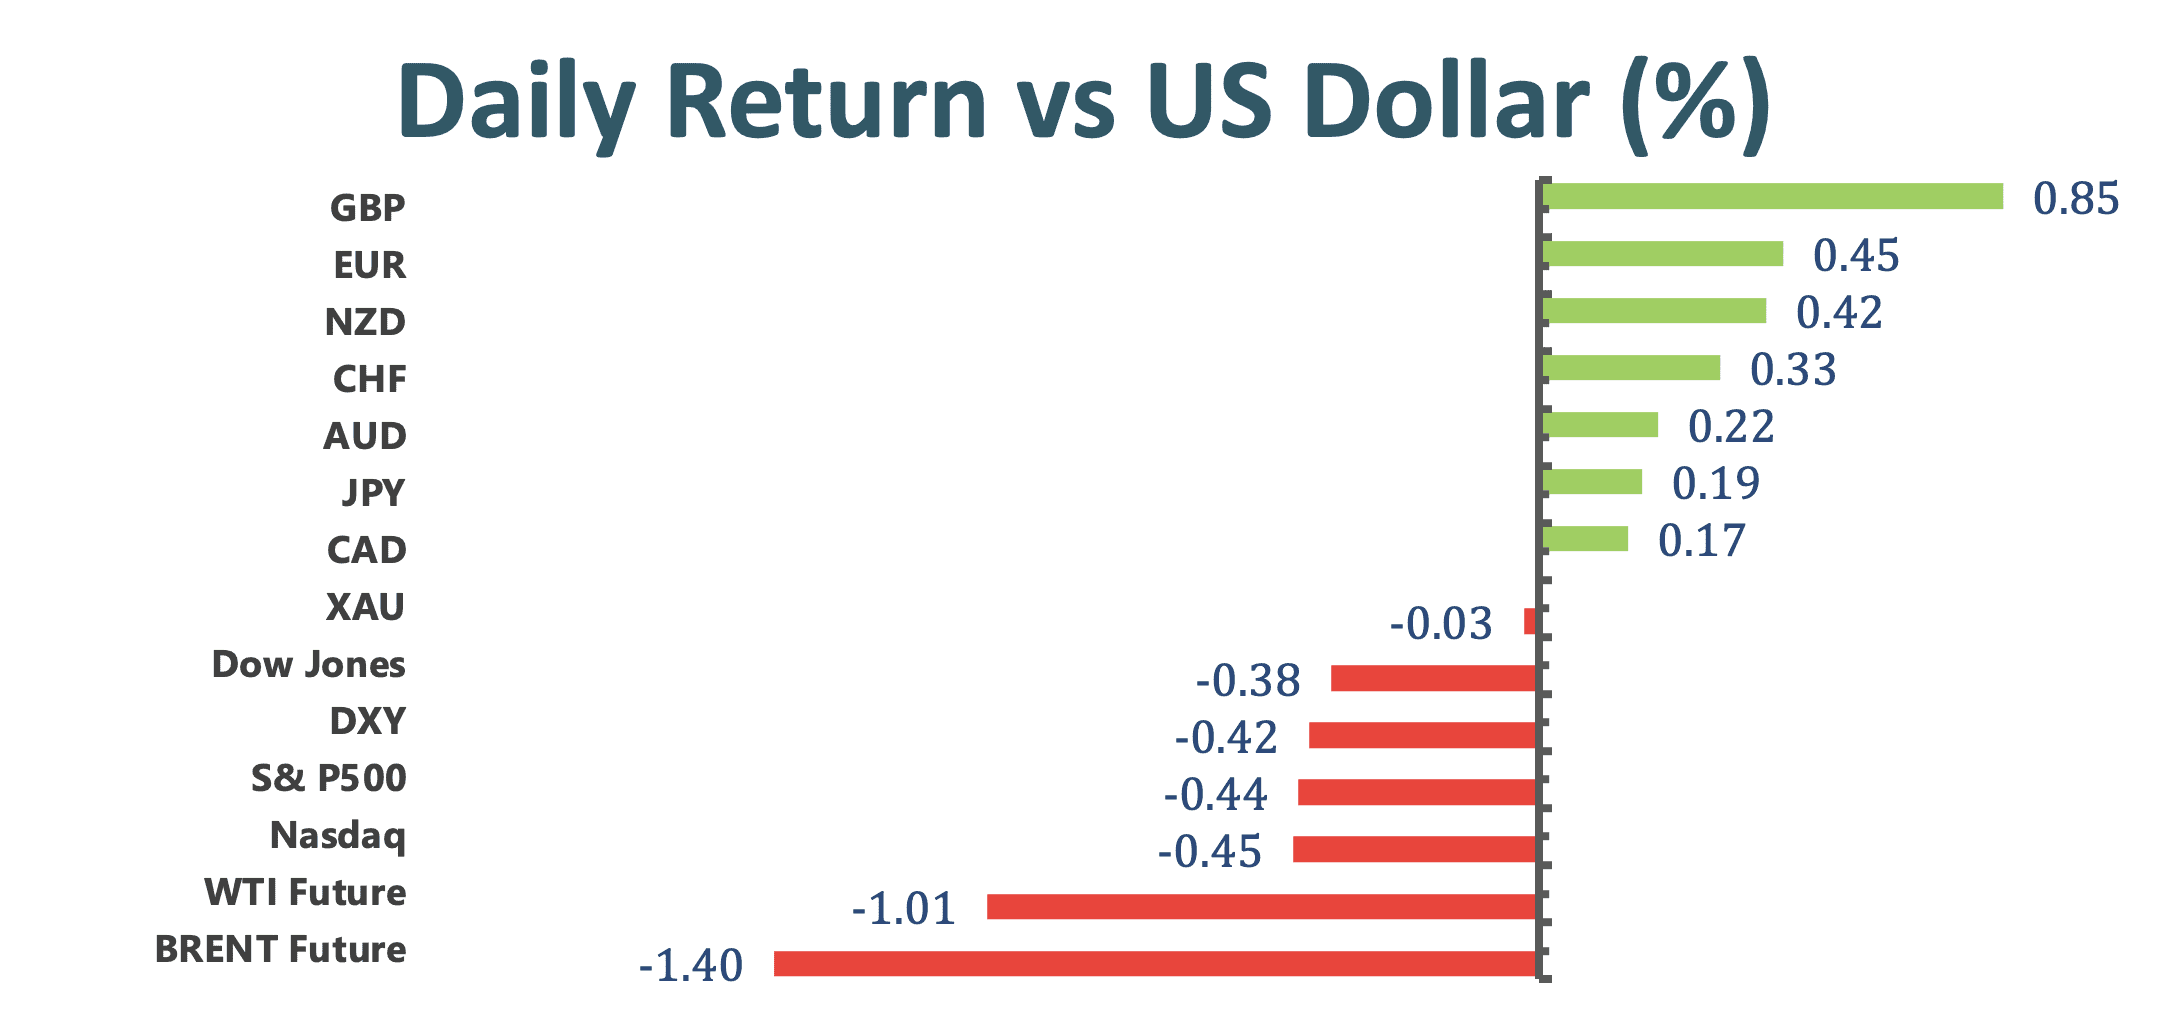
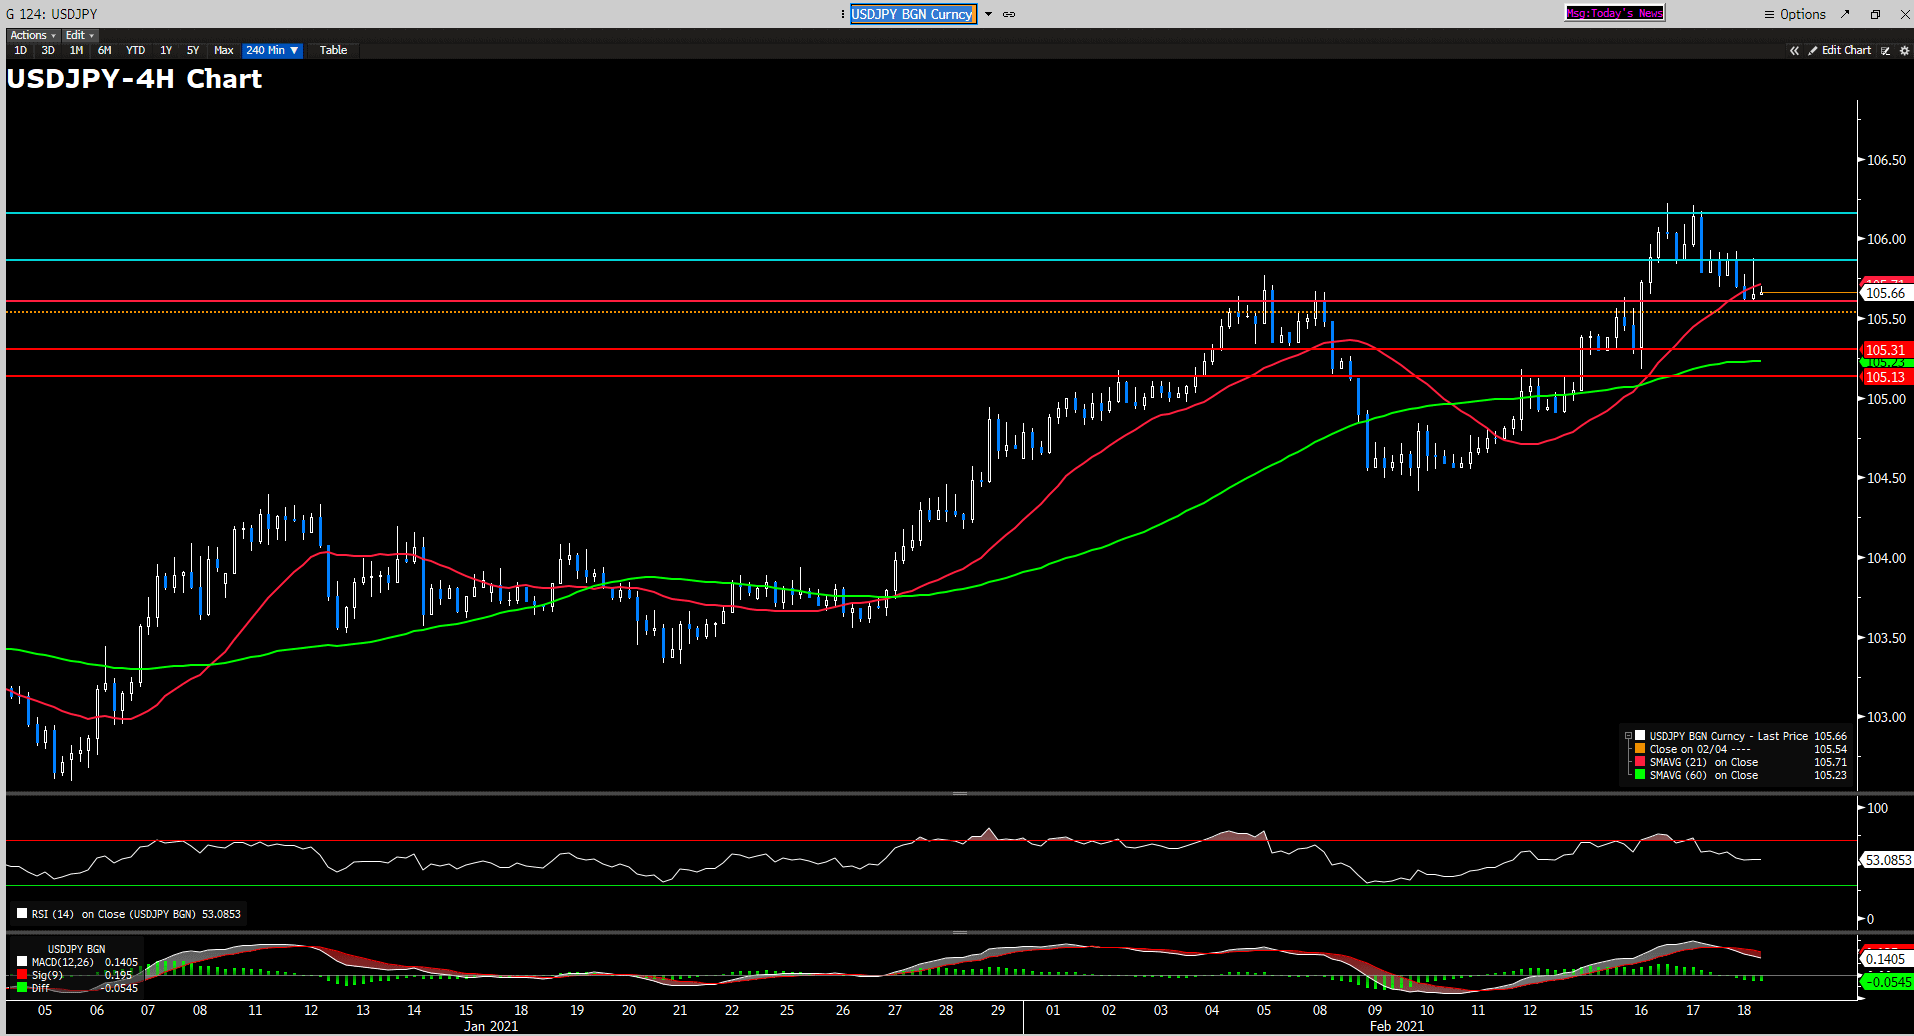
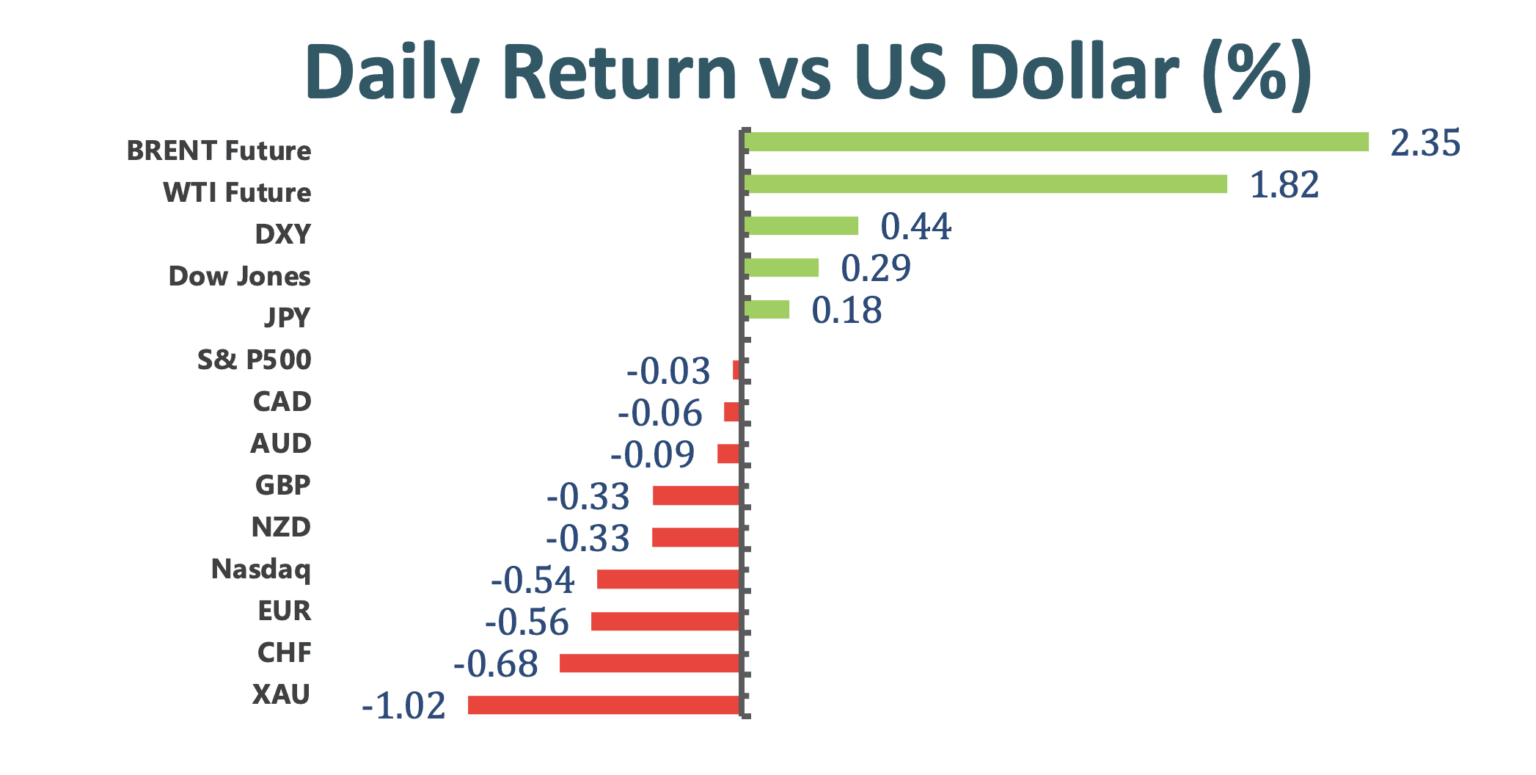
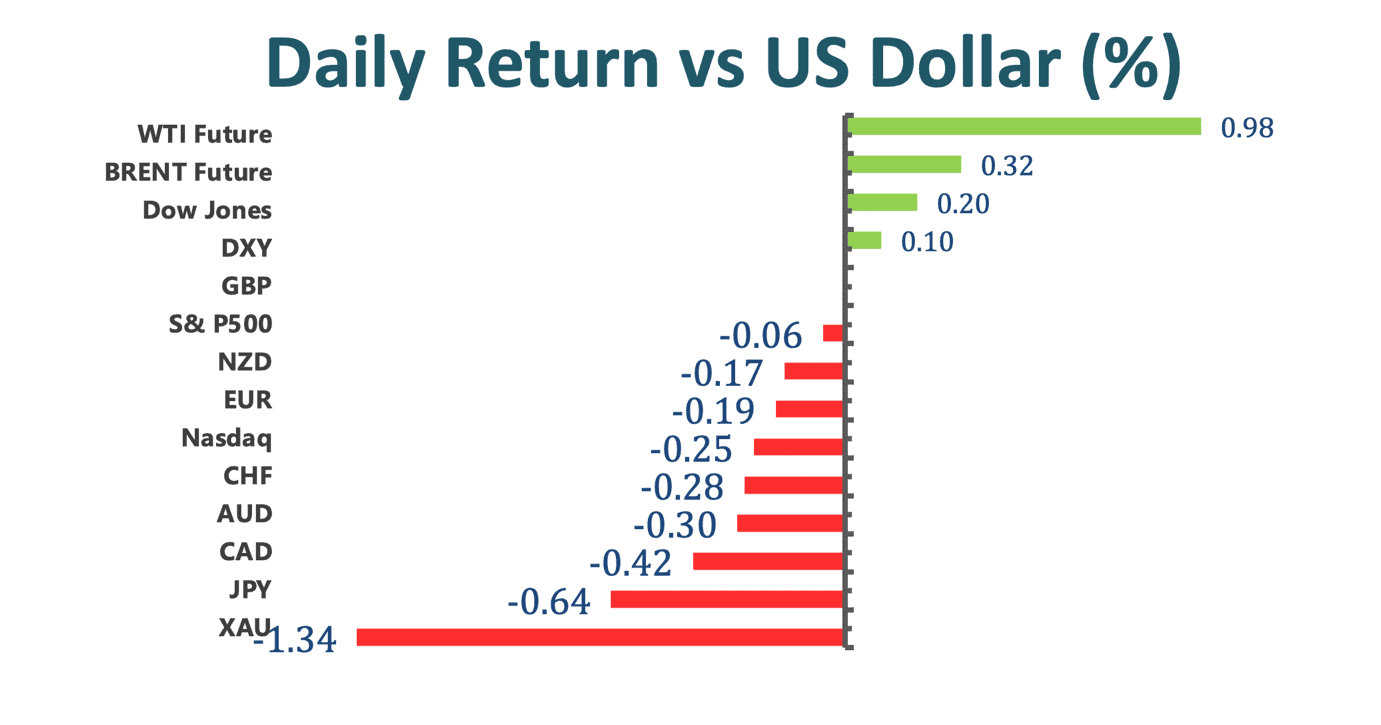
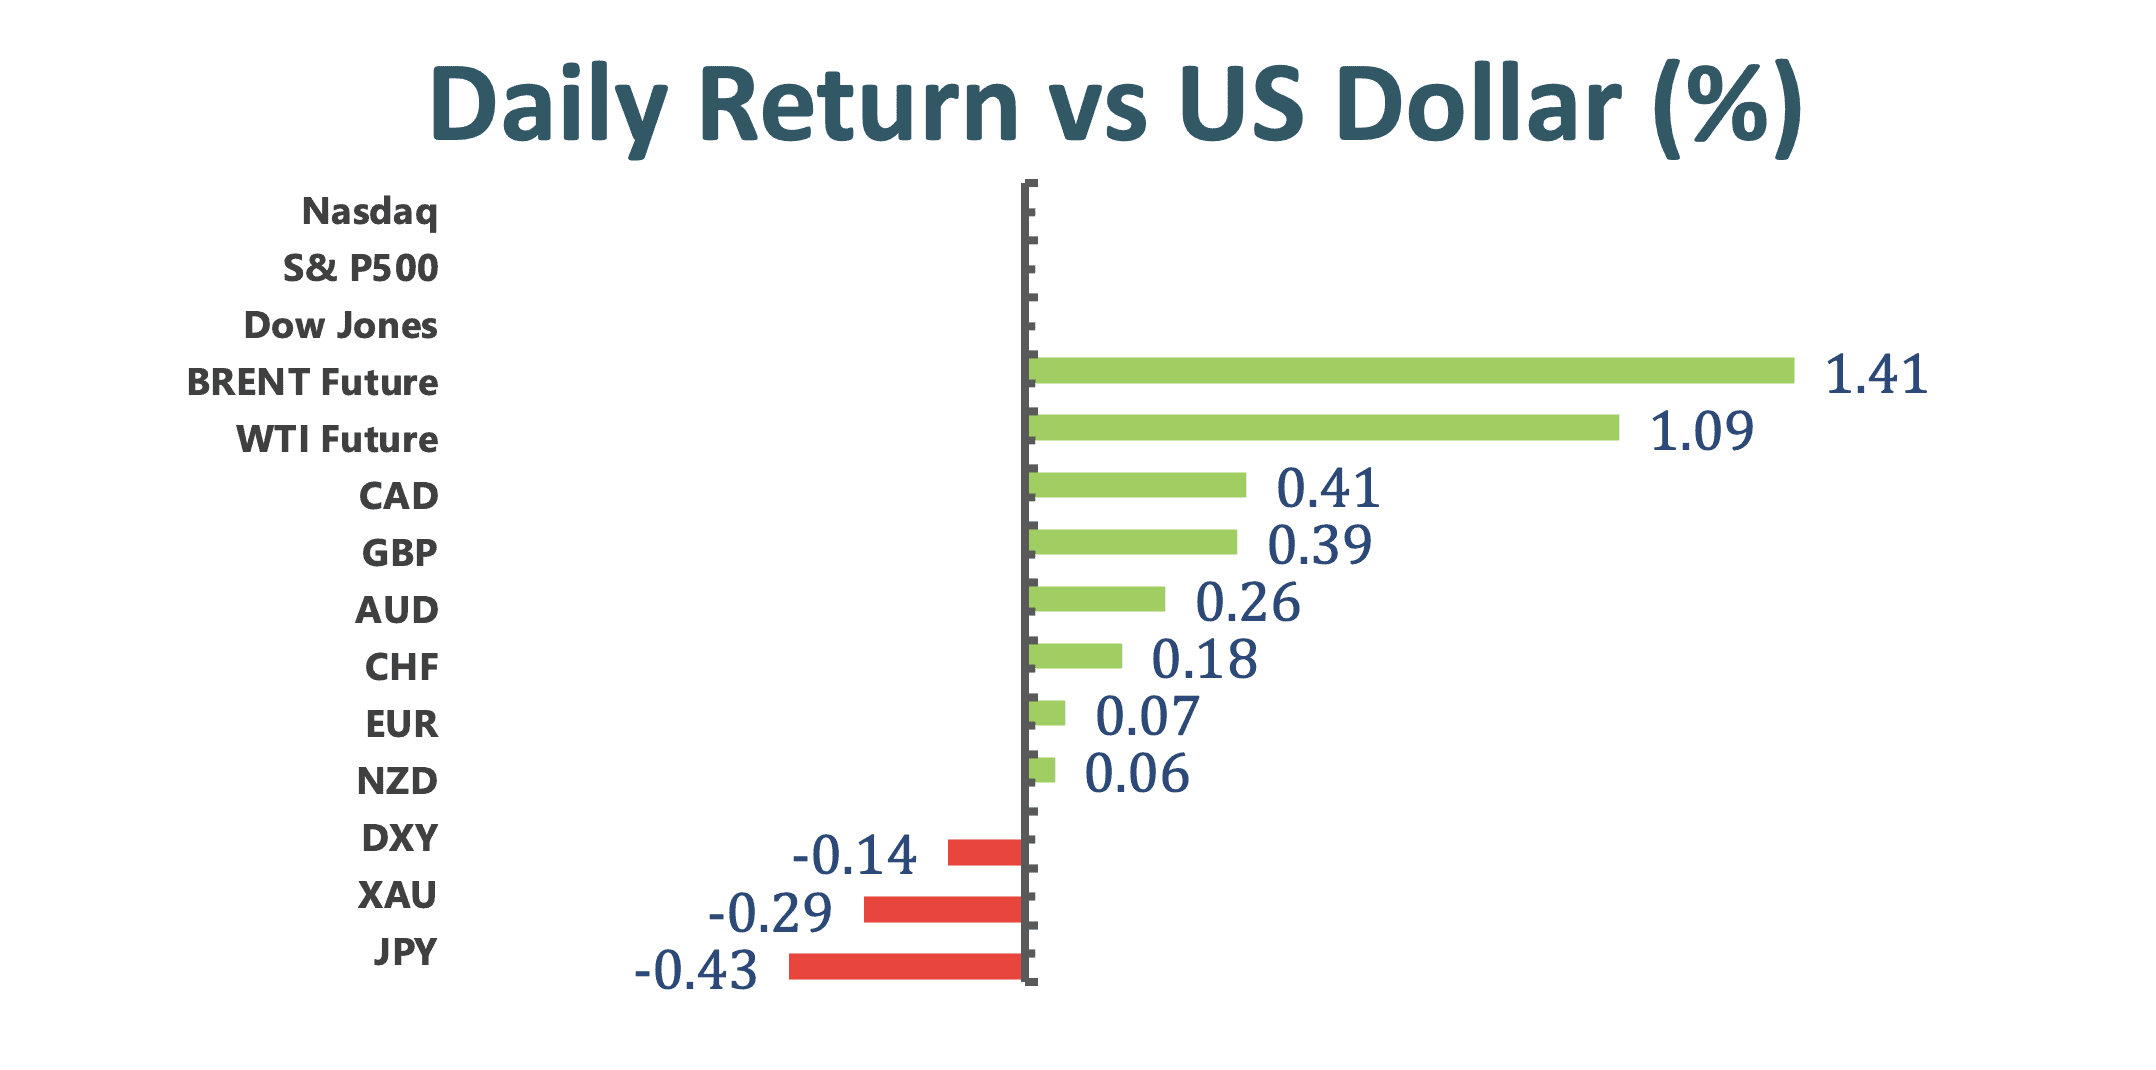
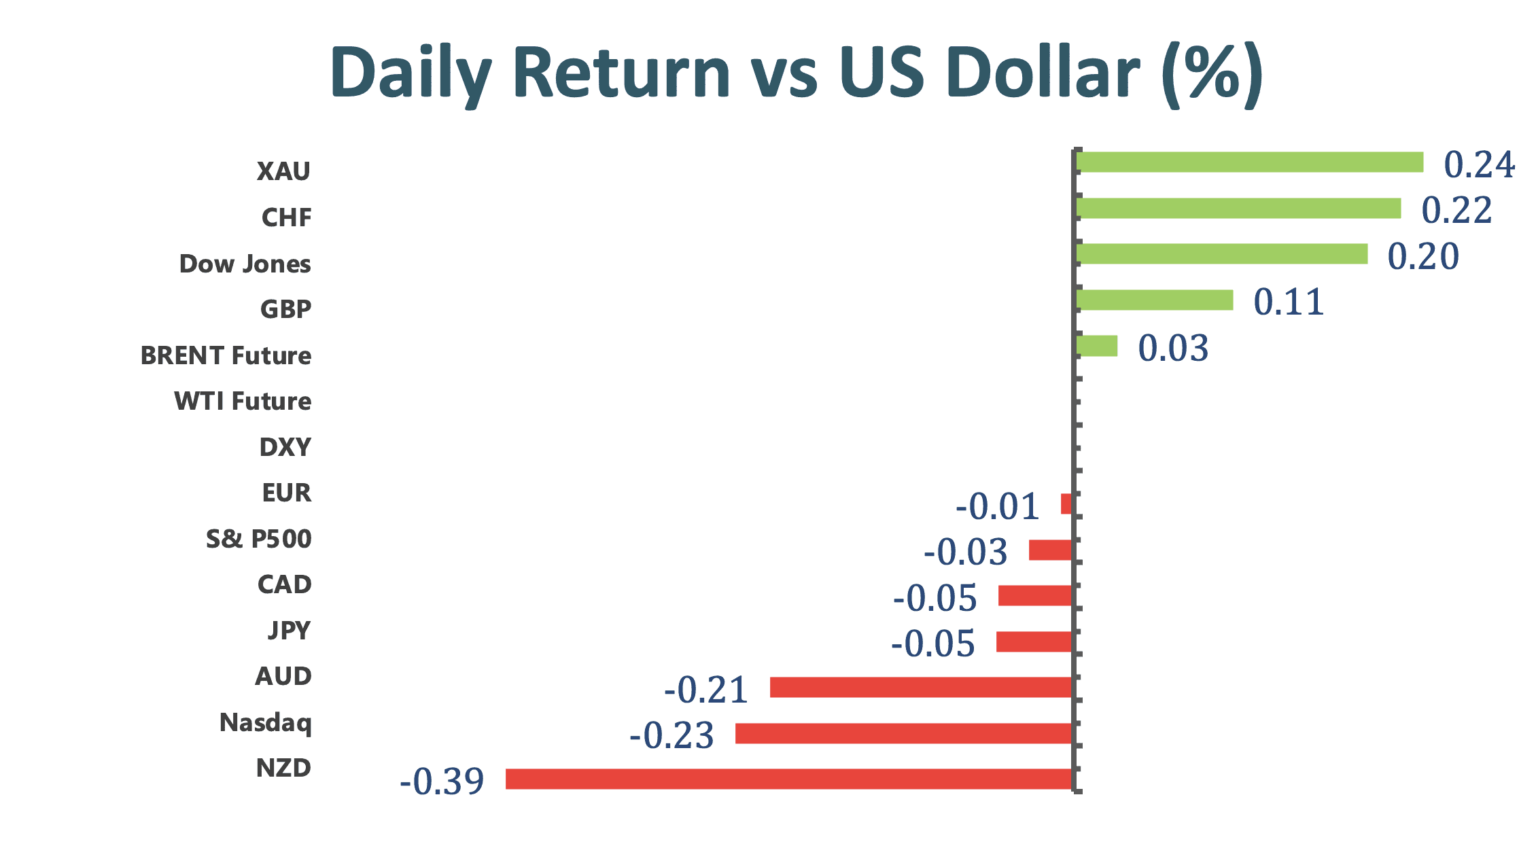
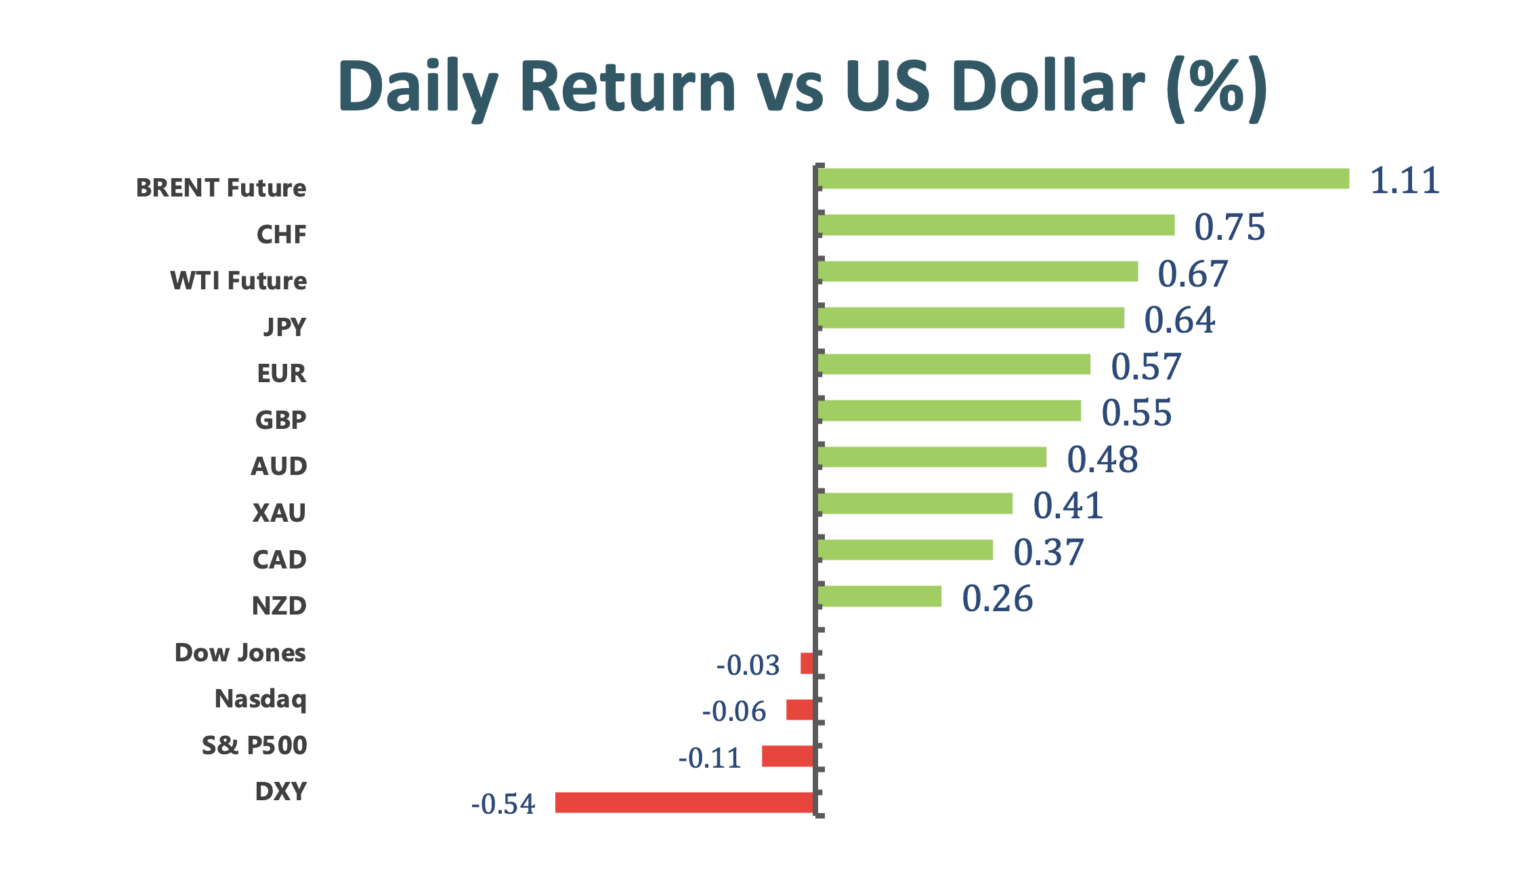
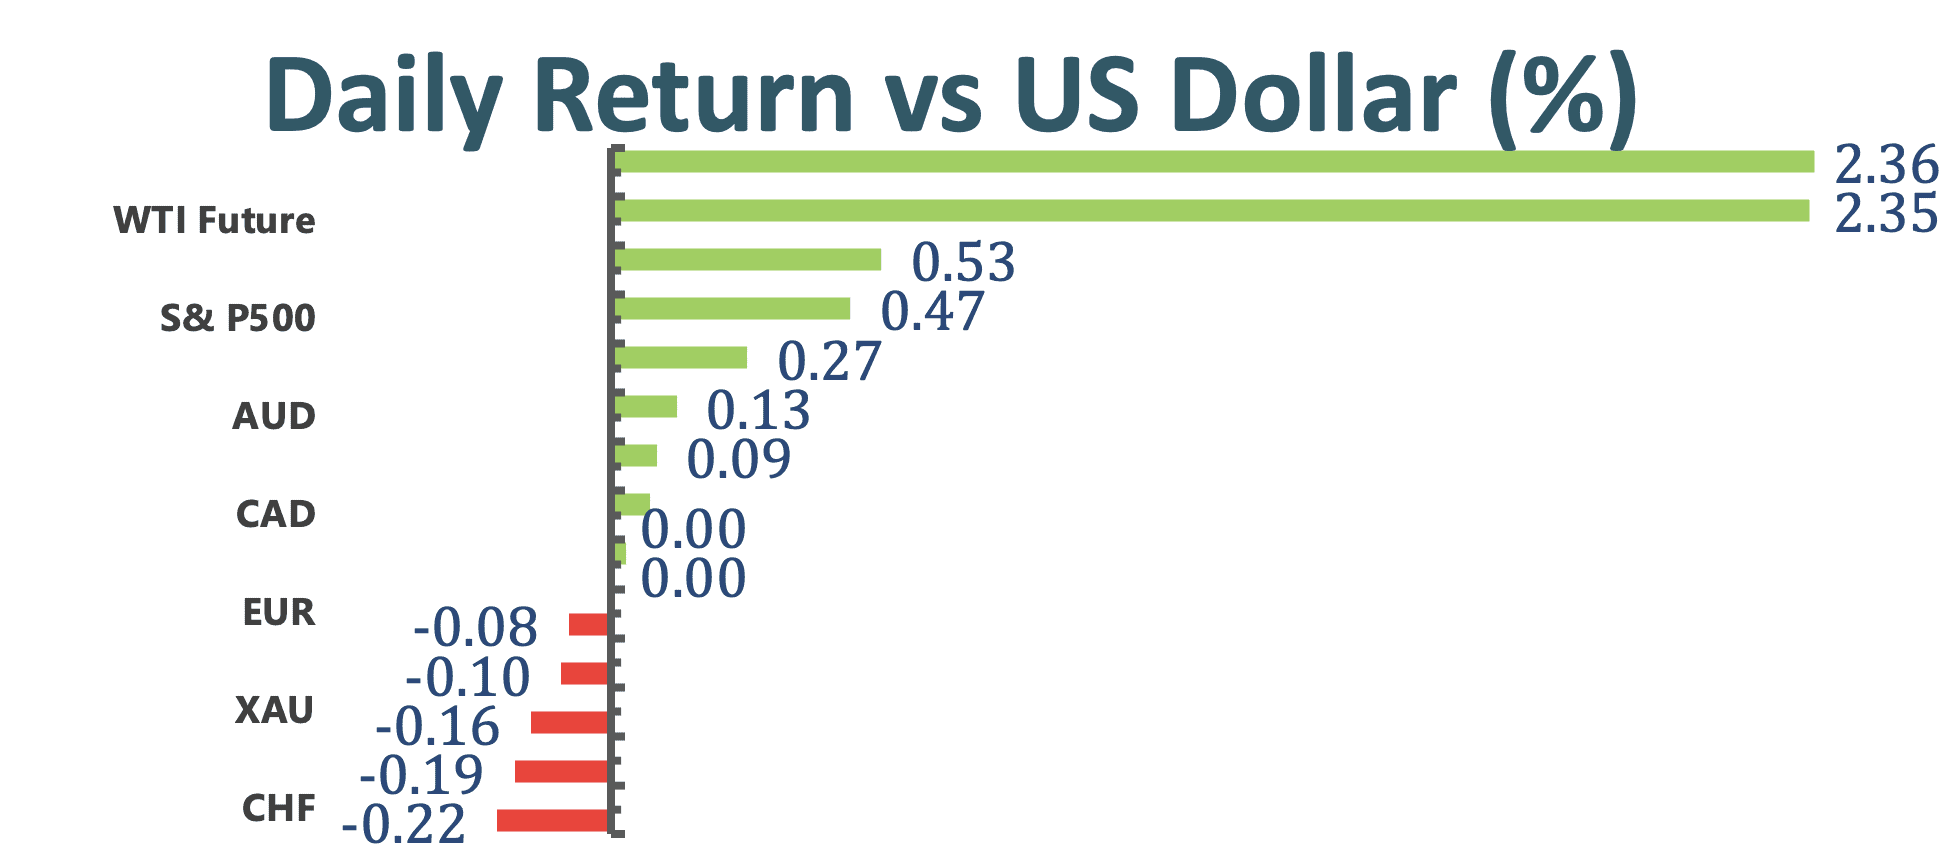
The US greenback initially enjoyed a north ride until disappointing Michigan Consumer Sentiment put a dent in this uptrend, the dollar index is currently trading at 90.44, up little 0.03%. Meanwhile, the US 10-year treasury yield continues to rise in the backdrop, refreshing highs at 1.207%. The Yen is particularly vulnerable under surging US yield, it has depreciated 1.6% against the US dollar since January. Adding salt to the wound, the BoJ signaled to cut interest rate further if necessary, weighing down on the safe-haven currency.
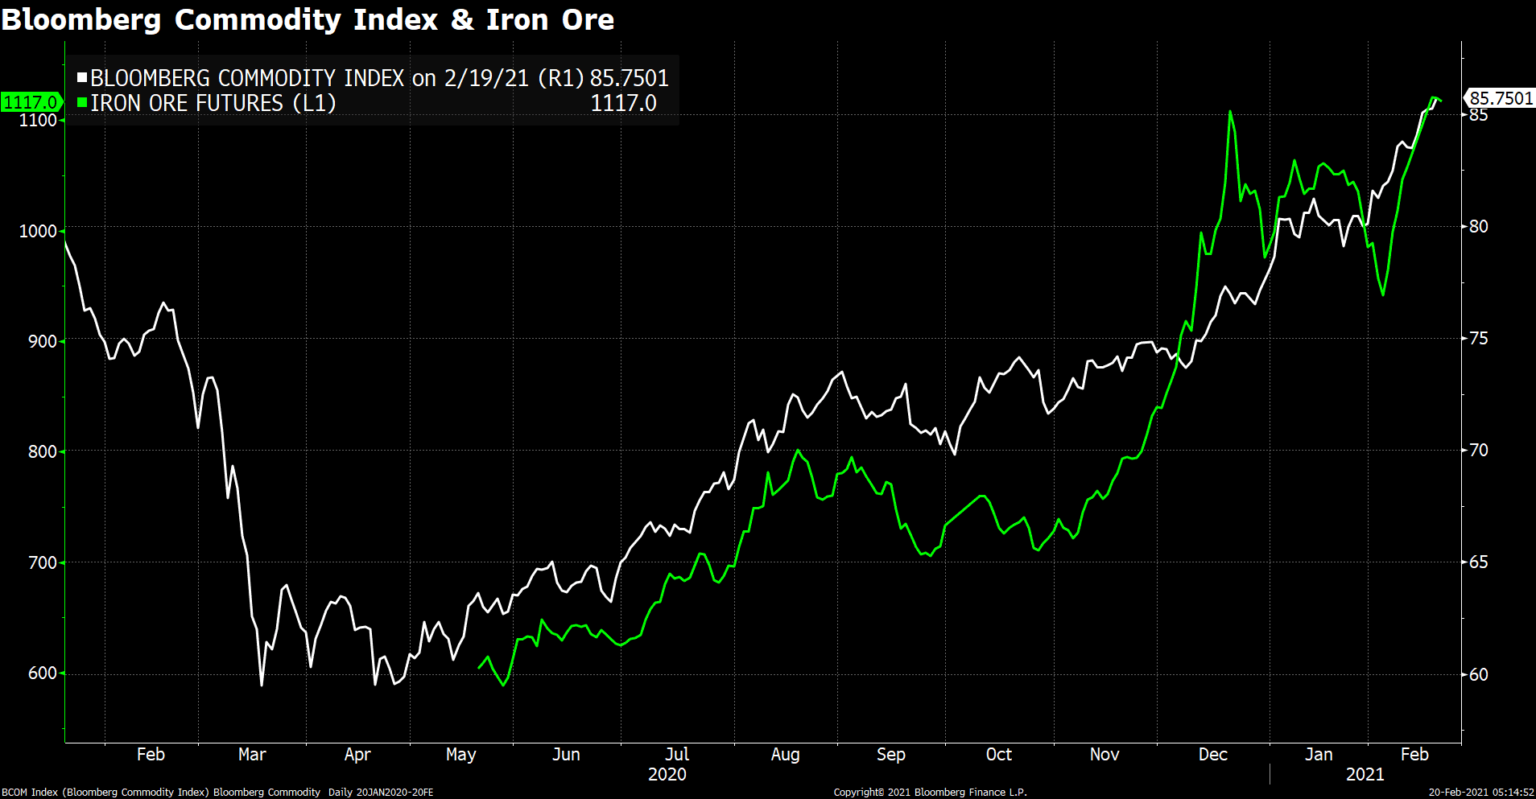
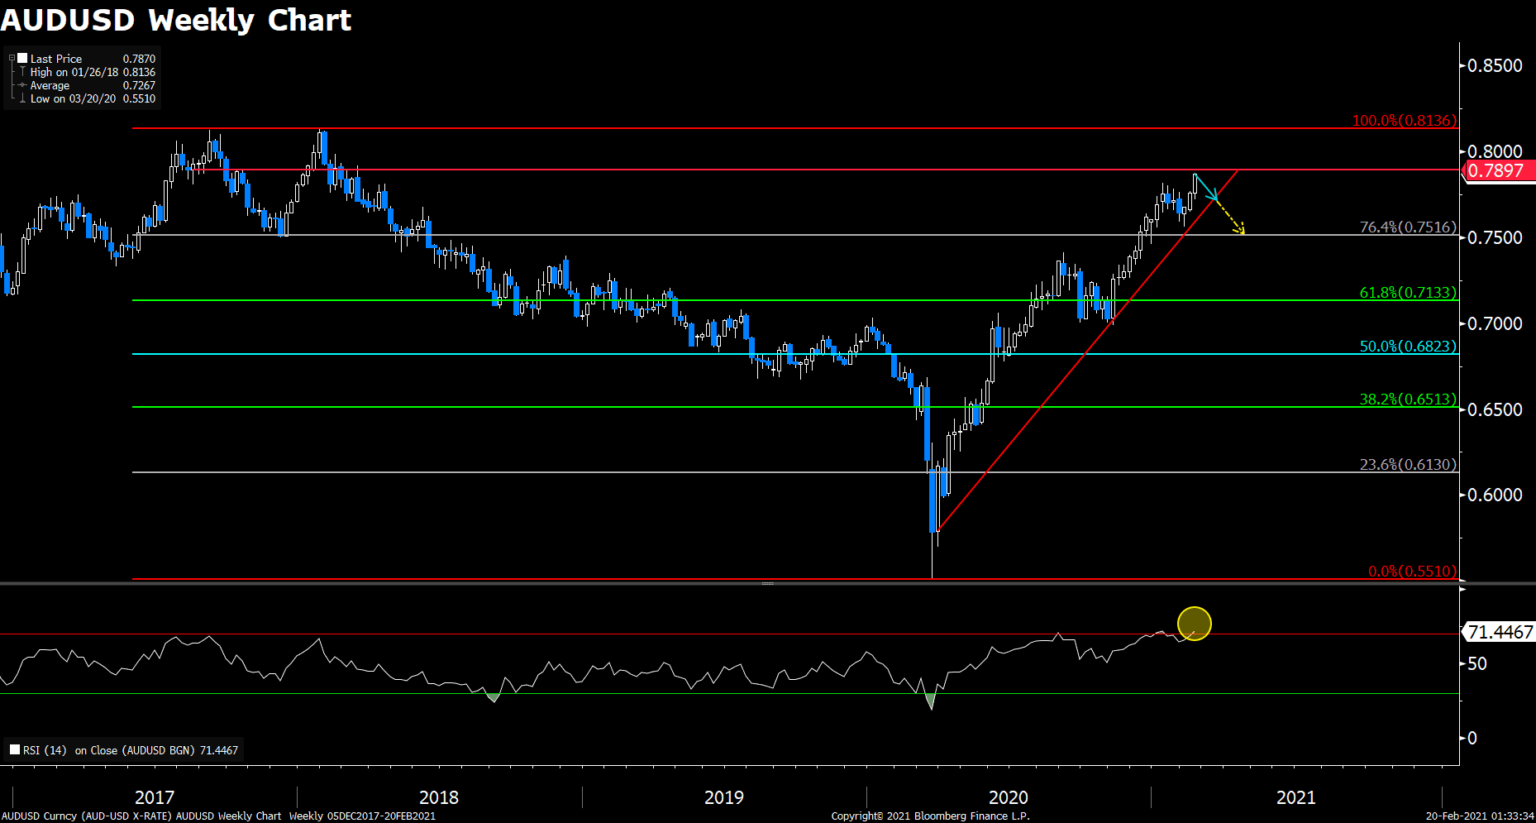
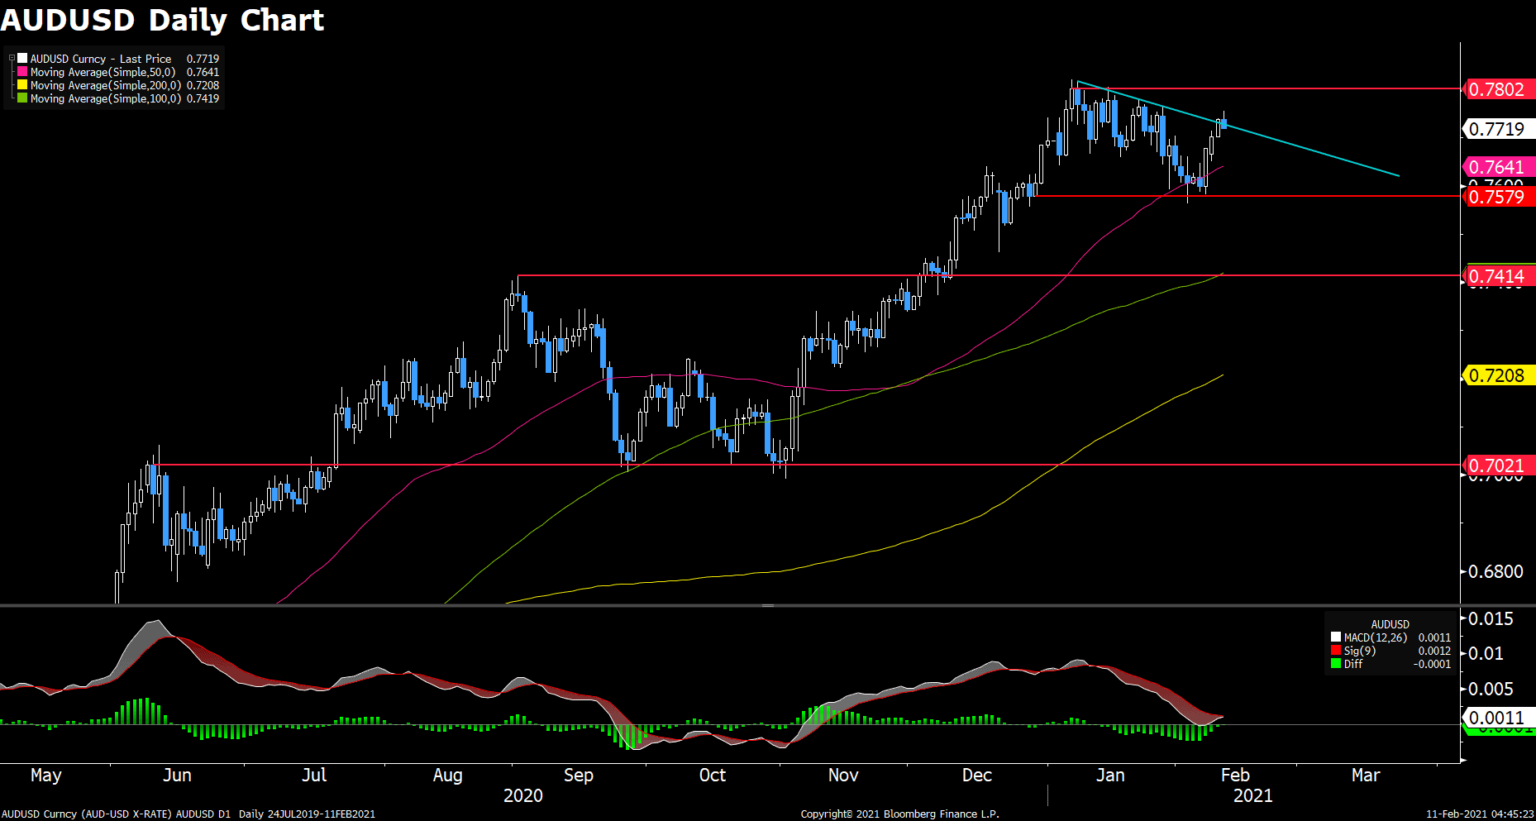
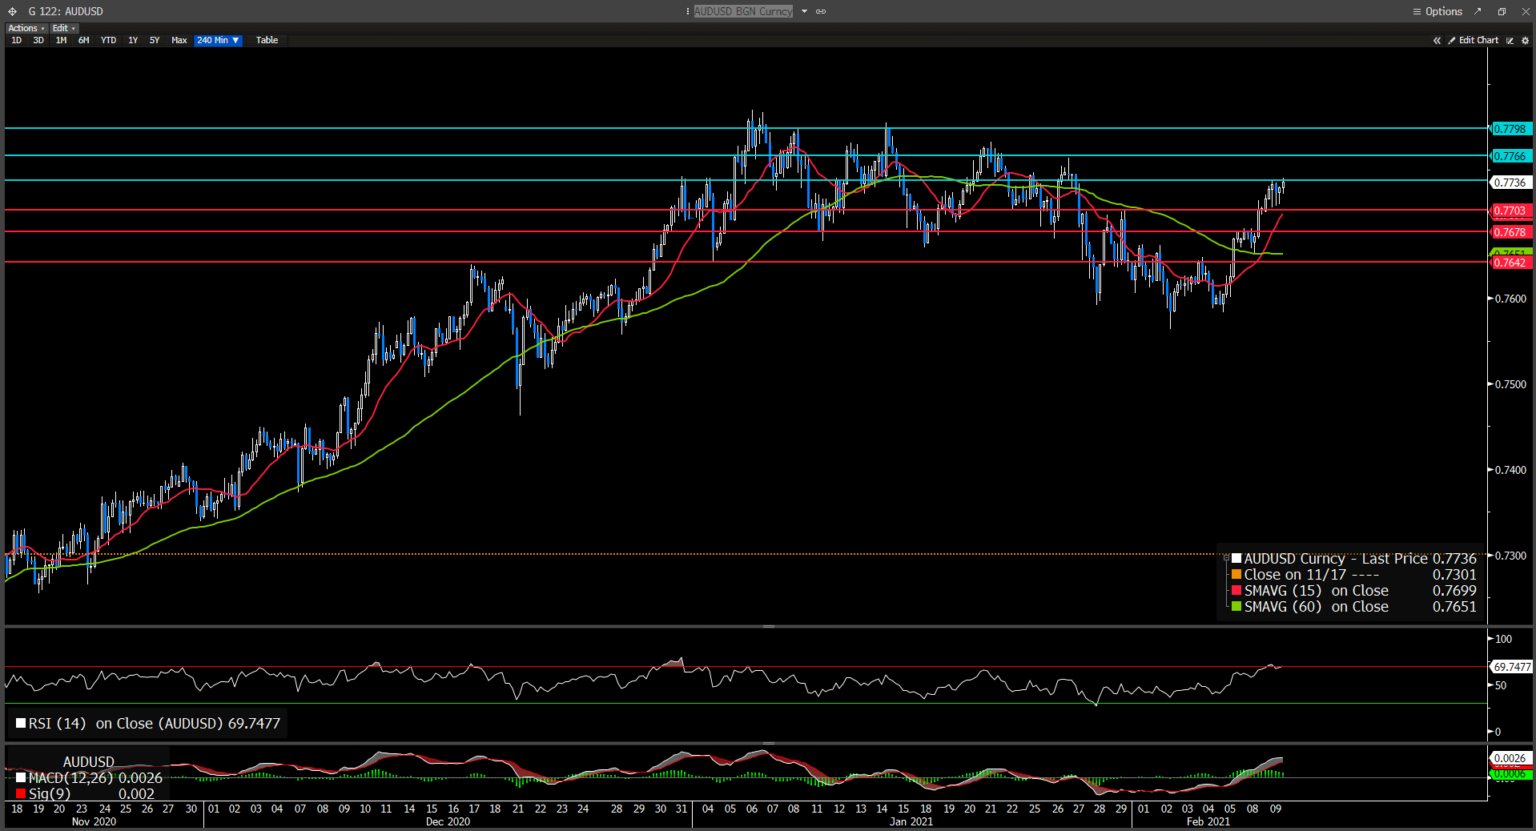
Aussie was the second-best performing G-10 currency on Friday, gained 0.1%, just trailing behind the Sterling. The antipodean pair continues to derive support from upward trending commodities, iron ore, and other industrial metals price. Australian Finance Minister also expressed his optimism earlier this week, which underpins the growth of Australian dollar.
Strong fundamentals continues to bolster the Pound, surged 0.31% on Friday. The UK has now vaccinated over 14M people and continues to extend its lead in terms of percentage of its adult population vaccinated compare to other developed countries. GDP data also proven to be supportive of the current bullish bias, UK’s fourth quarter GDP (MoM) increased by 1%, beating anticipated 0.5%. Its December manufacturing production is slightly sluggish, printed 0.3% compares to previous 1.1%, and missed expectation of 0.6%.
Technical Analysis:
EURUSD (Daily Chart)
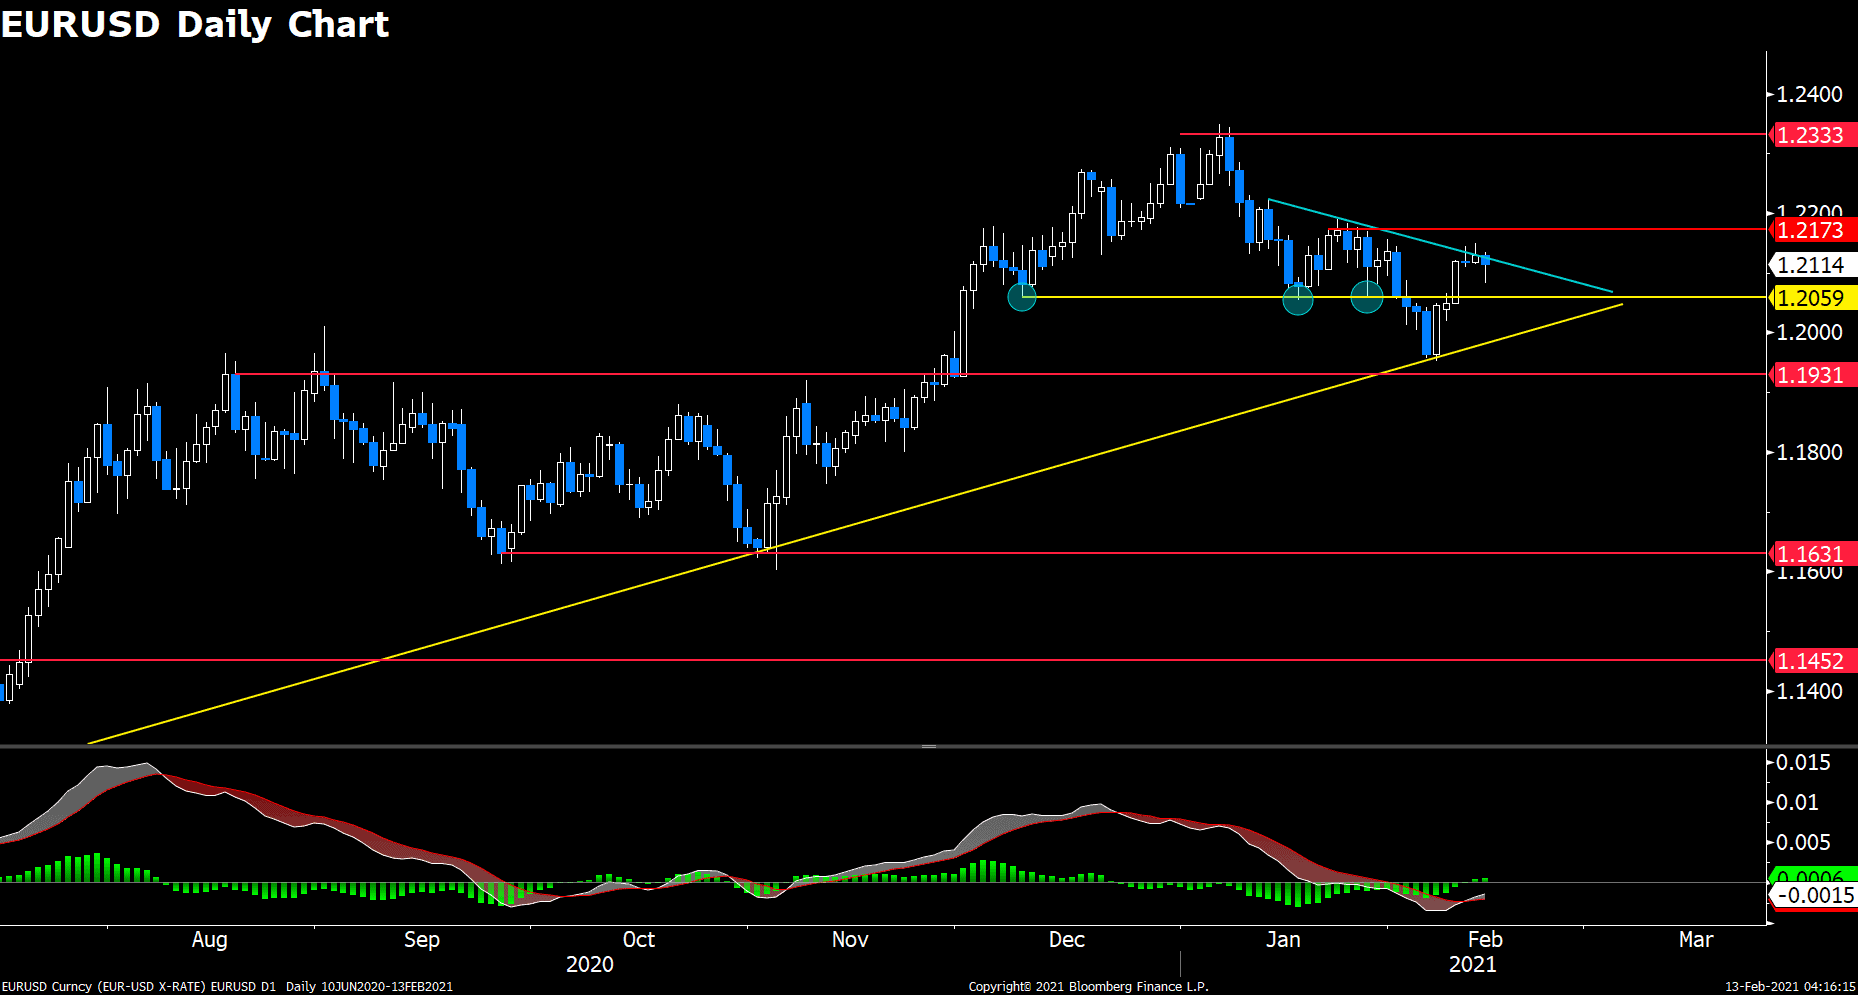
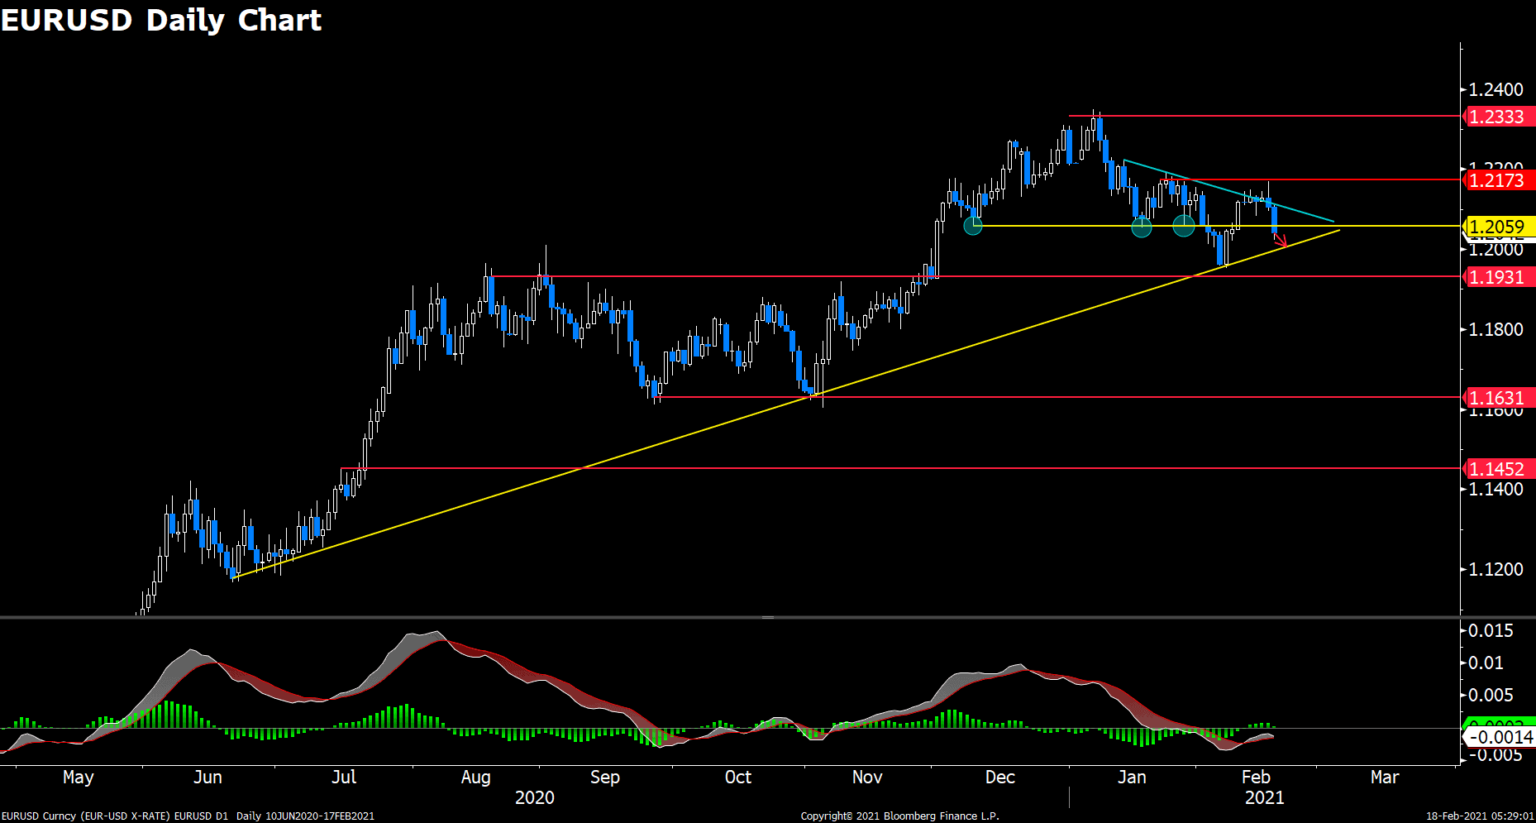
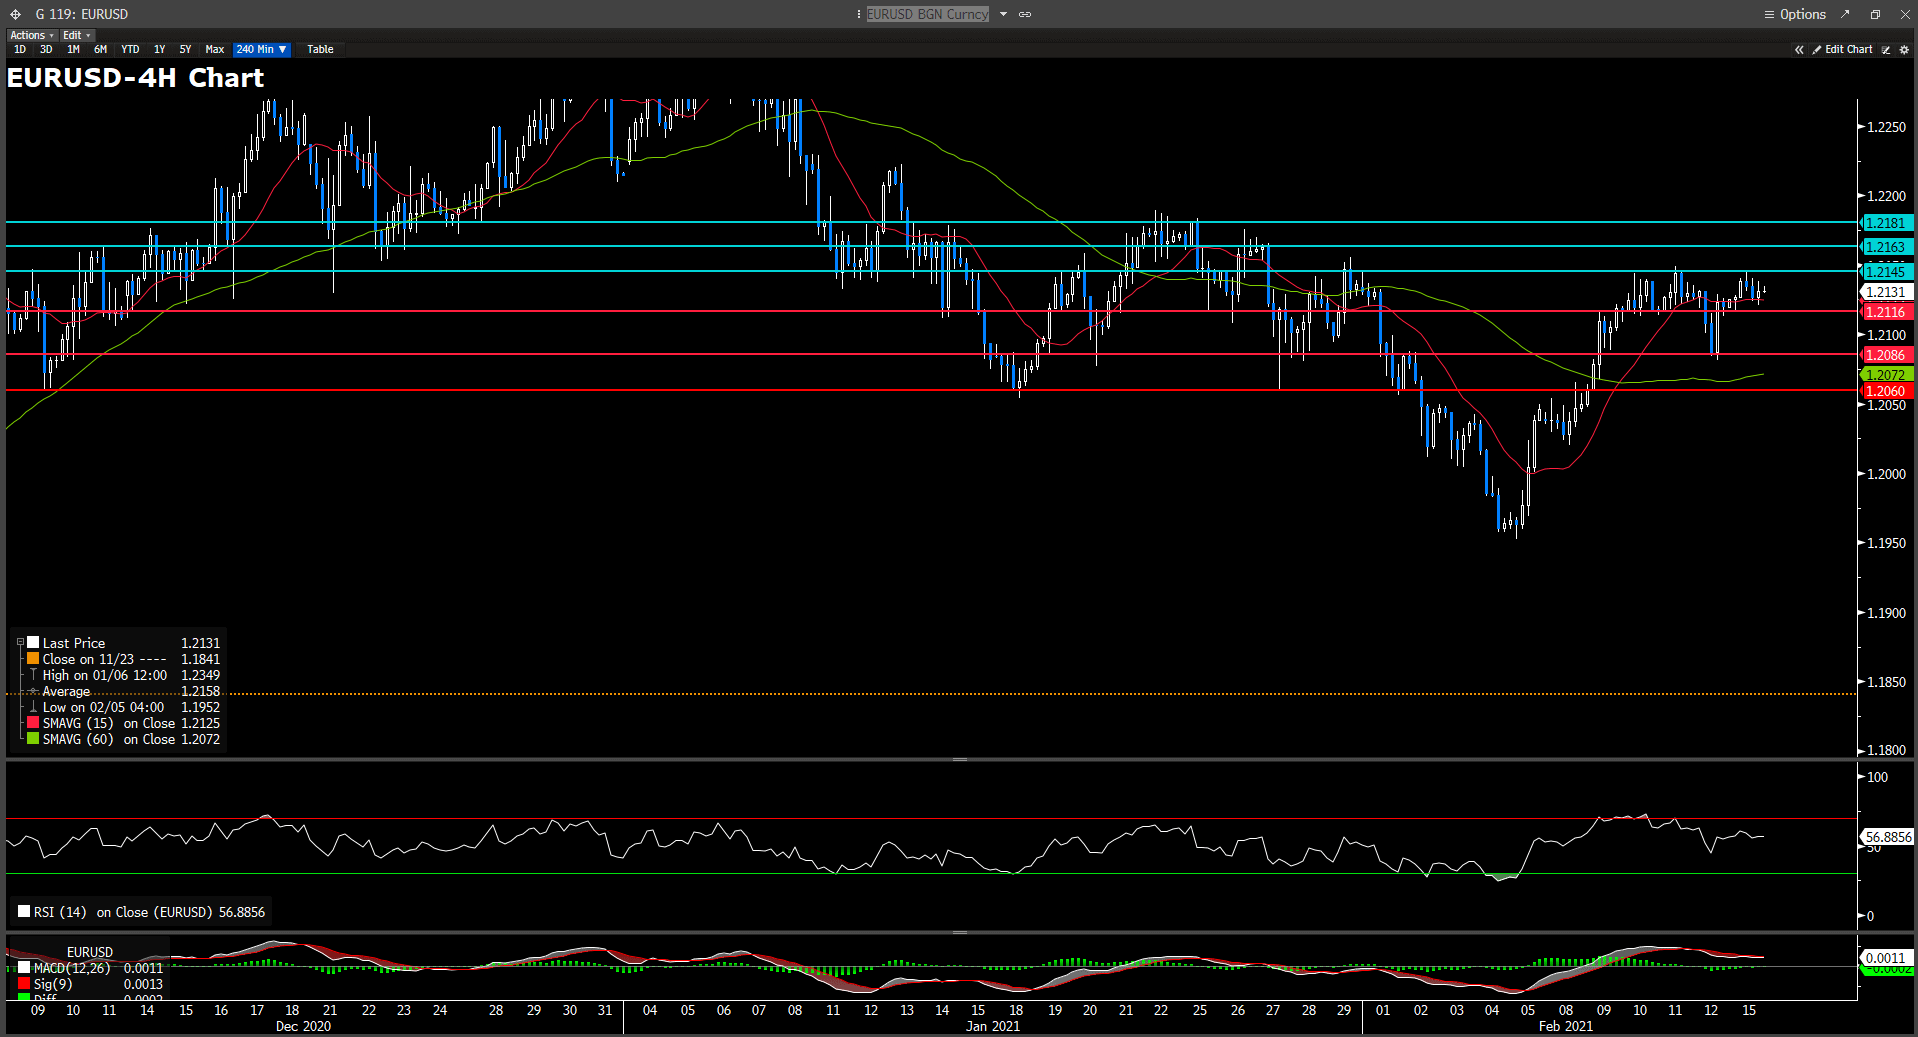
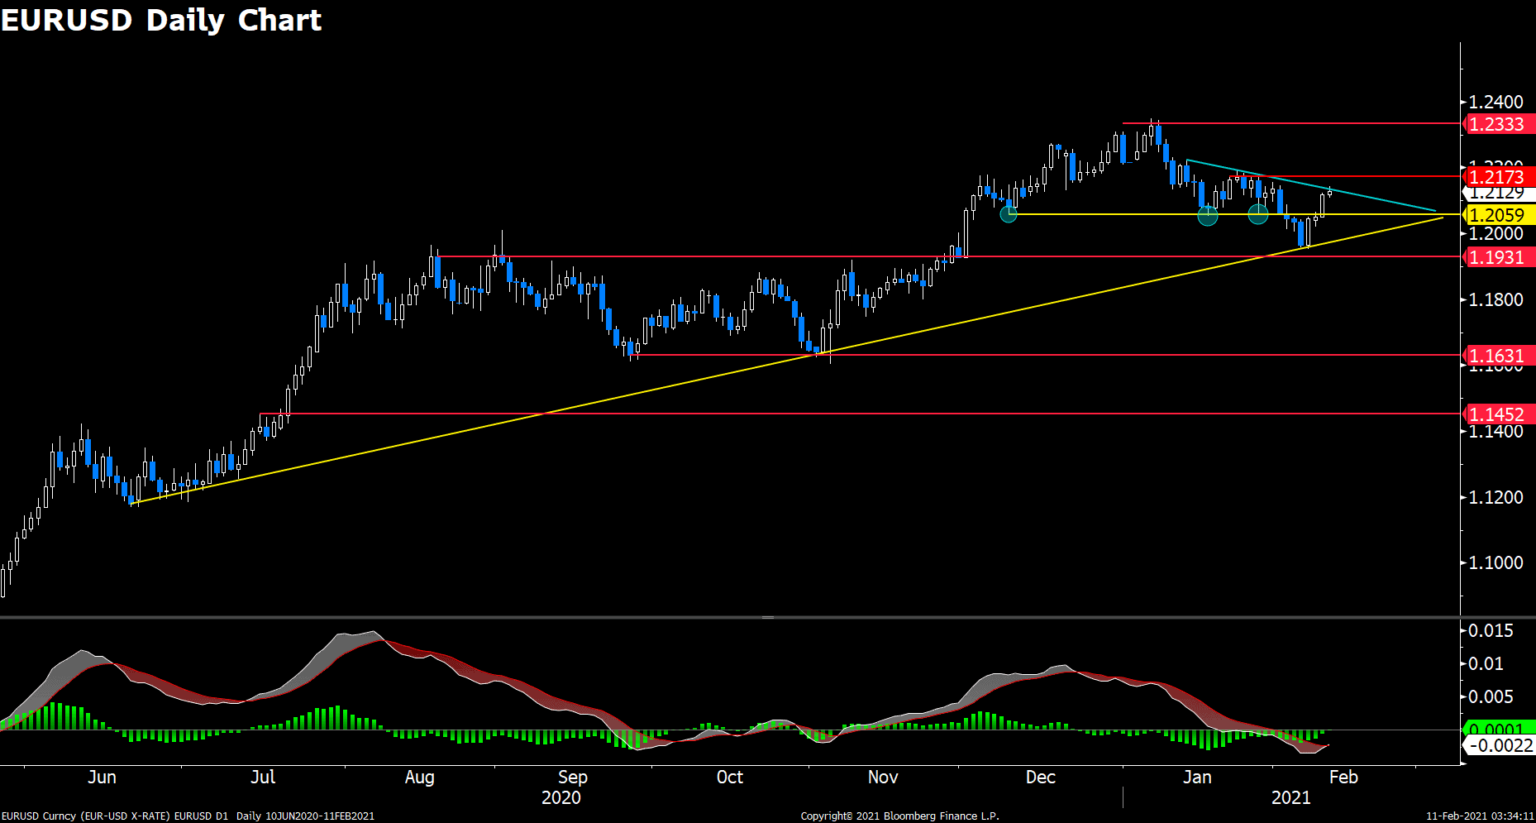
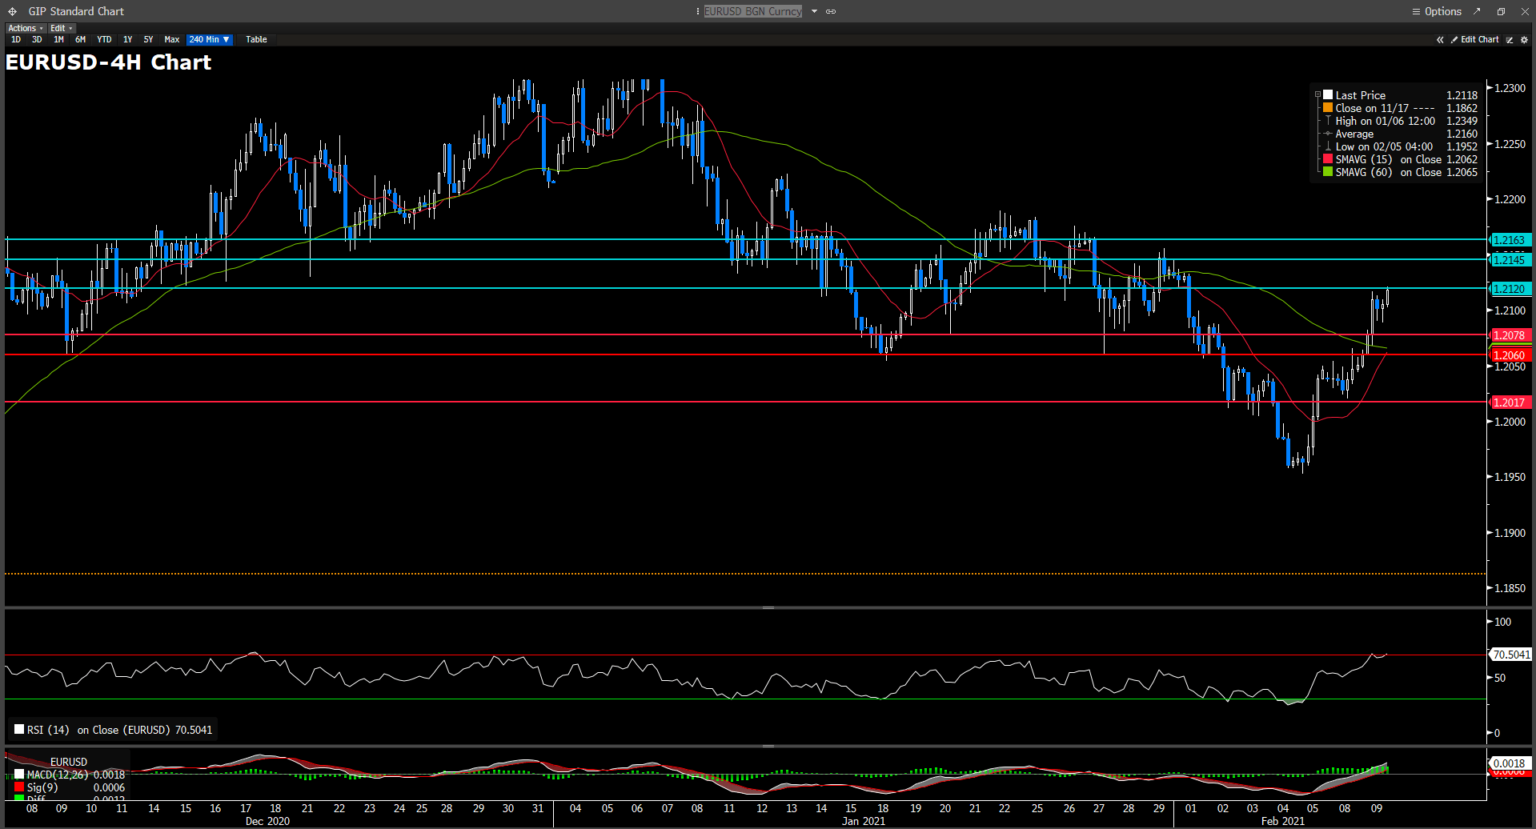
Euro dollar fell more than 40 pips prior to US market opens, downbeat consumer sentiment brought disruption to the pair’s downward movement, recovered most of its loss of day. The pair is still sitting comfortable above 1.206 support, and is clinging to the short term descending trendline. The yellow upward trendline has previously proven itself to be worthy for defending, now the bulls are in charge of another attack. However, there have been several layers of defense line set up by the bears, the first being the blue descending trendline, next to horizontal resistance of 1.2173, then the January’s high of 1.2333. Adding one more rejection from the descending trendline could largely increase the chance of further retreat. On the south, near support sits around 1.206, followed 1.193.
Resistance: 1.2173, 1.2333
Support: 1.206, 1.193
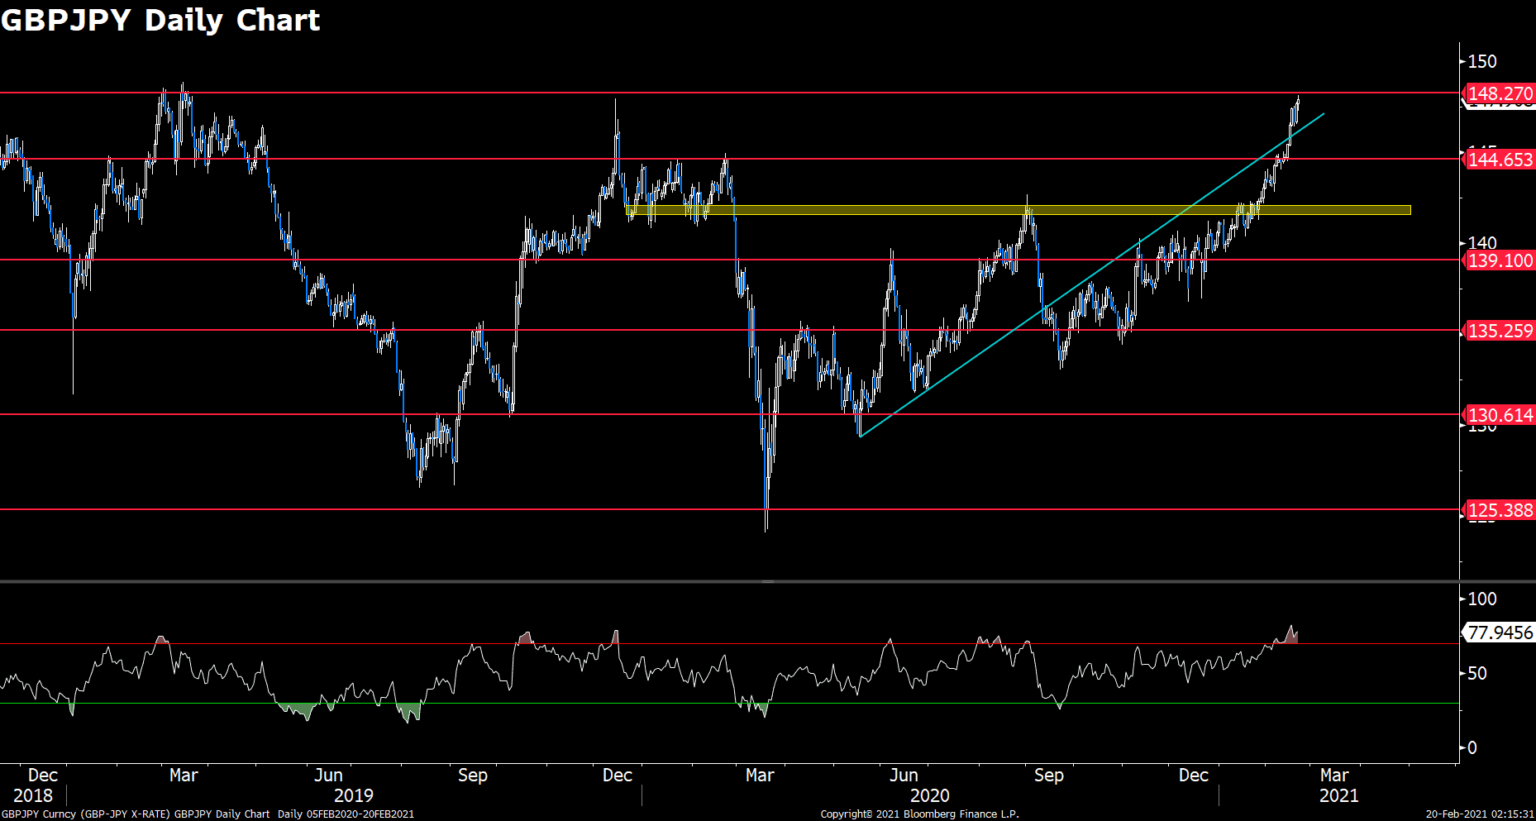
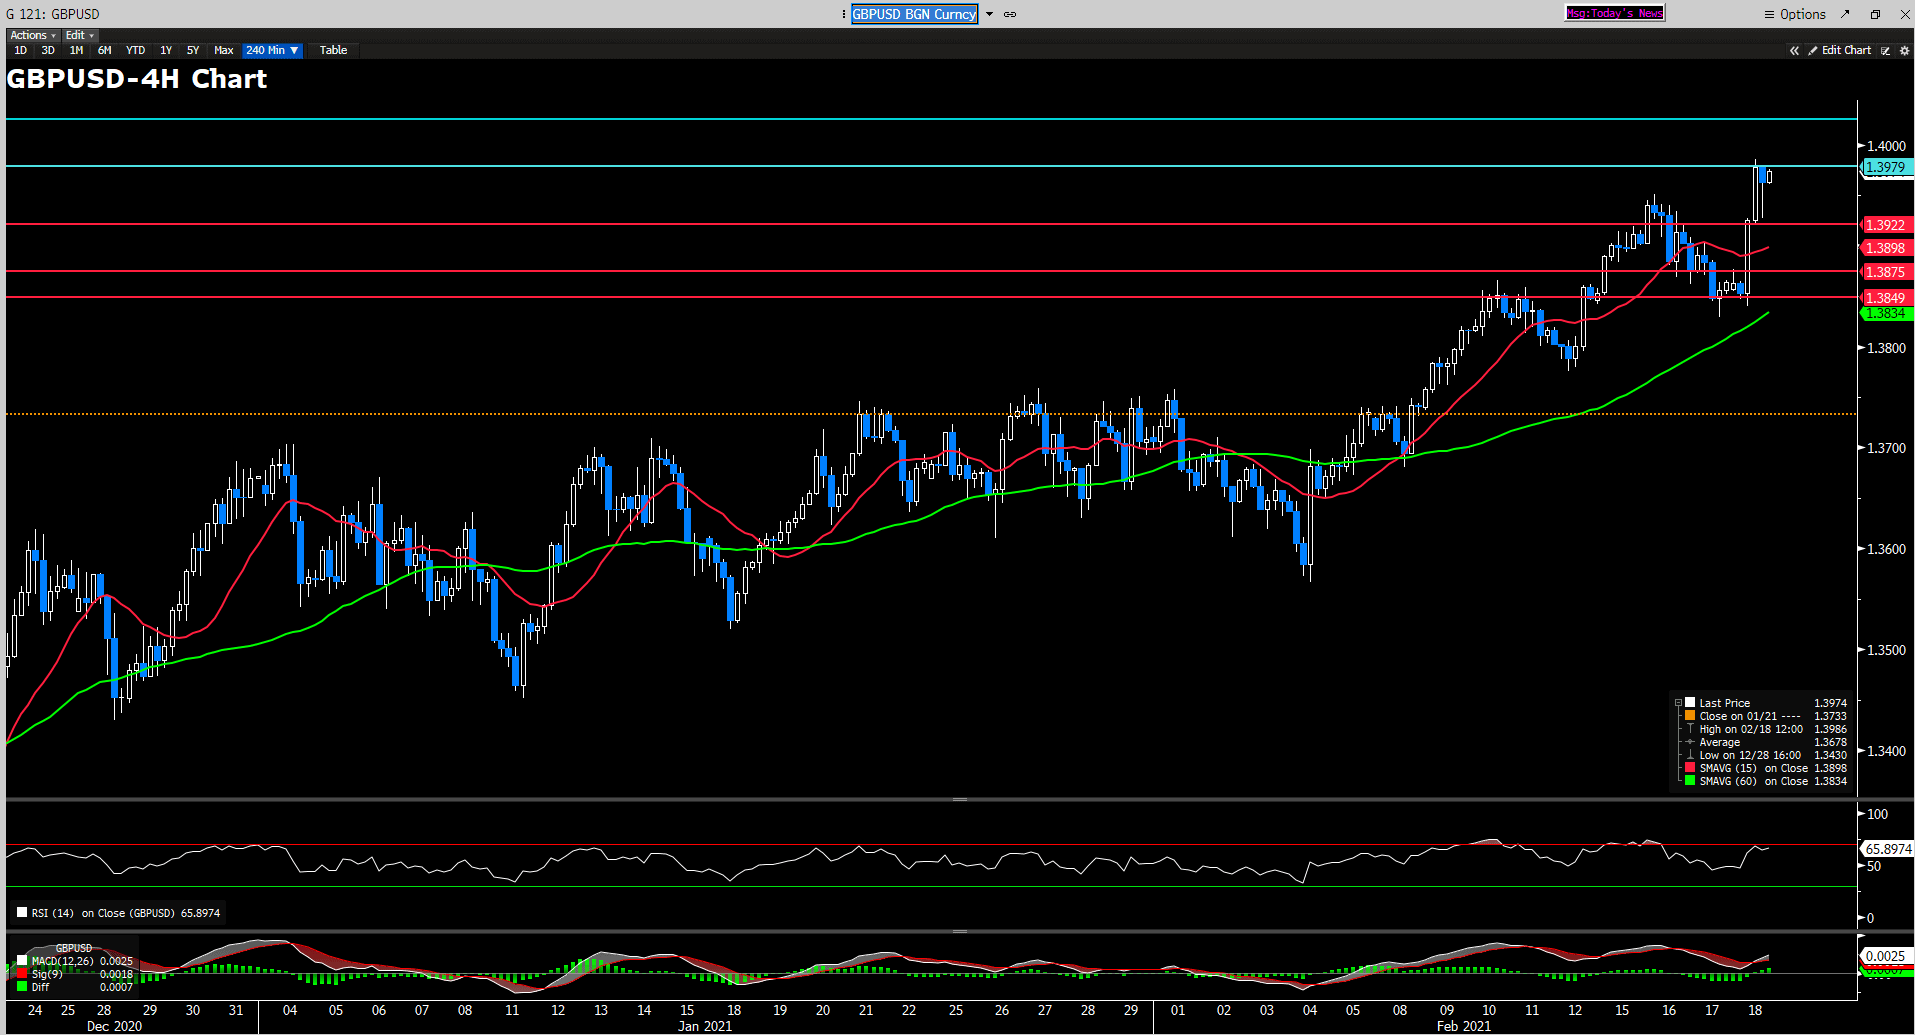
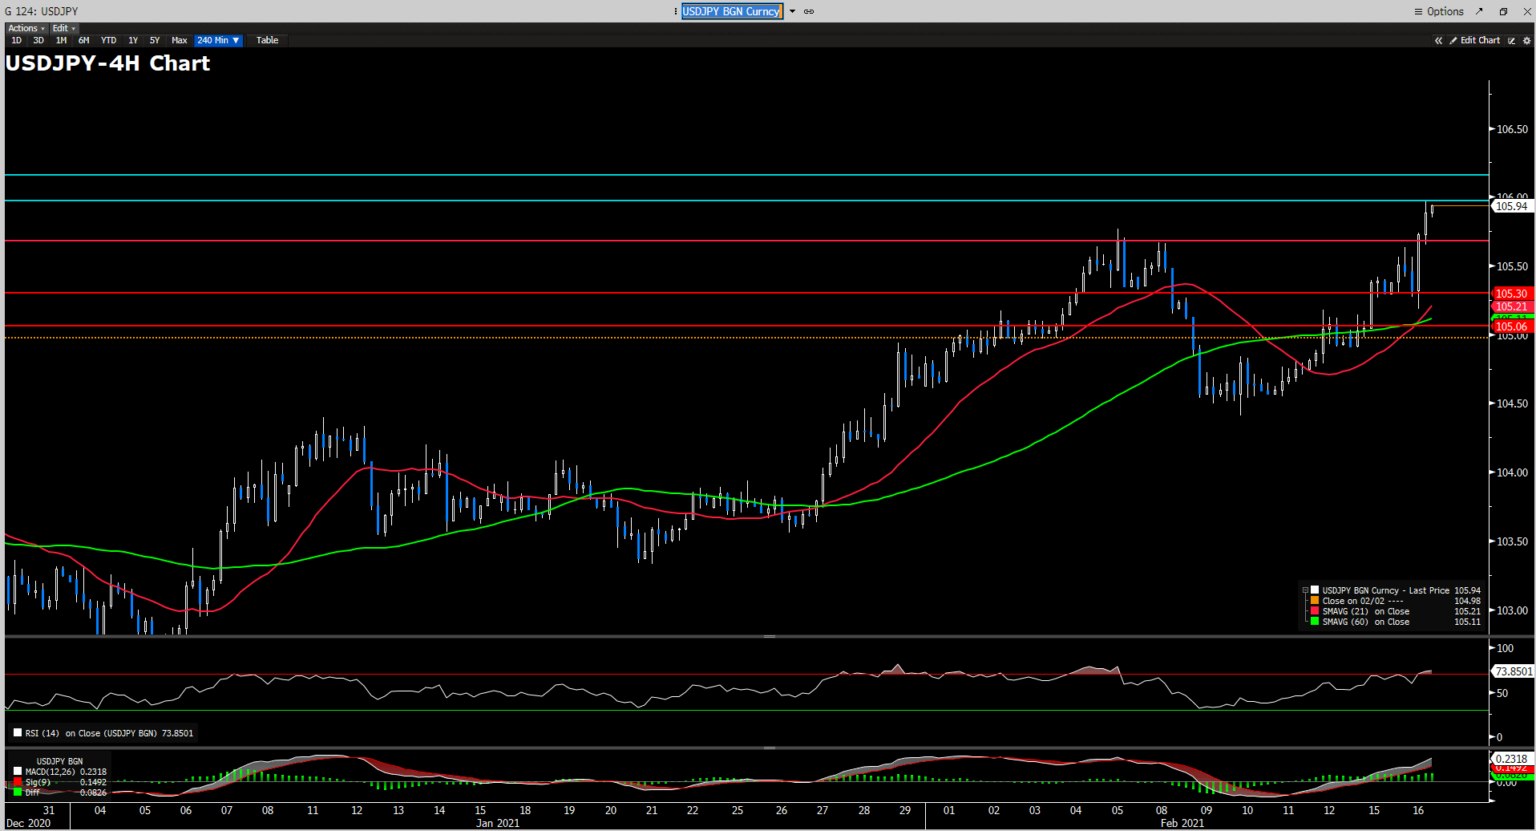
GBPUSD (Weekly Chart)
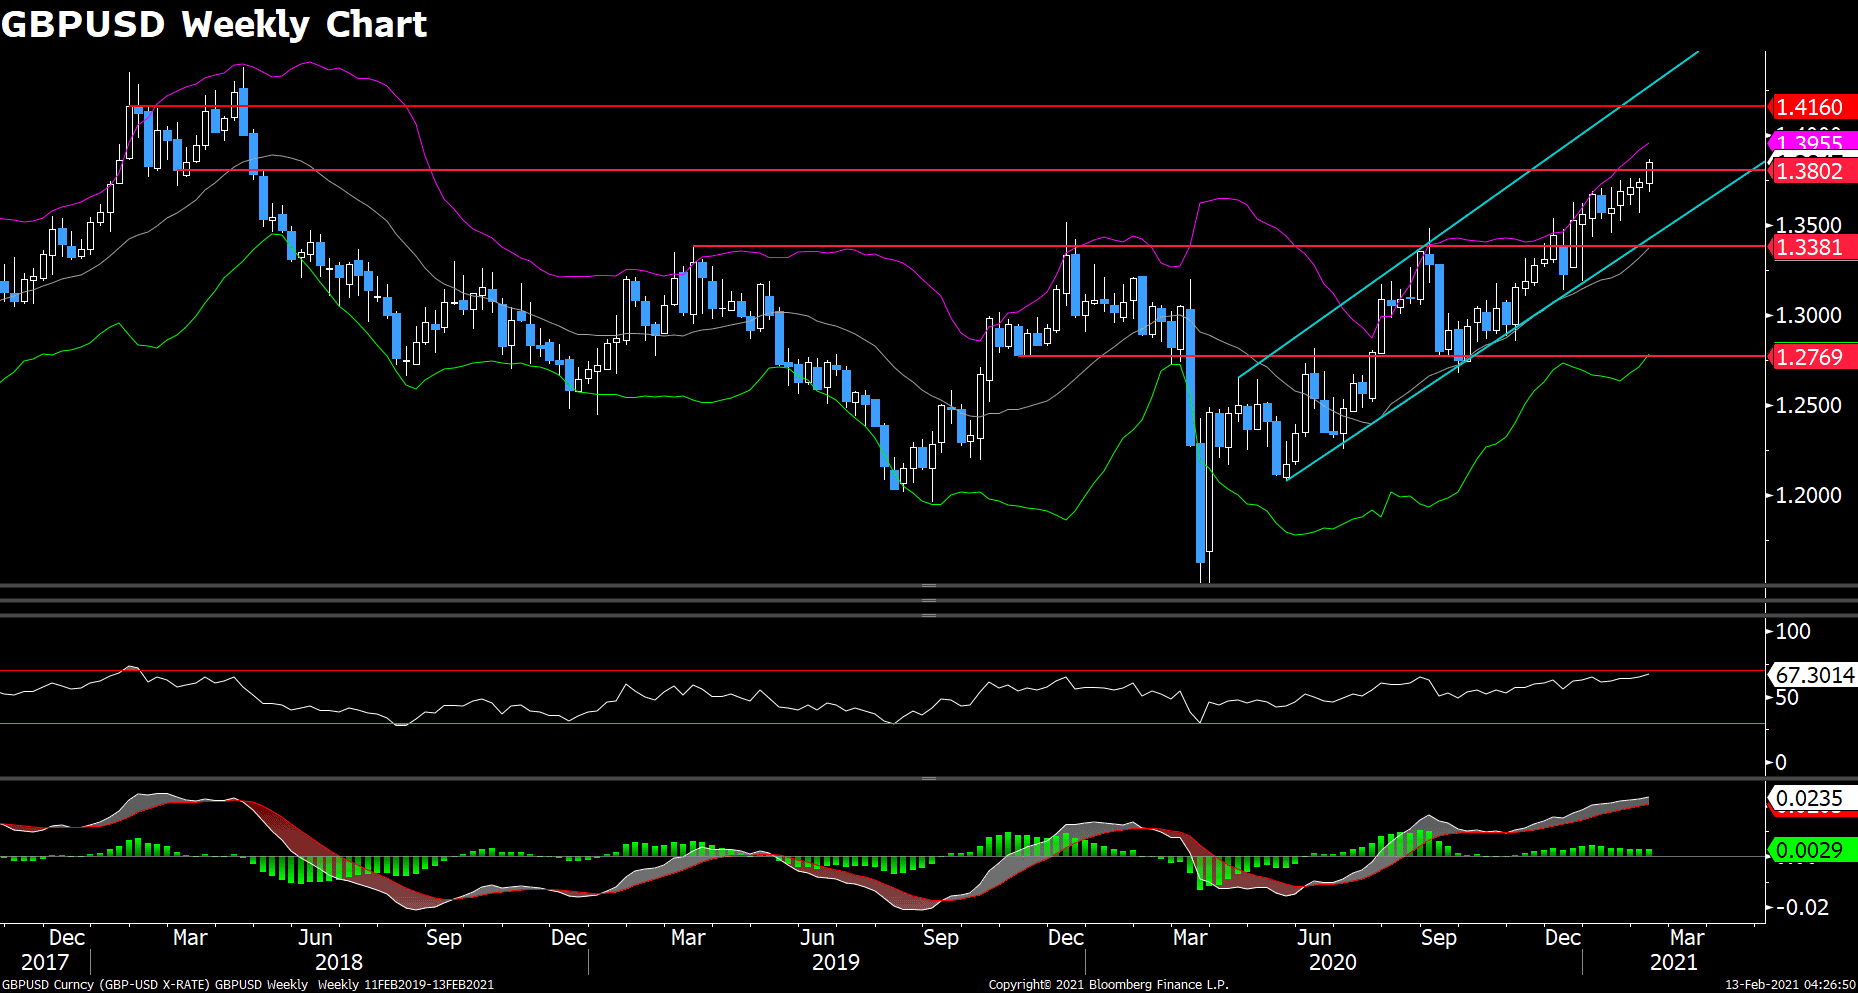
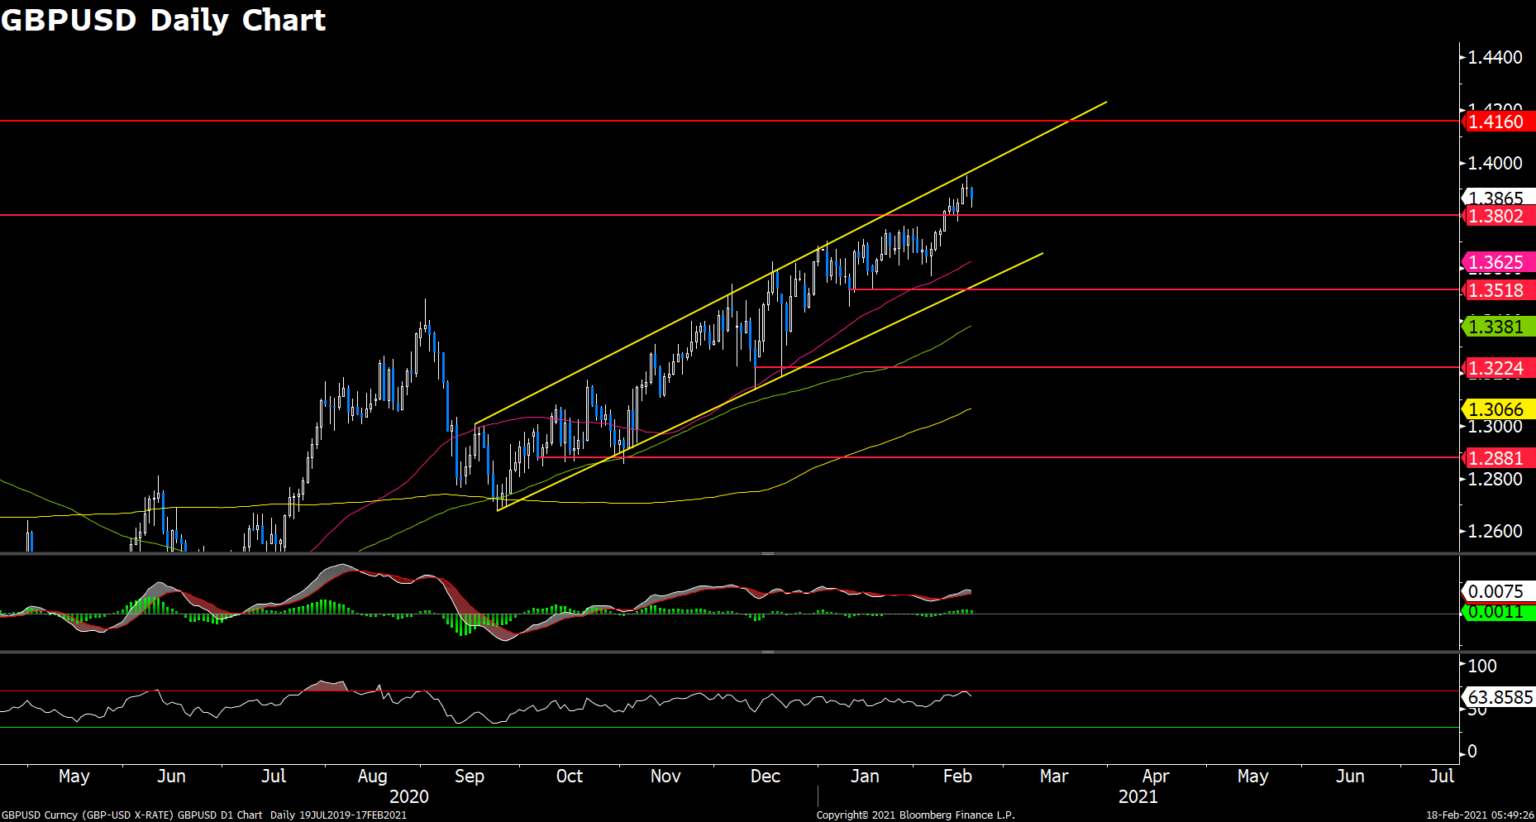
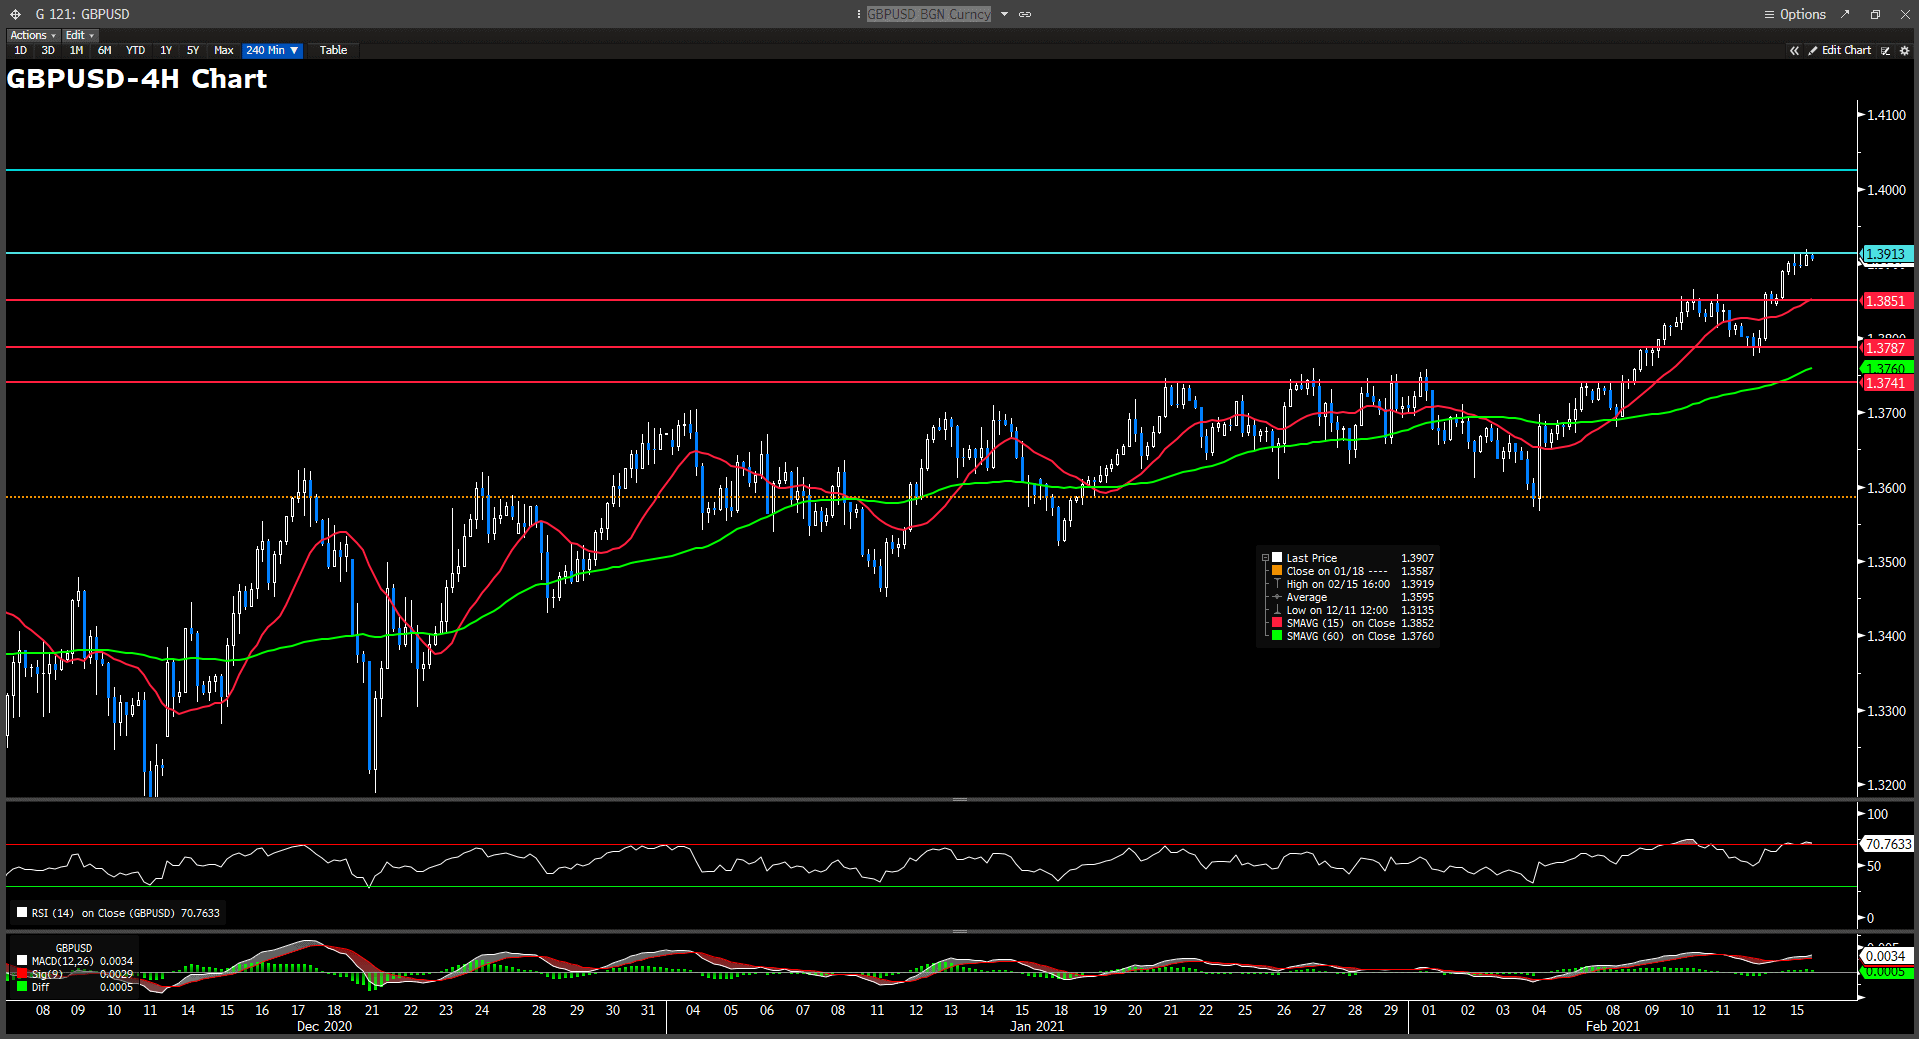
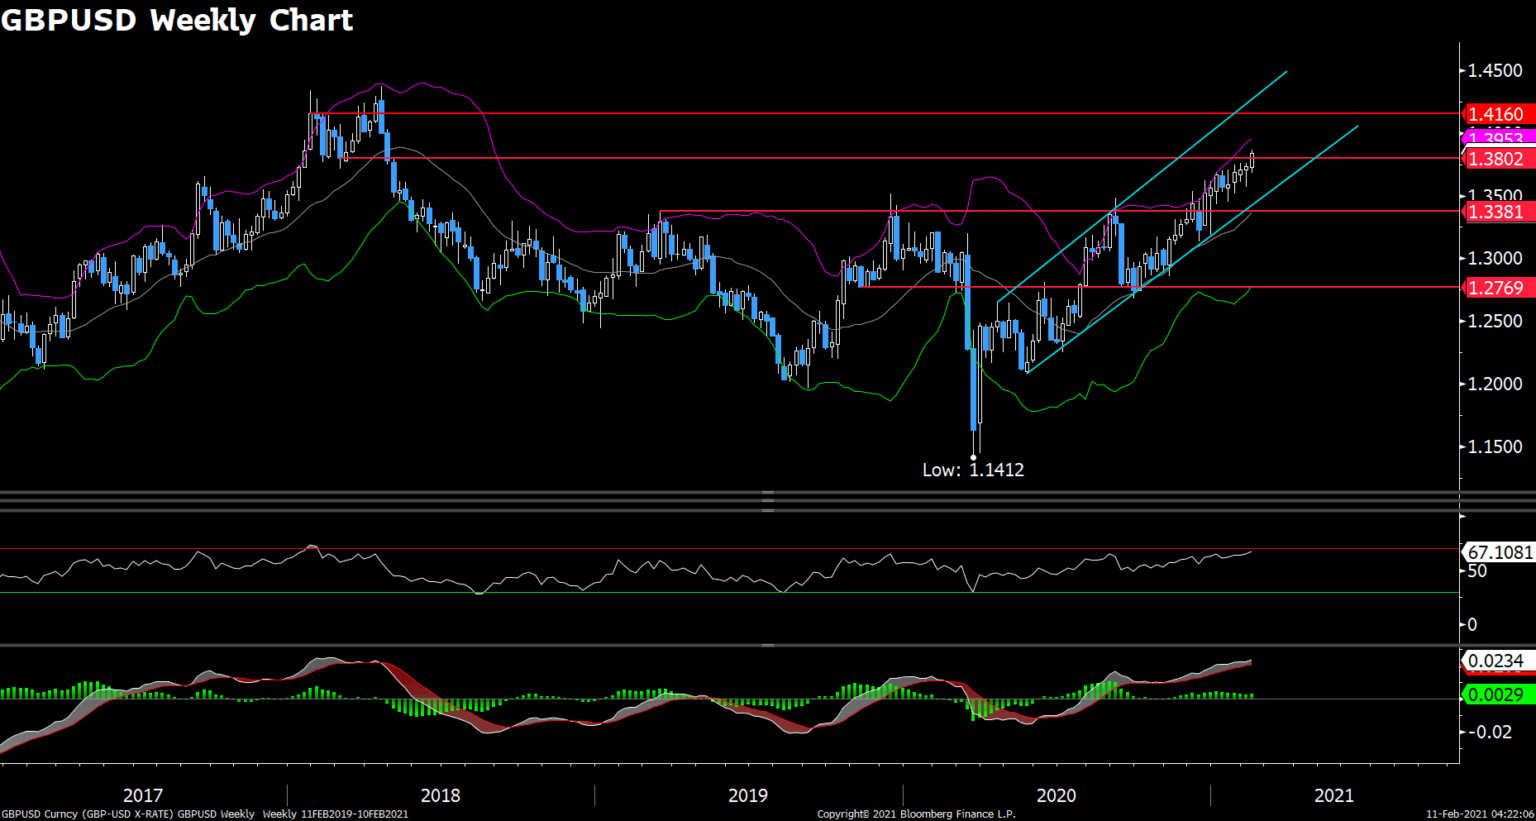
Cable is well placed in an upward trending tunnel since last April, and has managed to stand above 1.38 hurdle dated back to March 2018. The surge from the Sterling has been remarkable, gained nearly 15% against the US greenback since last May. We maintain our bullish bias on this pair given its strong fundamental, and most of the previous Brexit negativity have been removed from the market. However, it seems like Cable is running ahead of itself as RSI of 67.4 indicates the bulls are not far from overheating. A pullback toward 1.338 could definitely be healthy for a longer-term bullish run.
Resistance: 1.416, 1.4625
Support: 1.38, 1.338, 1.2769
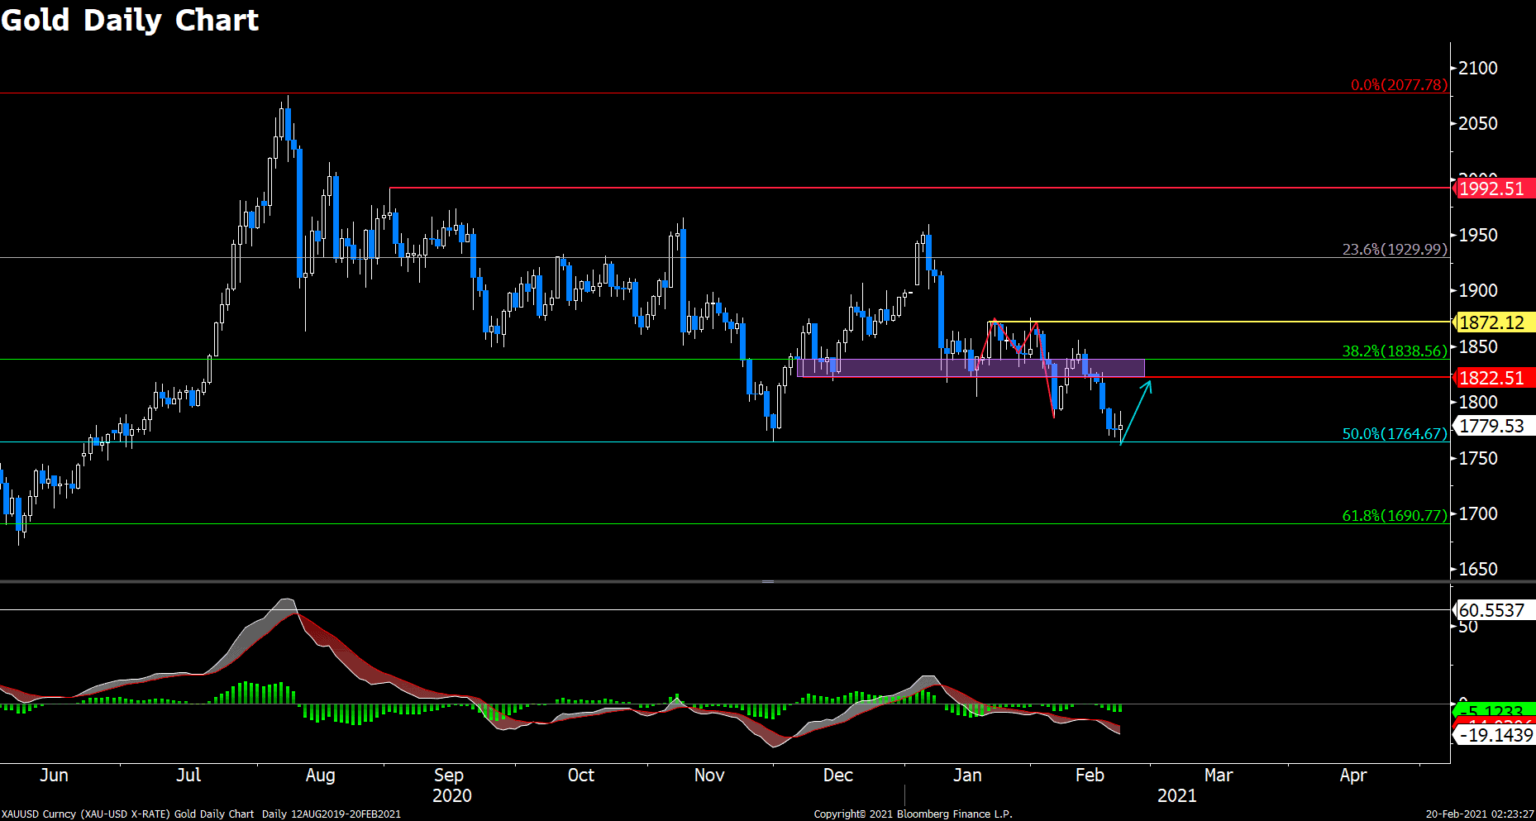
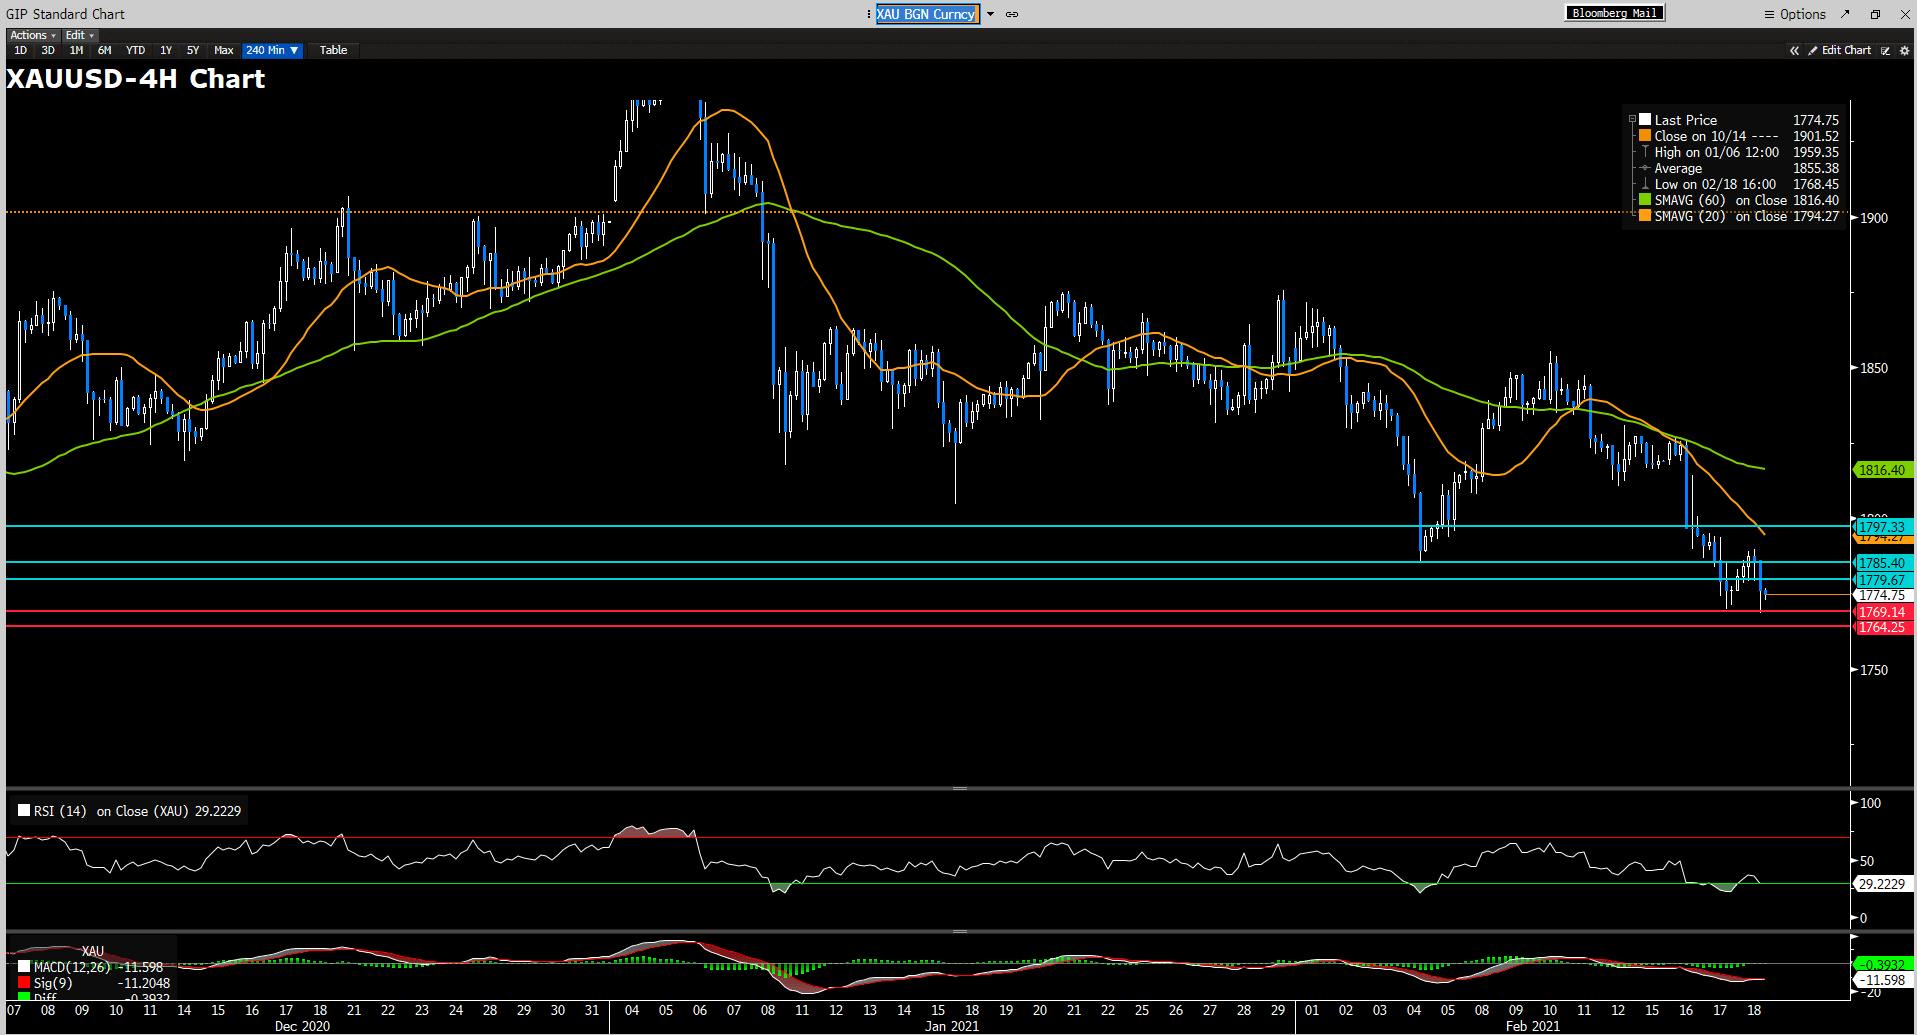
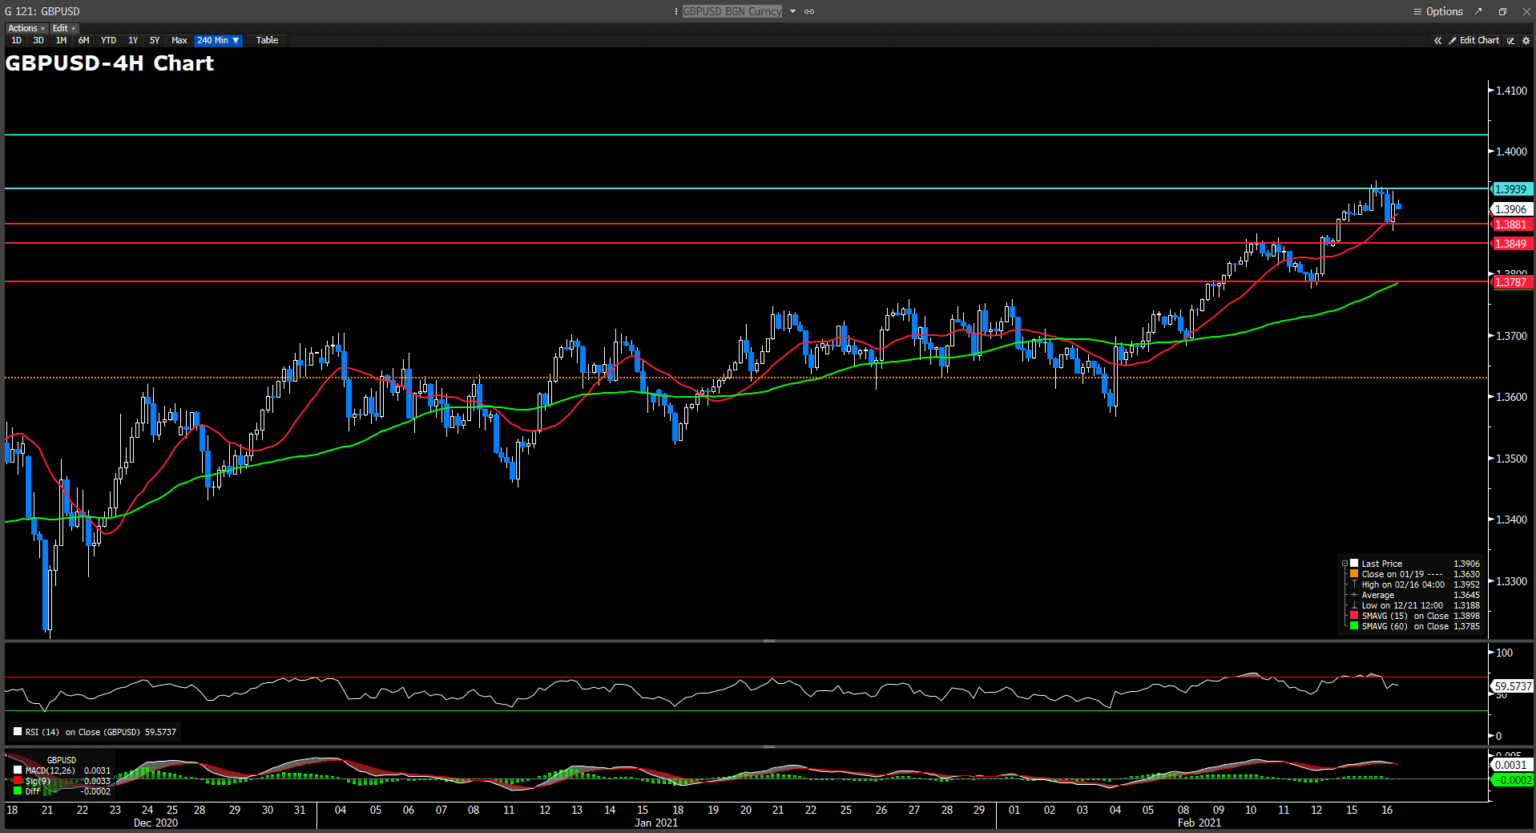
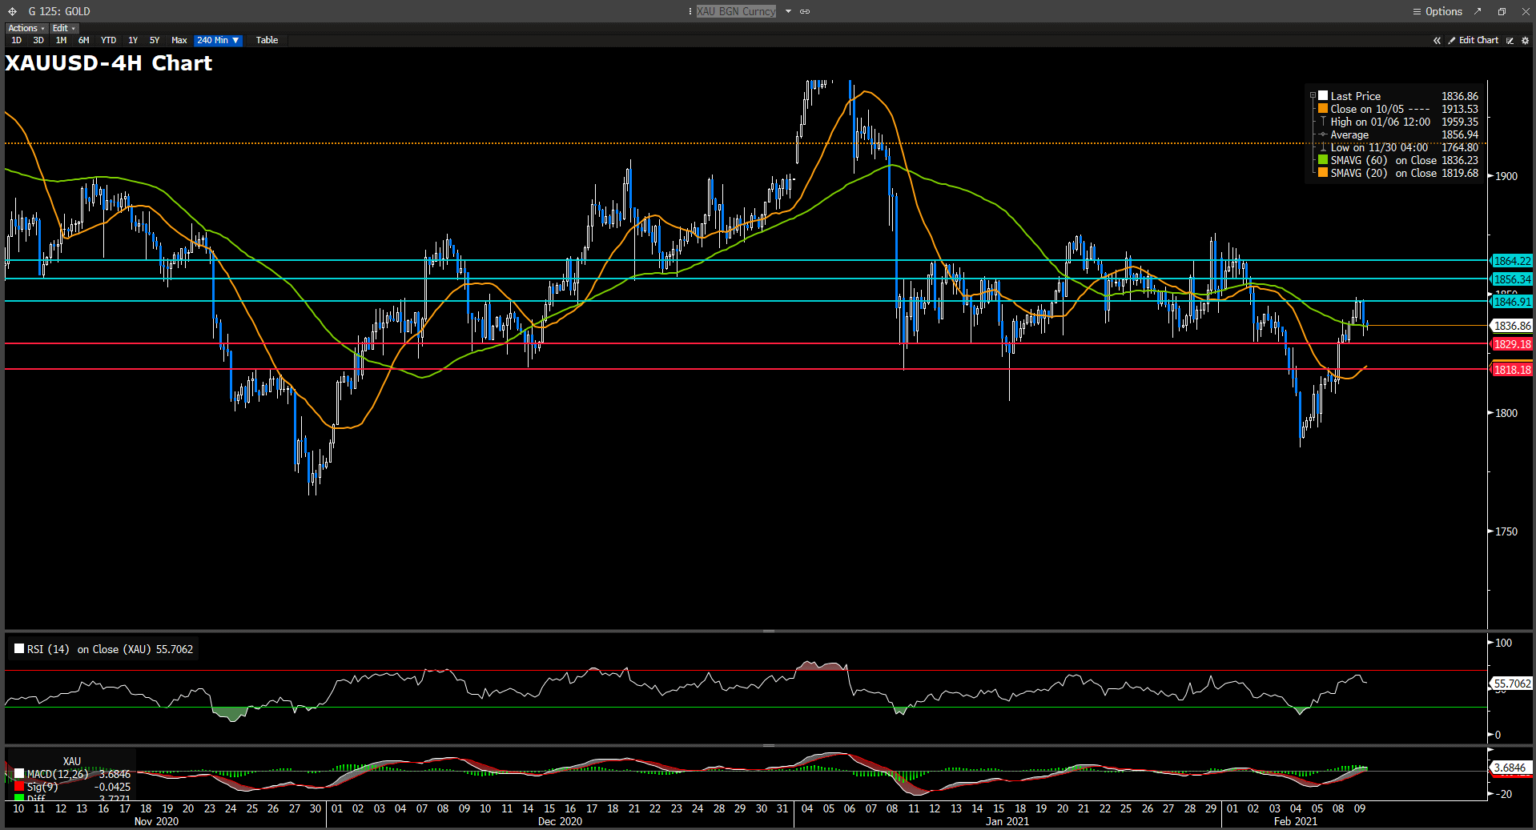
XAUUSD (Daily Chart)
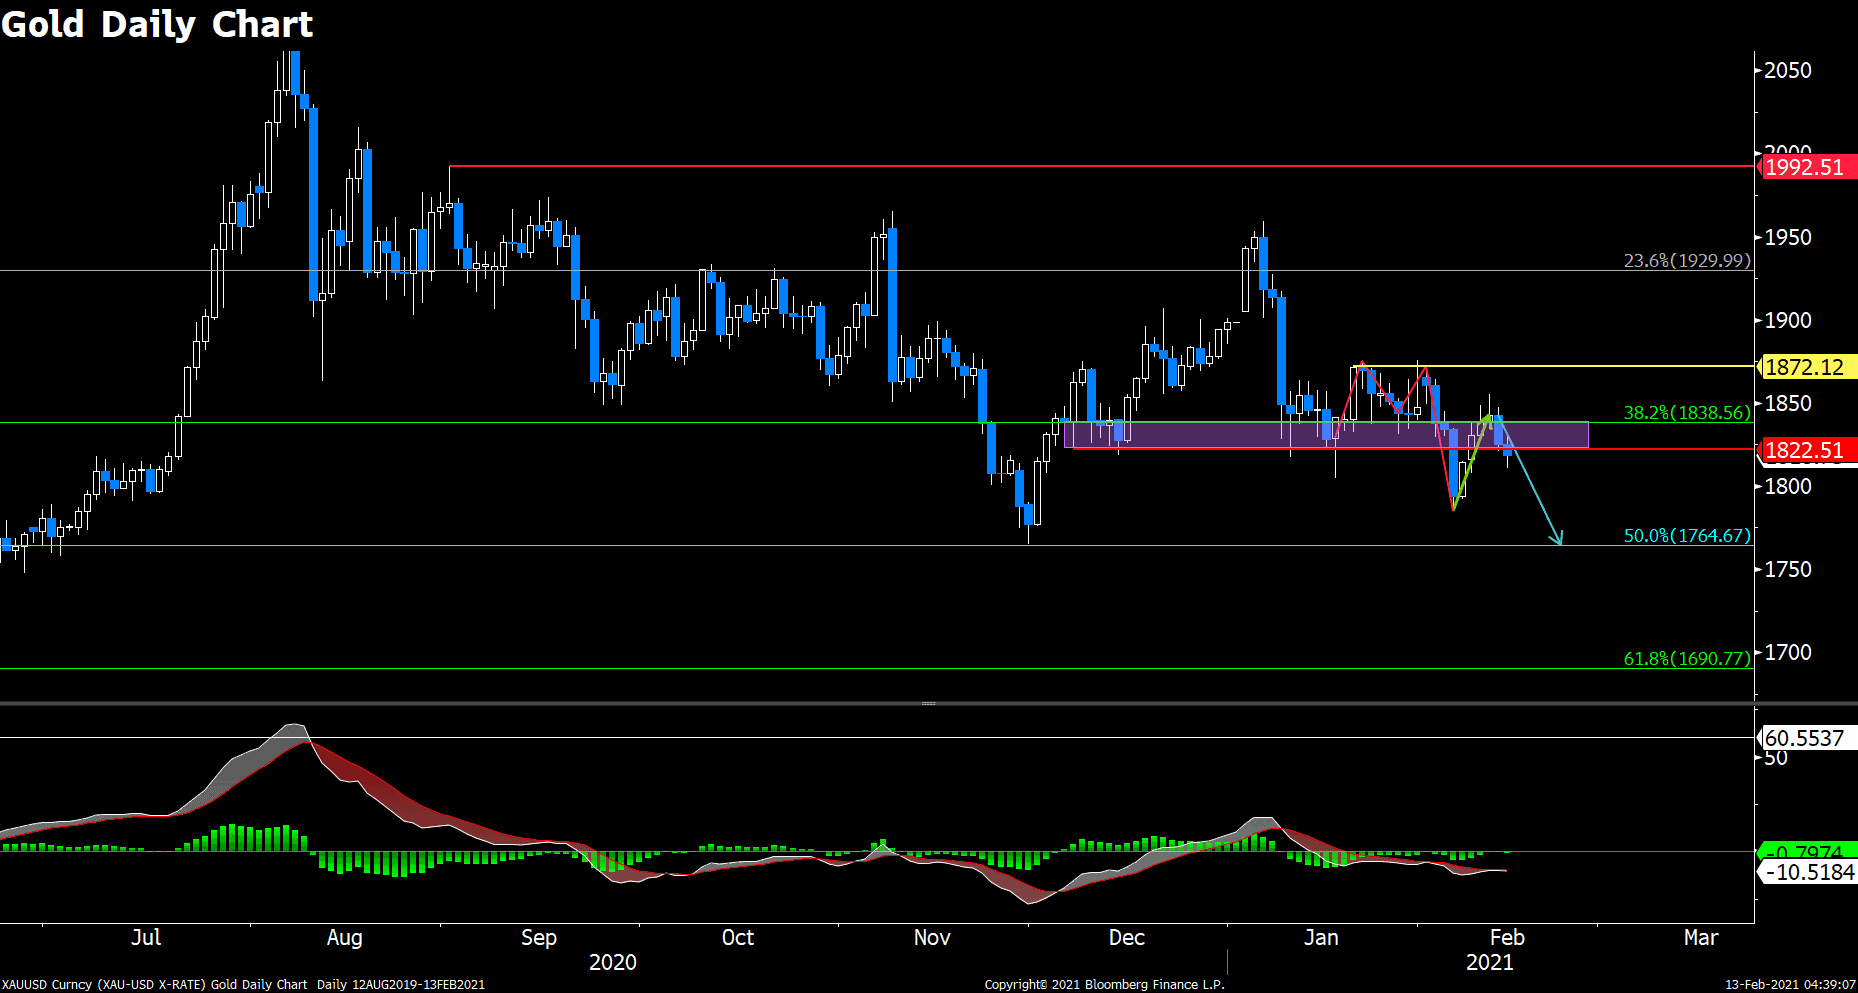
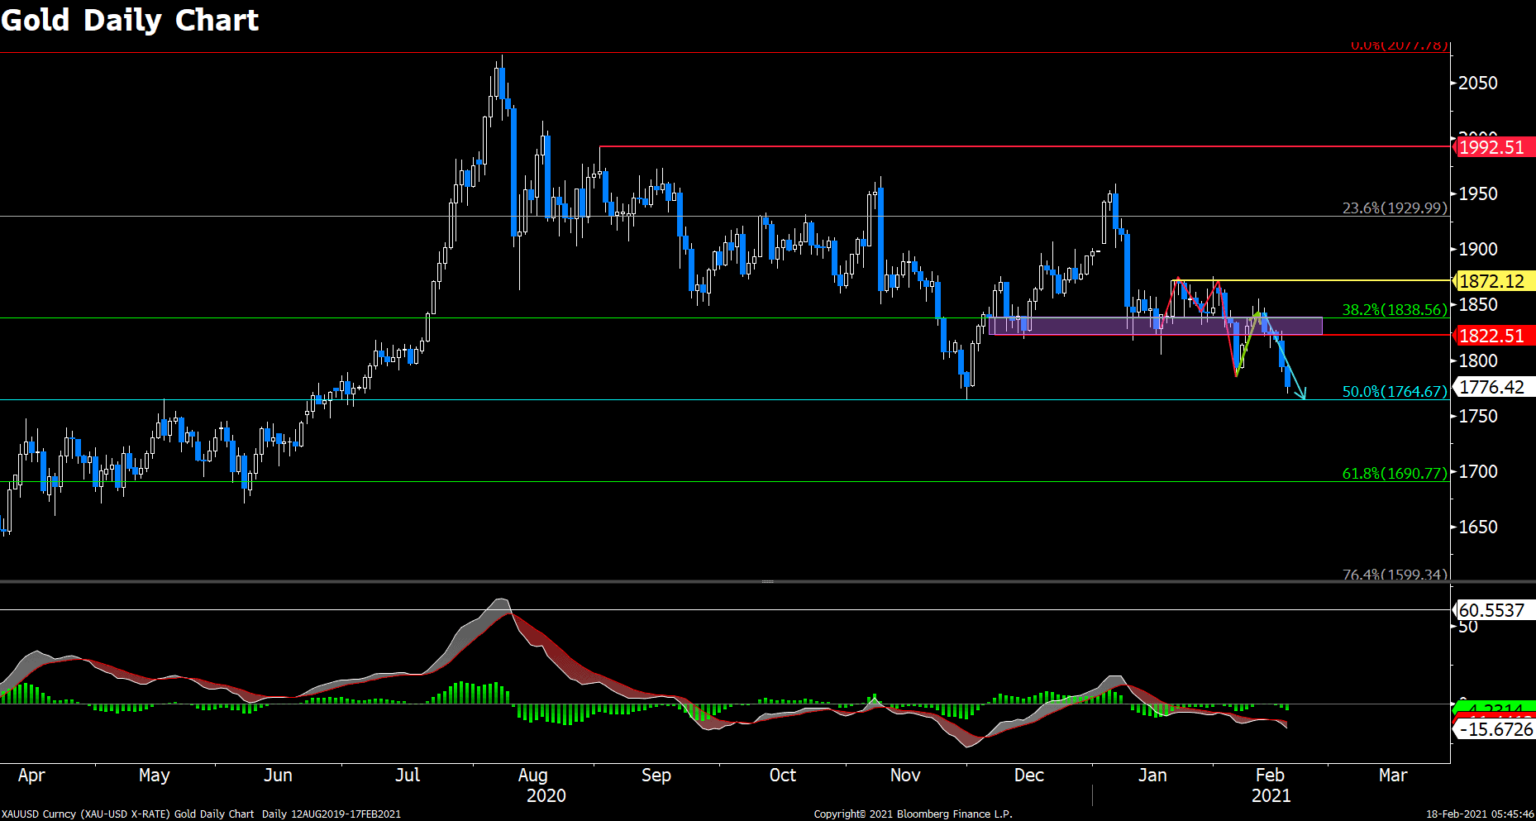
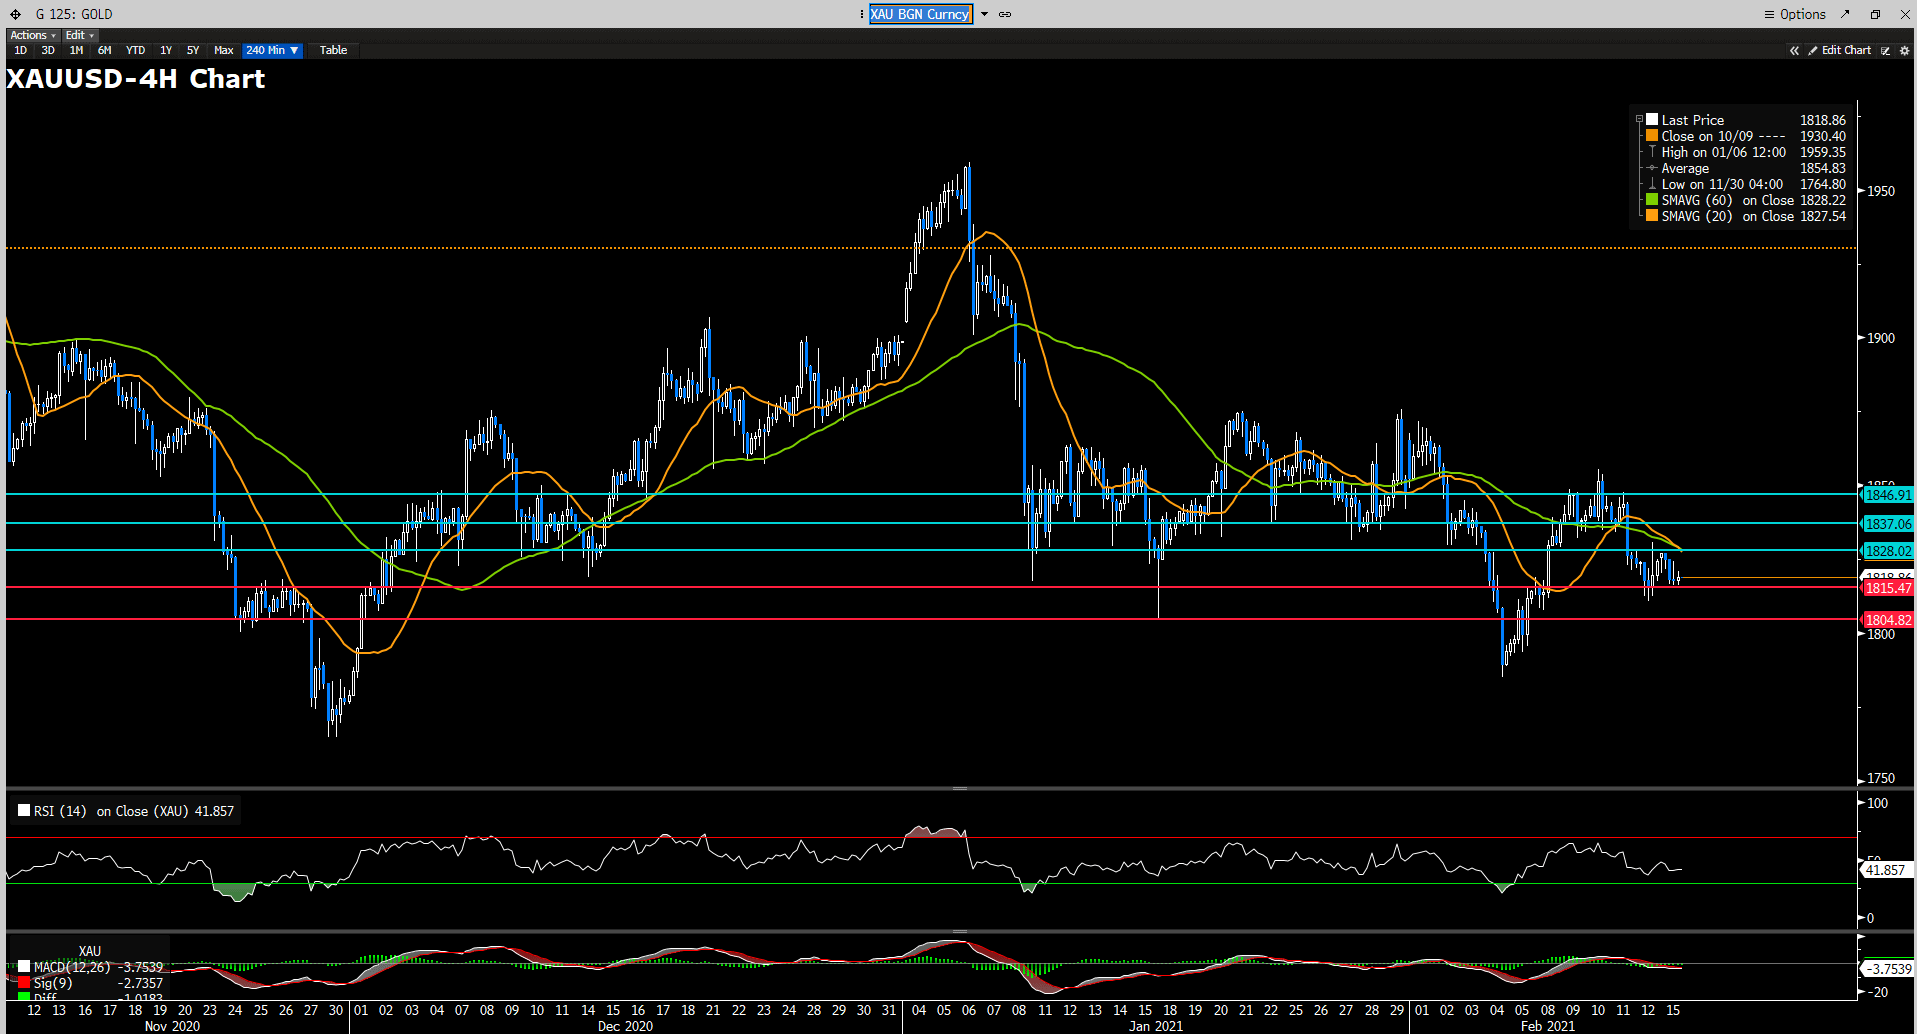
Gold was previously stuck within previous support band between $1838 and $1823, and it failed to stand on top of previous neckline, which speculators usually perceive as a strong sell signal. Now that price slips below $1823, it opens door for sellers to explore further downside space. Bearish momentum could accelerate from here since not much technical supports or resistances were established between $1823 and $1765. It seems like MACD on the daily chart changes its tone from a bullish reversal to continuation of bearish trend.
Resistance: 1823, 1872, 1930
Support: 1765, 1691
Economic Data
Click here to view today’s important economic data.