Daily Market Analysis
Market Focus
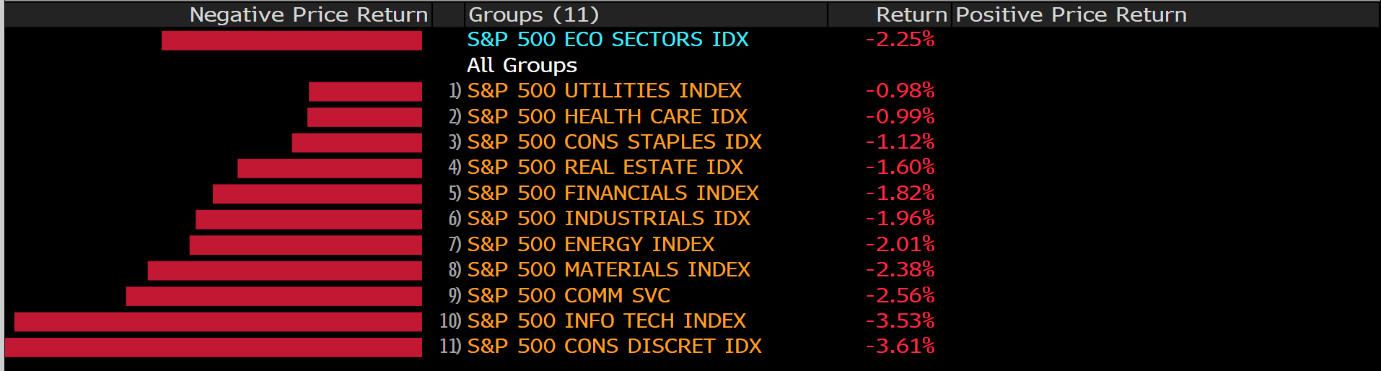
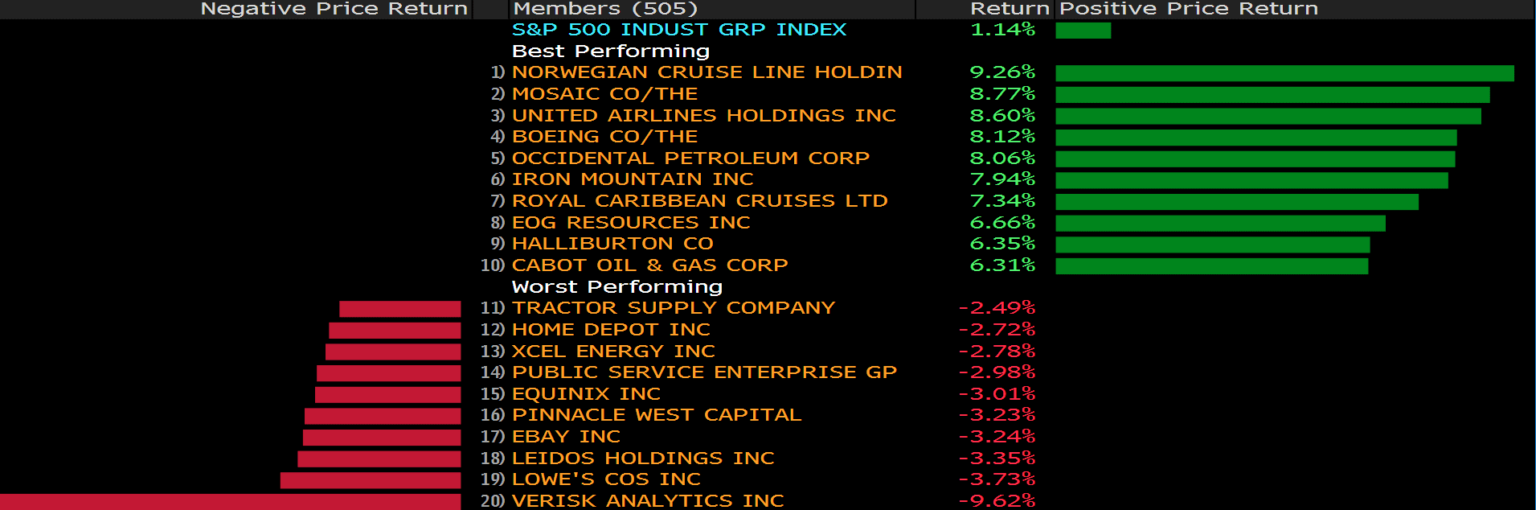
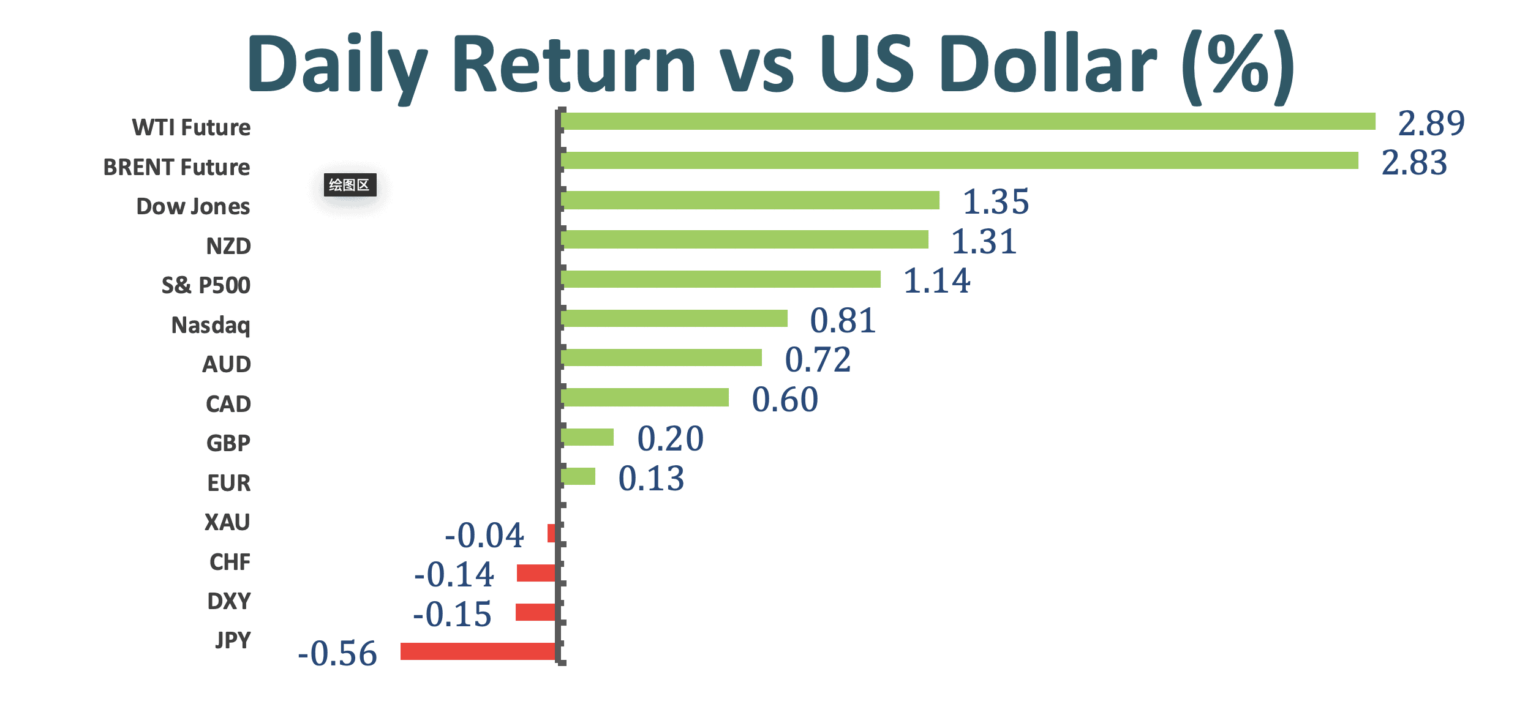
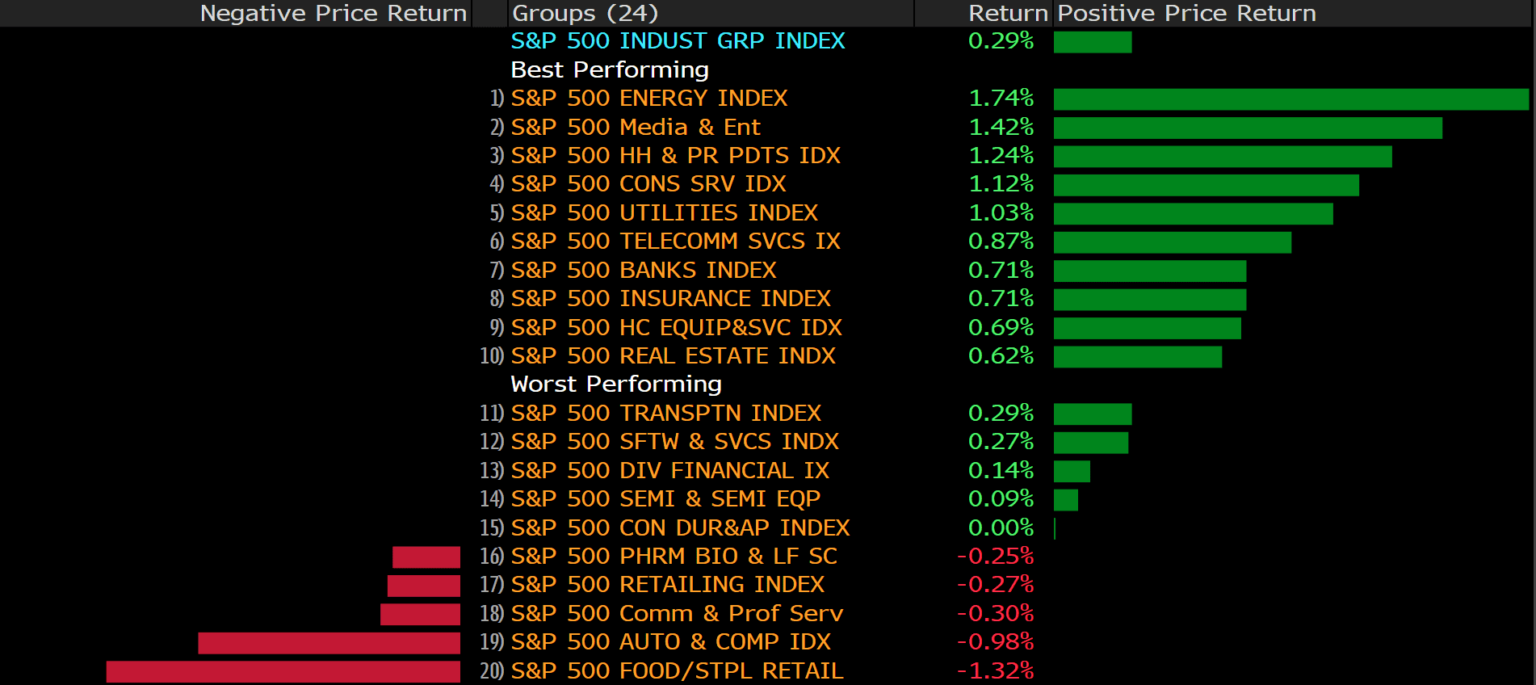
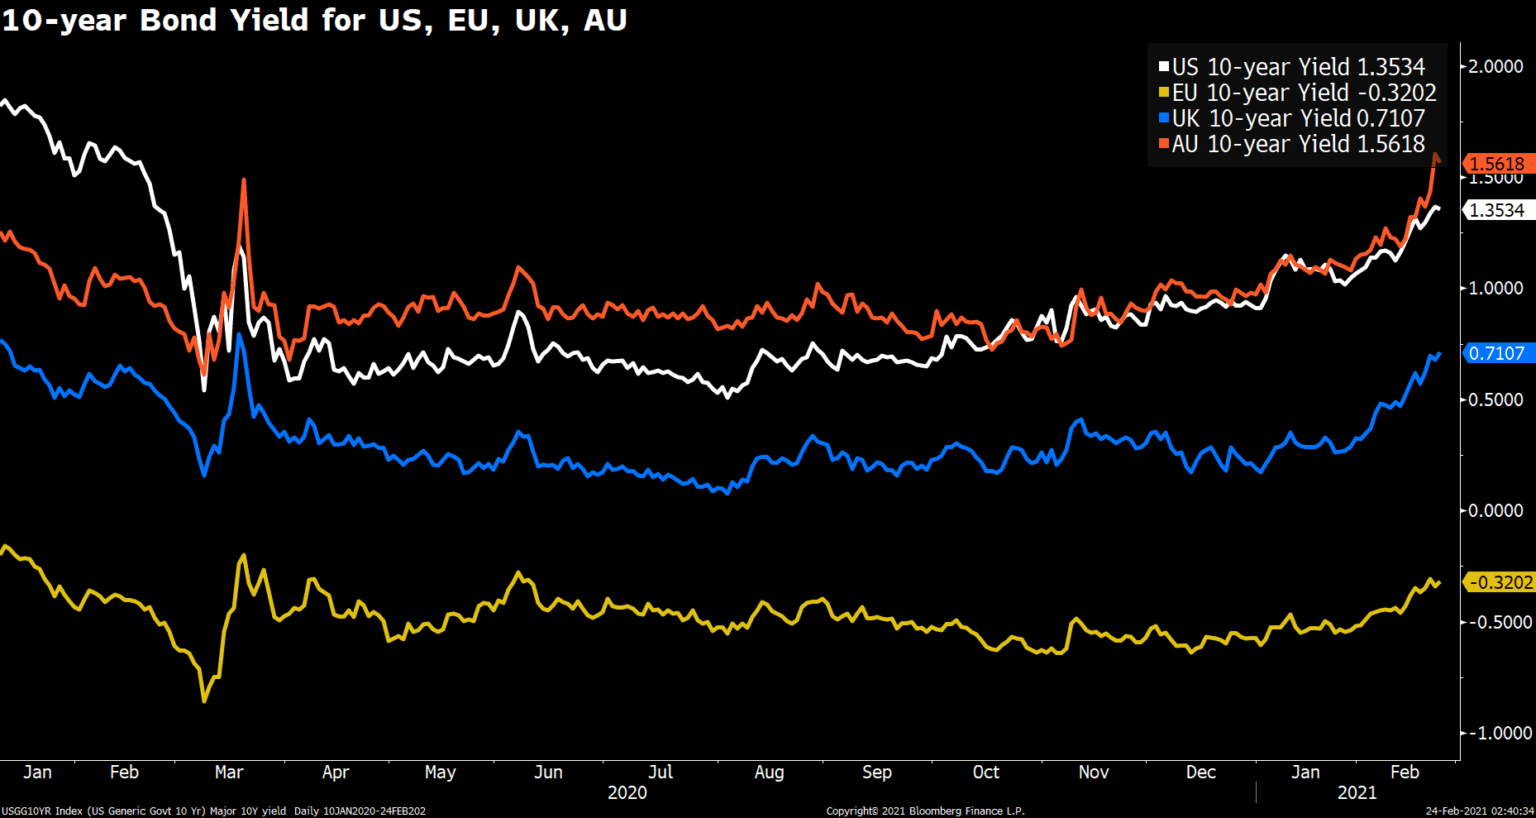
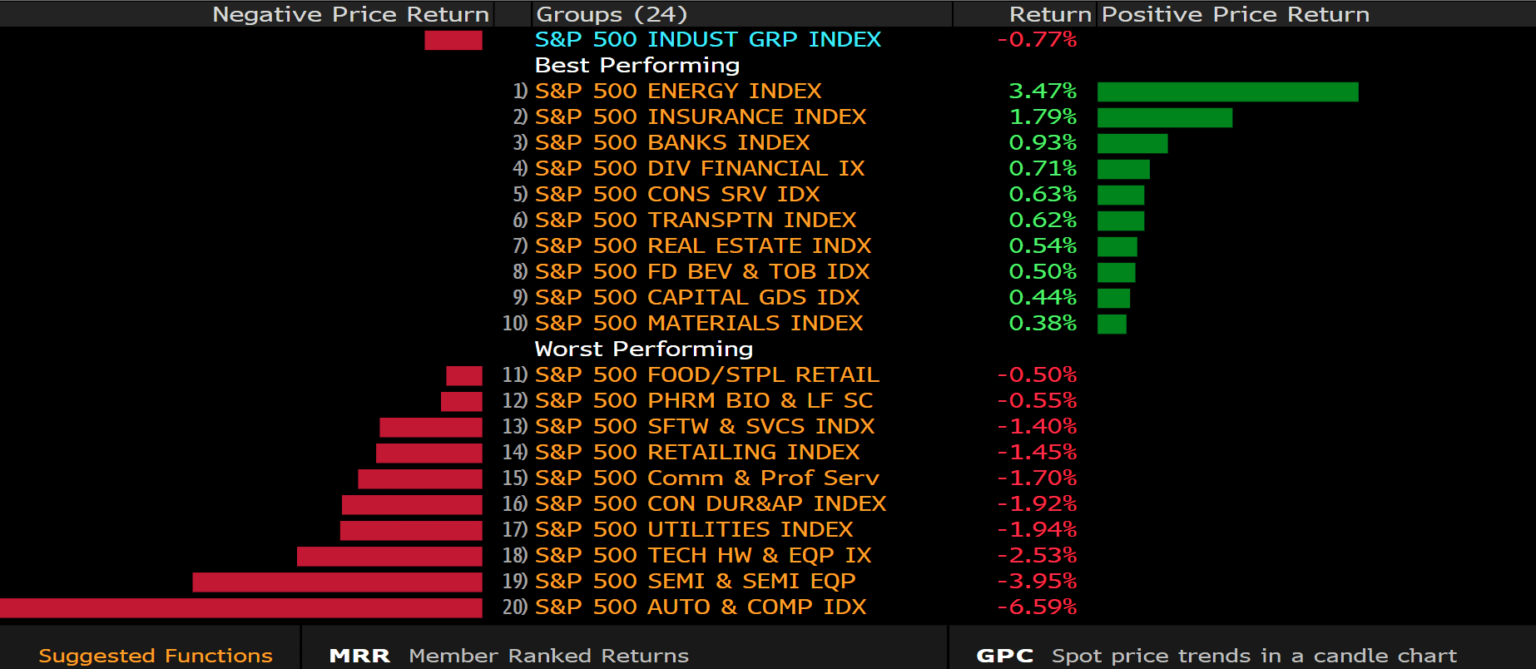
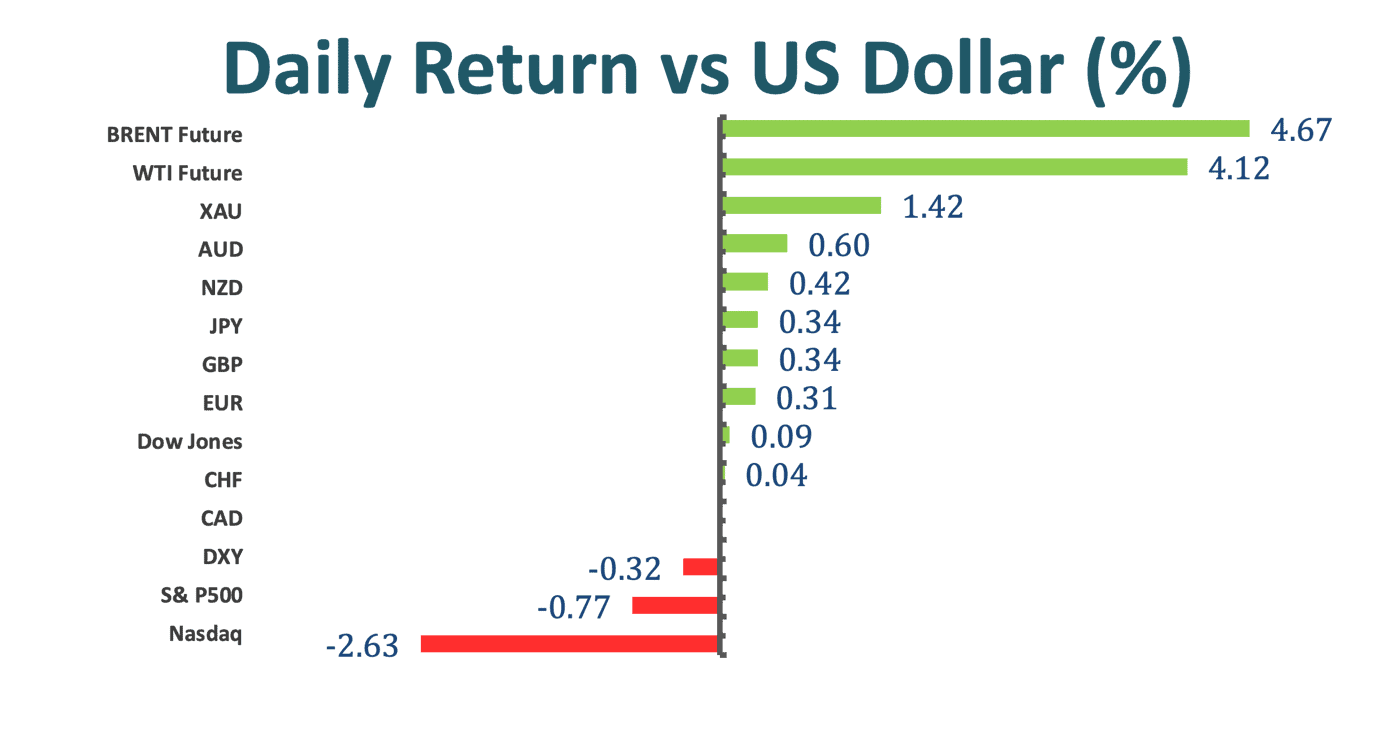
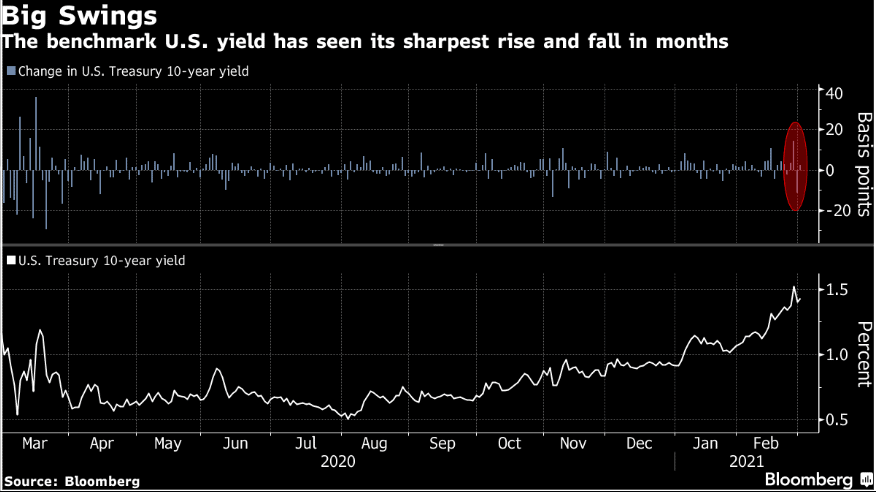
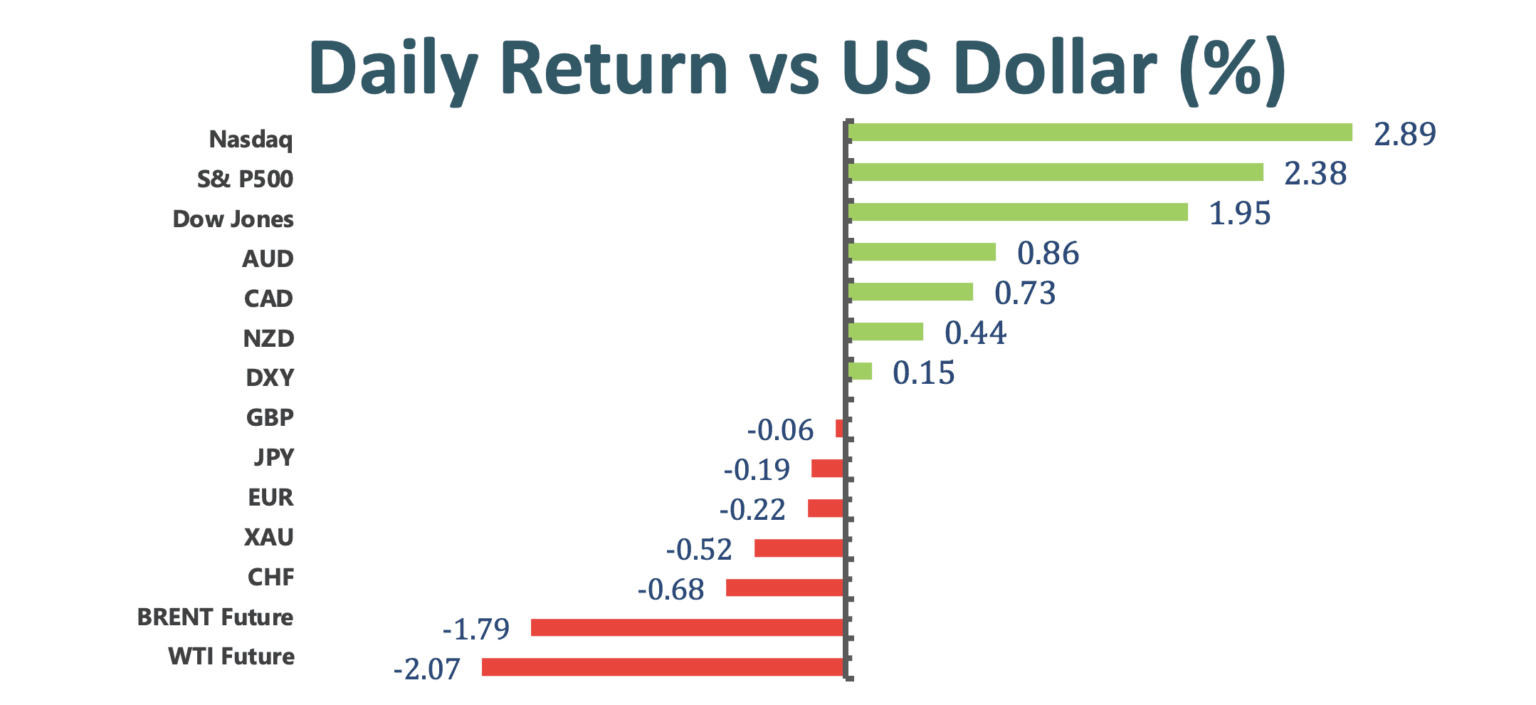
U.S. stocks climbed as confidence returned to markets, easing concerns about inflation and higher Treasury yields would undermine equity valuations. The Dow Jones Industrial Average surged around 2.2%, led by Boeing, which rose around 7%; at the same time, the S&P 500 rose around 2.1% while the Nasdaq gained about 2.0%. After last week’s intense volatility in bond markets, investors piled back into risk assets, leading a rebound in stock markets. According to the C.F.O. at Bleakley Advisory Group, equity markets will be fluctuate mainly focusing on the benefits of the vaccines and the challenge of higher yield rates this year.
After a huge tumbling week, dropping more than 20%, Bitcoin rallied back near $49,000, riding a broad resurgence in risk assets and a bullish support from Citigroup Inc. Citigroup described Bitcoin as blockchain’s “North Star,” as it laid out a case for the cryptocurrency assets to play a bigger role in the global financial system, mentioning that cryptocurrency assets can potentially become the currency of choice for international trade in the future. At the same time, MicroStrategy Inc has decided to purchase more than $4 billion worth of Bitcoin, boosting the price of Bitcoin as today’s bullish support.
Asian equity markets rebounded as technology giants climbed and expectations became optimistic. Among the markets, Tencent was the notable boost to the MSCI Asia Pacific Index, rising more than 5% today. The Hang Seng Index also climbed more than 1.5% after plans were announced to expand the gauge to 55 members from 52 members.
Market Wrap
Main Pairs Movement
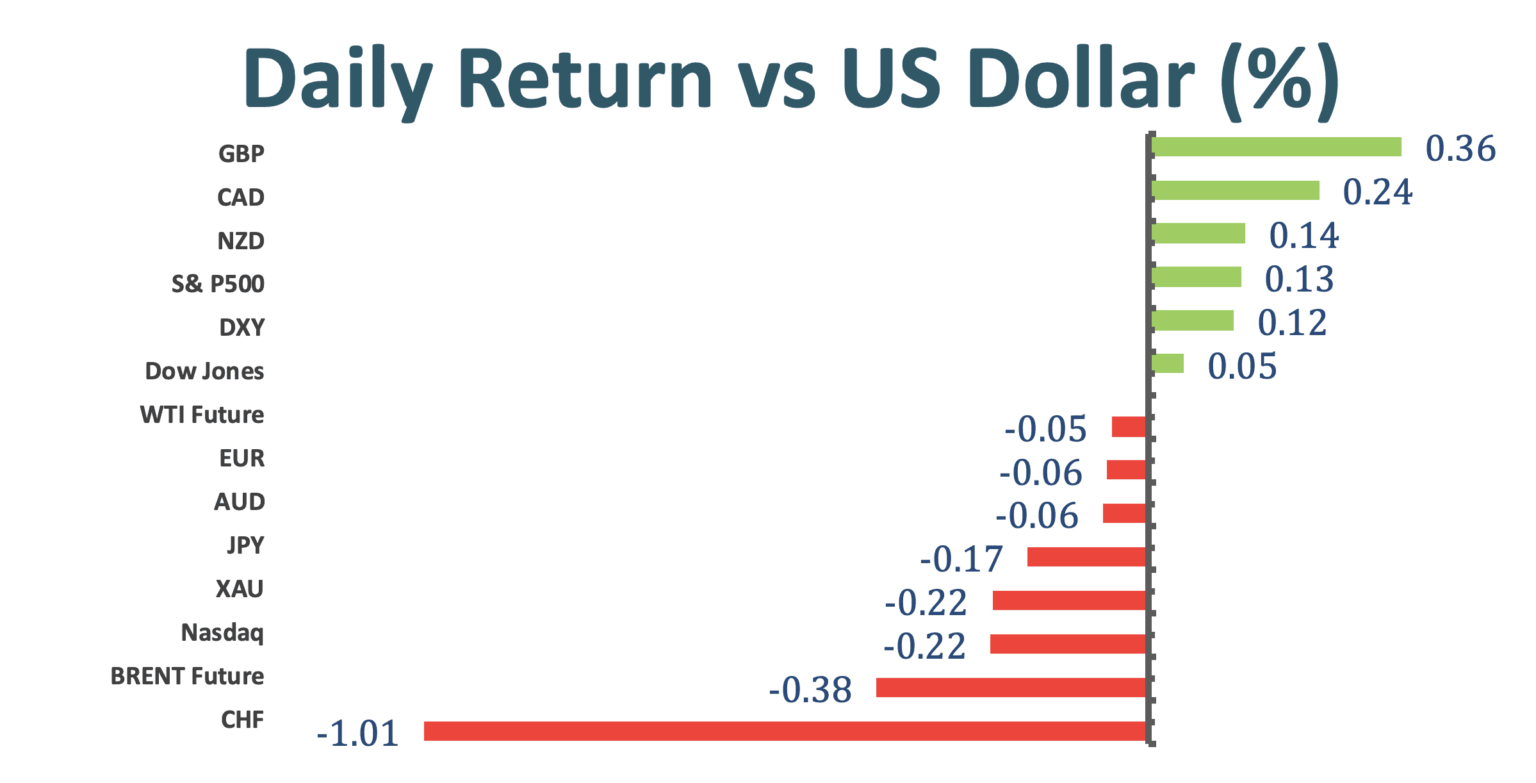
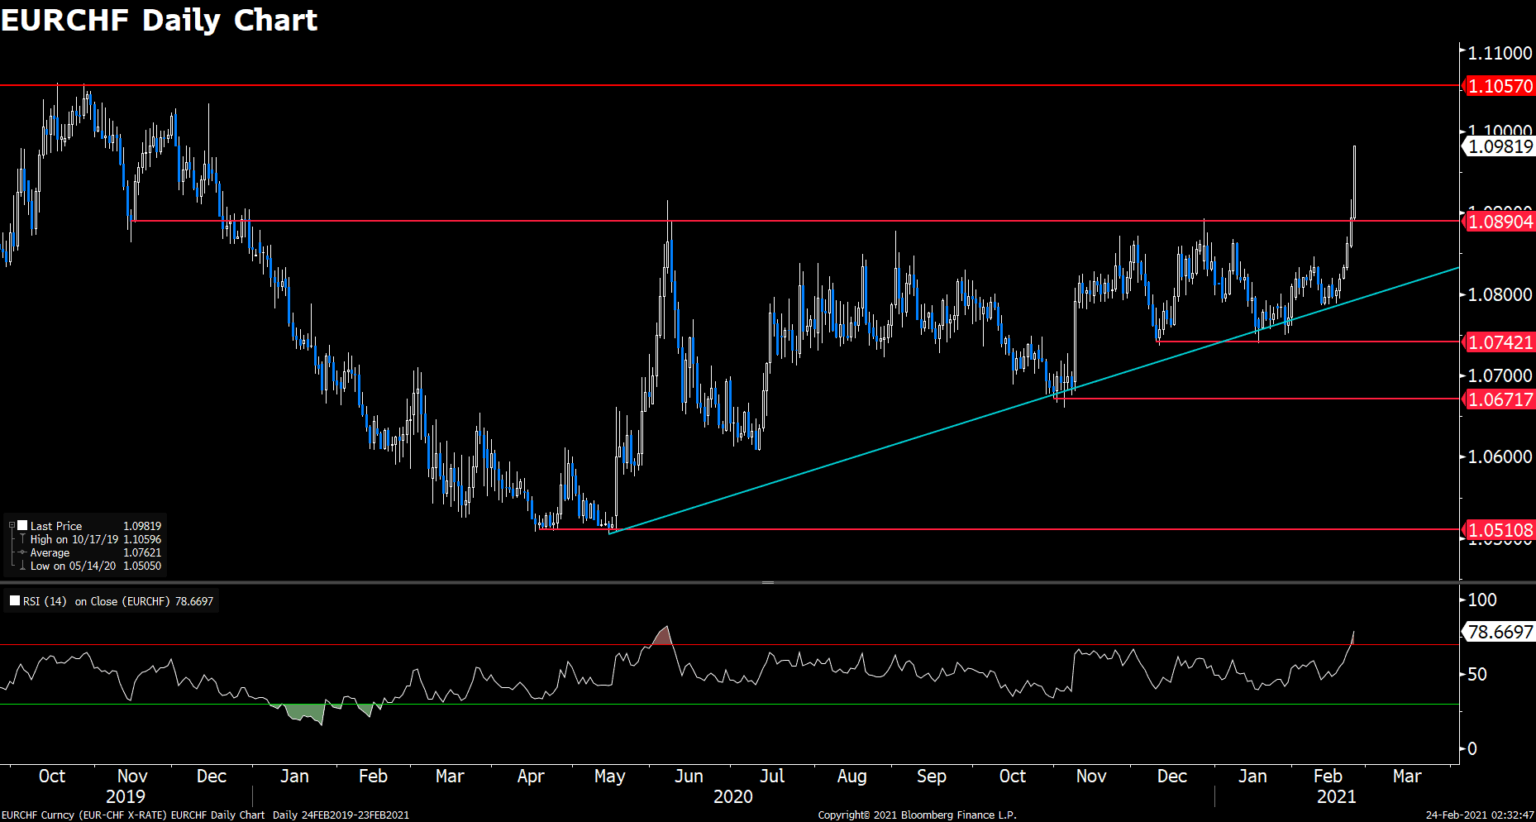
EUR/USD was down around 0.12% as the time of writing as the European Central Bank tried to make meaningful impact on the currency. The ECB announced to help ensure that companies and families can access financial assistance they need to weather this economic storm. In the meantime, the ECB has decided to slow the pace of bond- buying for the purpose of fighting against rising bond yields. However, those actions from the ECB seem to not affectively help the currency.
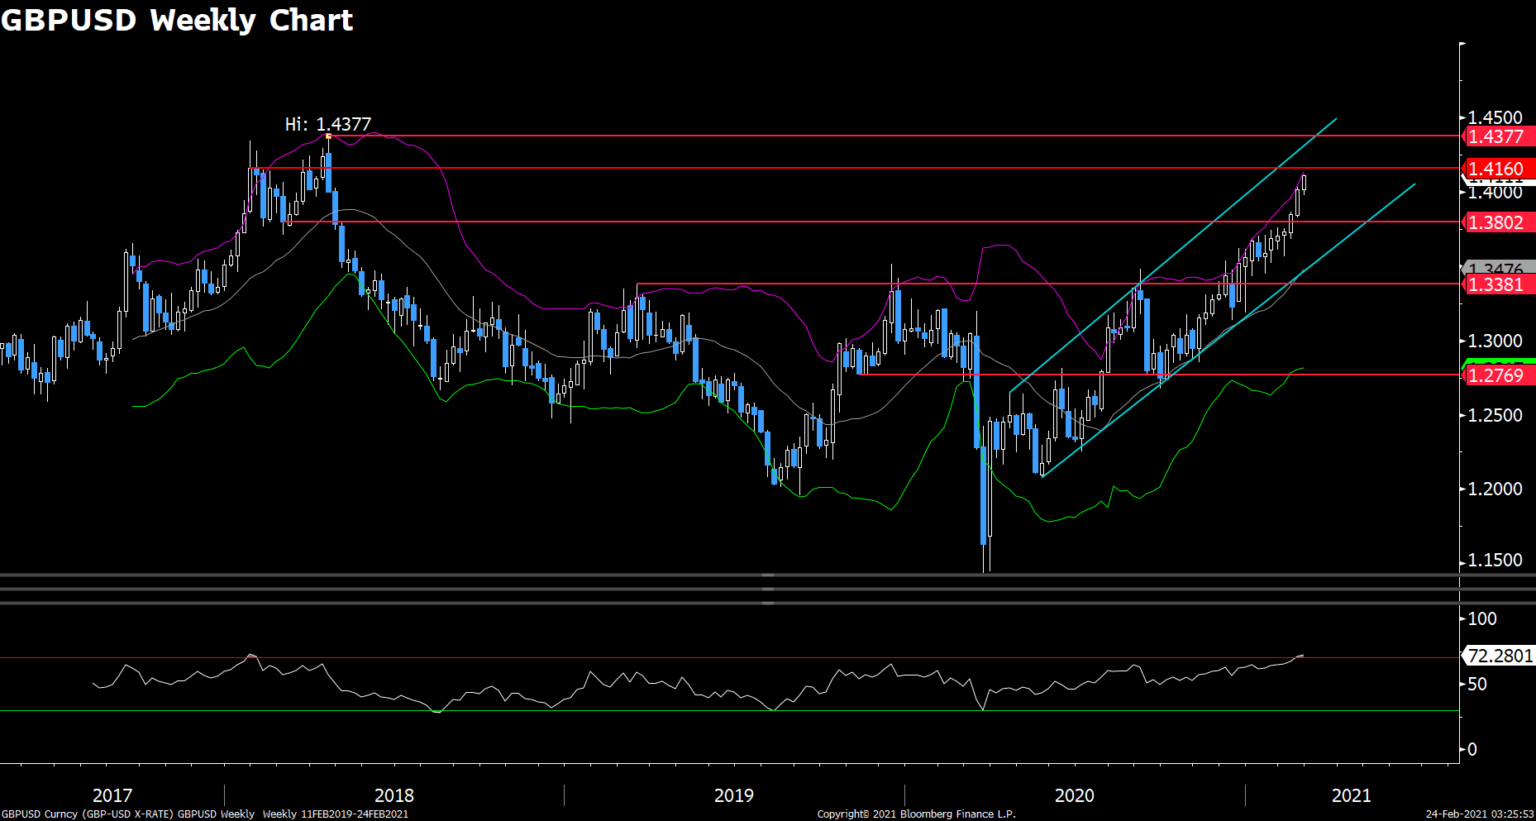
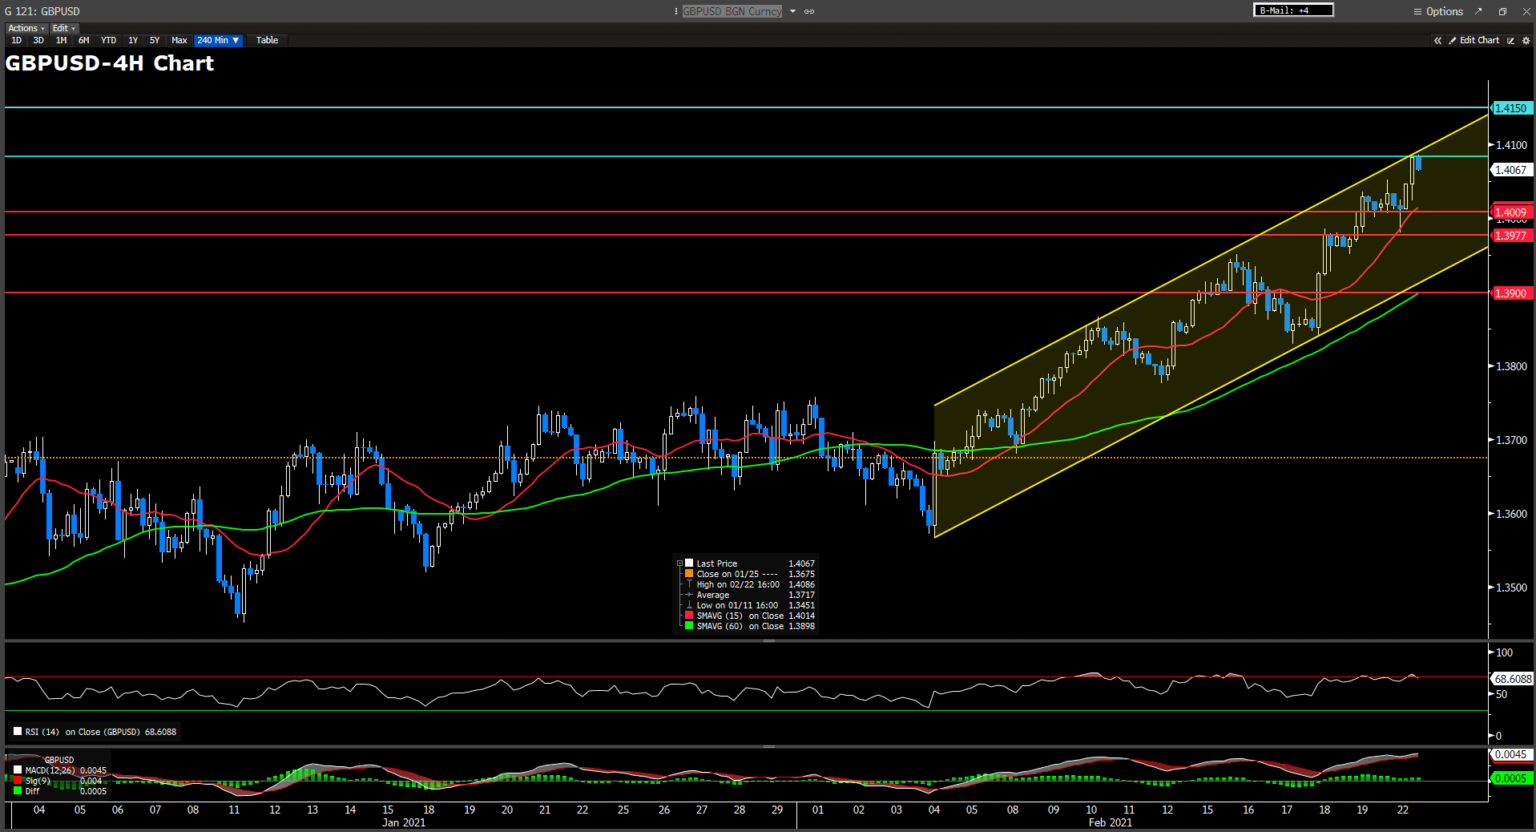
Cable continued to trade below 1.40 as the US bond yield have resumed gains, lifting the US dollar. Rishi Sunak, UK’s Chancellor of the Exchequer, is set to unveil a new budget later this week and consider pushing up rates that corporations pay. Those agenda will rise the questions of whether the UK is a good place for conducting businesses. As the US bond yields increase and the uncertainty in the UK, Cable is currently in a negative territory as the time of writing.
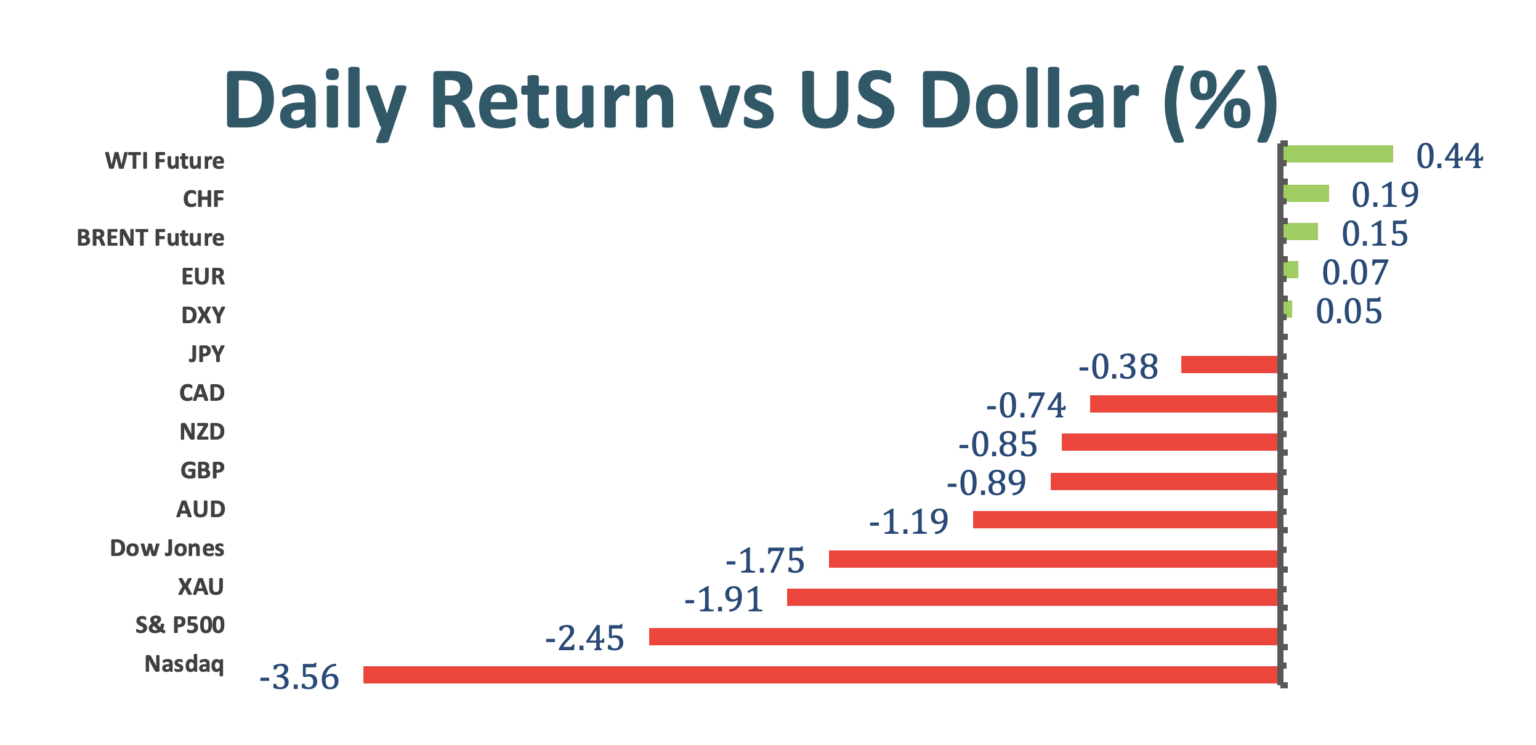
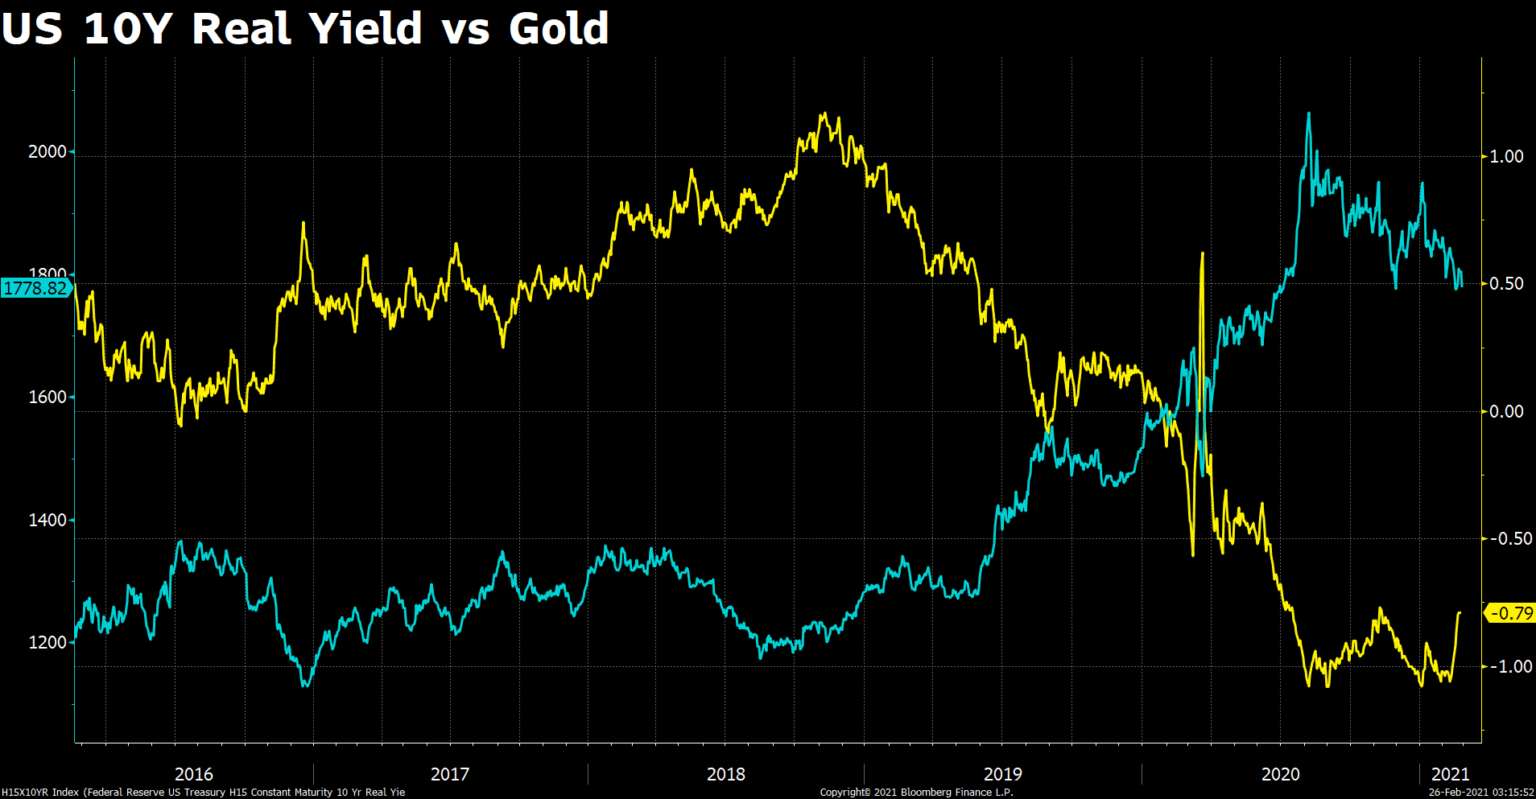
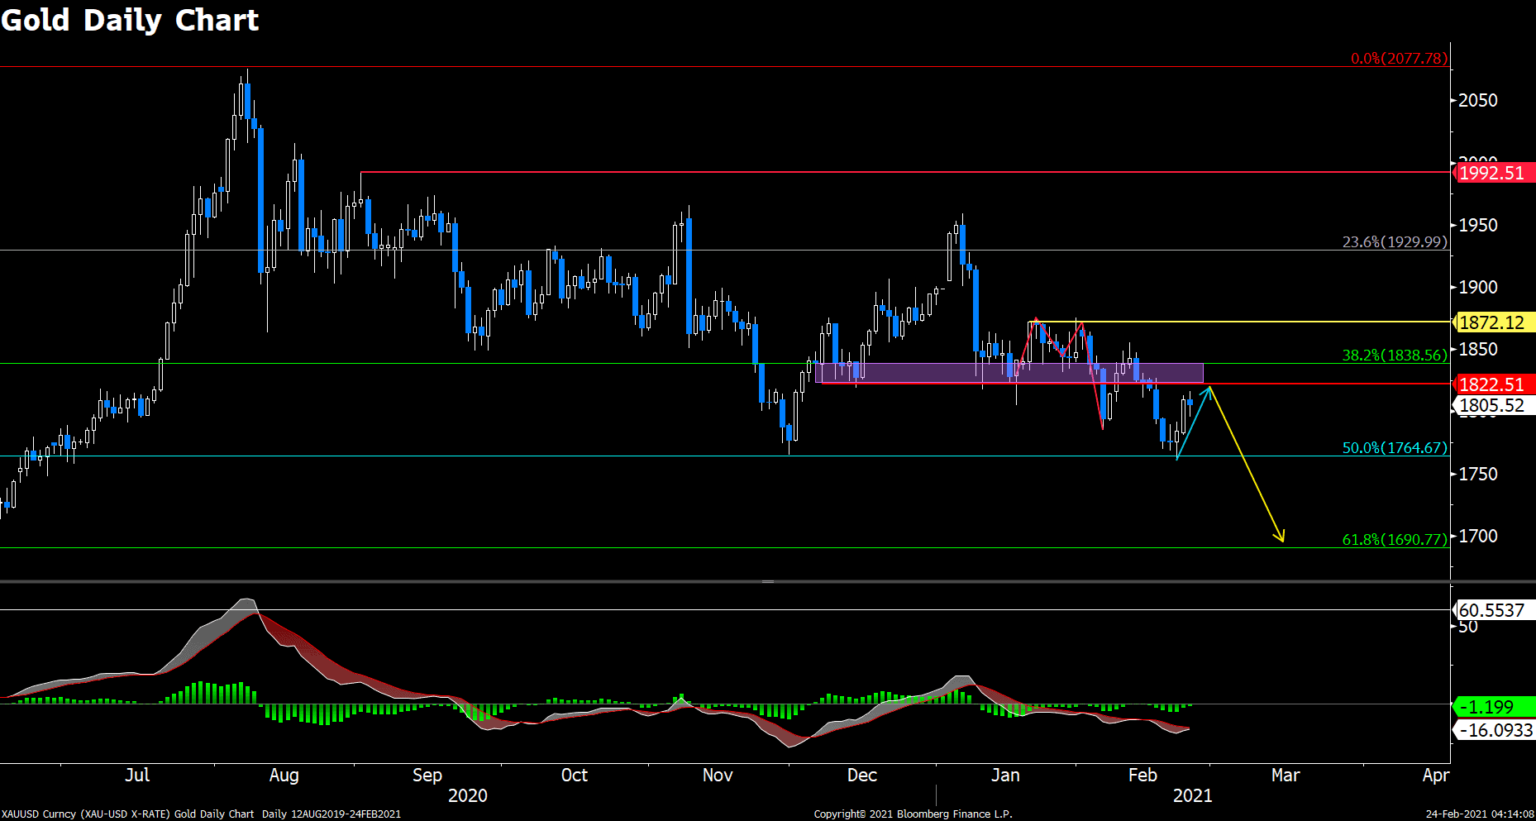
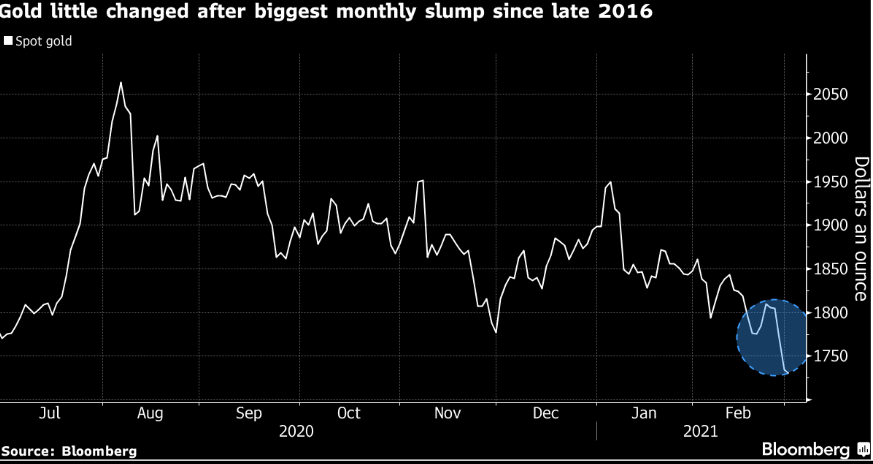
Gold tumbled more than 6% in February, biggest monthly slump since 2016. As the US bond yield rates increase, they dimmed the appeal of gold, which did not offer interest. Gold is typically viewed as a hedge instrument of untoward inflationary pressures, but apparently gold has responded more to the combination of rising confidence and rising yield rates this time.
Technical Analysis:
EURUSD (Four-hour Chart)
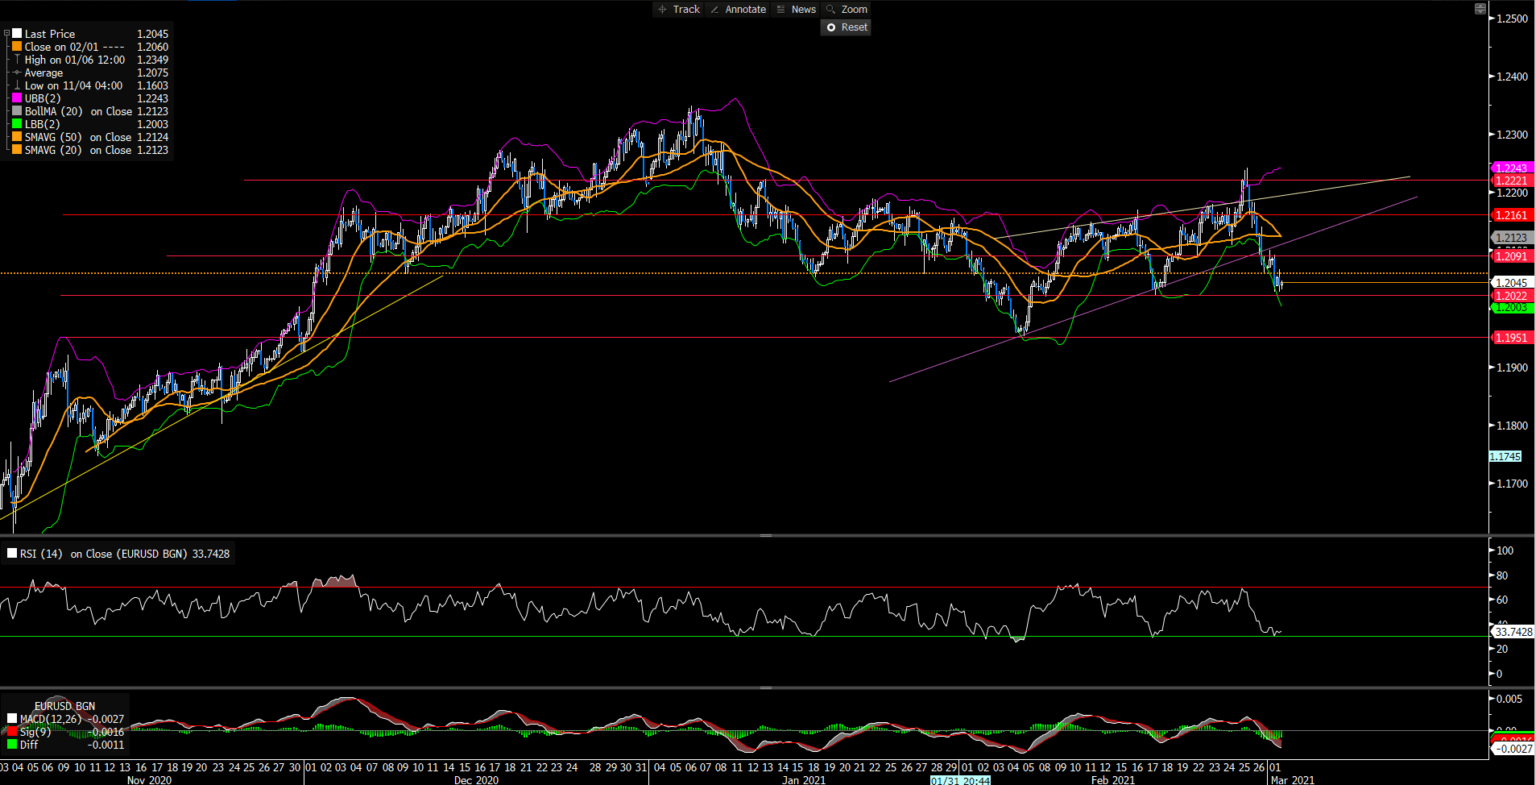
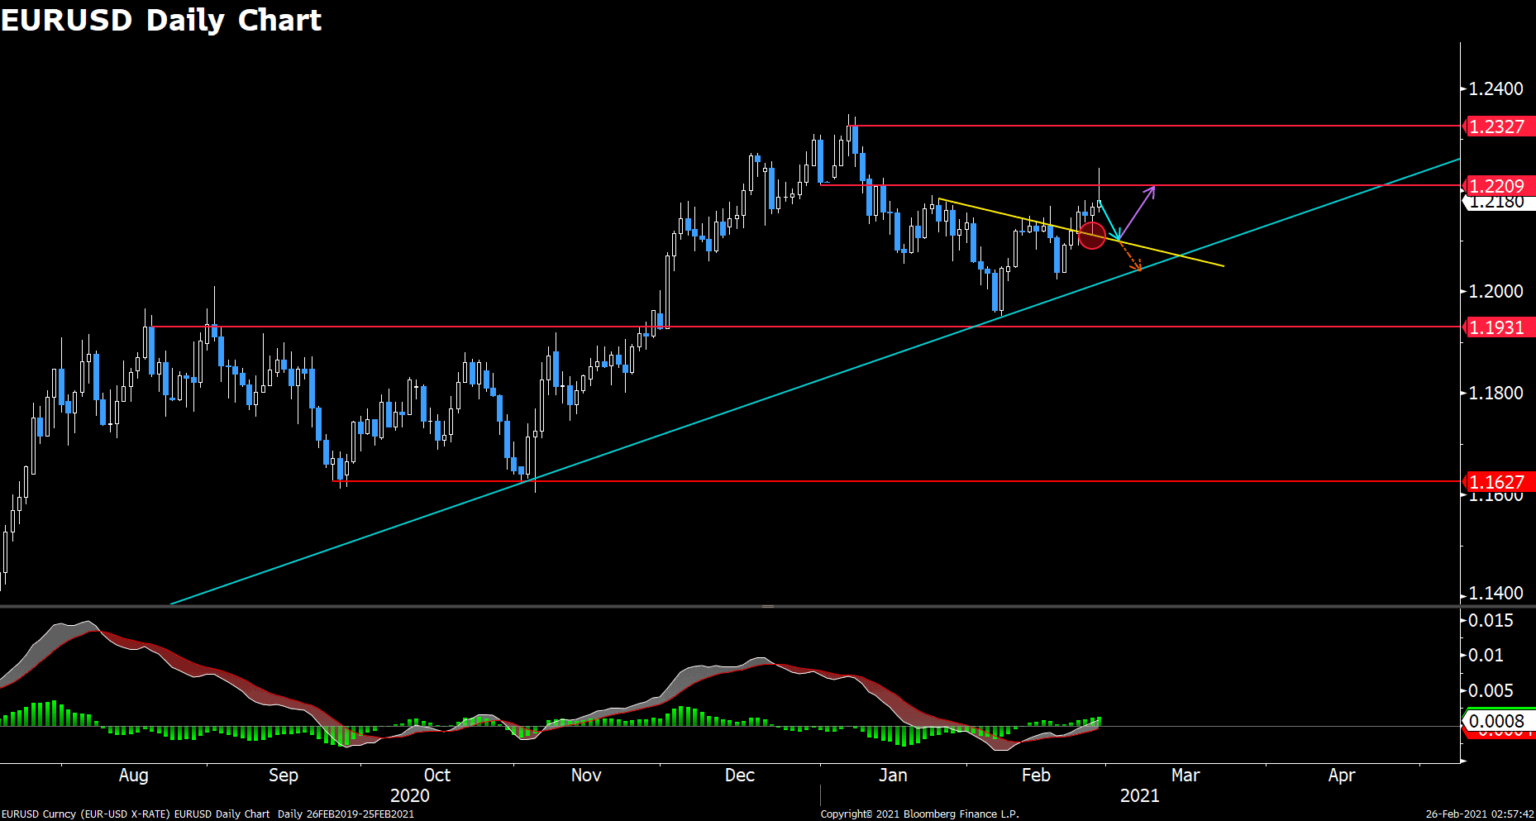
On the four- hour chart, EUR/USD remains on the downside for 1.2022 support. A break of the support level of 1.2022 will confirm a continuous bearish momentum toward the next support at 1.1951. Moreover, on the downside, the bearish momentum is considered as active, supported by both the RSI indicator and MACD; the RSI indicator has not reached the oversold situation while the MACD line is still sitting below the signal line, both suggesting a bearish trend. On the upside, a break from the resistance of 1.2091 will give EUR/USD a bullish signal as it is going to be settled in the ascending channel.
Resistance: 1.2091, 1.2161, 1.2221
Support: 1.2022, 1.1951
GBPUSD (Four-hour Chart)

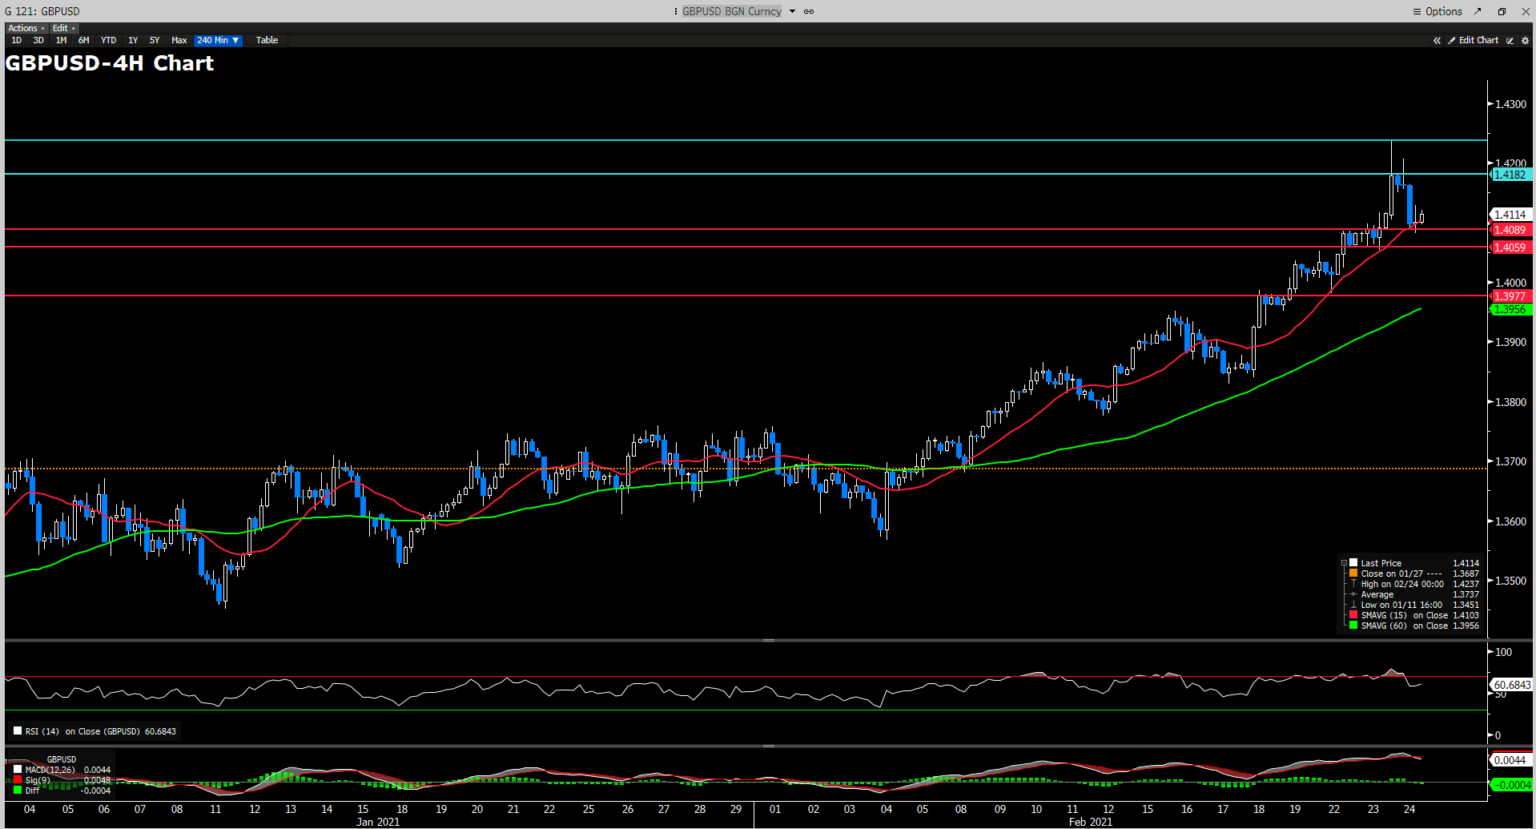
GBP/USD is hovering around 1.3920 off the high from last week. As the pair consolidates, it remains neutral as the time of writing. On the upside, GBP/USD remains in a bullish trend in the big picture as it is located above the 50 SMA and the ascending channel. On the downside, a break from the current support of 1.3851 will lead the pair toward the next support at 1.3748. At the same time, the MACD line is still below the signal line, suggesting a bearish trend, while the RSI indicator has not reached an oversold condition.
Resistance: 1.3991, 1.4180
Support: 1.3851, 1.3748
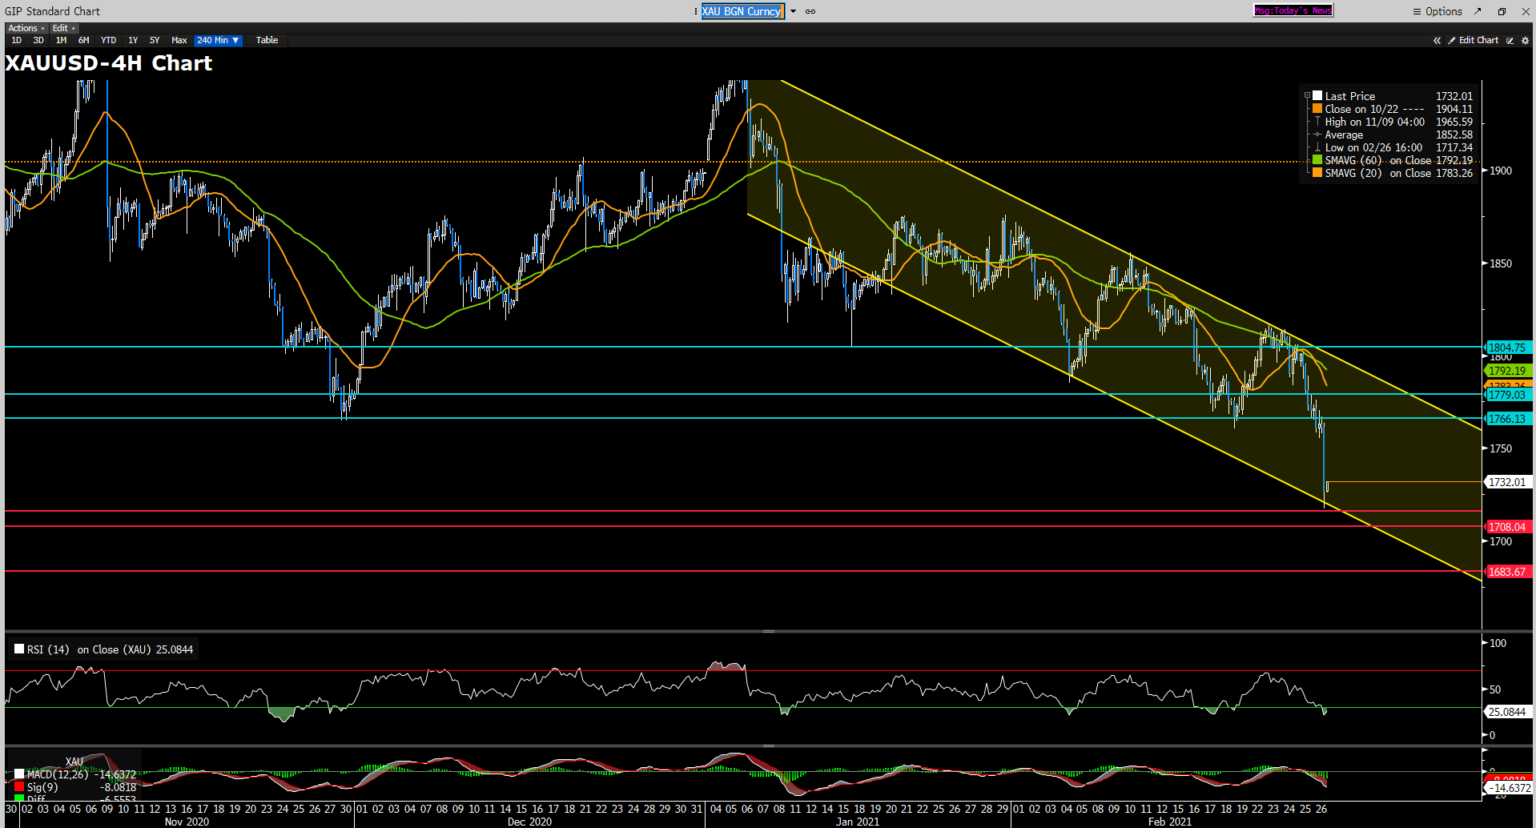
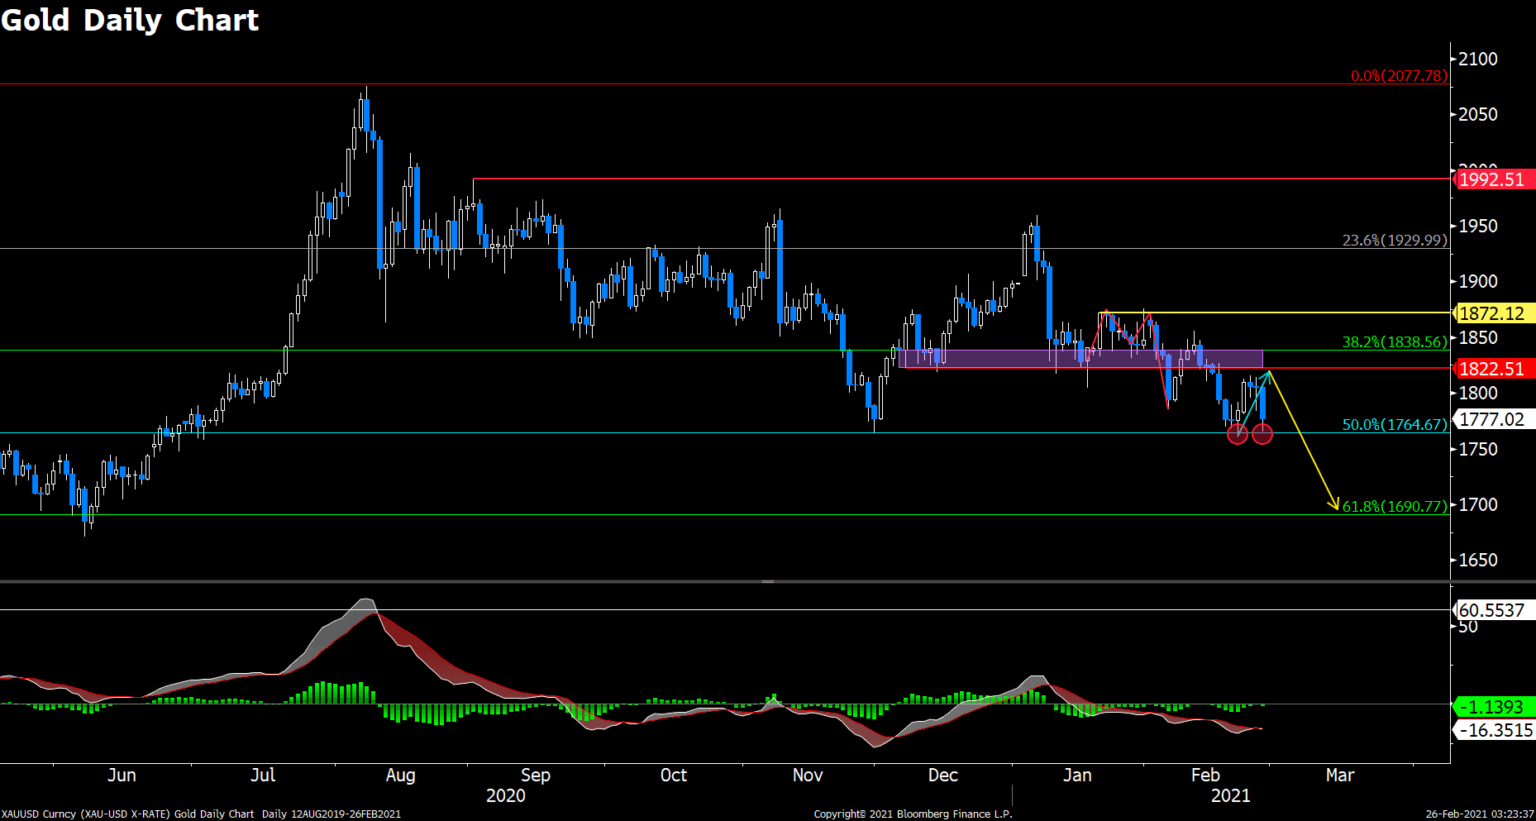
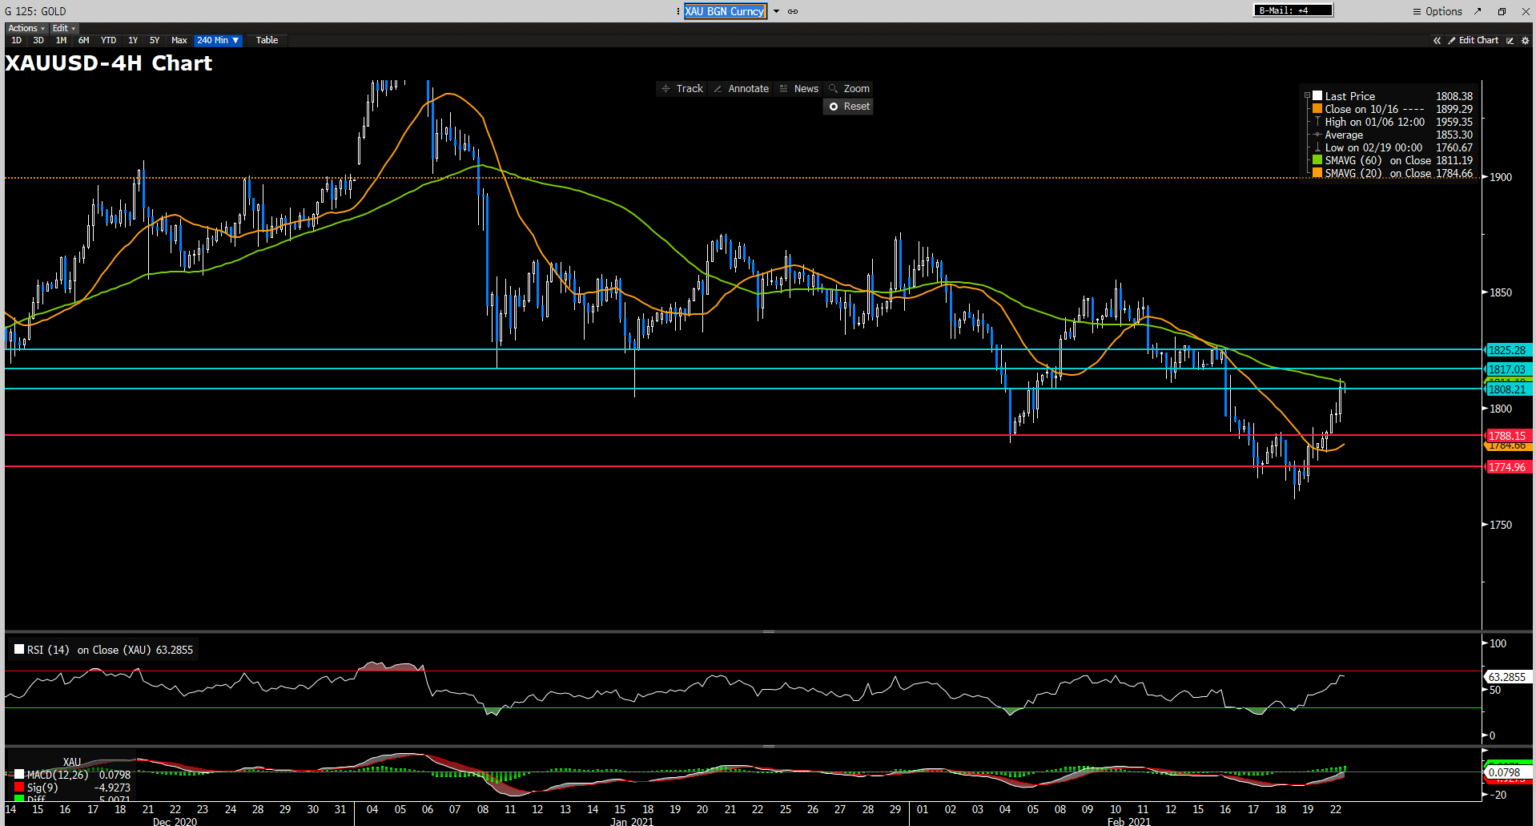
XAUUSD (Daily Chart)
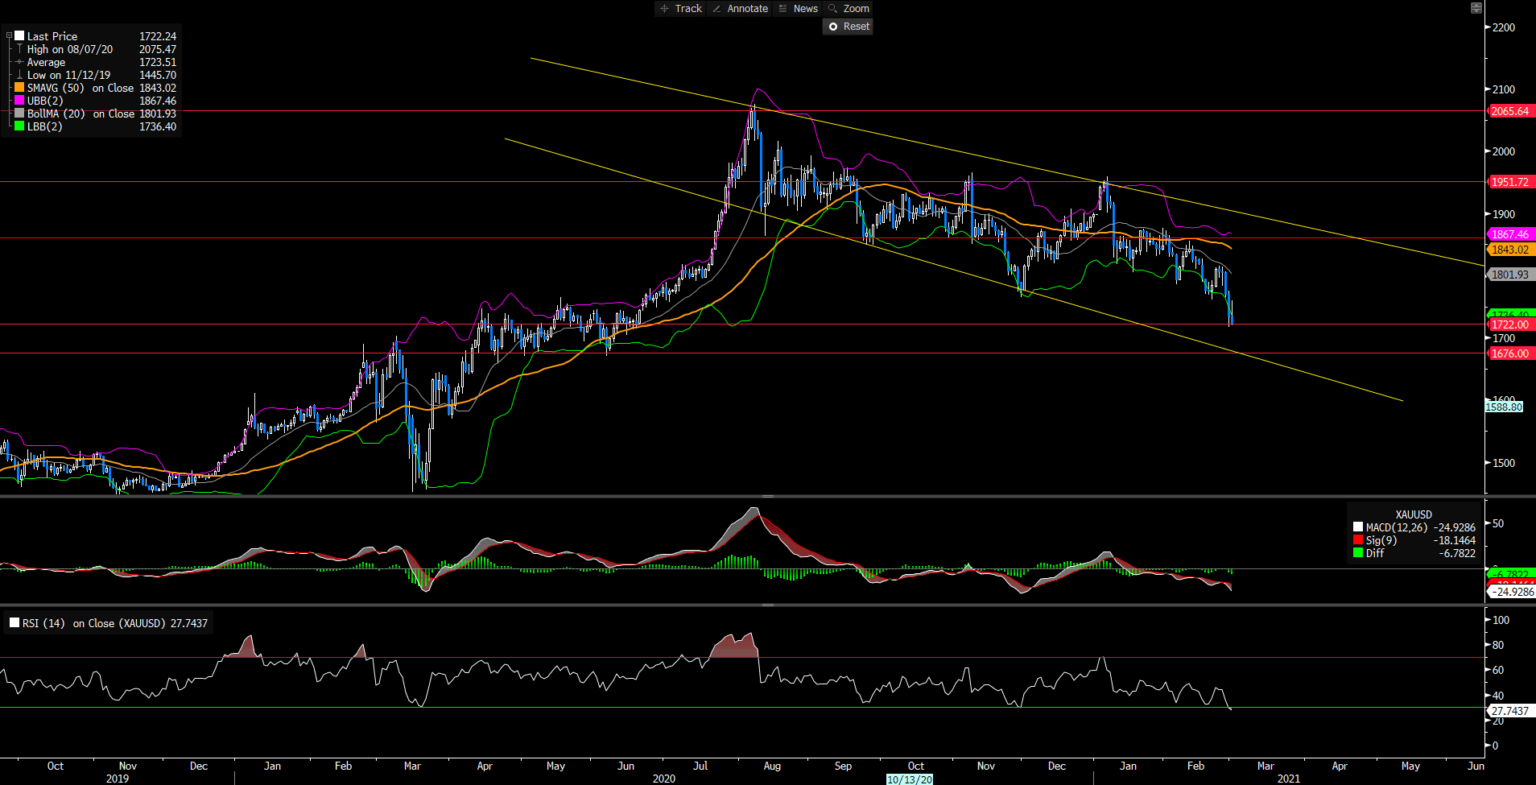
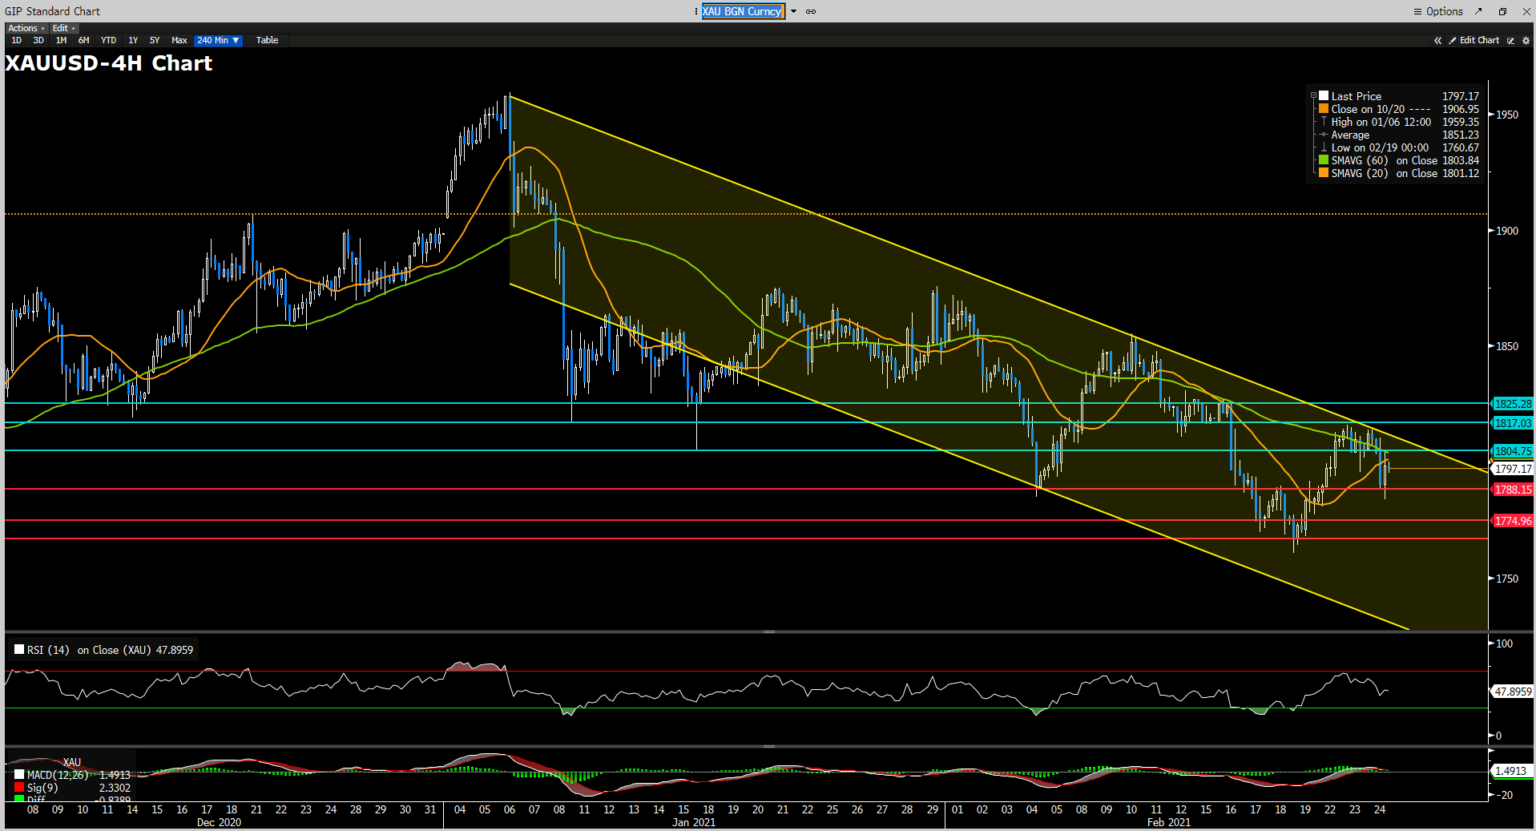
In the near- term, gold is due to a pullback as the RSI indicator has reached an oversold condition and the MACD is currently weak, implying a bearish- to- bullish trend; moreover, the pair has reached the lower band of Bollinger Band, also suggesting a retreat. However, in the big picture on the daily chart, gold remains bearish trend as it stays in the 6- month descending trend and it is located below the 50 SMA. A break of the support at $1722 will bring the pair toward the next support at $1676.
Resistance: 1867, 1951, 2065
Support: 1722, 1676
Economic Data
|
Currency |
Data |
Time (TP) |
Forecast |
||||
|
AUD |
GDP (QoQ) (Q4) |
08:30 |
2.5% |
||||
|
GBP |
Composite PMI (Feb) |
17:30 |
49.8 |
||||
|
GBP |
Services PMI (Feb) |
17:30 |
49.7 |
||||
|
GBP |
Annual Budget Release |
20:30 |
N/A |
||||
|
USD |
ADP Nonfarm Employment Change (Feb) |
21:15 |
177K |
||||
|
USD |
ISM Non-Manufacturing PMI (Feb) |
23:00 |
58.7 |
||||
|
USD |
Crude Oil Inventories |
23:30 |
-1.850M |
||||