Daily Market Analysis
Market Focus
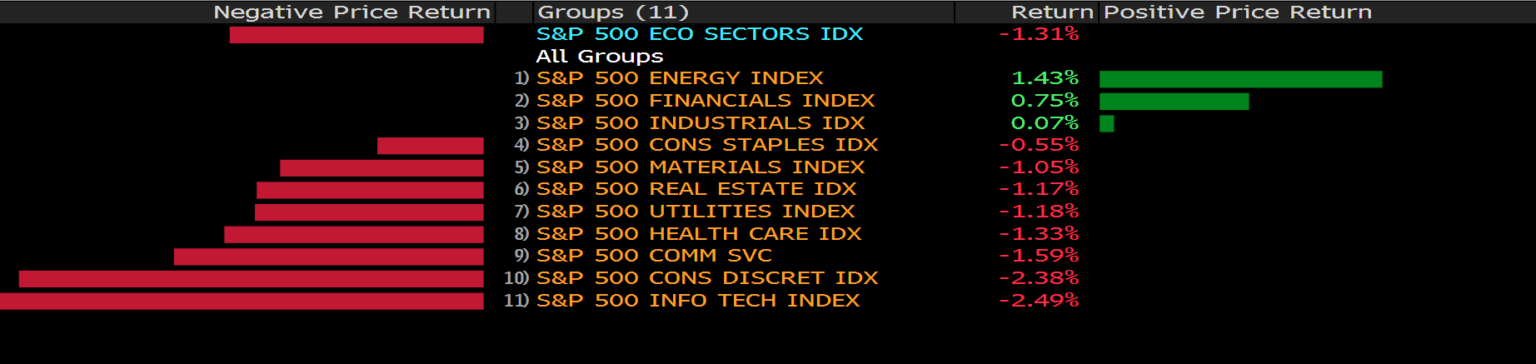
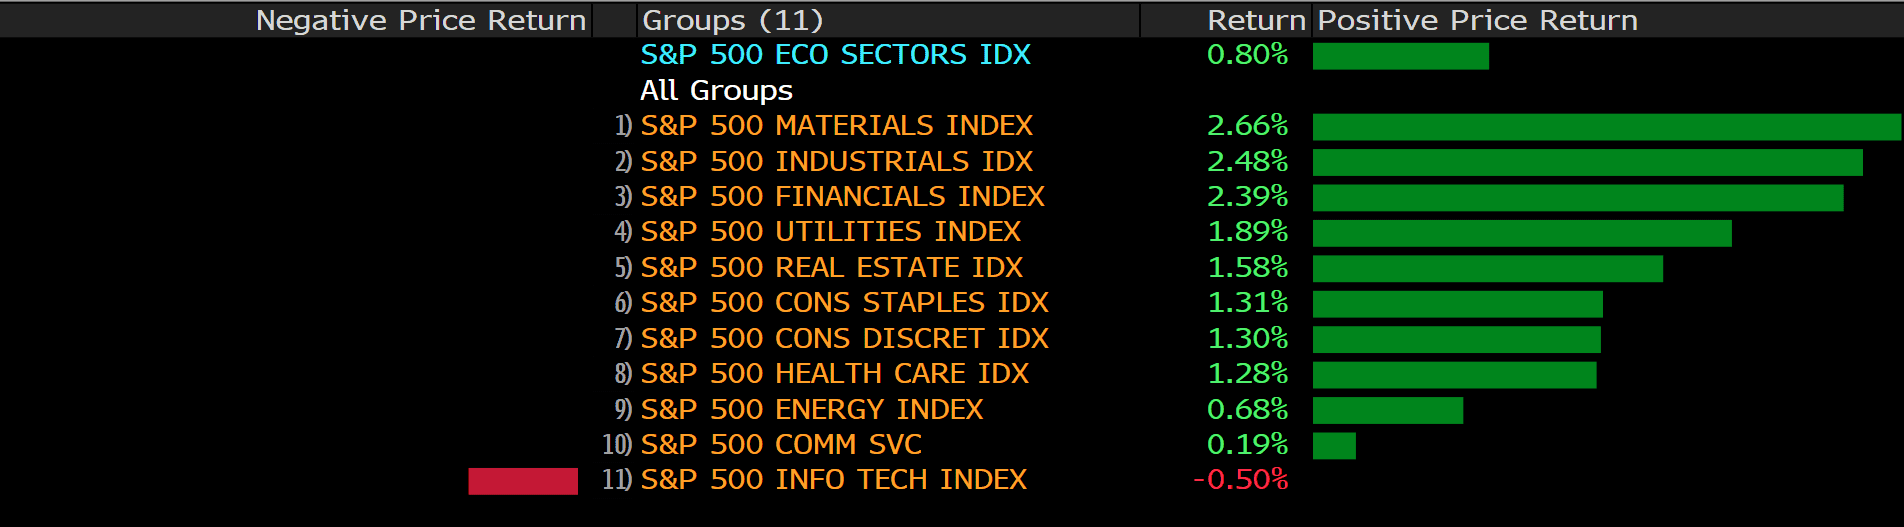
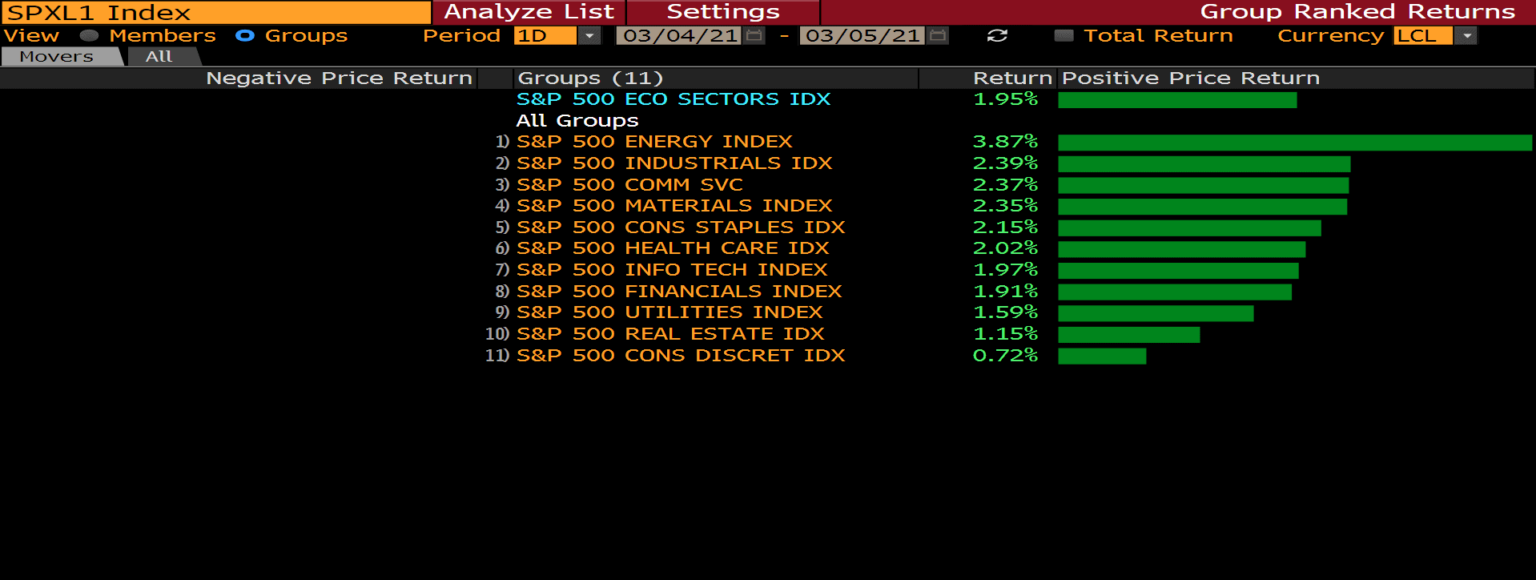
US stocks market advanced amid dropping Treasury yield after a 10-year note auction. The Dow Jones Industrial Average refreshed record high, closed above 32,000 for the first time. Energy stocks and Financial stocks led the gains in the S&P 500 index, while Tech shares slipped.

President Joe Biden’s $1.9 trillion stimulus bill cleared its final congressional hurdle on Wednesday. The house passed the bill with a 220 to 211 vote, sending it to the president for his signature. The bill marked a major political victory for President Biden, displaying his influence over a Democratic Party in control of Congress by a thin margin.
Biden’s administration will hold its first high-level meeting with Chinese officials in Alaska next week. Secretary of State Antony Blinken and his counterparty will be in discussion over a range of issues, such as human rights and the ongoing military coup in Myanmar.
Key takeaways from RBA Governor Philip Lowe speech:
Market Wrap

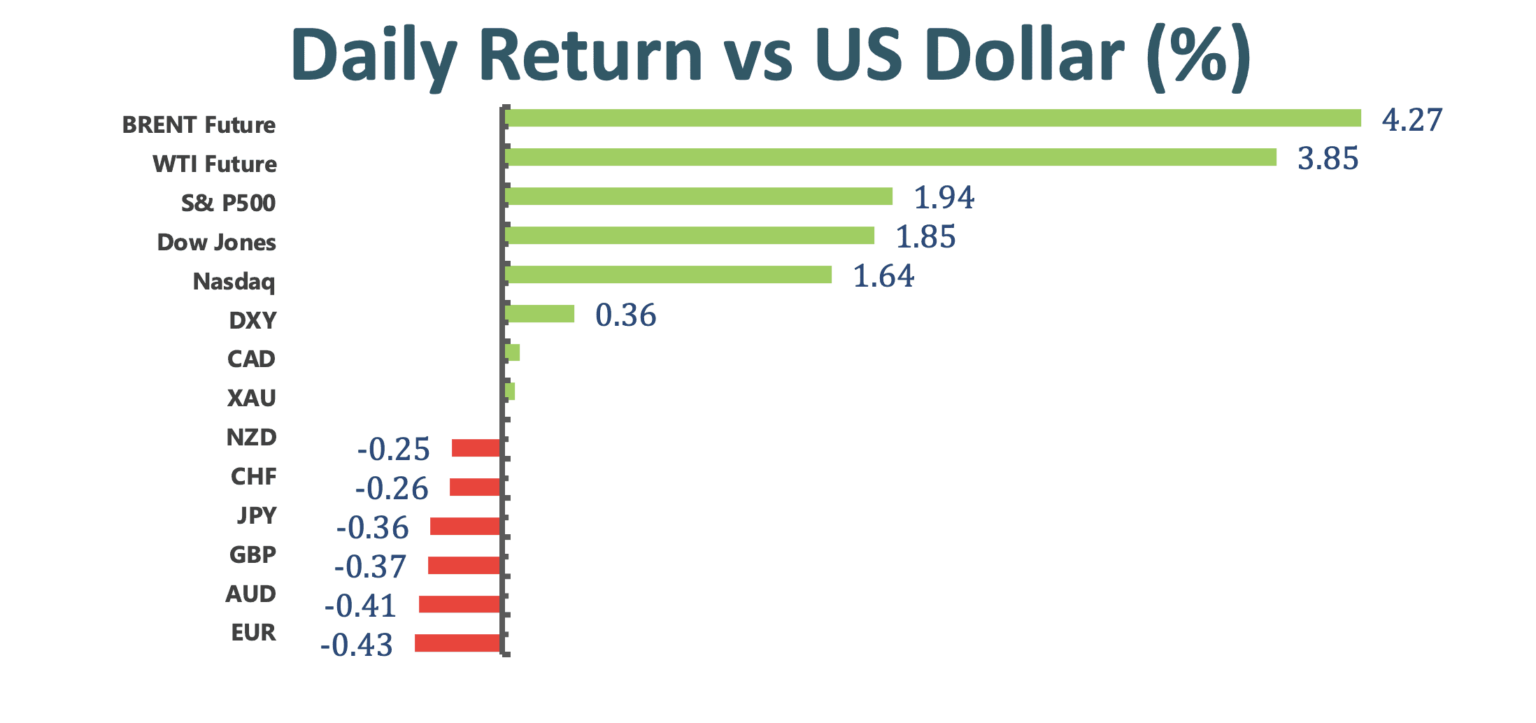
Main Pairs Movement
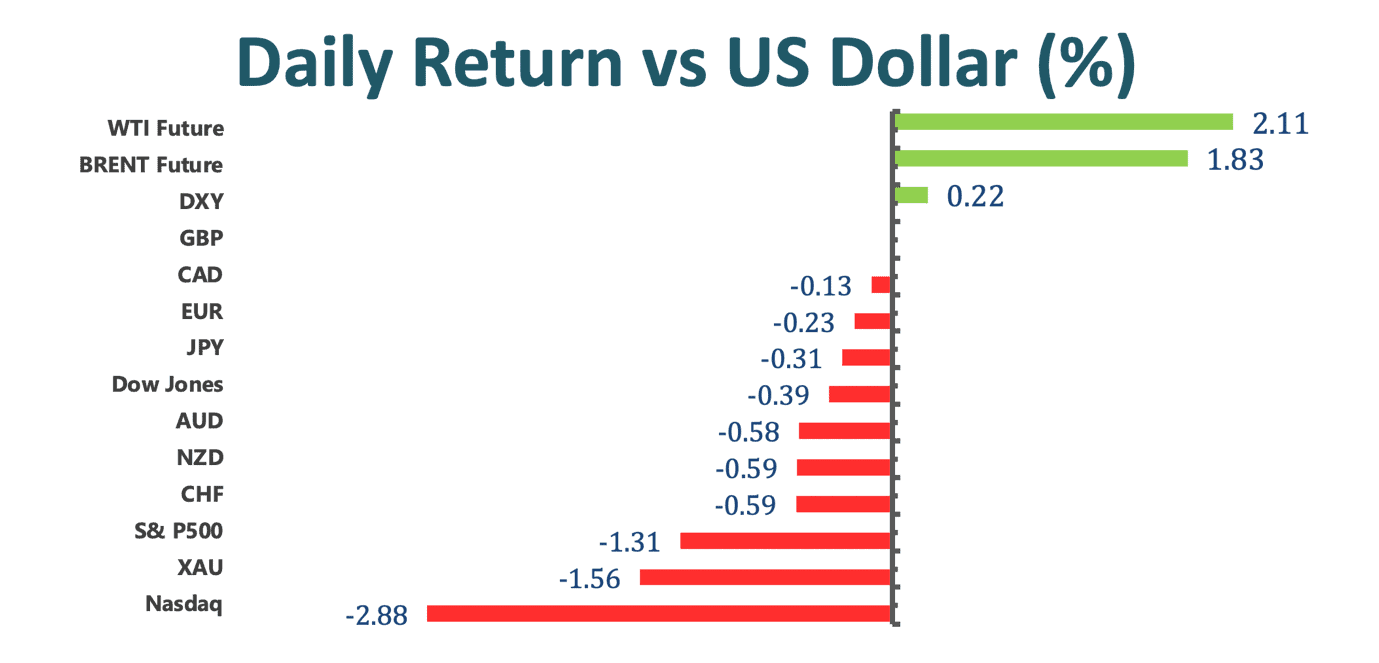
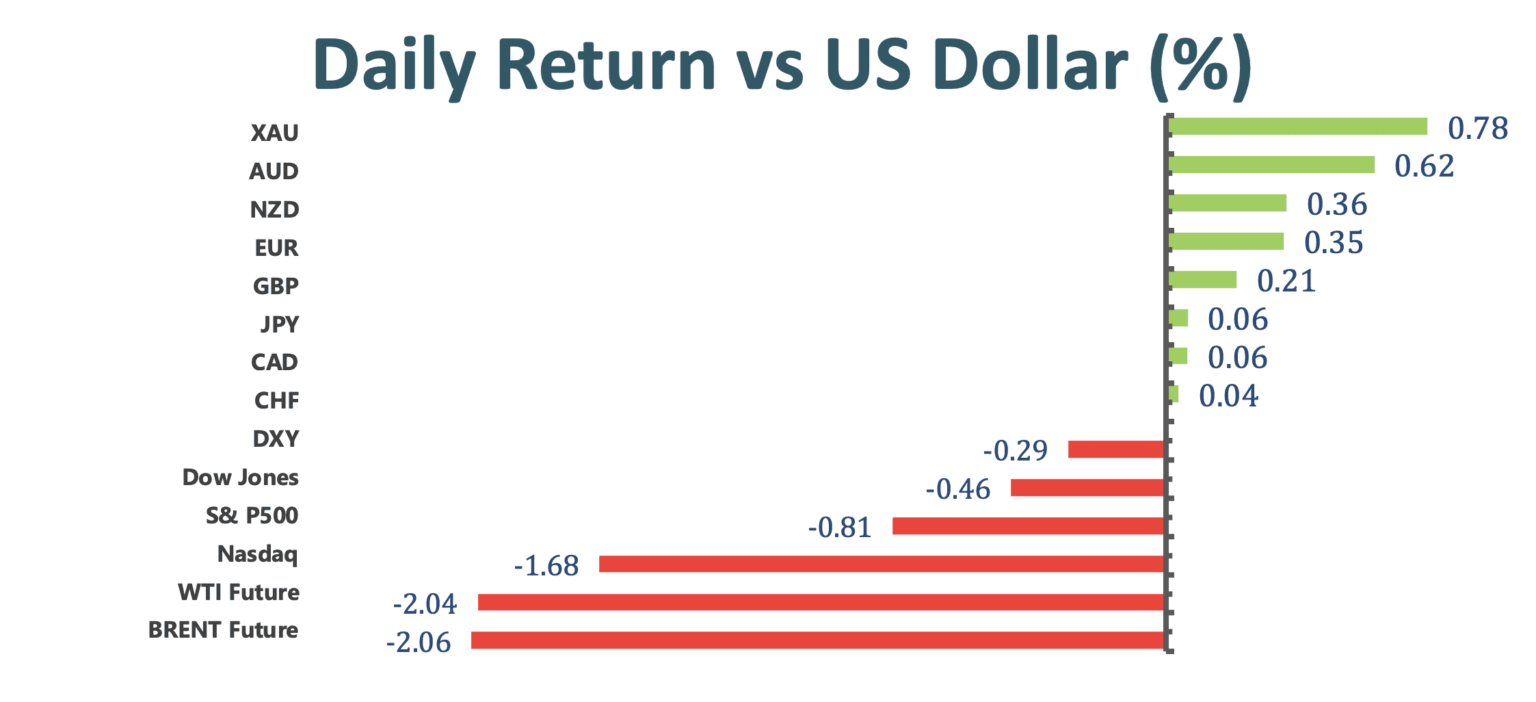
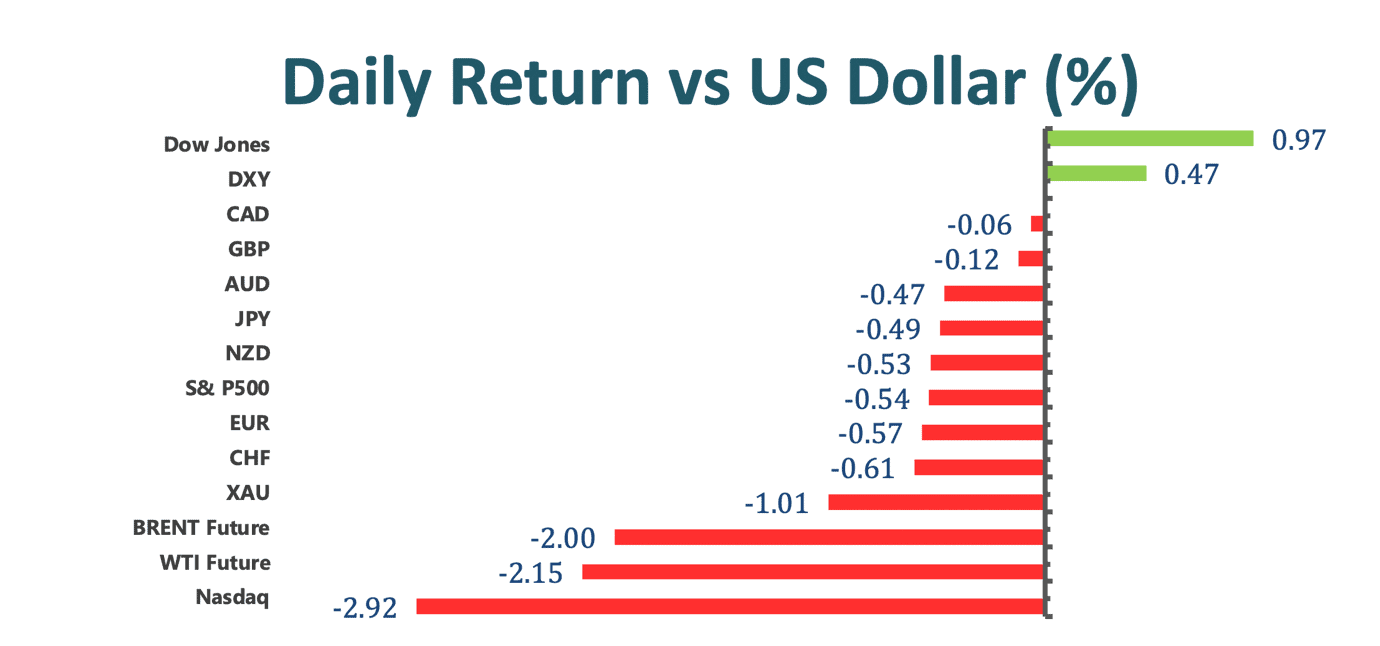
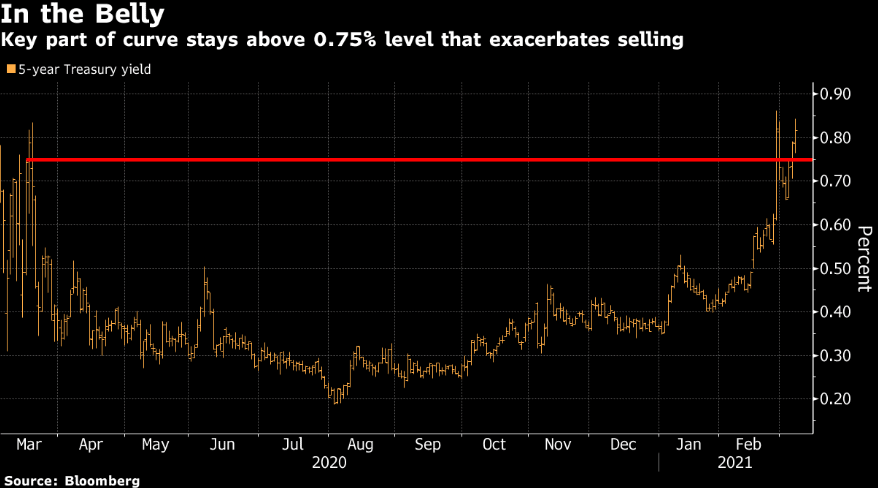
Dollar extended its retreat amid downbeat CPI data. US Core Consumer Price Index for February printed 1.3%, slightly missed expectation of 1.4%. The 10-year treasury yield also pulled back 0.45% on Wednesday, further weighing down on the US greenback.
The euro appreciated 0.2% against the greenback. Speculators now look to trade on Thursday’s ECB headline, but they might be disappointed. ECB’s Chief Economist Philip hinted the central bank will keep its current tone, saying “any excessive tightening in financial conditions would be inconsistent with the bank’s goal of getting inflation back to target.”
Aussie intially plunged 0.49% in early Asian session after RBA Governor said market pricing for a rate hike is too early. However, it manged to over loss into gain later thanks to dollar weakness. Iron ore futures continued to edge lower, entered a fourth consecutive lost. Kiwi followed a similar trajectory as Aussie, gained 0.36% and 0.26% respectively.
Gold continued to heal amid a modest pullback in dollar and Treasury yield, rallied 0.51% near closing. The approval on Biden’s relief package also lend support to gold. However, there little sign that ETFs are stepping on a break on the selloff.
Technical Analysis:
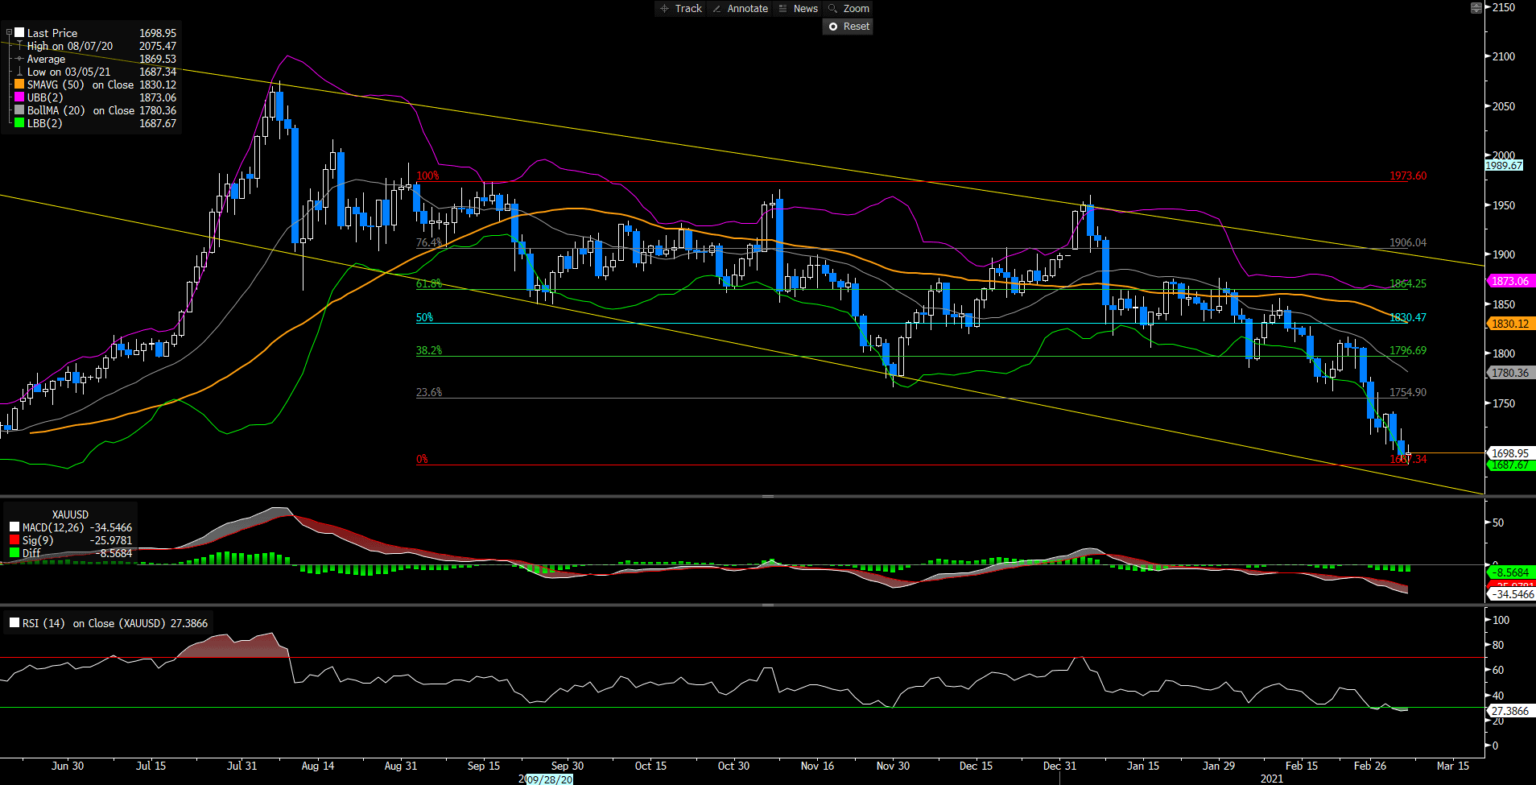
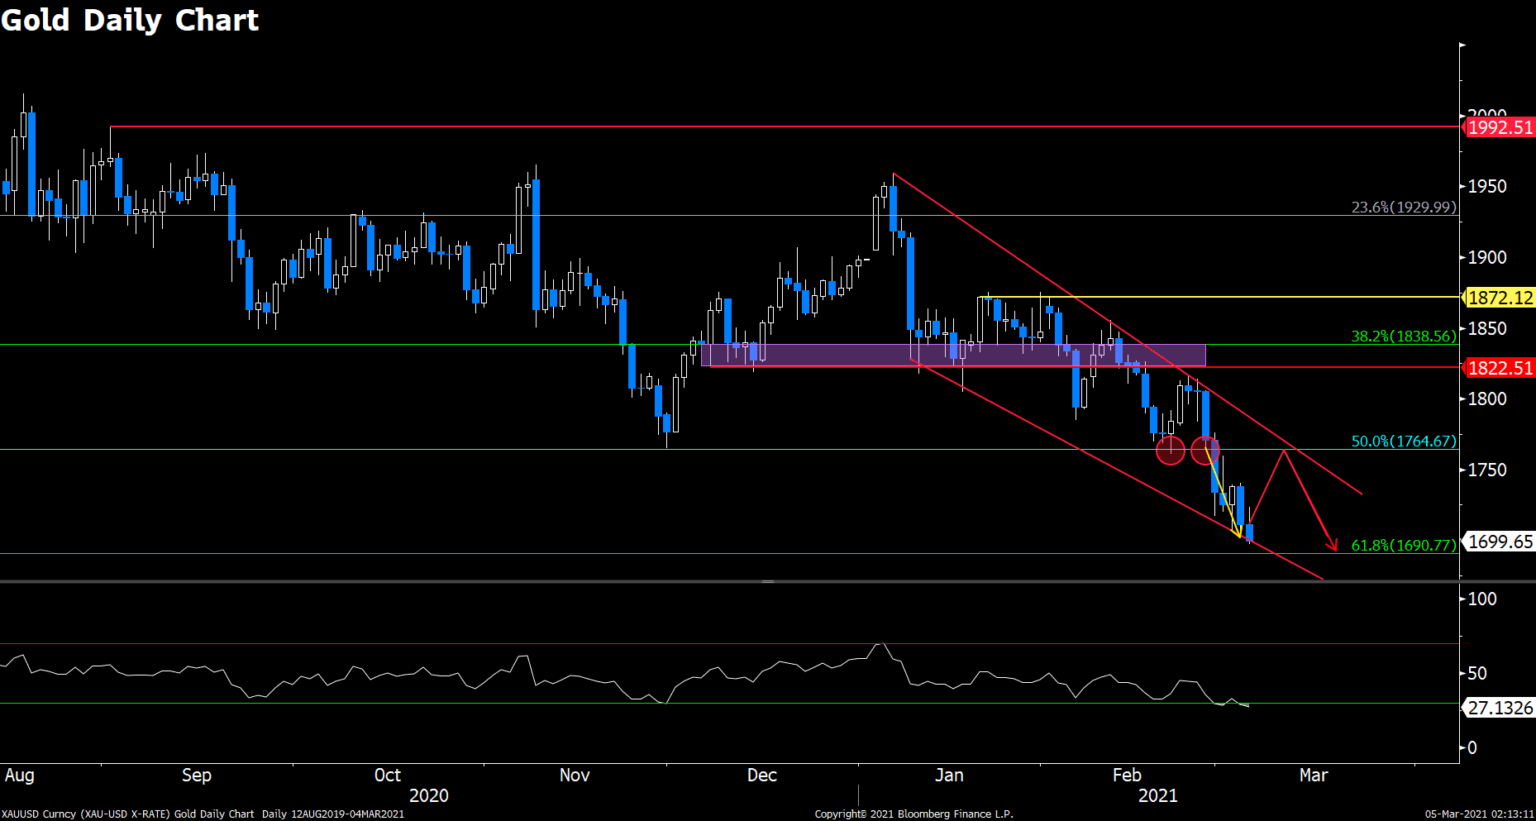
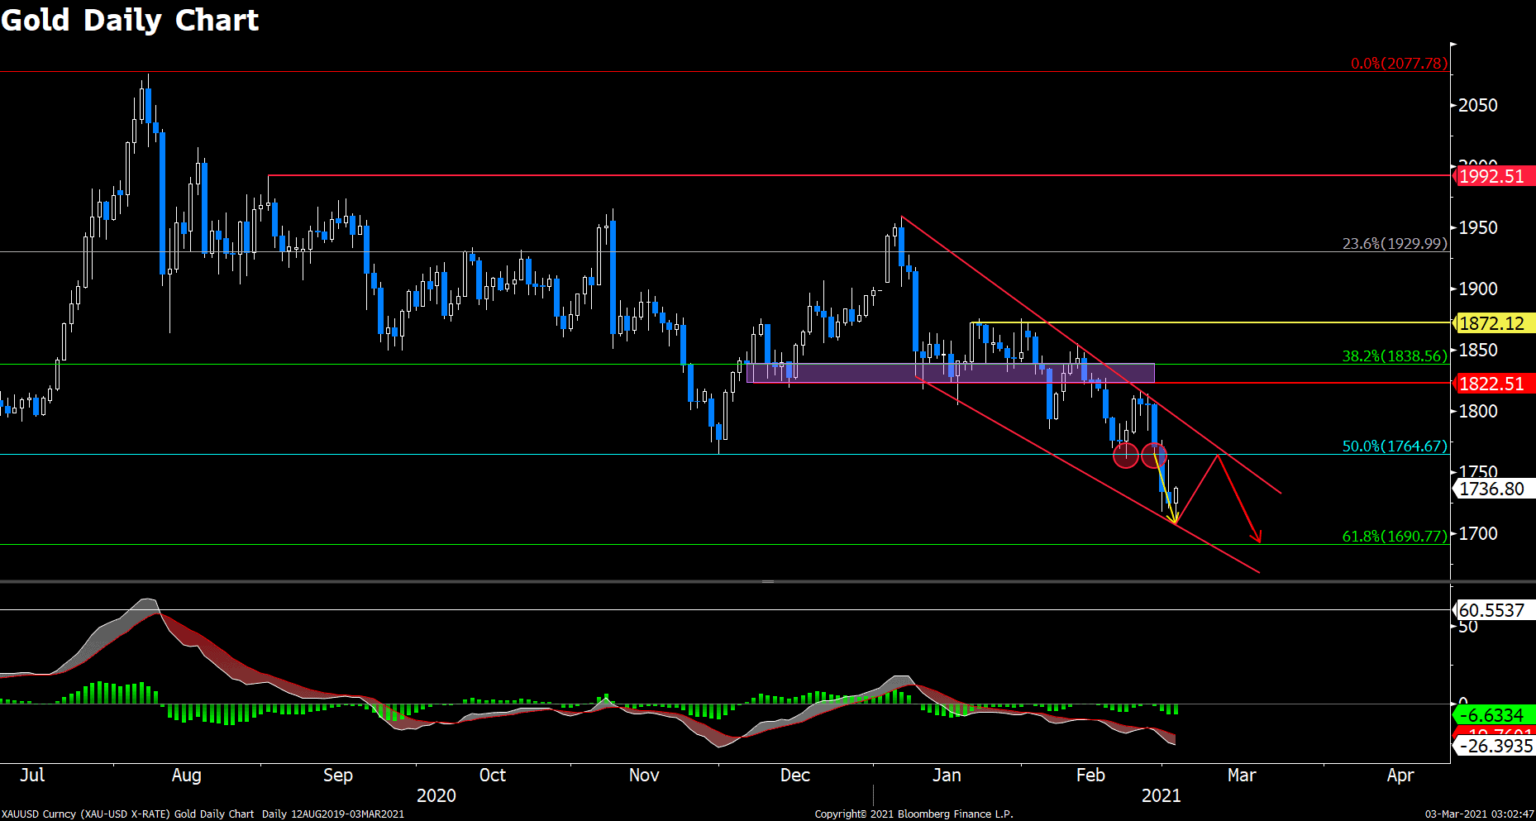
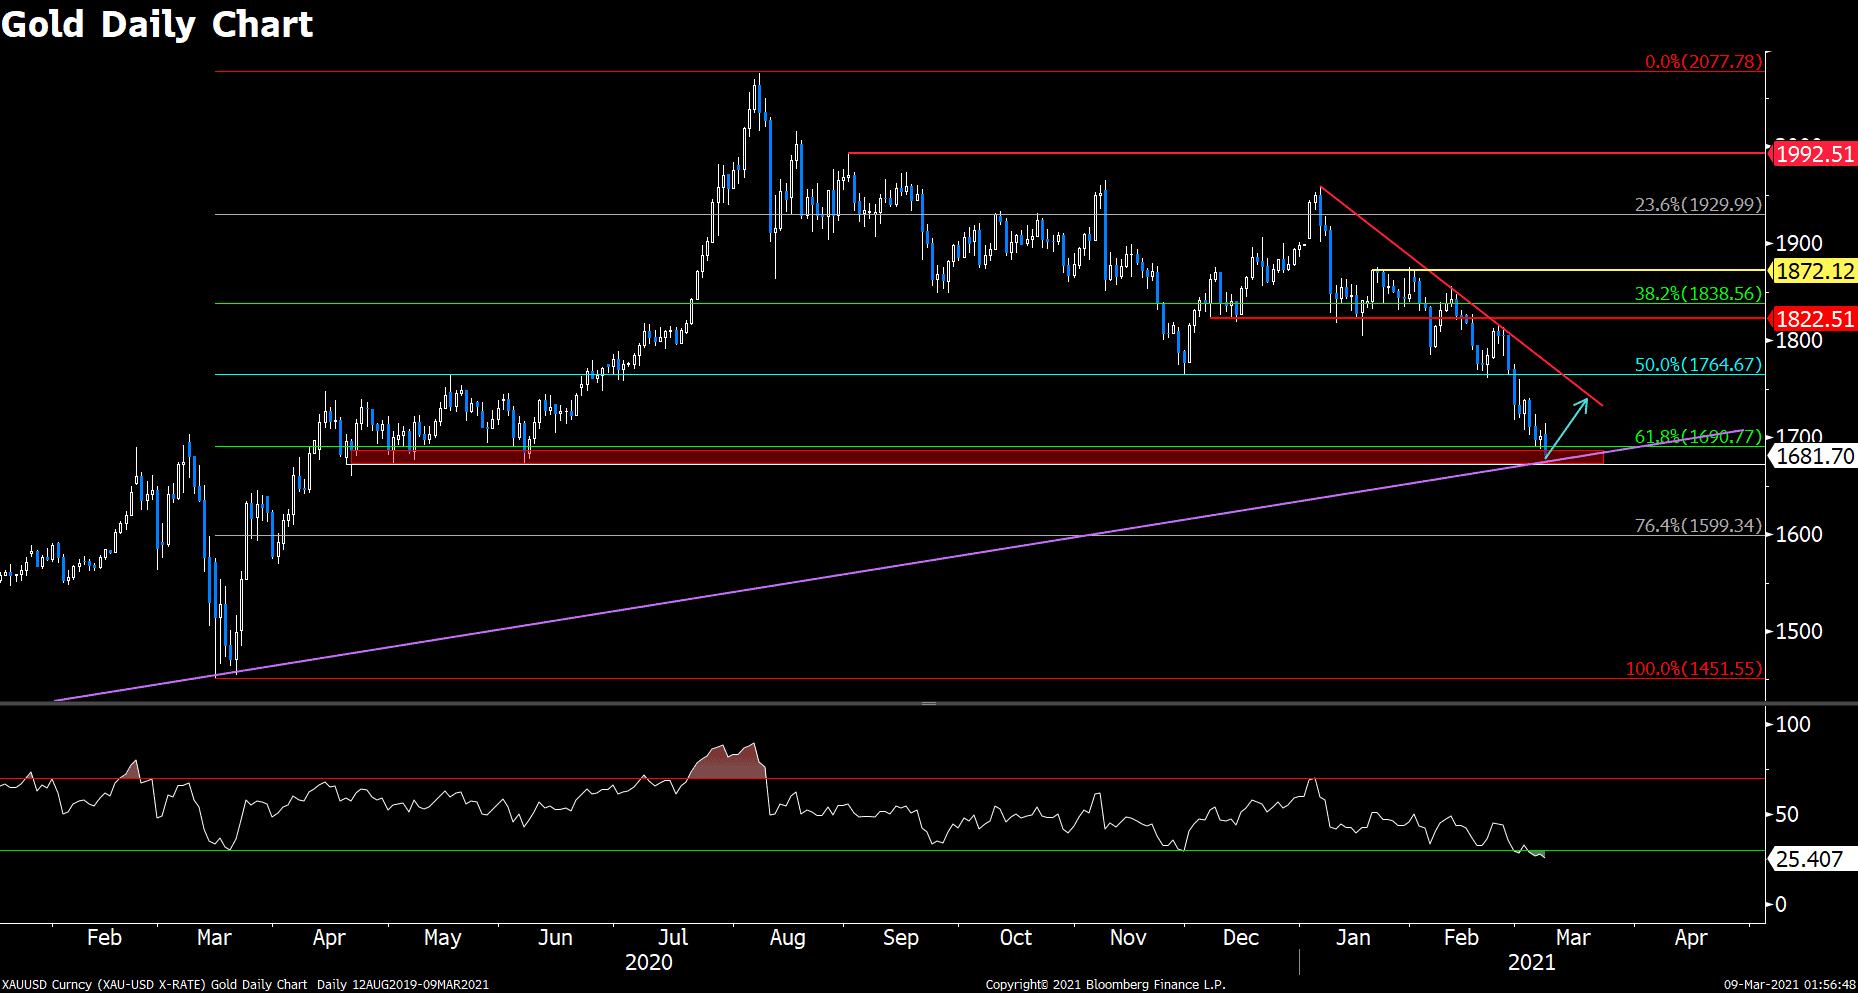
XAUUSD (Daily Chart)

Gold is extending its recovery toward 50% Fibonacci resistance after the long standing upward support line held off bears attack. On the upside, red descending trendline will add considerable friction to the precious metal. Price has been capped by this trendline since January, further rejections will put bulls on the defensive once again. And iff the previous is true, then it would be intersting to see how price could maneuver inside the highlighted zone. By giving up the downside support zone between $1673 and $1690, it would open doors to test $1600 and essentially mark the death of Gold. MACD on the daily chart seems to be in transitory towards a bullish trend.
Resistance: 1765, 1839
Support: 1690, 1673, 1600
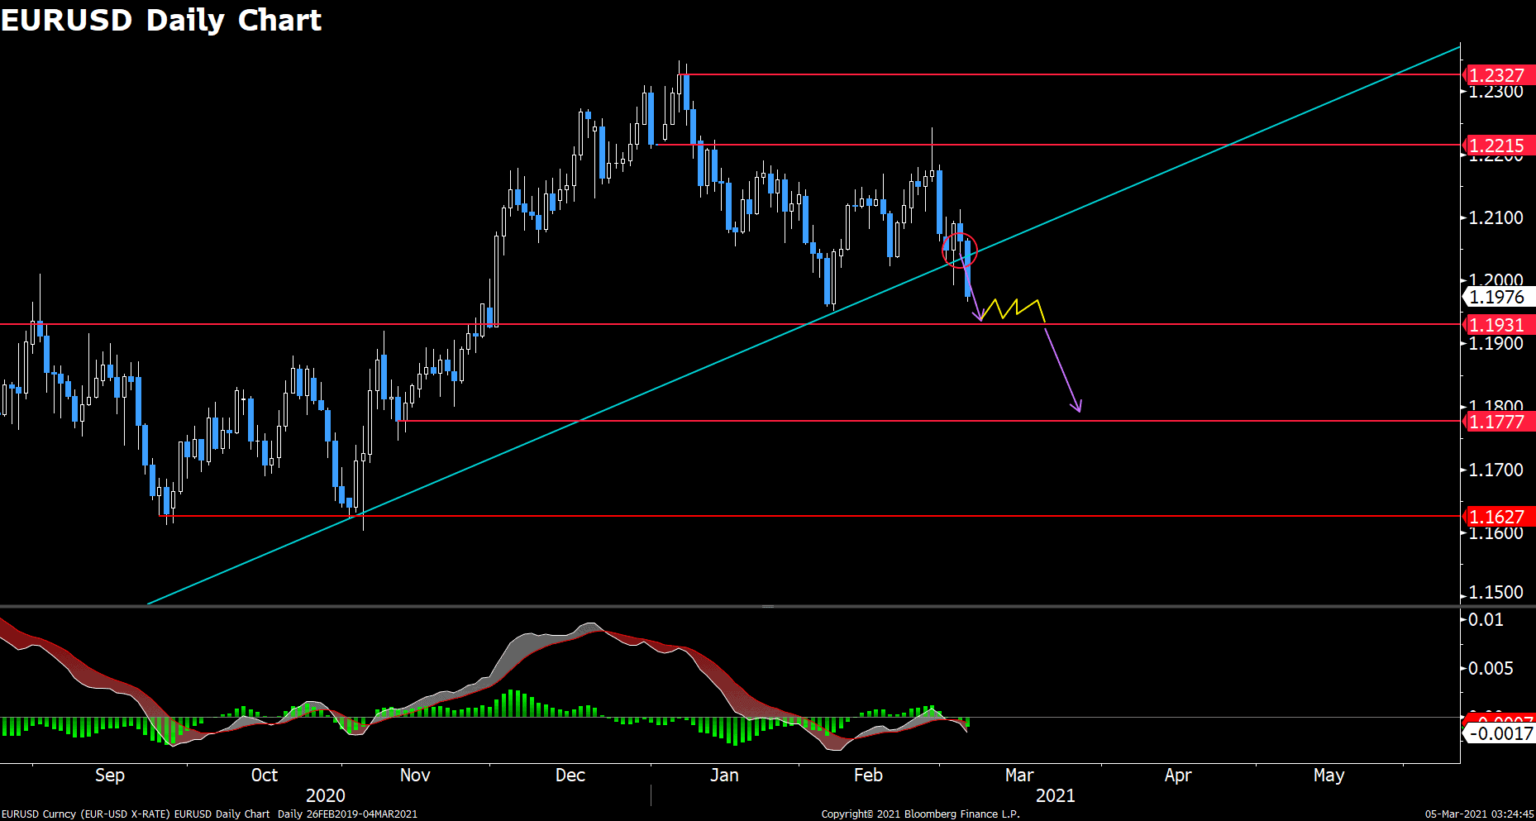
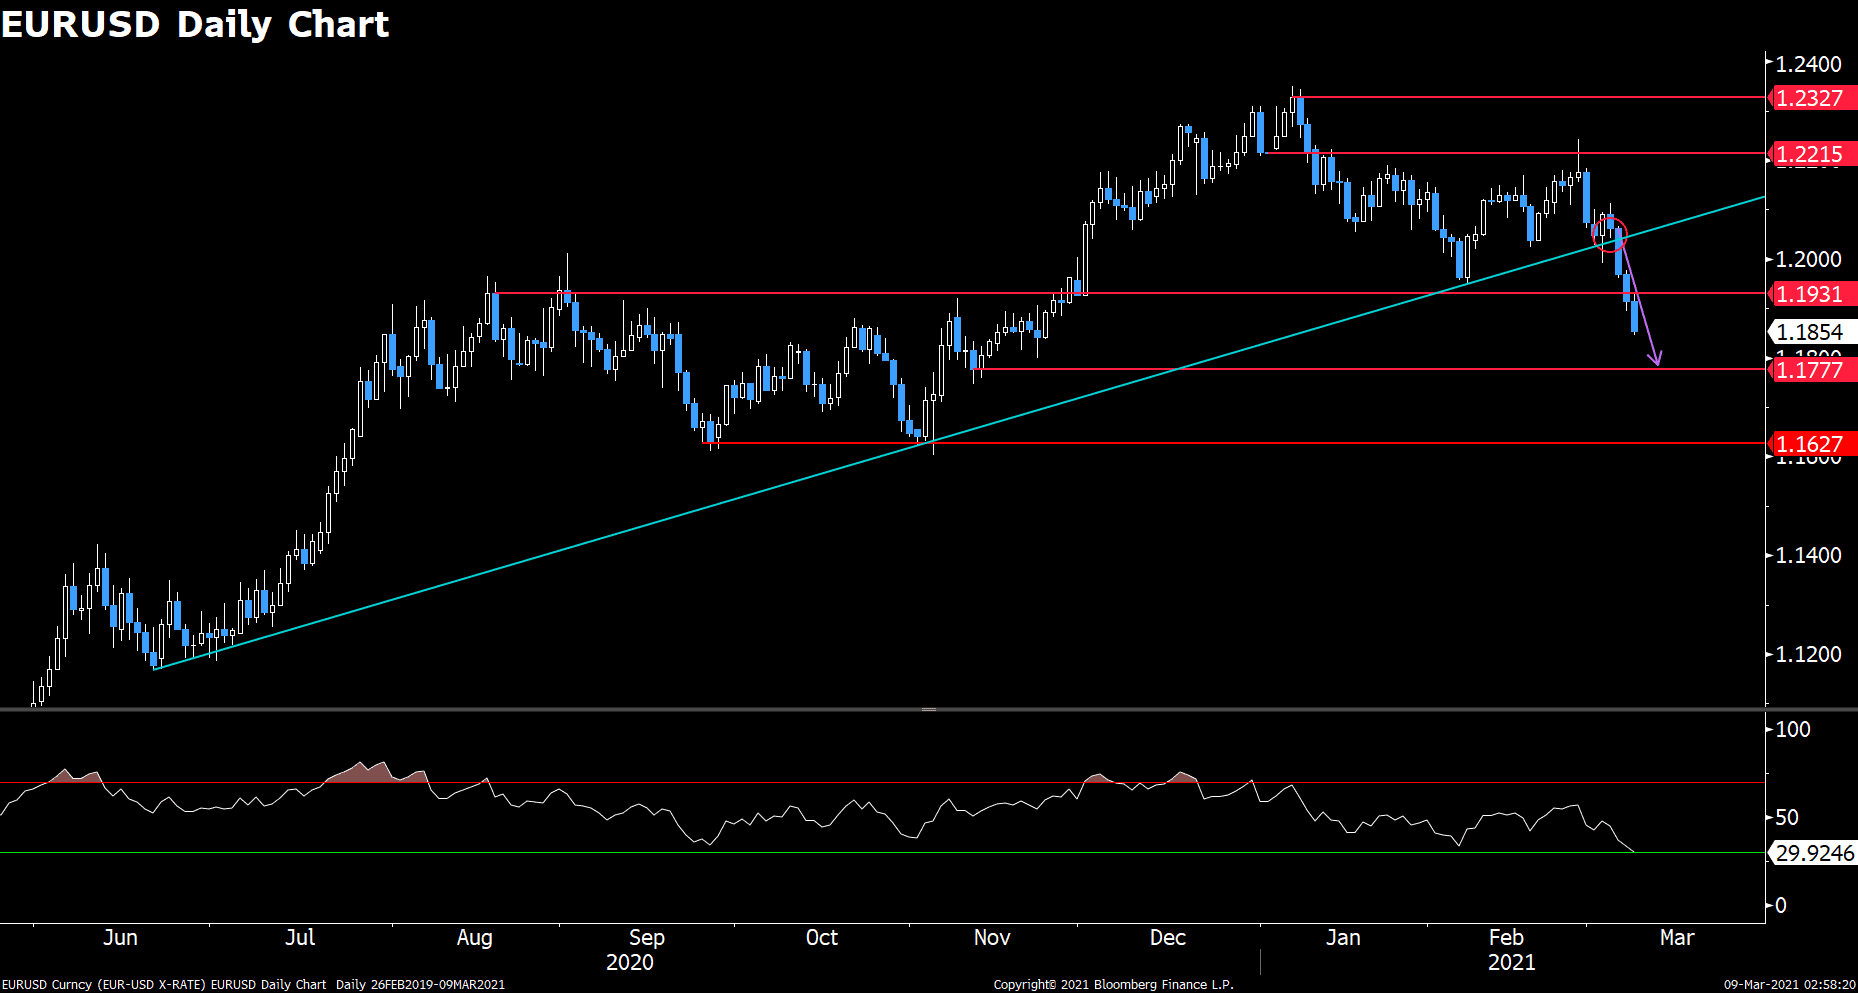
EURUSD (Daily Chart)

Euro dollar is crawling its way back to 1.195 handle. This pair was hampered down fairly quickly from 1.22, lost 2.7% in just seven trading days. Upcoming trading days will be crucial to determine whether the single currency could preserve it long term bullish bias against the US greenback. Failing to reclaim 1.195 and possibly the ascending trendline will offer bears a chance to retake the driver seat. On the downside, sellers look to contest 1.178 before finding a more resilient support around 1.163. MACD continues to eke out a bearish trend.
Resistance: 1.195, 1.22
Support: 1.178, 1.163
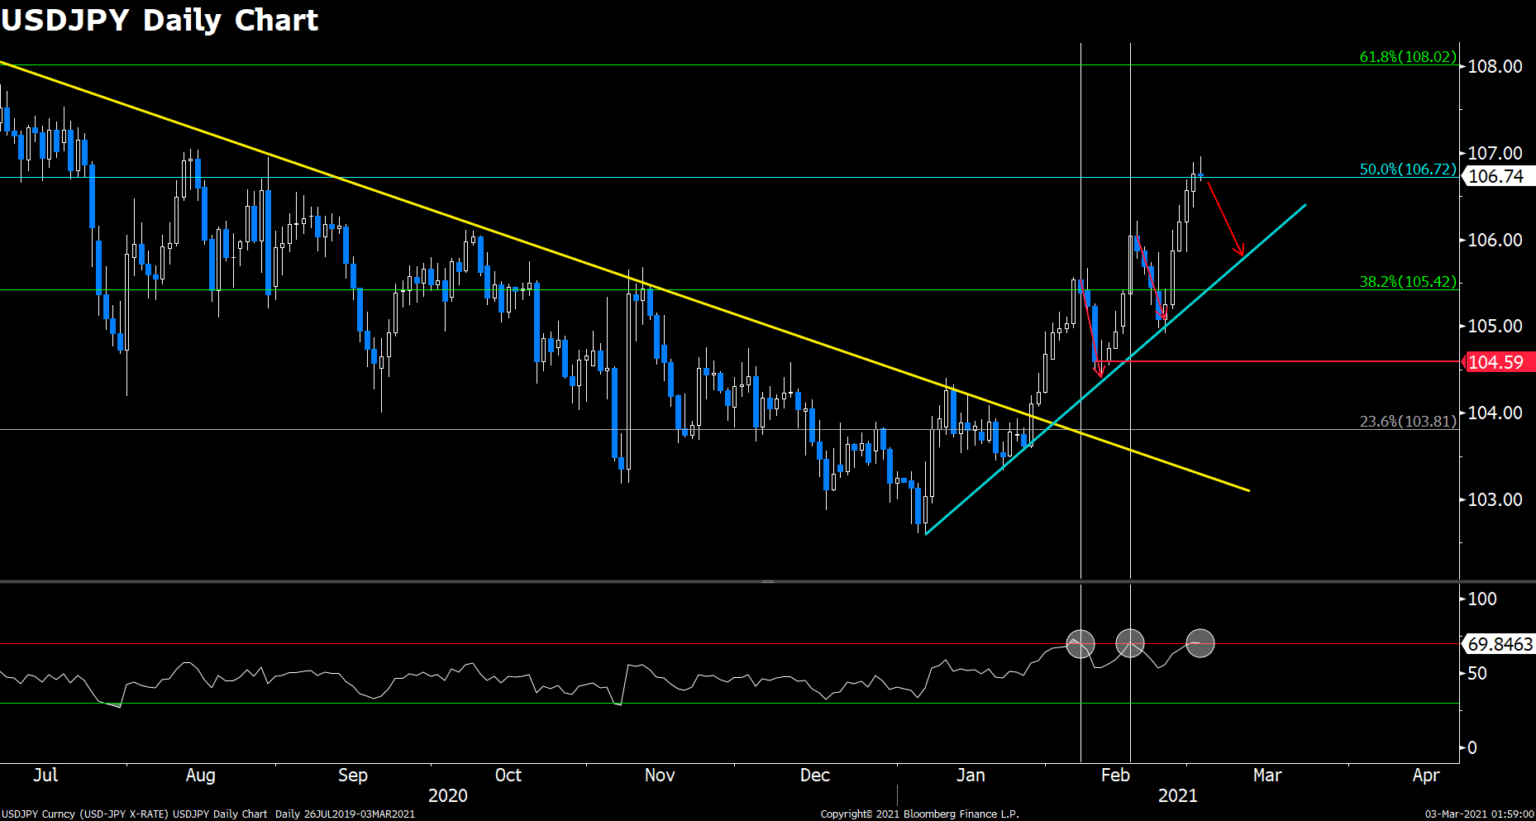
USDJPY (Daily Chart)

USDJPY has skyrocketed from 105 to 109.2, an jaw droppping 4% appreciation. This in turn drove RSI deeply into overbought region, reached as high as 83, and marked the highest daily RSI figure since December 2016. But what goes up must come down, this pair is poised to retreat as bond yield cooled off in the last two days. In the near term, 61.8% Fibonacci of 108 could act as a weak support, but the bears probably eye for a larger retracement toward 106.7. Note that the bullish run could have been a eleven-day winning streak if it did not lost around 106.7, thus proving the signifiance of this price level. RSI is still sticking out in the overheated zone, currently printing 73.8.
Resistance: 109.6
Support: 108, 106.7, 105.4
Economic Data
|
Currency |
Data |
Time (TP) |
Forecast |
||||
|
EUR |
Deposit Facility Rate (Mar) |
20:45 |
-0.5% |
||||
|
EUR |
ECB Marginal Lending Facility |
20:45 |
|||||
|
EUR |
ECB Interest Rate Decision (Mar) |
20:45 |
|||||
|
USD |
Initial Jobless Claims |
21:30 |
725K |
||||
|
EUR |
ECB Press Conference |
21:30 |
|||||
|
USD |
JOLTs Job Openings (Jan) |
23:00 |
6.600M |
||||


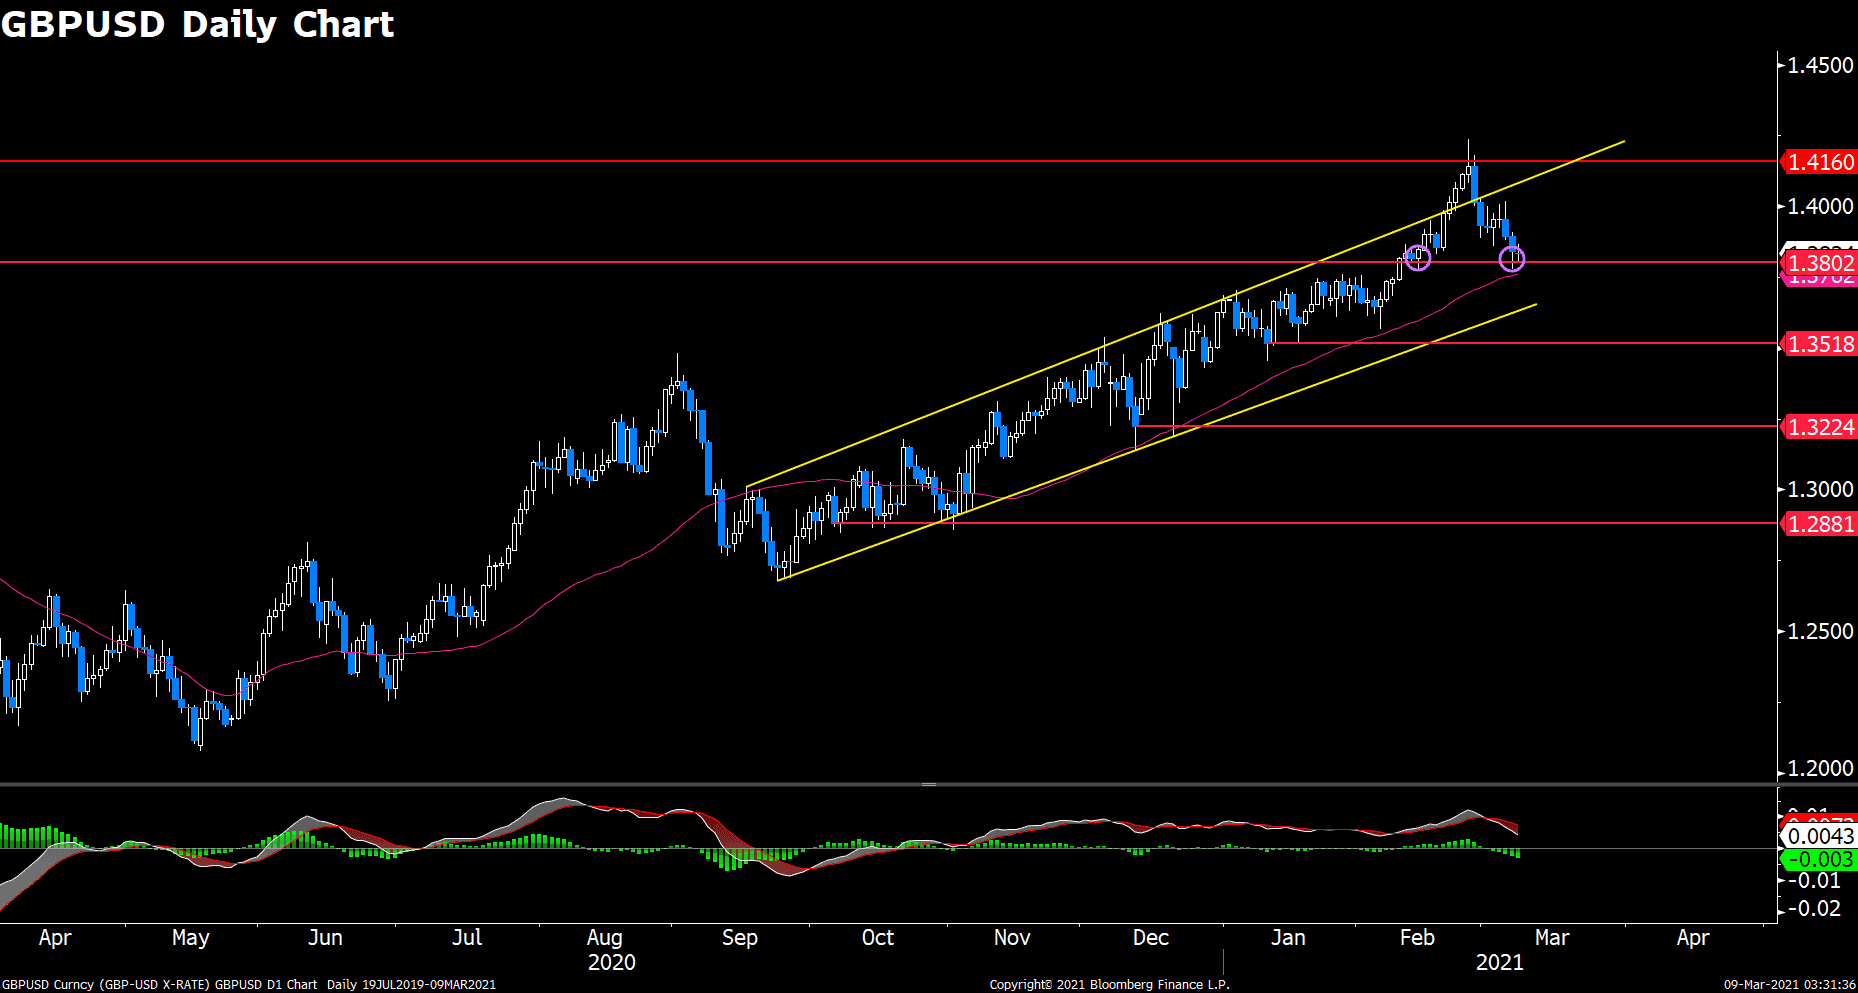

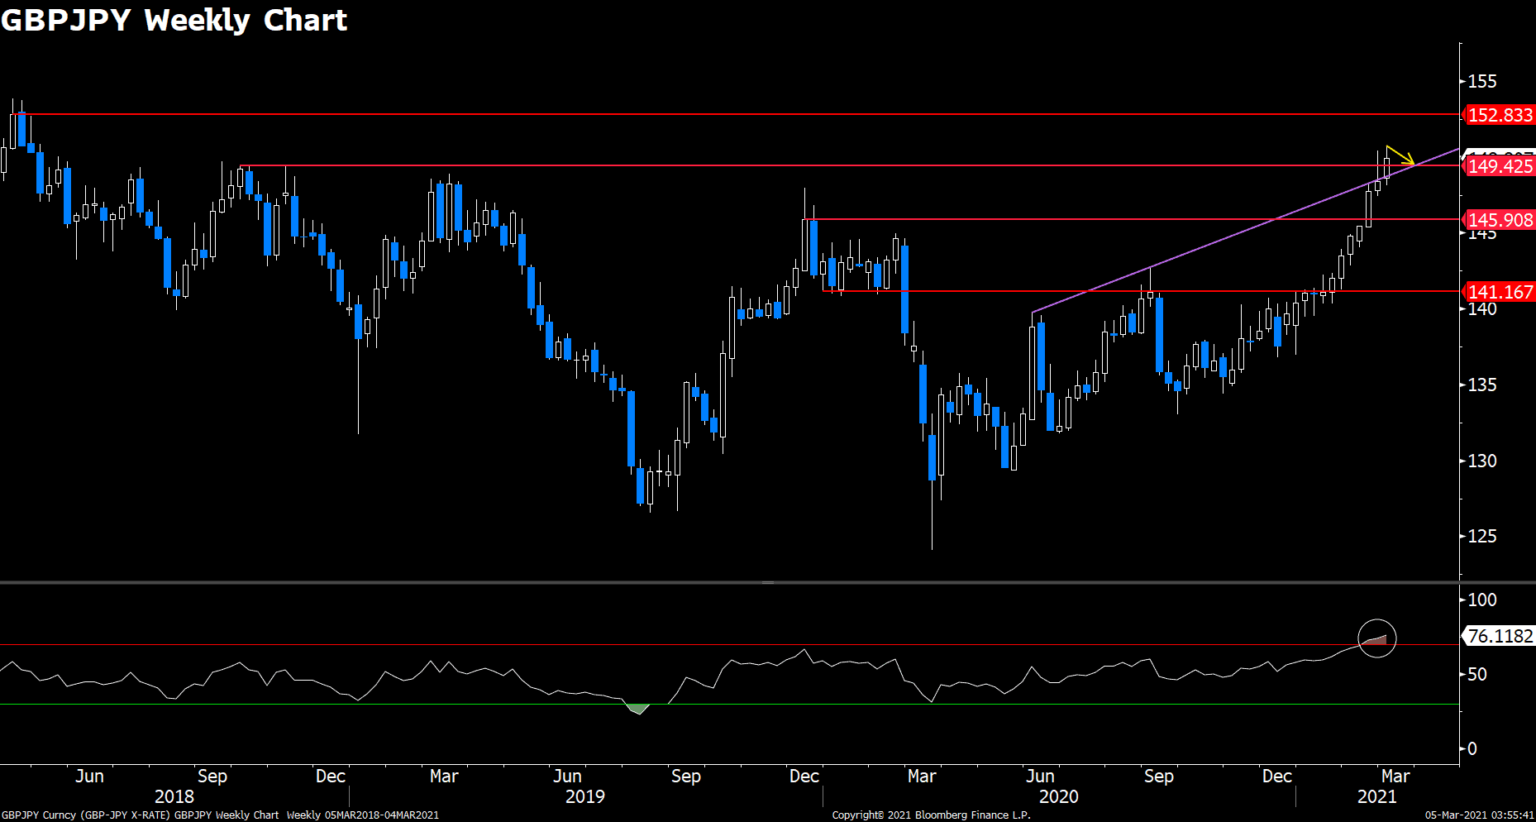
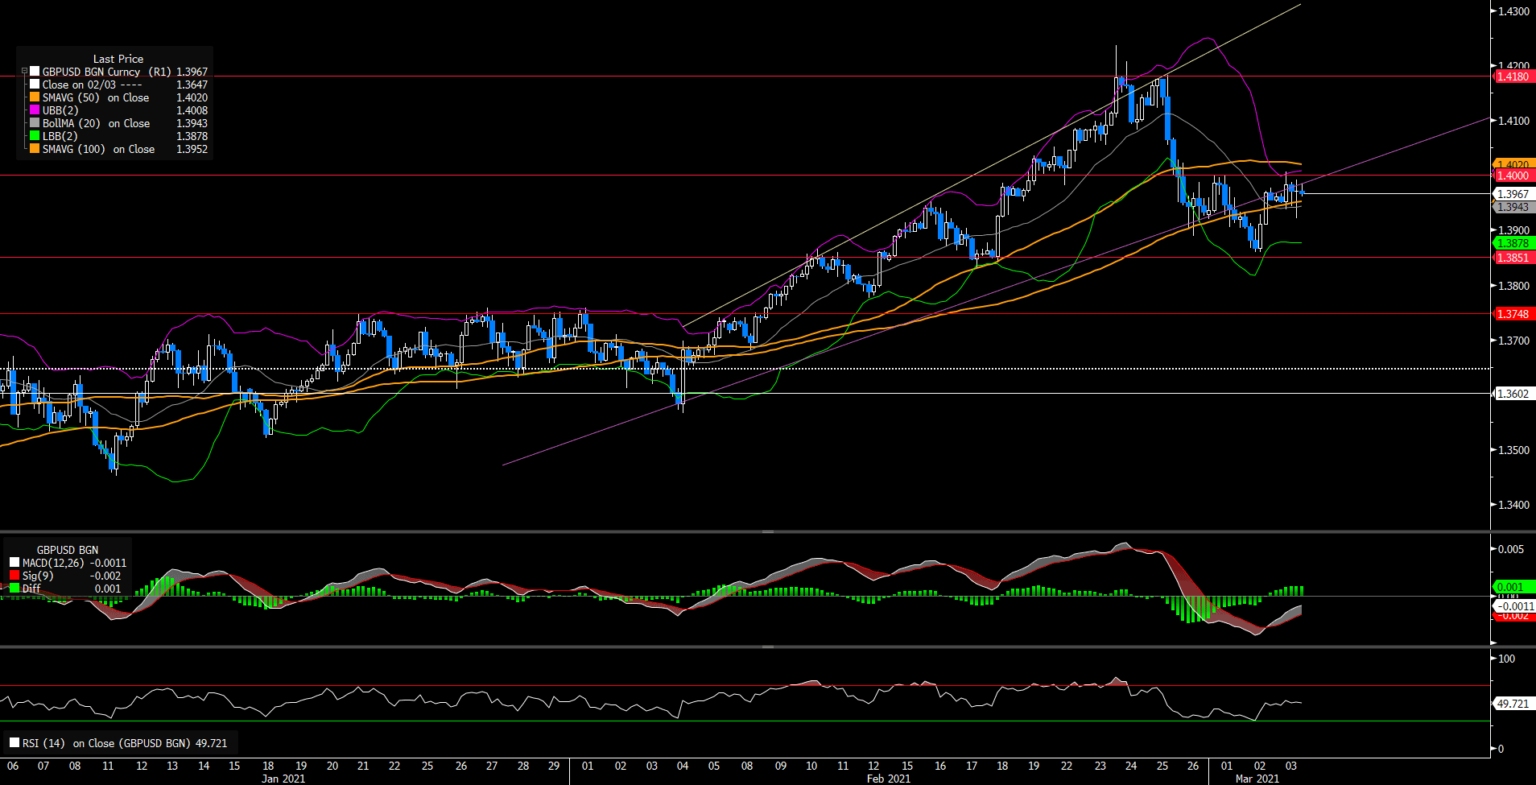
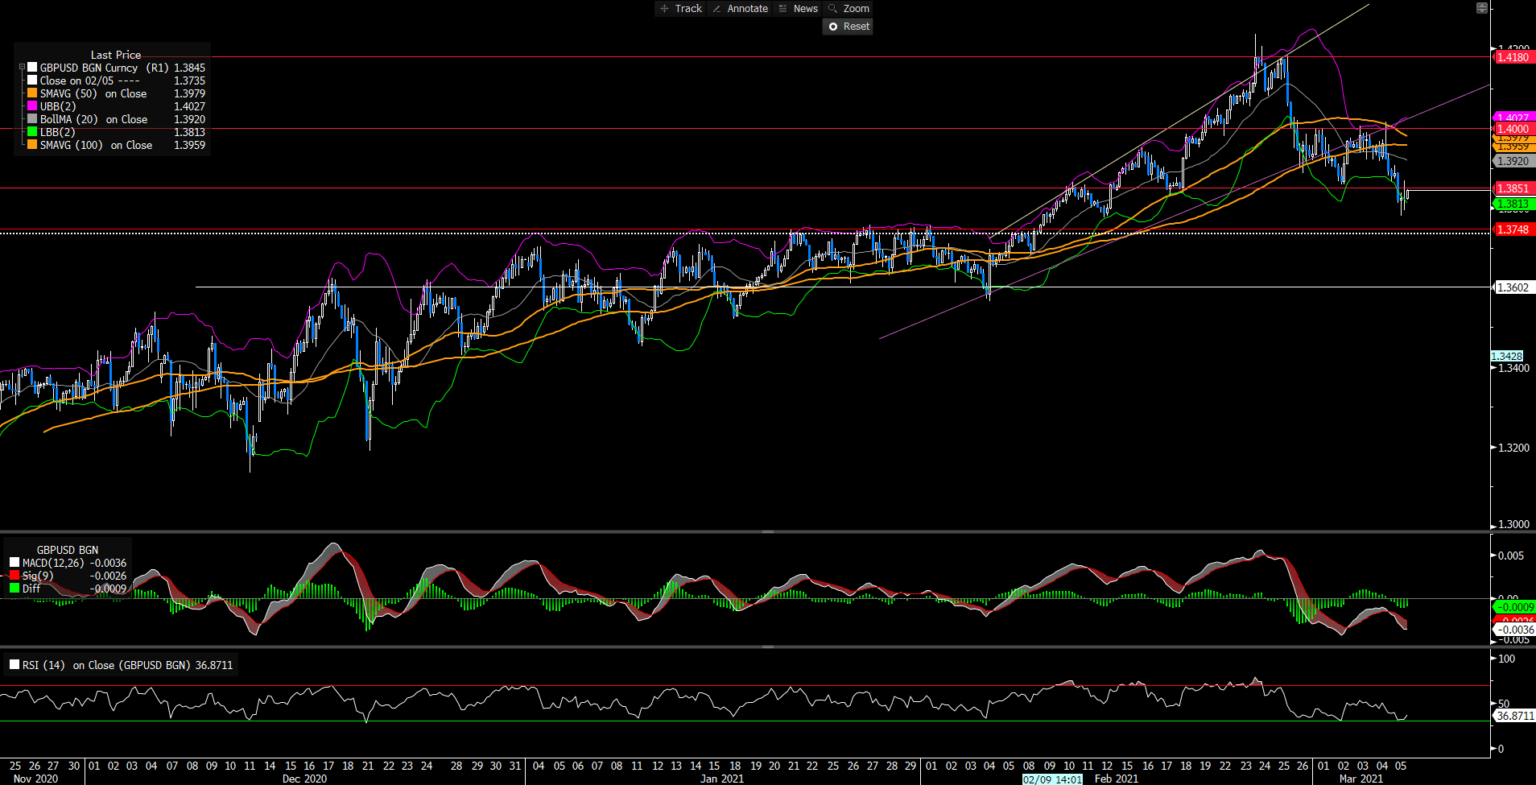 In the near- term, GBP/USD suffers from the downside momentum, and continues to fall below the 100 and 50- SMA. Additionally, the bearish momentum is expected to continue as the RSI indicator is still above 30, which is outside the oversold sitiuation. In the next trading days, the price fluctuation is expected to fall in the range of 1.3851- 1.3748. In the bigger picture, the outlook for GBP/USD stays cautiously bullish even though it is deeping now as it is still in the monthly ascending channel.