Daily Market Analysis
Market Focus
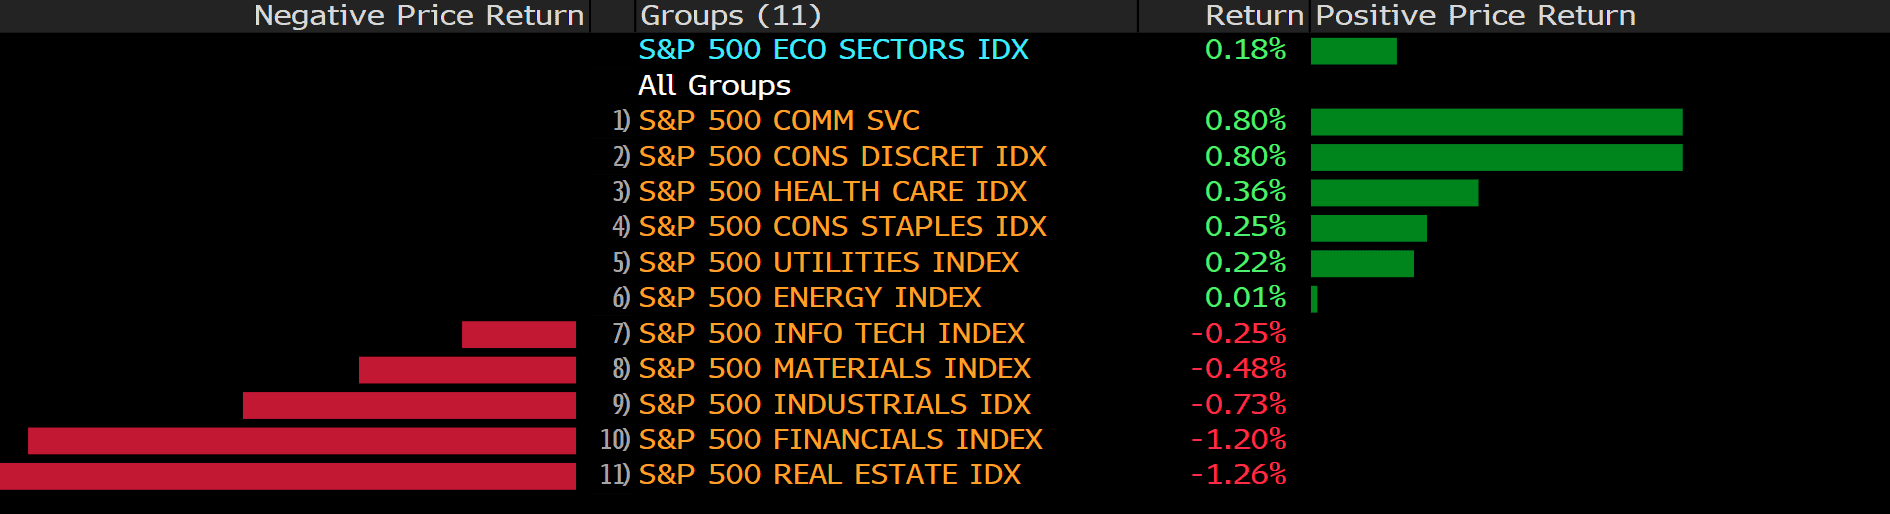
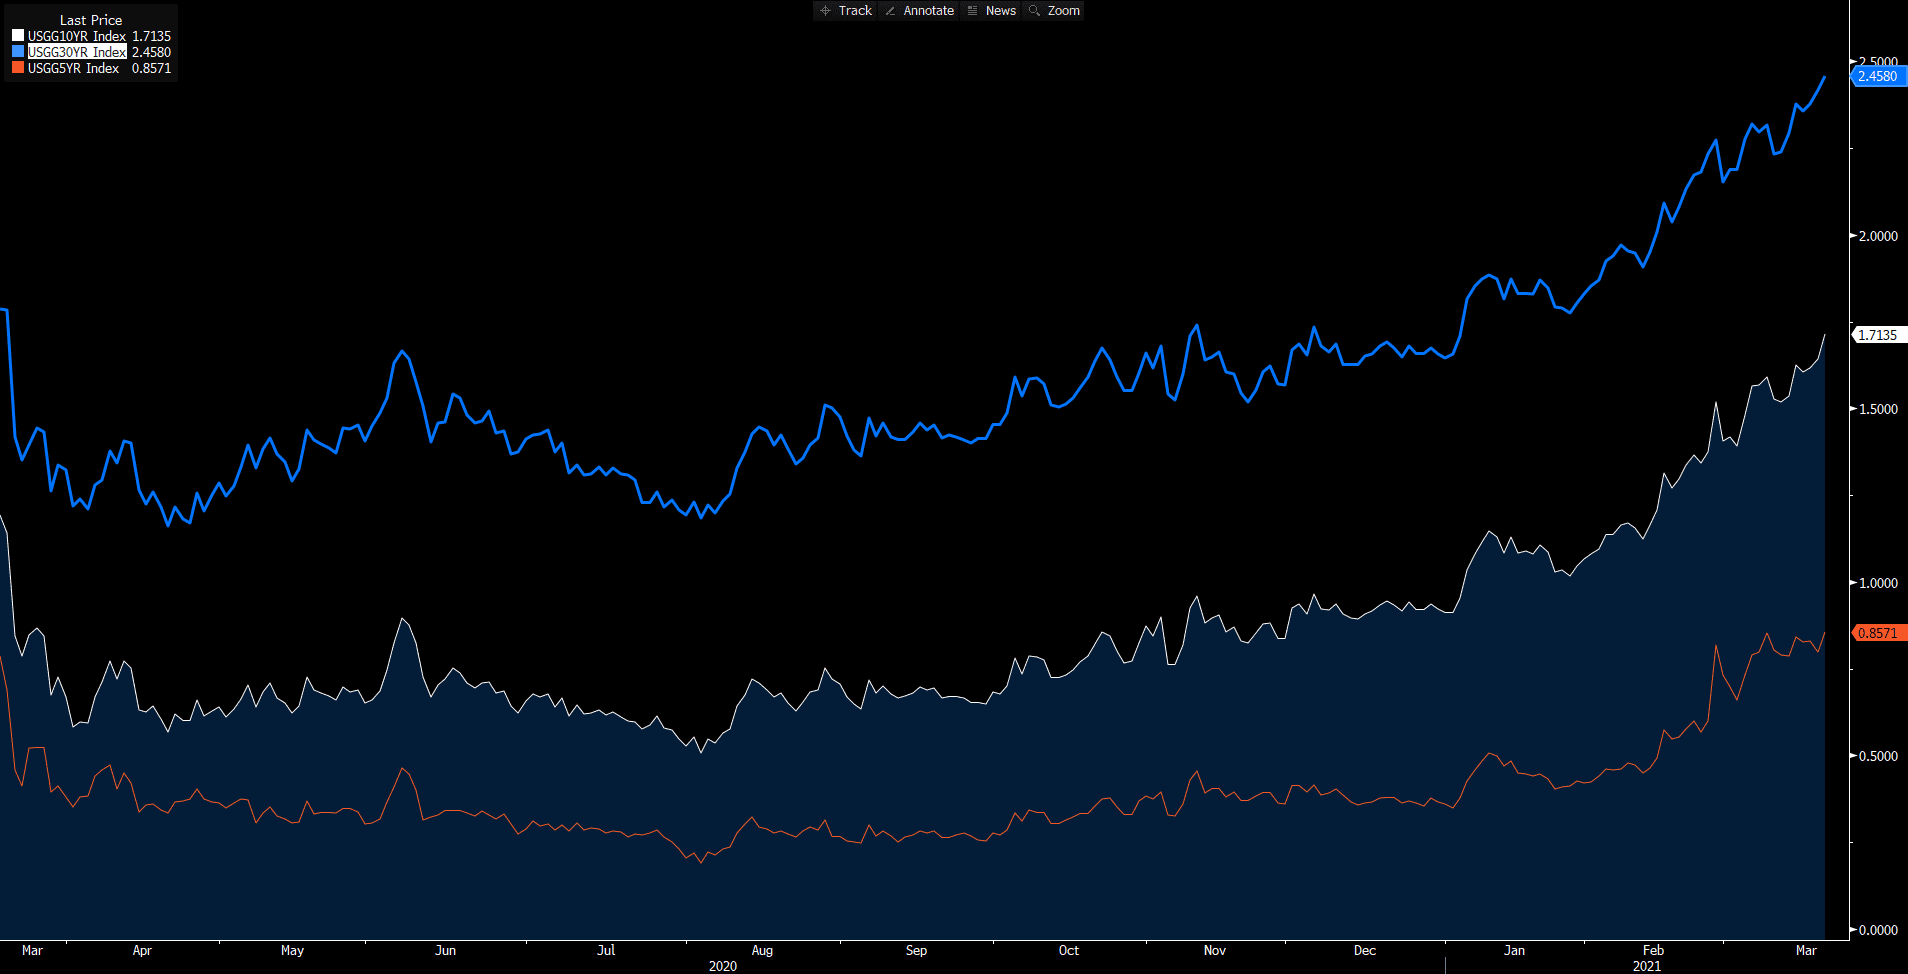
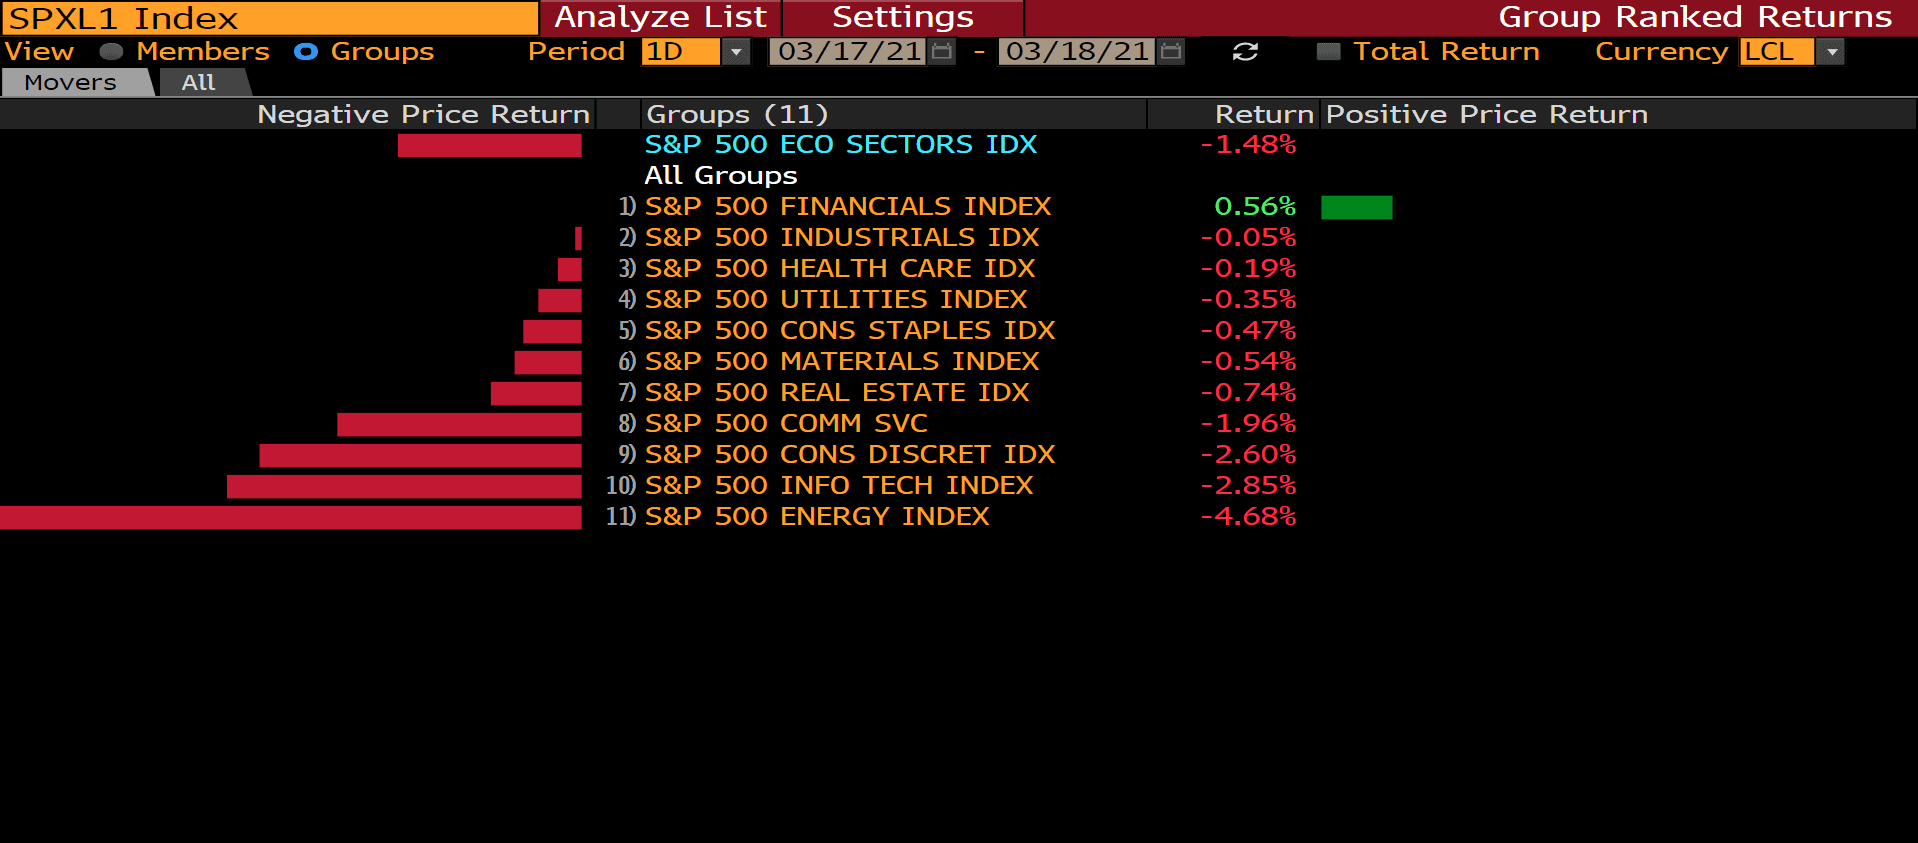
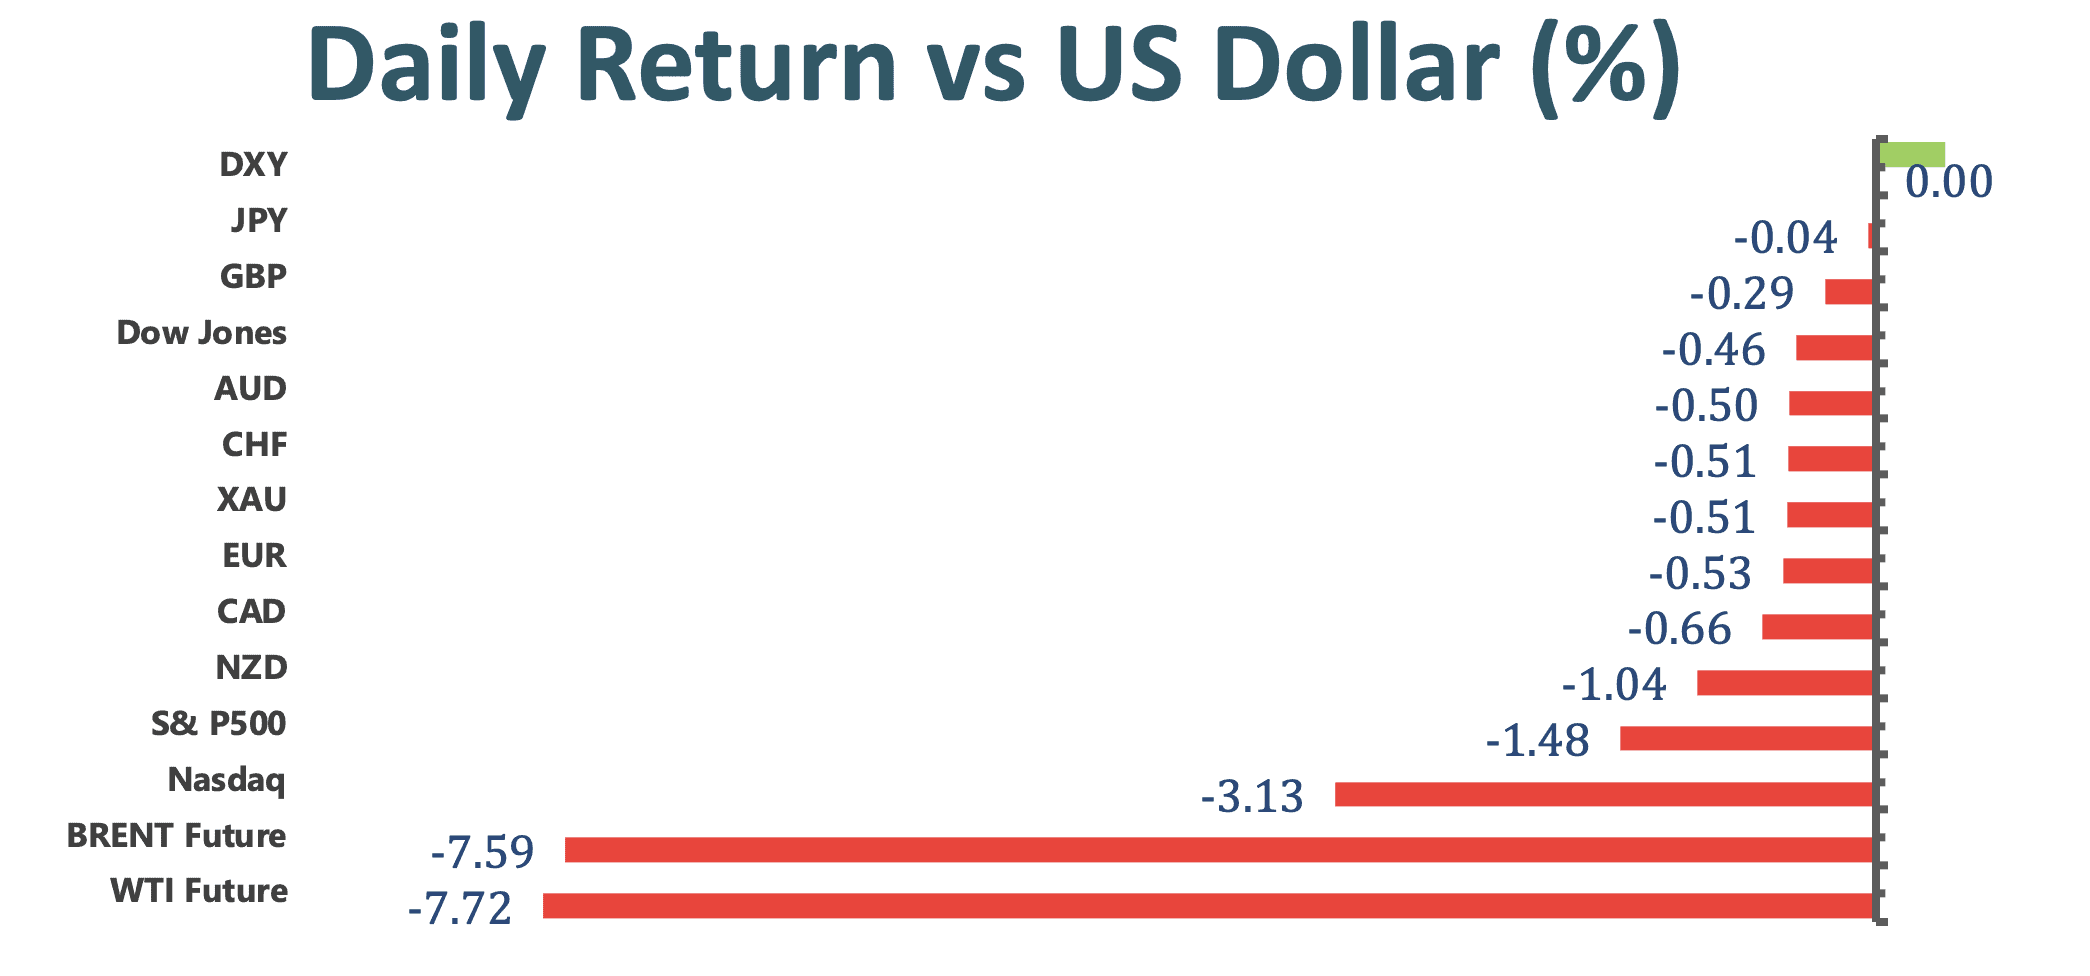
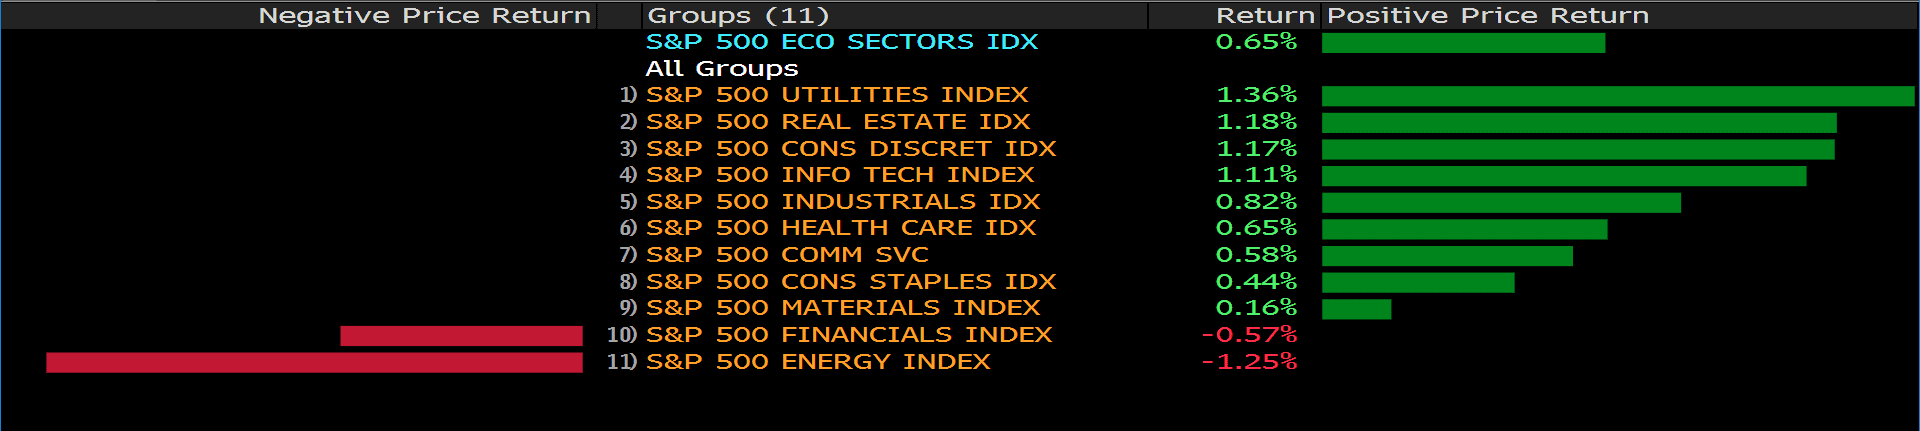
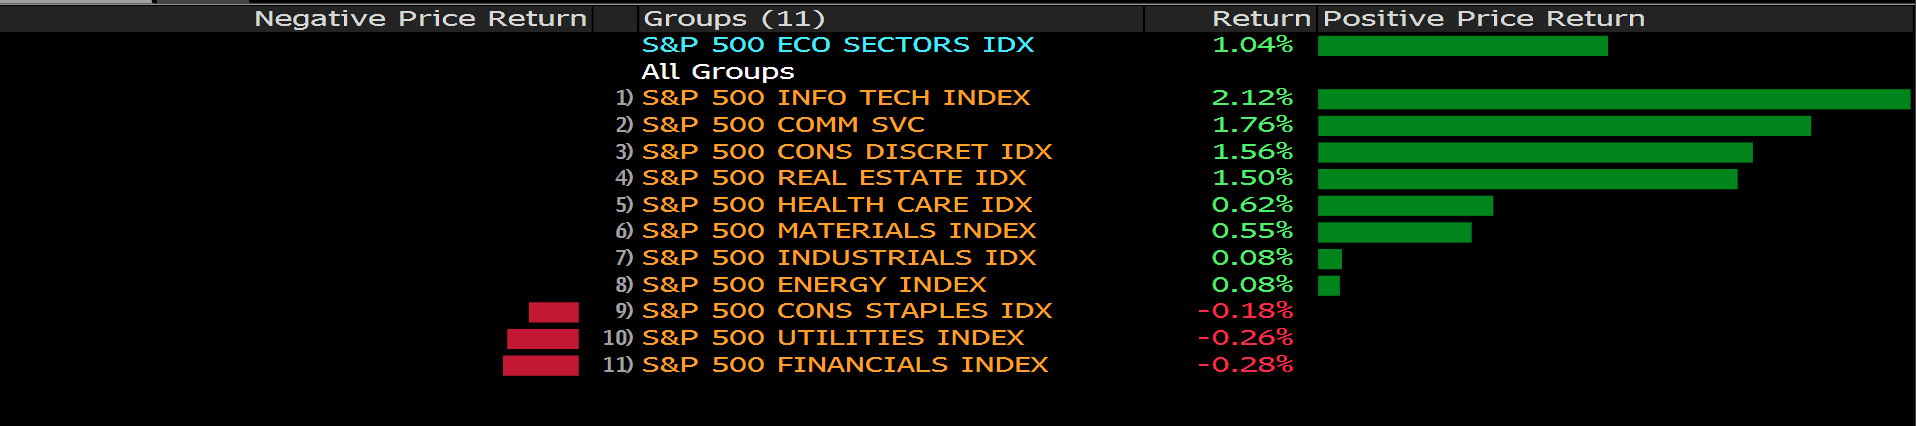
US equity market was mixed as investors weighed the risk of inflation with economic growth accelerating. The Dow Jones Industrial Index is down on a second consecutive day, dropped 0.77% on Friday. Meanwhile, the S&P 500 index pared its weekly losses, with communication stocks led the gain and financial and real estate shares fell behind. US 10-year treasury yield rose 0.55%.
The Federal Reserve will relax its Supplementary Leverage Ratio on banks to pre-pandemic level. In response to market panic back in last March, the Fed had let banks to exclude Treasuries and deposits in SLR calculation. However, this relief will lapse March 31 as planned, the Fed said in a Friday statement.
The first high-level talks between China and US since President Biden took office quickly descended into recrimination. The largest two economies criticized each other over human rights, trade, and international alliances. In response to Biden’s toughness, China accused “US wasn’t qualified to speak to China from a position of strength.” Despite wide expectation of divergence in the first meeting, investors are growing concerns over the development in these fiery talks.
Here is Bloomberg’s key takeaways from BoJ monetary policy:
Market Wrap
Main Pairs Movement
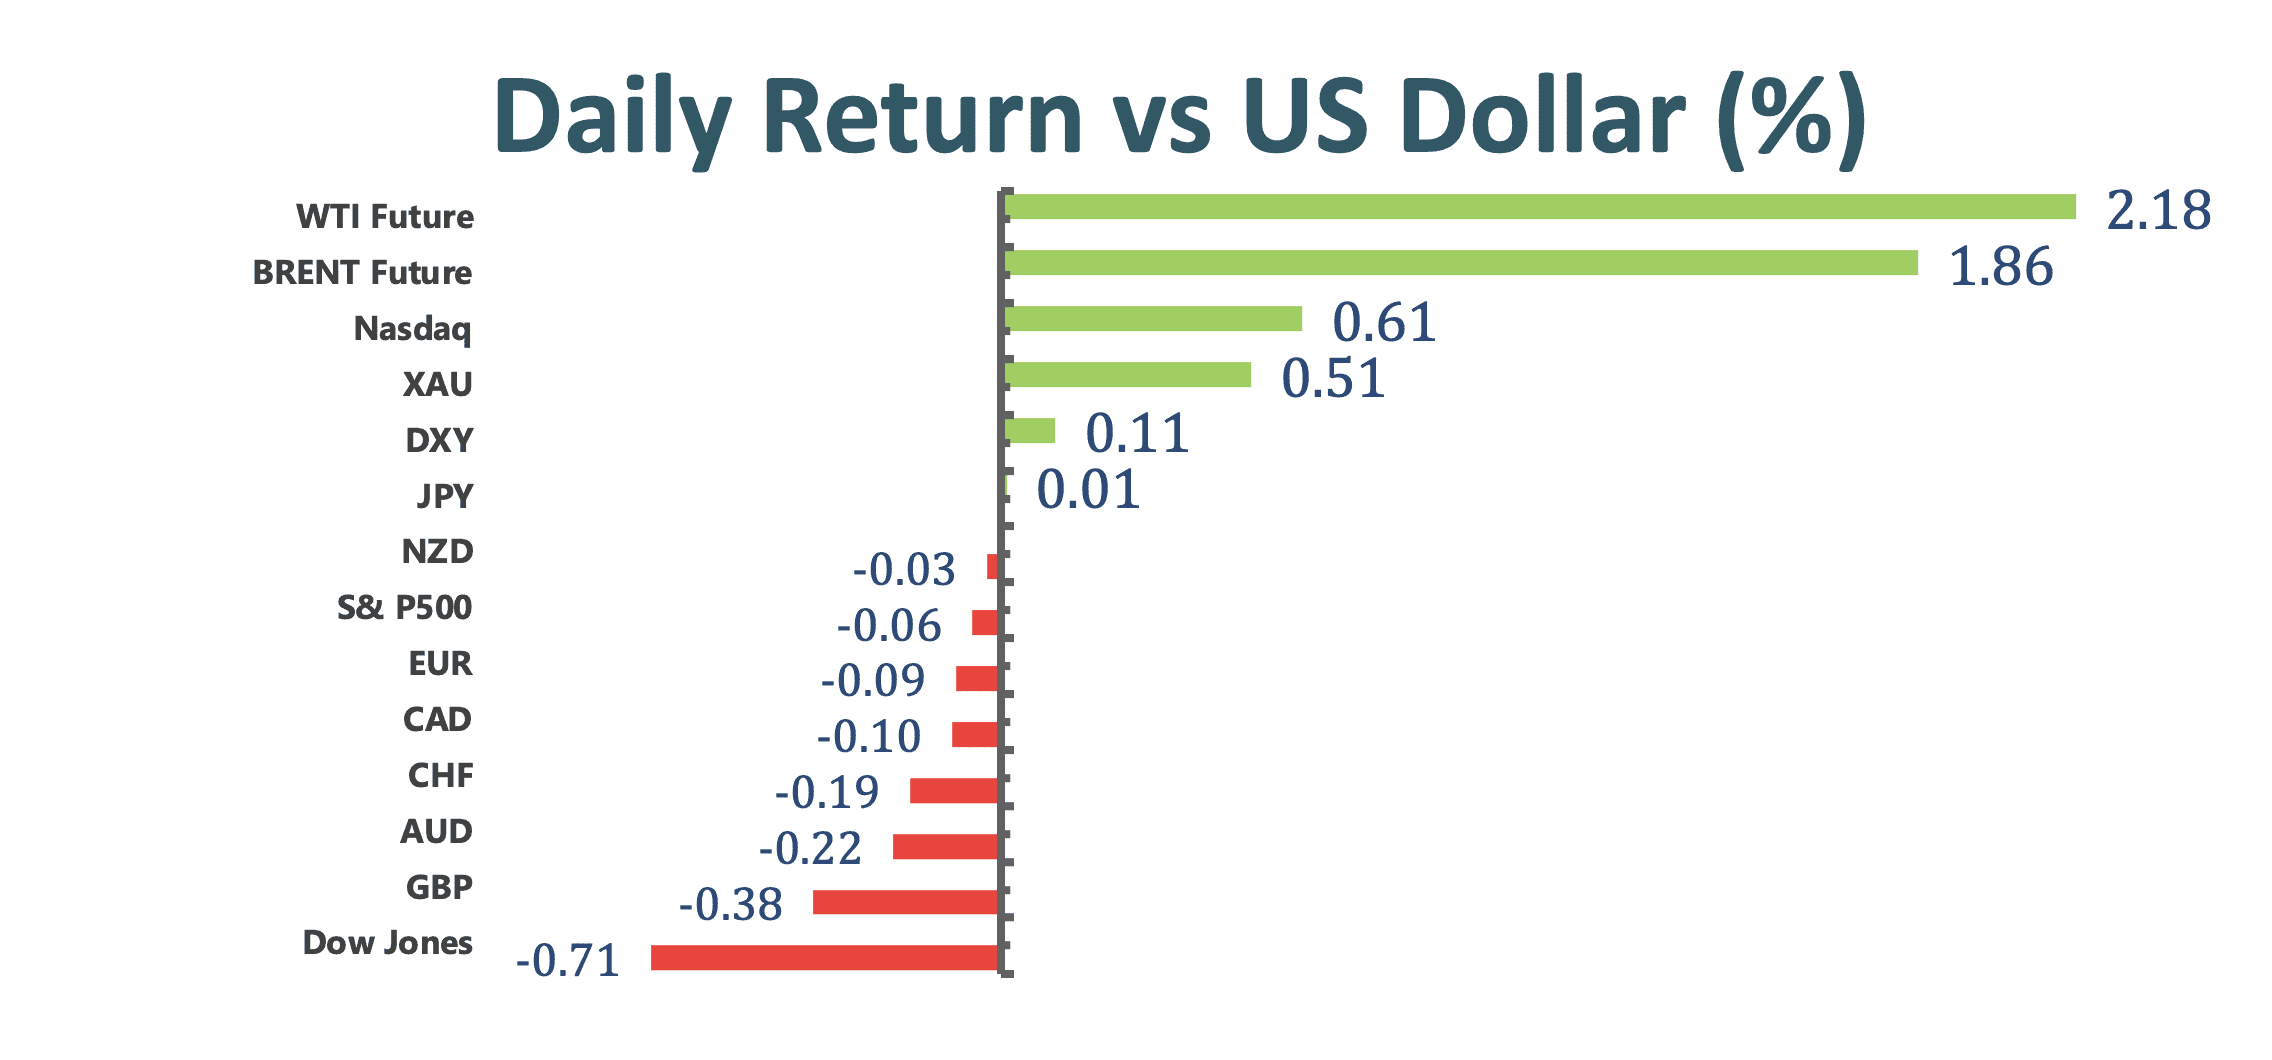
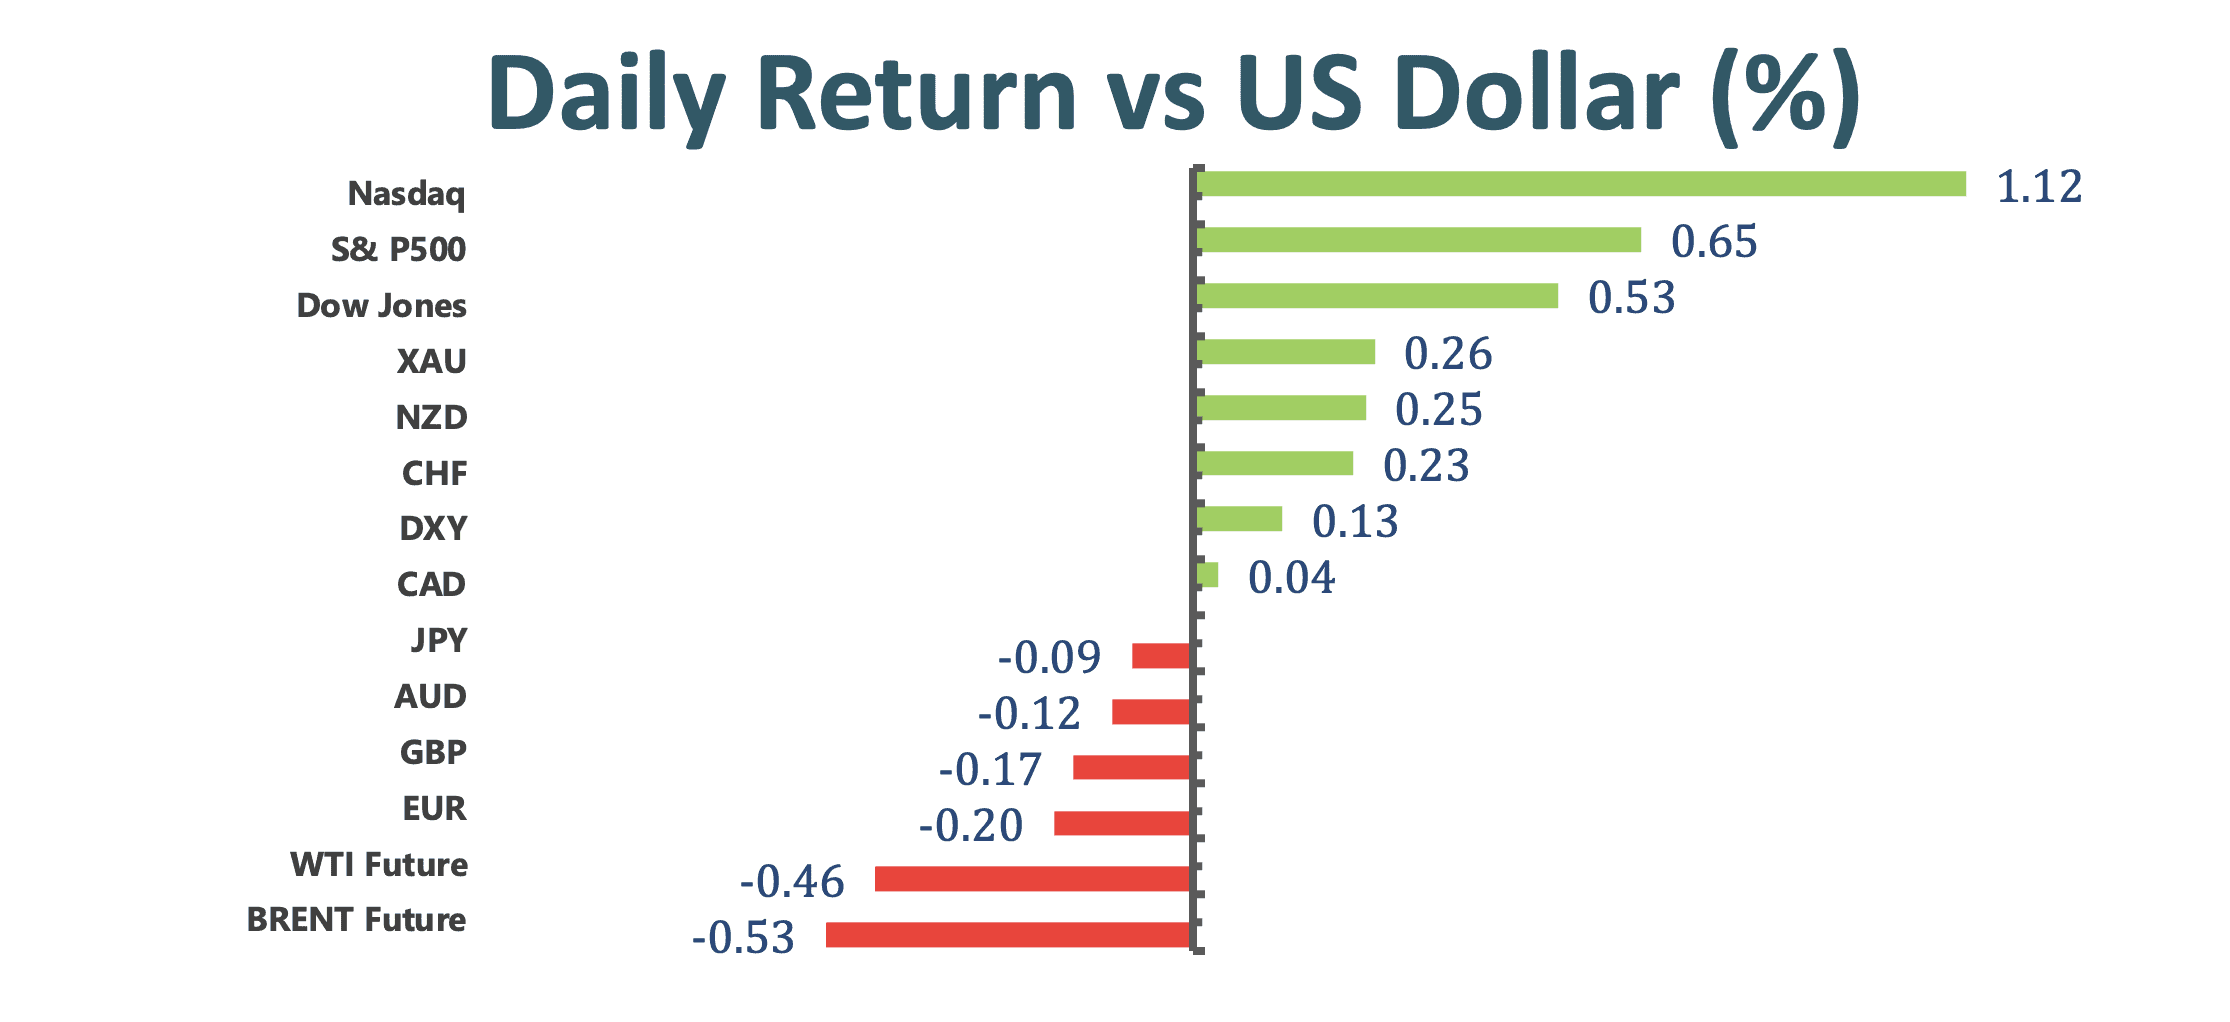
Euro was on the back foot against the US greenback as US bond yield advanced to 1.74%. As the mutated coronavirus has taken hold in Italy, Prime Minister Mario Draghi pushed most part of the country into another lock down, set to expire in early April. The latest restriction will significantly deepned the current economic contraction. Thus, the Euro bears are here to stay.
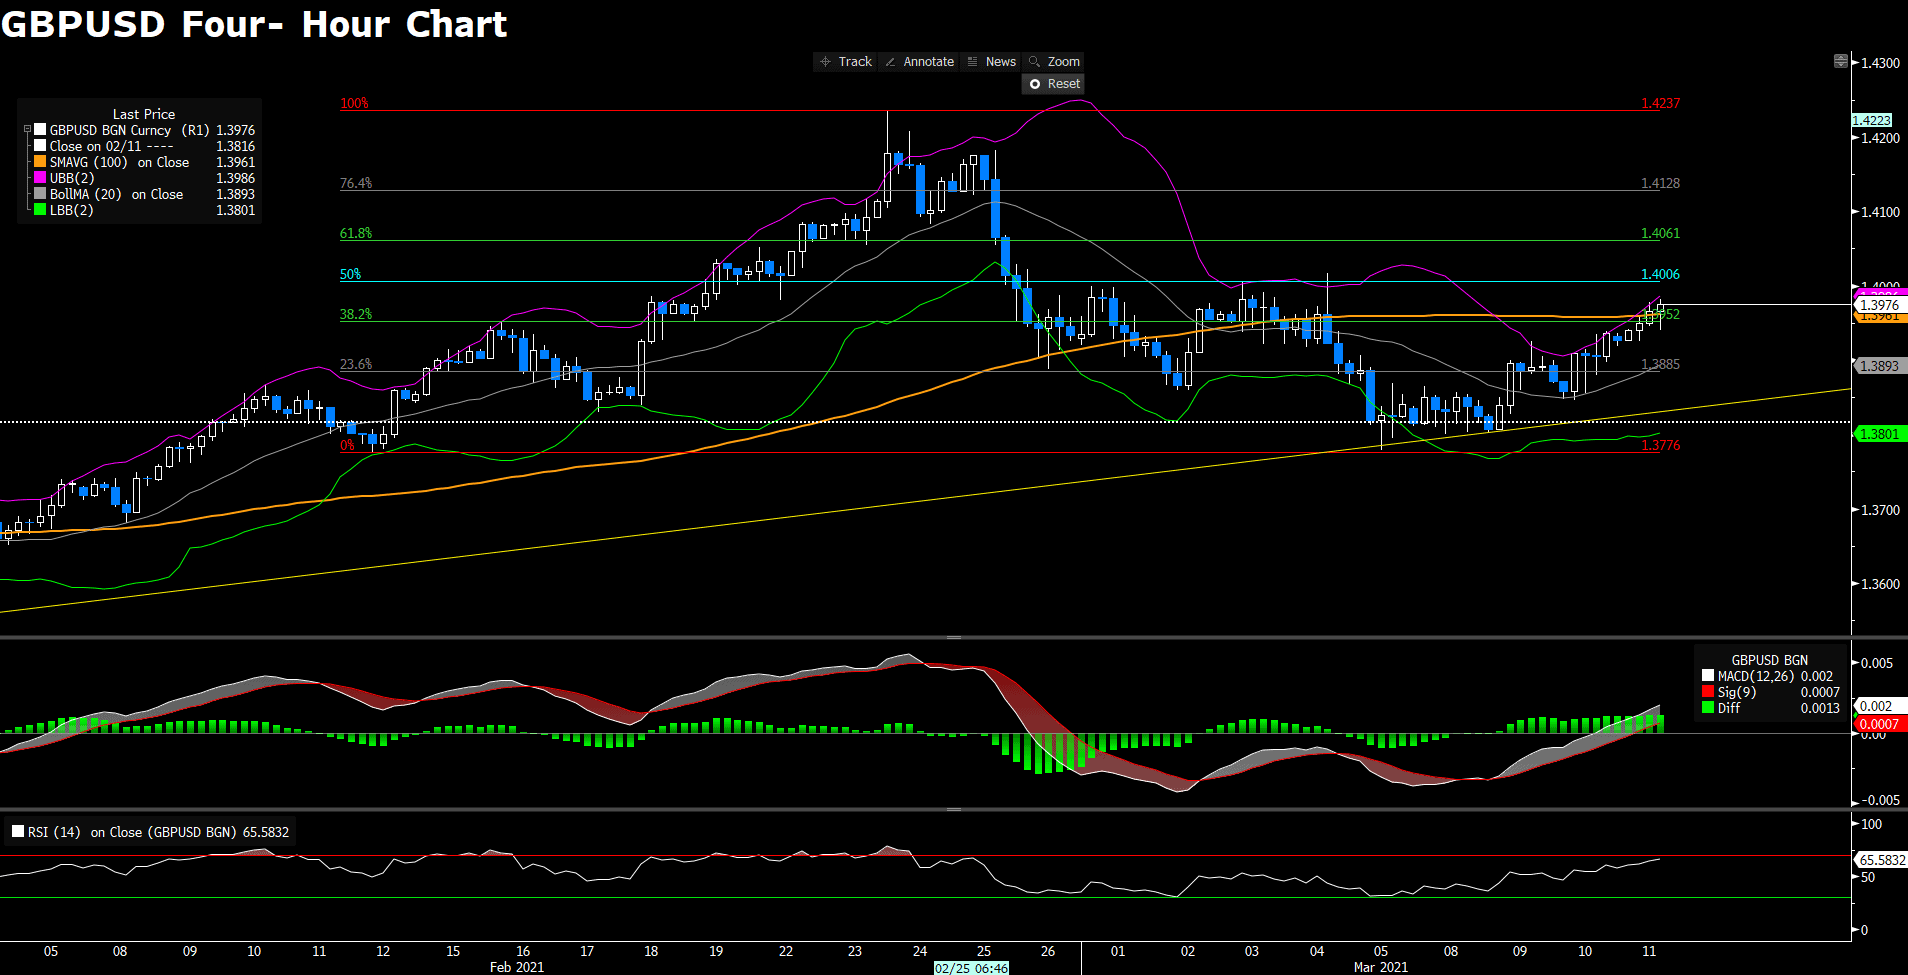
Cable was the worst performer among its G-7 peers, dipped 0.4% on Friday. The Sterling was weighed down by slowdown of its vacination campaign. Around 38% of UK’s population received the first dose of vaccine, but only 2.6% administered the second dose. Investors are concerned that slowing supply may derail exit from the current lockdown.
Aussie slipped 0.14% amid downbeat retail sales. Australian retail sales declined by 1.1% in February, missed expecation of 0.4% growth. However, the commodity linked is generally resilient to the rebounding dollar greenback, dipped only 0.23% on a weekly basis.
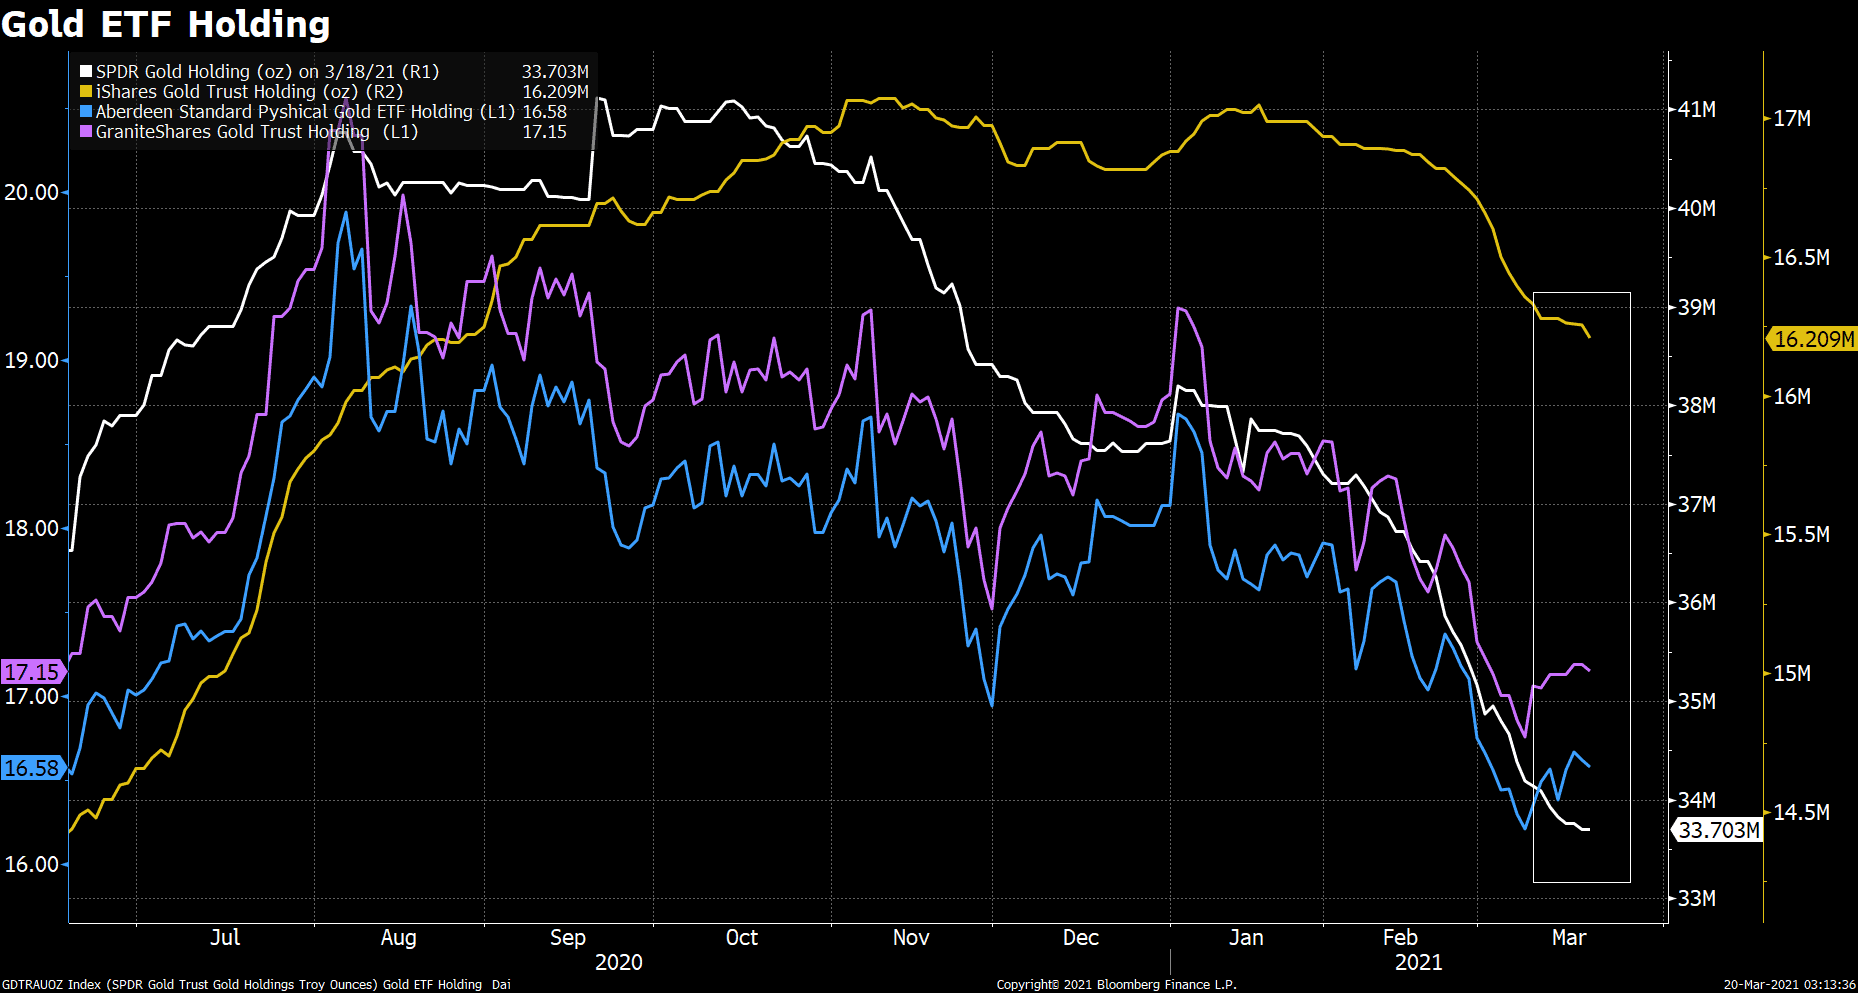
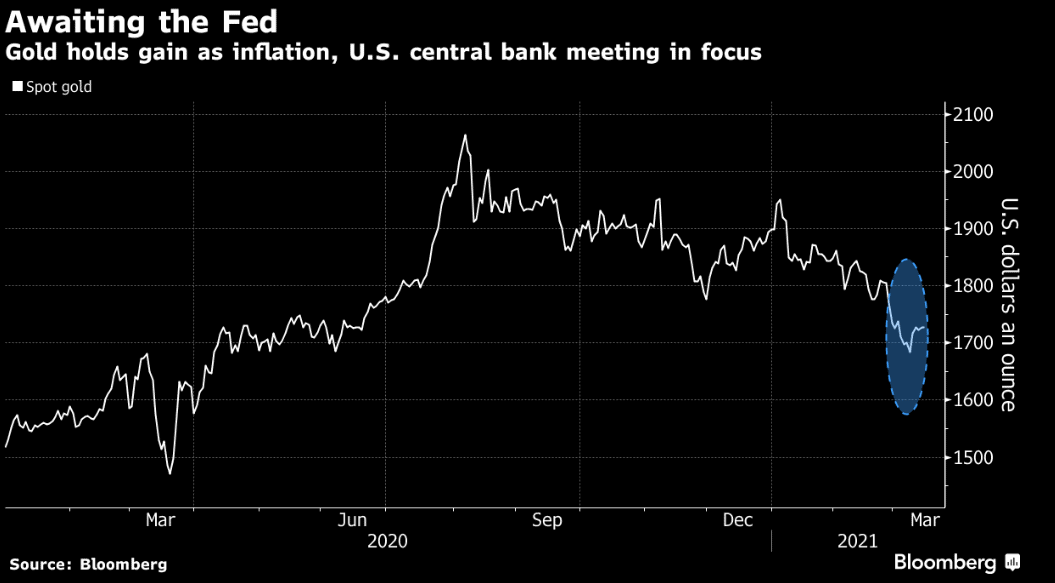
Gold continued to recover albeit higher bond yields, rallied 0.31%. We are witnessing a deceleration in sell-offs among the largest Gold ETFs. SPDR Gold ETF holding was essentially unchanged for the week of March 15th, whereas iShares Gold Trust holding only decreased 0.02 million ounces in the past two weeks. Perhaps, we could see some dip-buying as the non-yield metal is oversought recently.
Technical Analysis:
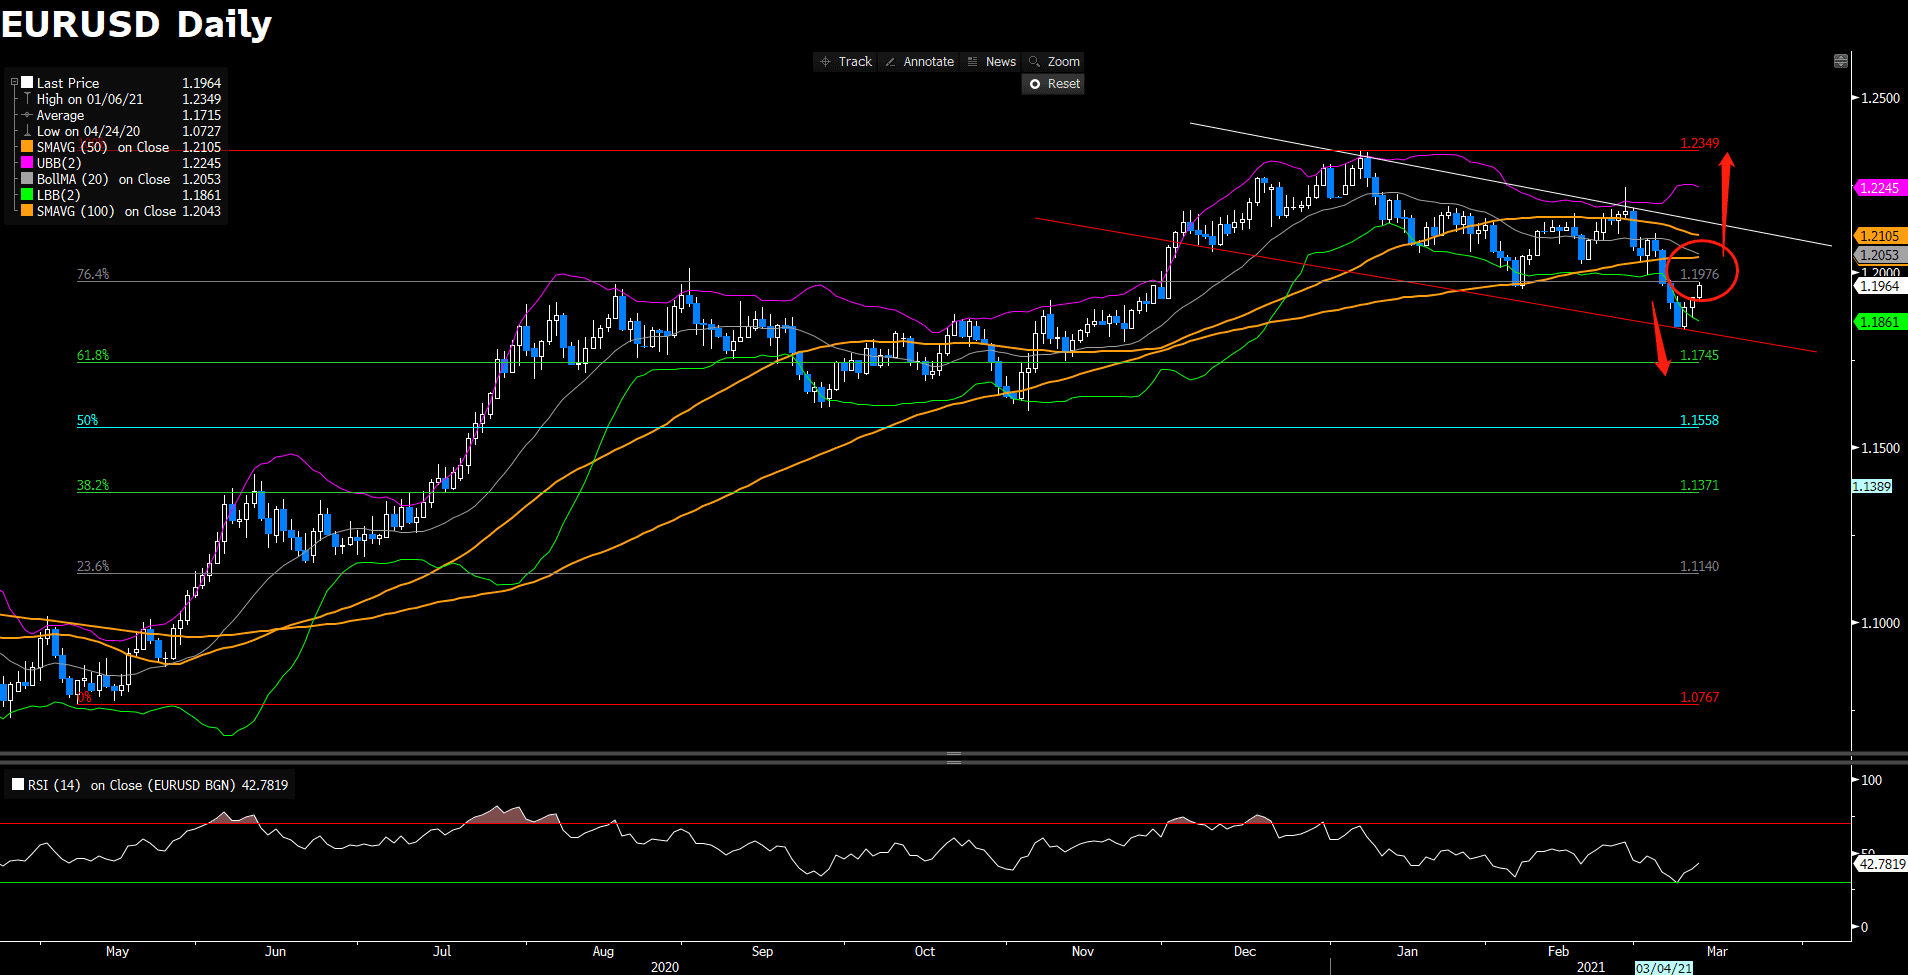
EURUSD (Daily & Monthly Chart)
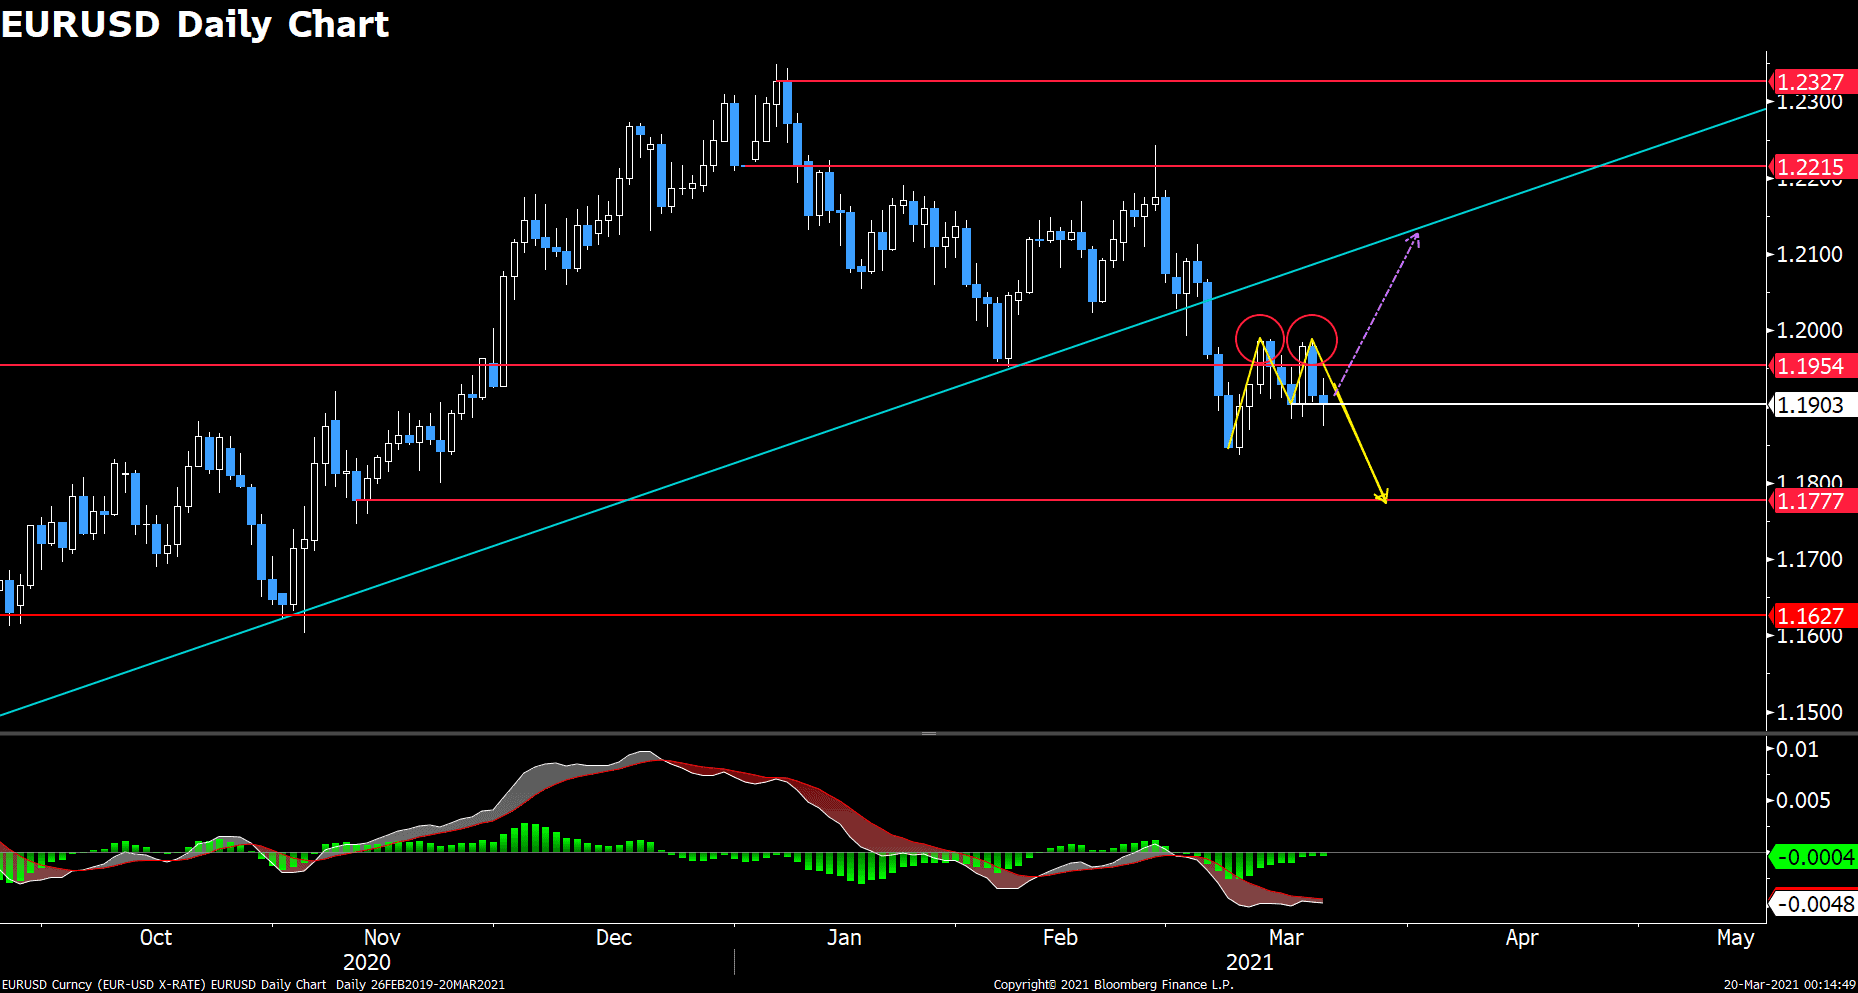

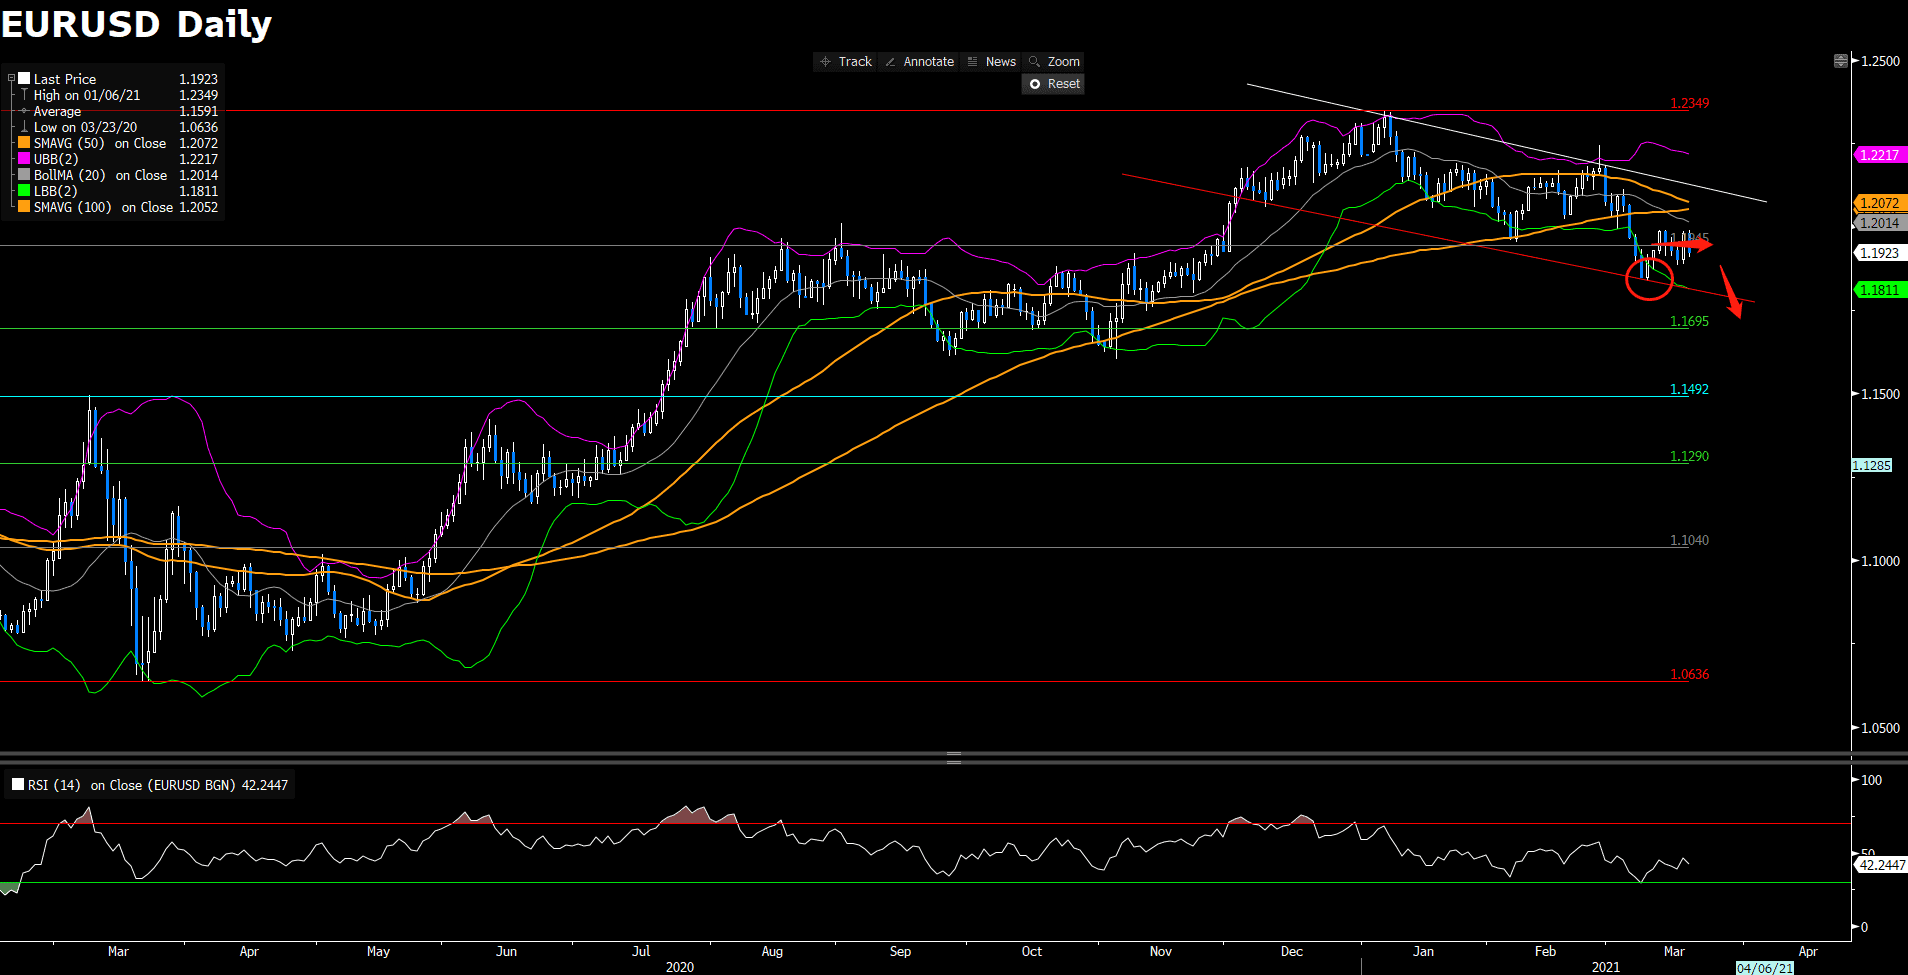
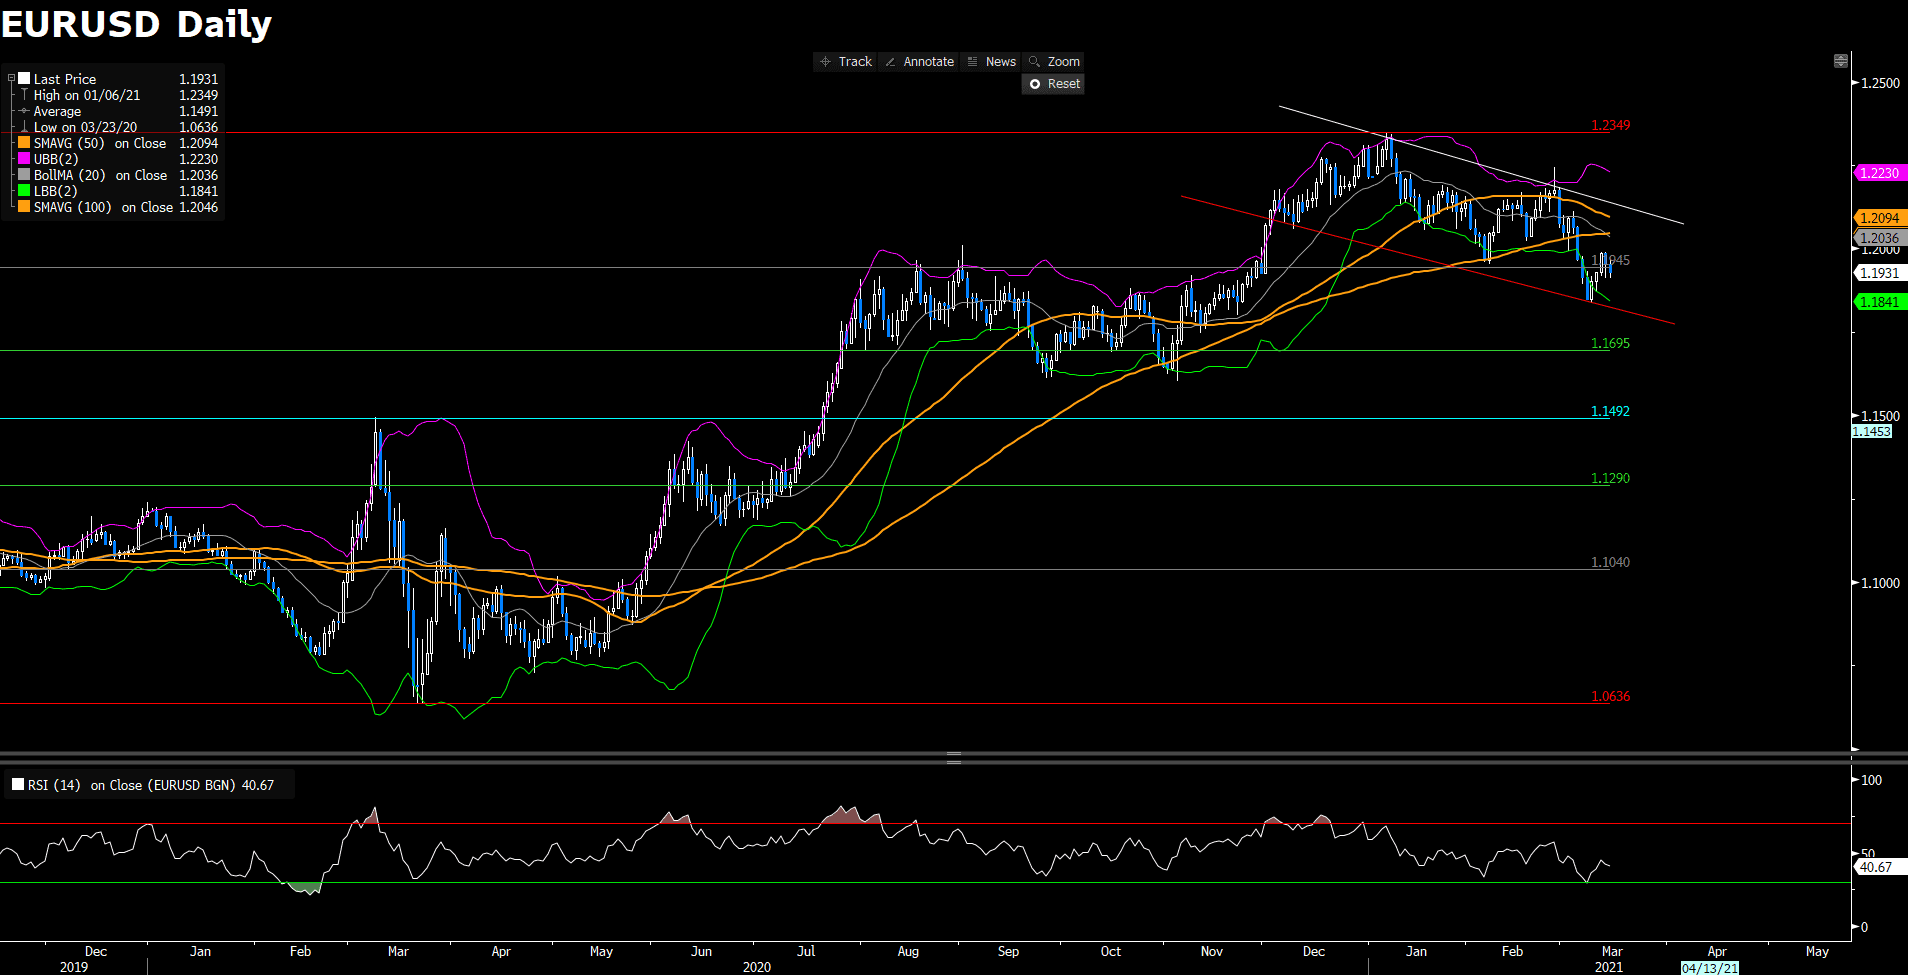
Euro dollar is undergoing a double-top trading pattern on the daily chart. In order to complete this pattern, the bears need a solid breakthrough from neckline of 1.19. On the downside, price would fall onto nearest support of 1.1778, last seen in last November. Conversely, resurgence to 1.195 resistance could offer bulls the chance to pile in, and create momentum to reclaim 1.2. As we mentioned in previous analysis, recent selling bias is actually a bigger retracement on the monthly chart, thus it is completely conceivable for the first scenario to play out itself. MACD slightly favors a bearish trend.
Resistance: 1.1954, 1.209, 1.221
Support: 1.1778, 1.163
AUDNZD (Daily Chart)
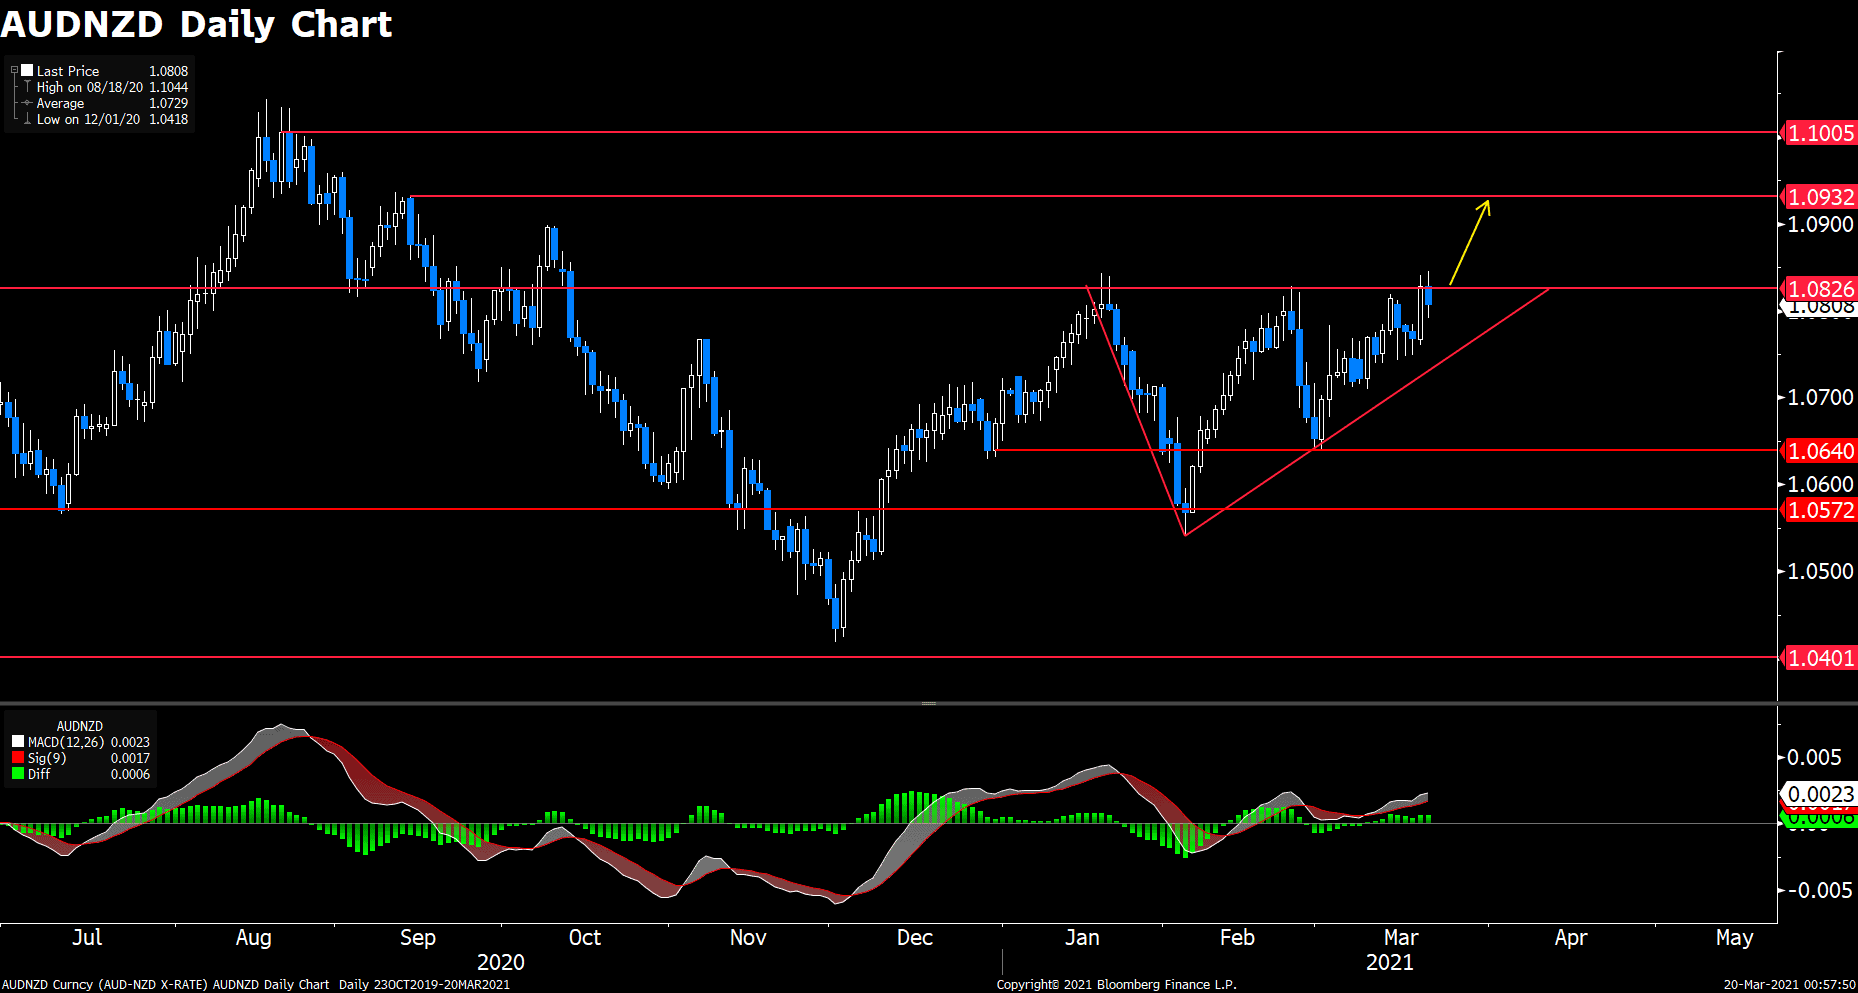
AUDNZD is trapped within an ascending triangle, and price is clinging to the ceiling around 1.083. An asending triangle usually points to a bullish trend. Yesterday’s solid long body candlestick has indicated demand for the Aussie are overwhelming compare to Kiwi. In fact, this is bulls’ strongest contest to 1.083 resistance, and we expect sellers to surrender this level. Further in the north, the antipodean pair could eye for 1.093, possibly advance toward 1.1 hurdle. MACD on the daily chart also lends support to the bulls.
Resistance: 1.083, 1.093, 1.1
Support: 1.064, 1.057
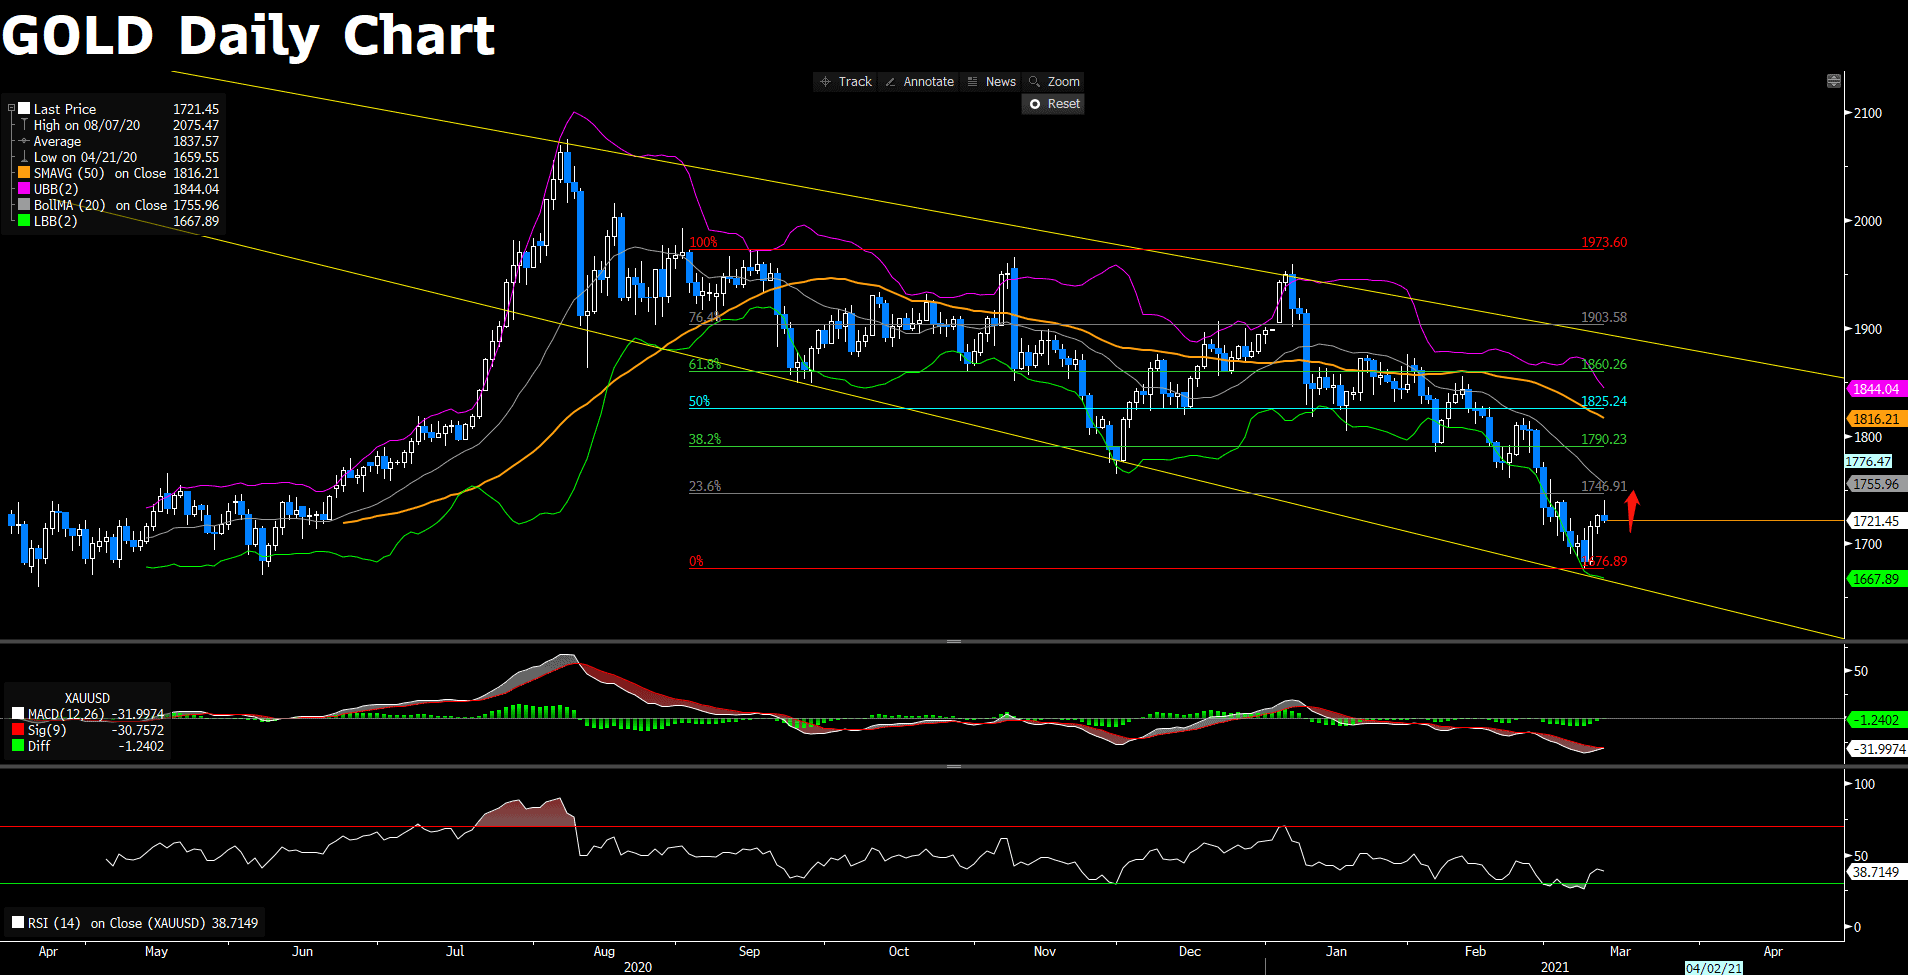
XAUUSD (Daily Chart)
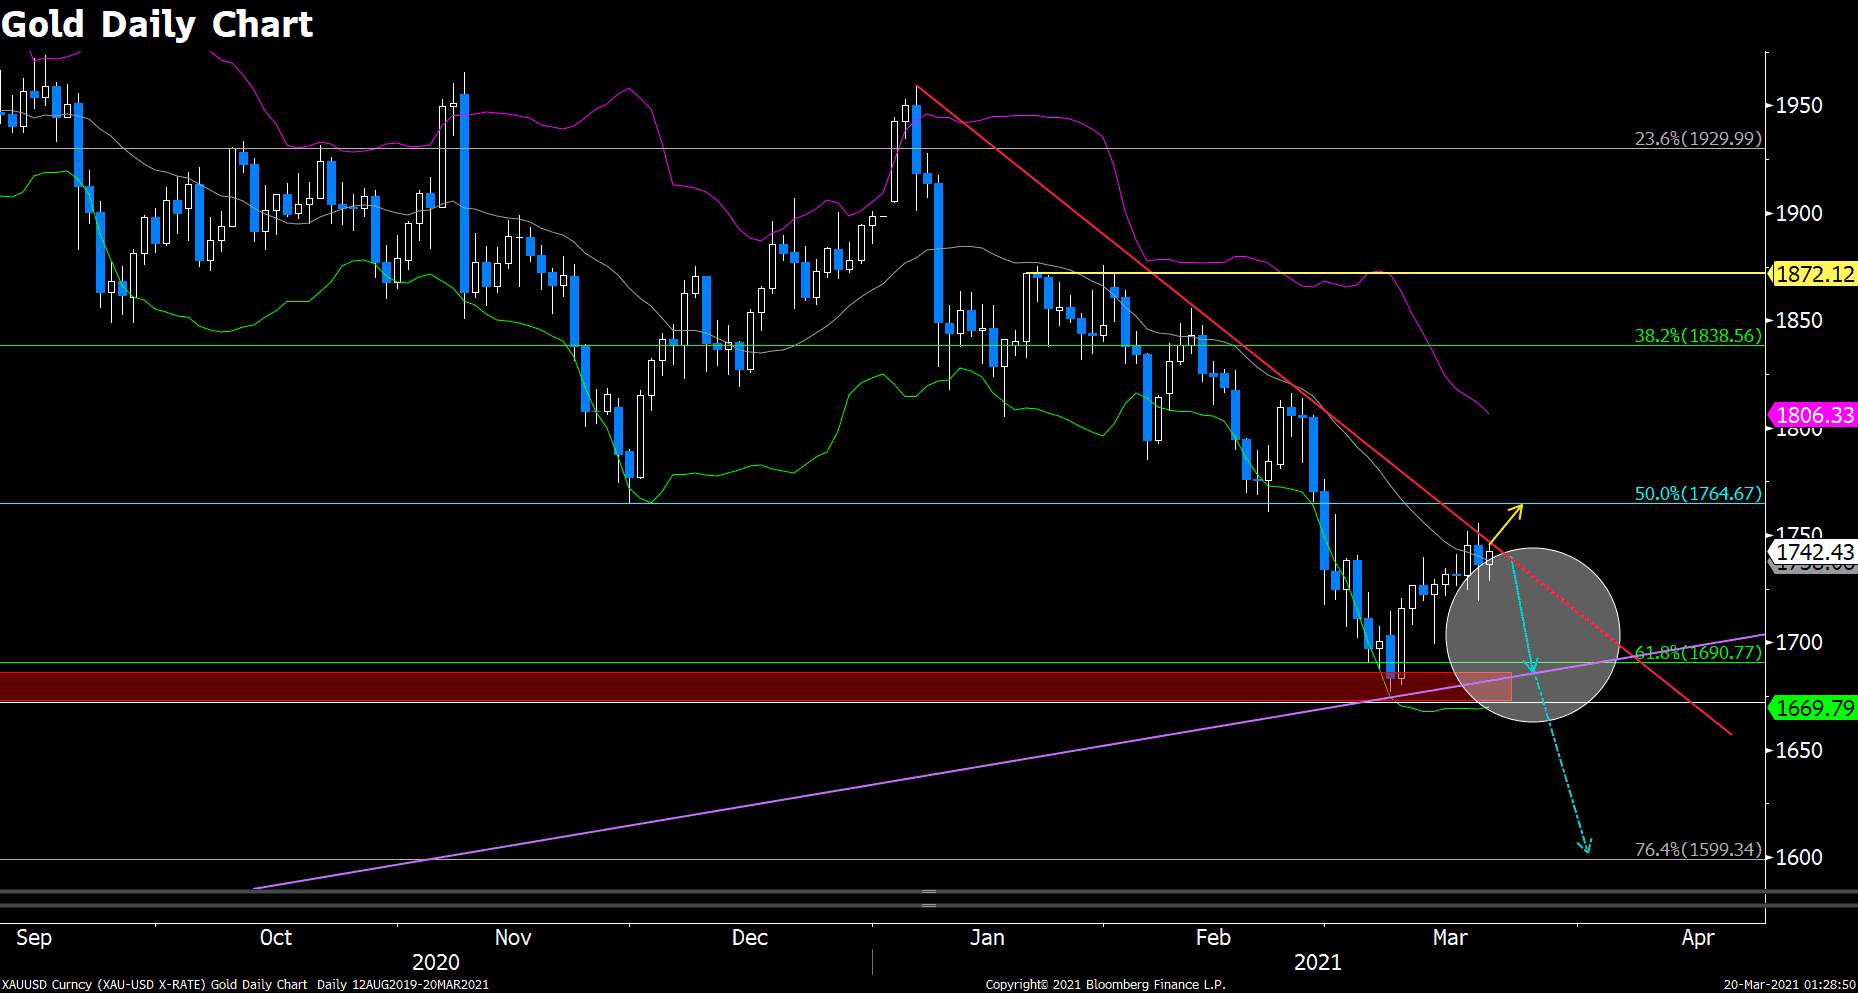
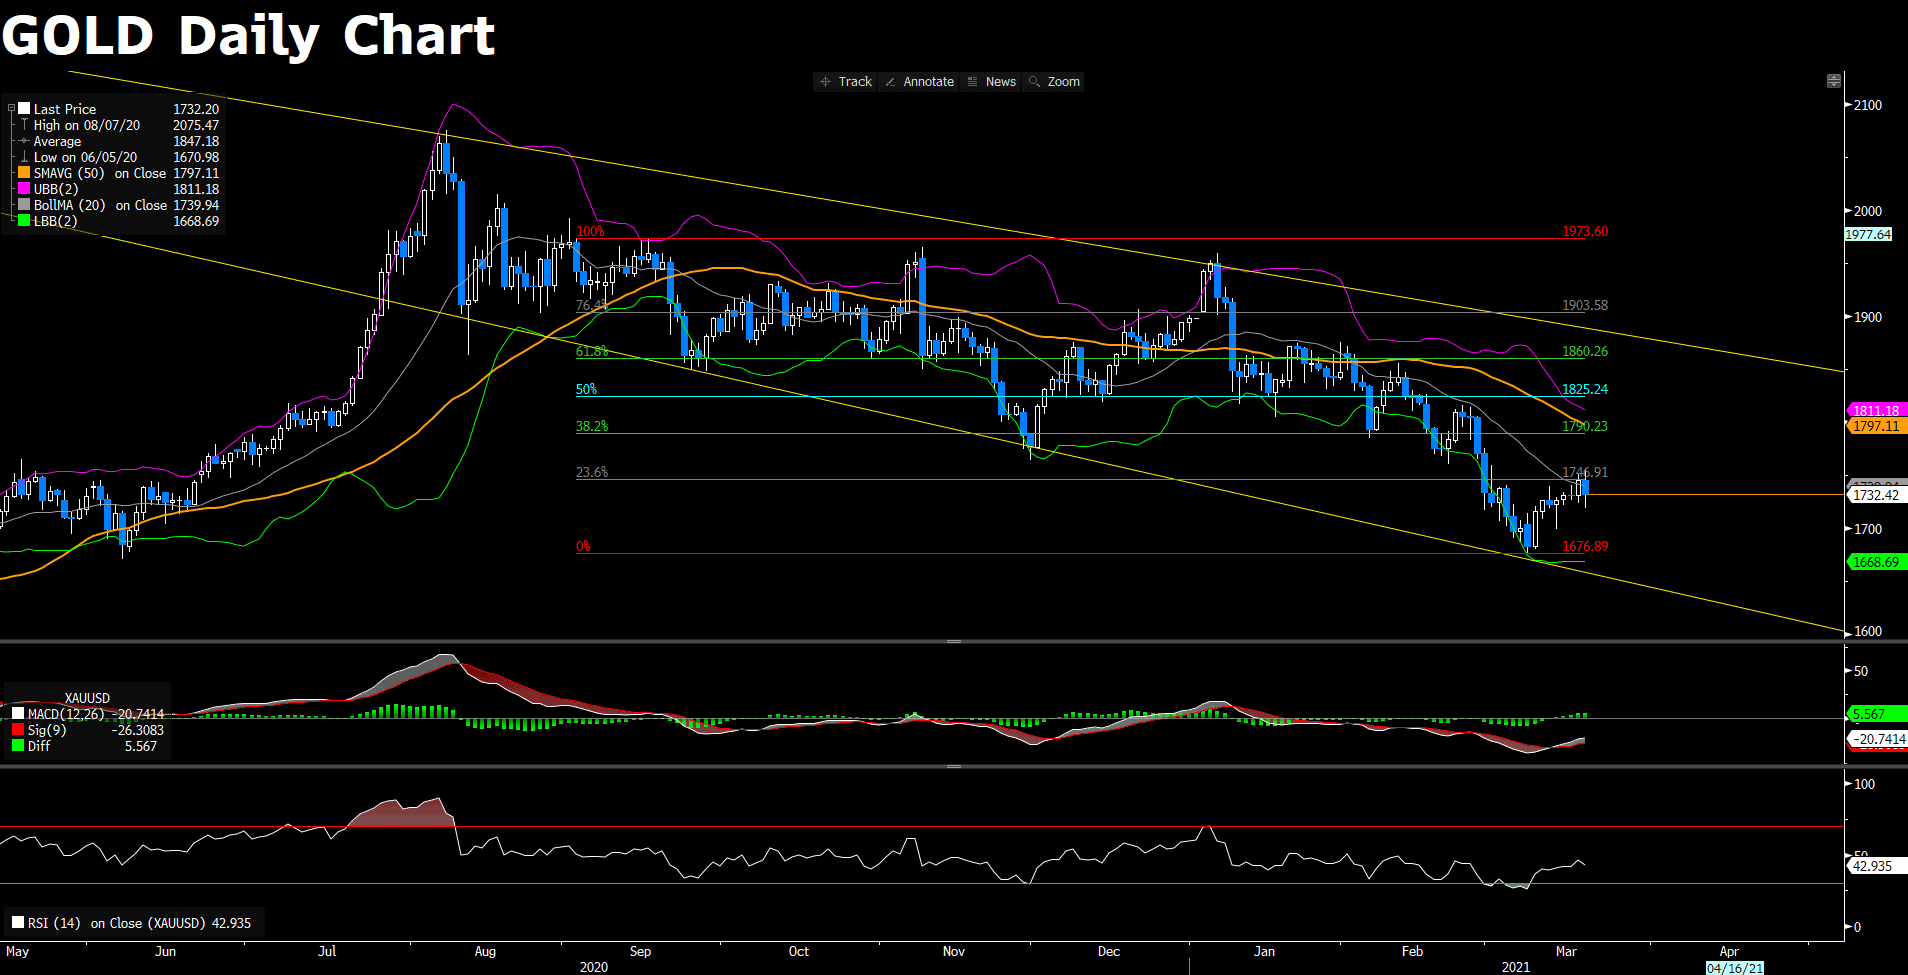
Gold is still constrained by a descending trendline, which is in line with our forecast. However, price seems to be sticky on the trendline, implying a deminishing pressure from this dynamic resistance. That being said, market may take a breather from recent exteme bearishness on precious metal thanks to Federal Reverse’s dovish tone on Wednesday, thus reviving risk-off tone. More observations are needed amid tentative market movement. If price manged to stand above the downward trendline, then it would look to contest 50% Fibonacci of $1765. Conversely, bearish bias would persist and accelerate if bulls fail to retake the driver seat.
Resistance: 1765, 1839
Support: 1691, 1670, 1600
Economic Data
|
Currency |
Data |
Time (TP) |
Forecast |
||||
|
USD |
Existing Home Sales (Feb) |
10:00 |
6.49M |
||||


 The Loonie hit the highest in two weeks, caused by a weak US dollar while investors’ appetite for rsikier assets that boosted commodities, such as oil, copper and gold. In the meanwhile, investors awaits for the speech on household spending from Bank of Canada Deputy Governor.