Daily Market Analysis
Market Focus
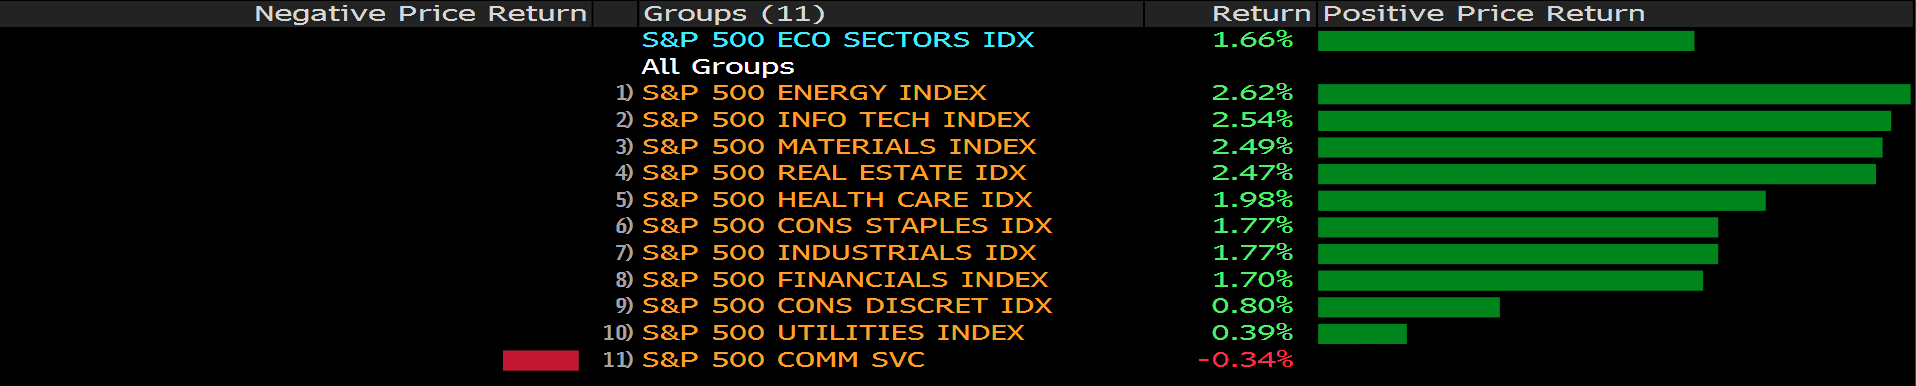
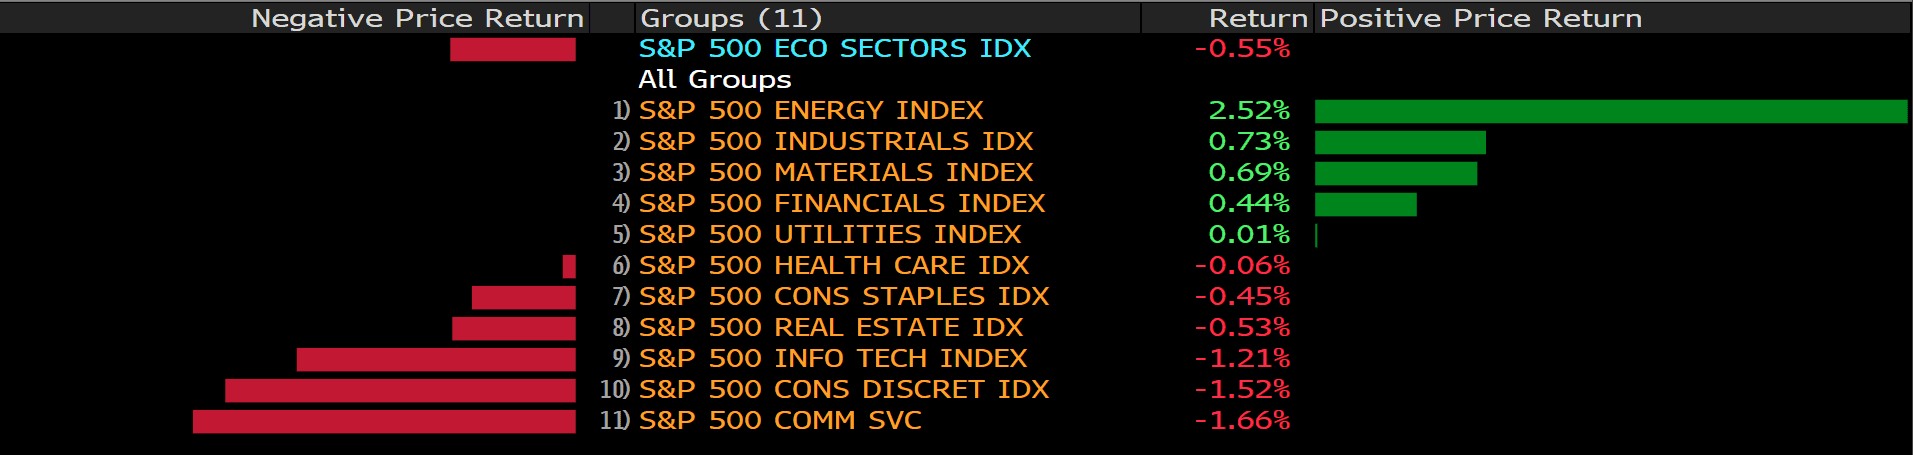
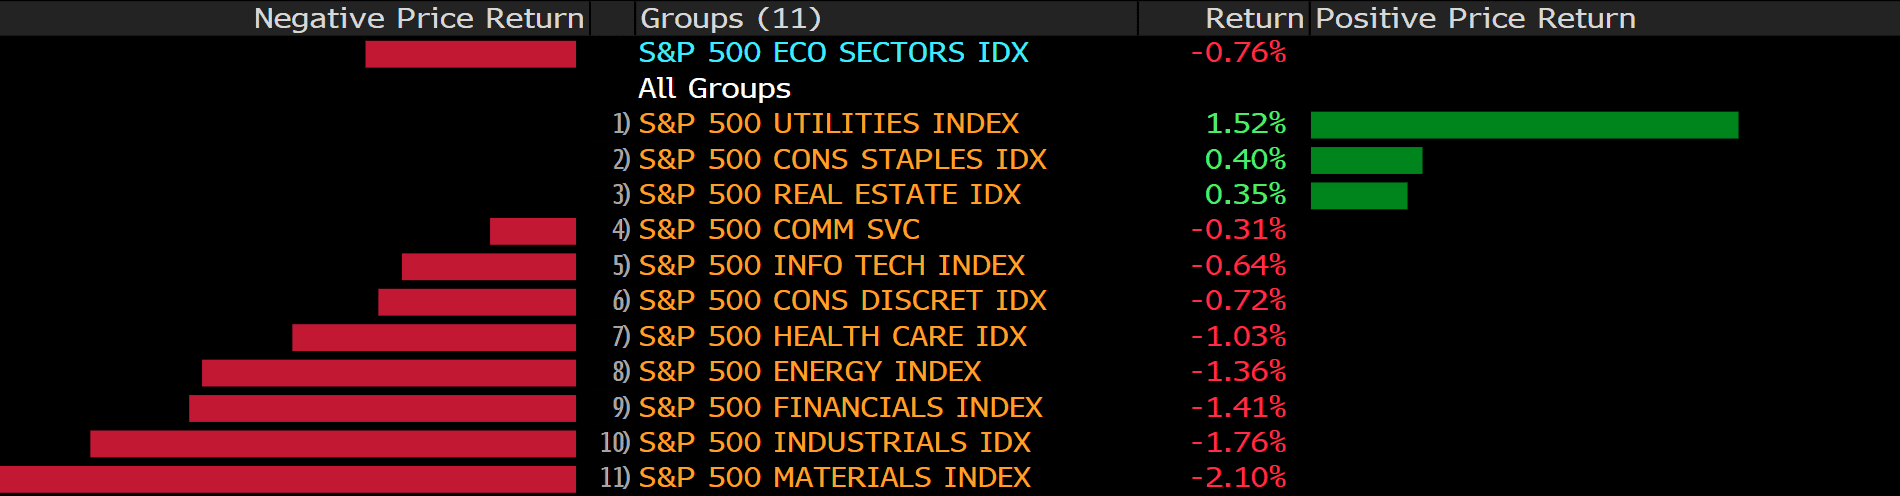
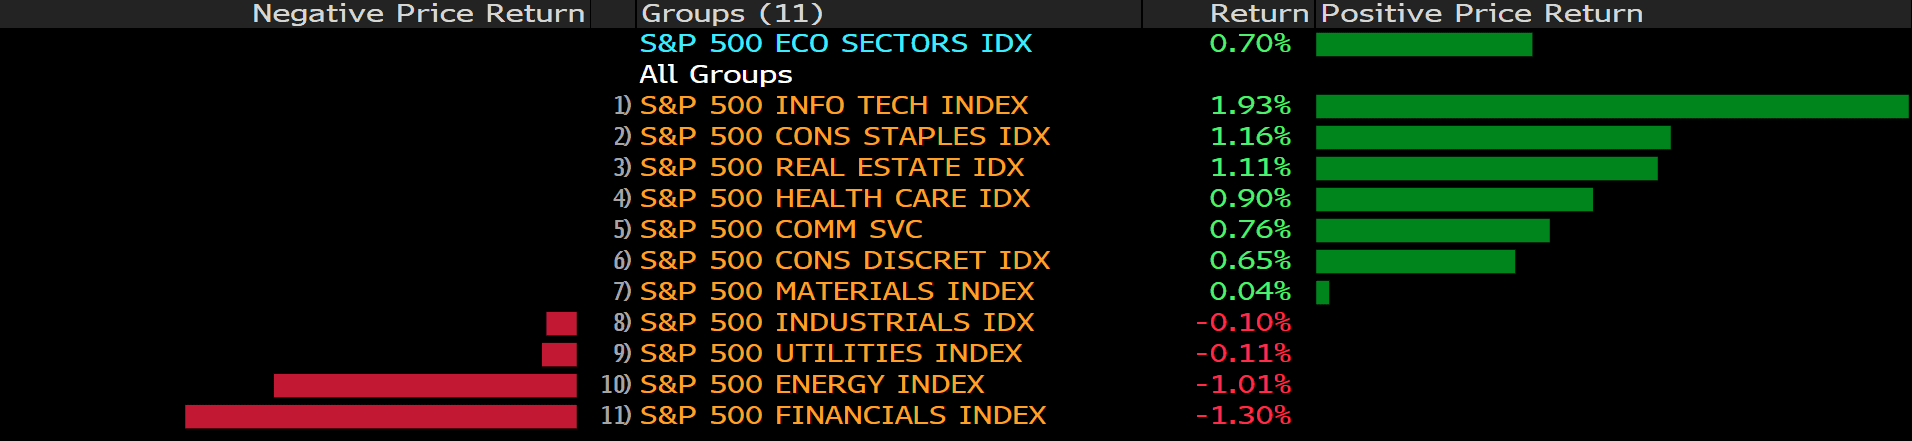
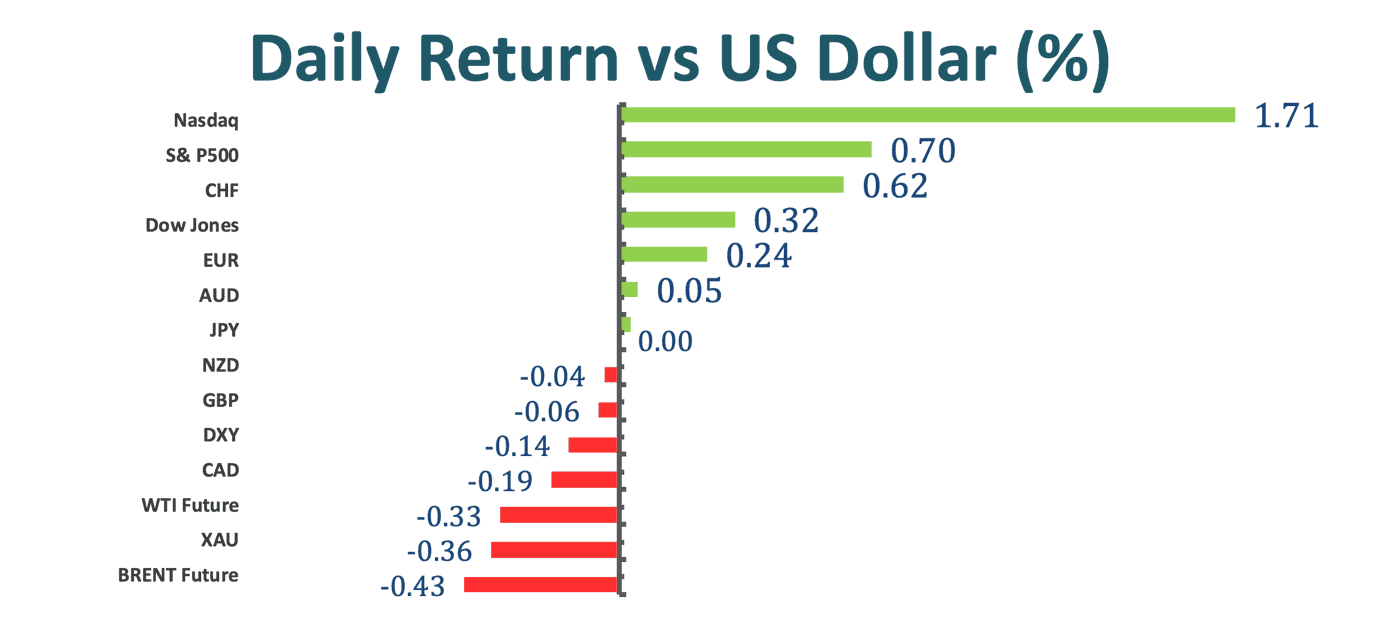
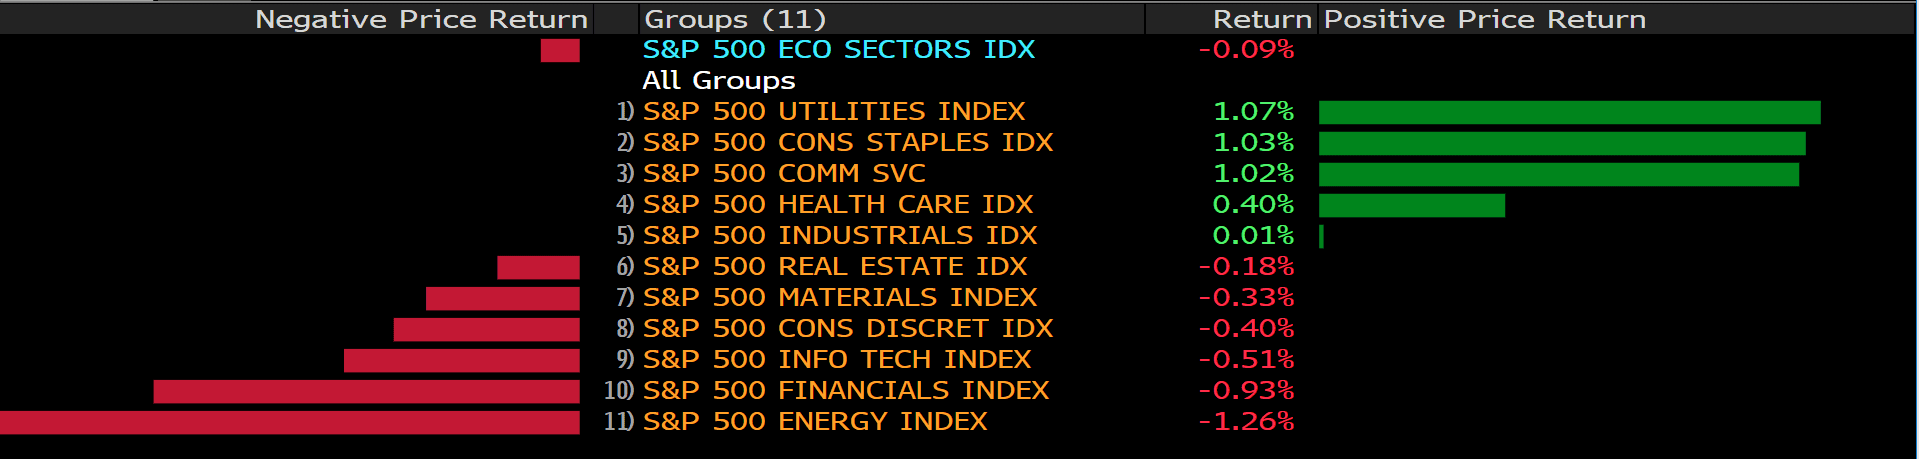
In earlier NY session, U.S. stocks dropped from record highs as investors weighed the potential fallout from forced block sales on the rest of Wall Street. Oil rose and Treasury yields climbed higher. The financials sector weighed on the benchmark S&P 500 for much of the day following revelations that banks including Goldman Sachs Group Inc. and Morgan Stanley liquidated holding in Bill Hwang’s family office Archegos Capital Management on Friday after he failed to meet margin calls. Boeing Co. lifted the Dow Jones Industrial Average to another all-time high after the aircraft maker announced a large order. The Nasdaq Composite finished in the red.
Stocks bounced off session lows Monday with tech and small caps lagging the Dow and S&P 500 as President Joe Biden announced 90% of U.S. adults will be eligible to get a Covid-19 vaccine in three weeks, marking April 19 as a new milestone in the vaccination push. New York state, the epicenter of the original virus outbreak, will expand vaccine eligibility to those 30 and older starting on April6, according to the governor’s office.
On the other hands, the S&P 500 is edging higher, reversing its earlier losses, after traders said a series of buy programs moved through. Tech is continuing to broadly weigh on the market, with the Nasdaq 100 still in the red whilst market close nearby. Ther exception is big tech, as the NYFANG+ index is putting in a strong performance with Facebook, Apple, Amazon and Google all climbing.
Market Wrap
Main Pairs Movement
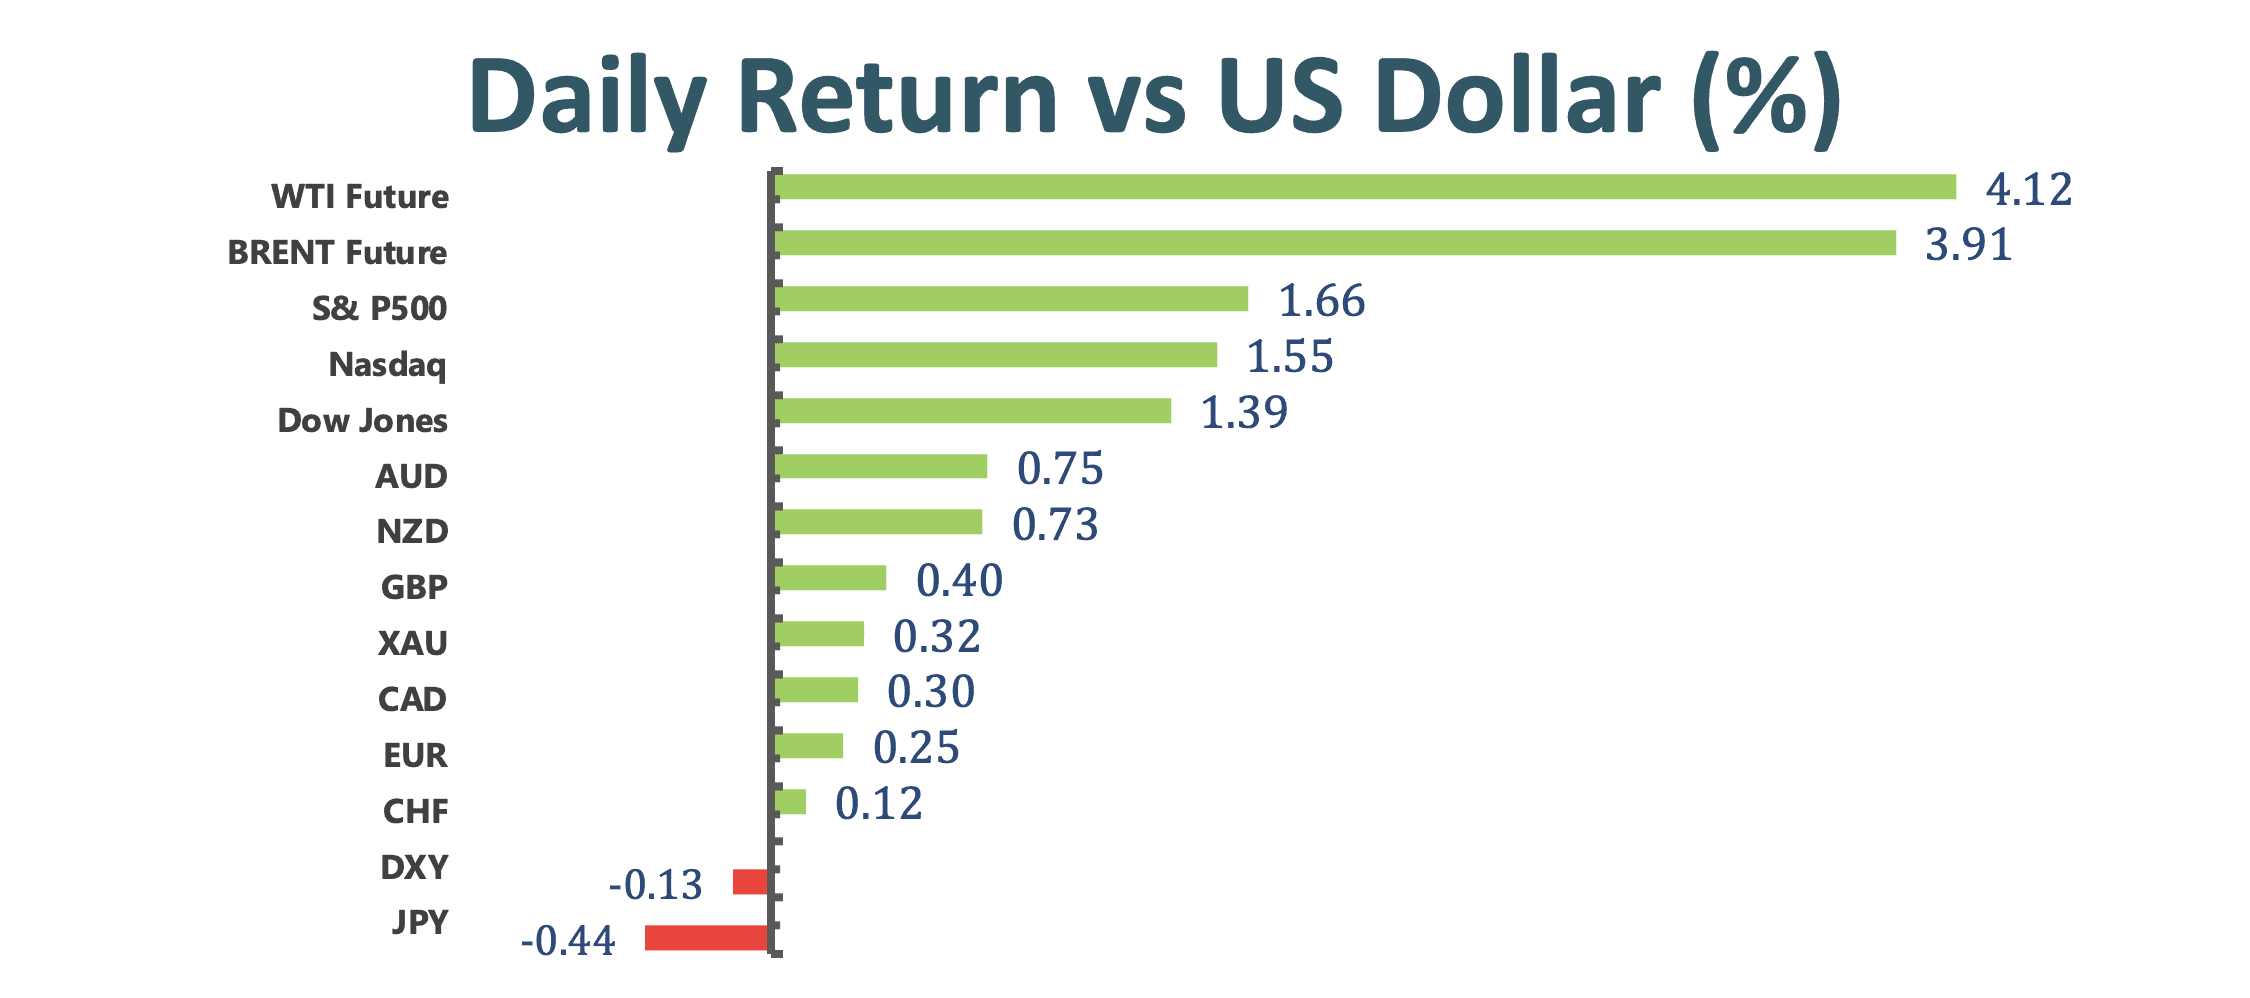
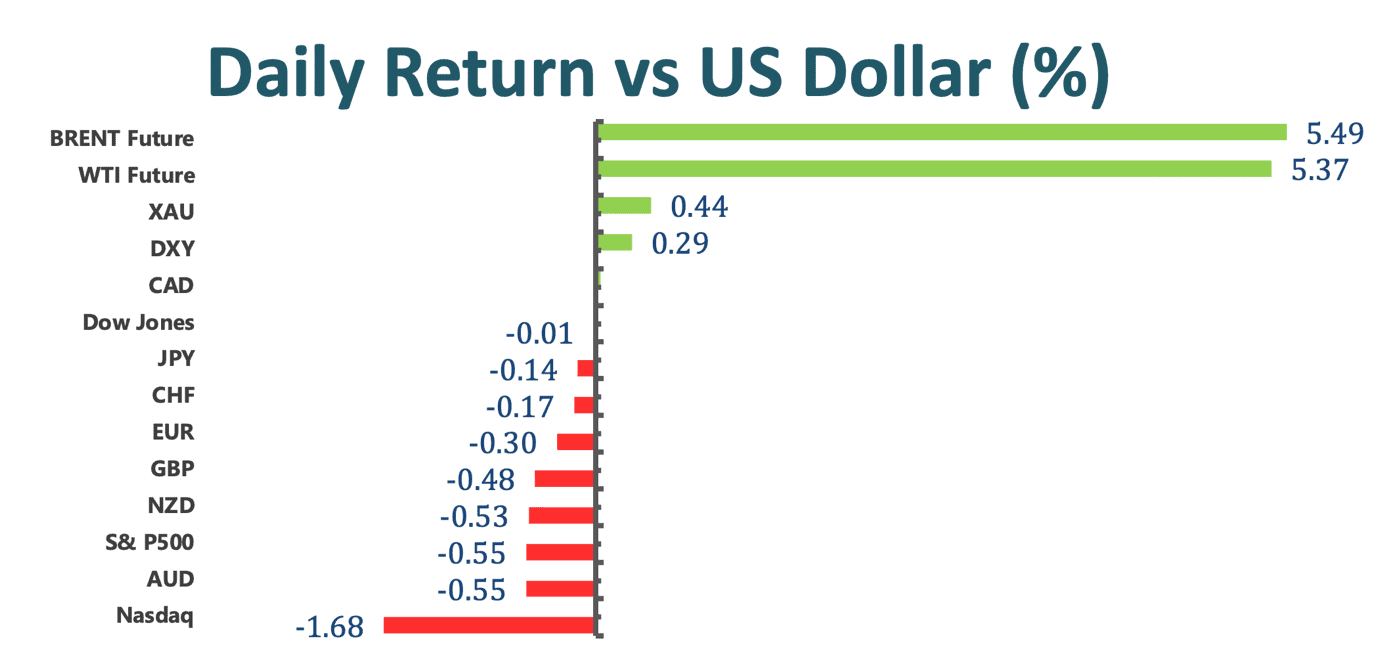
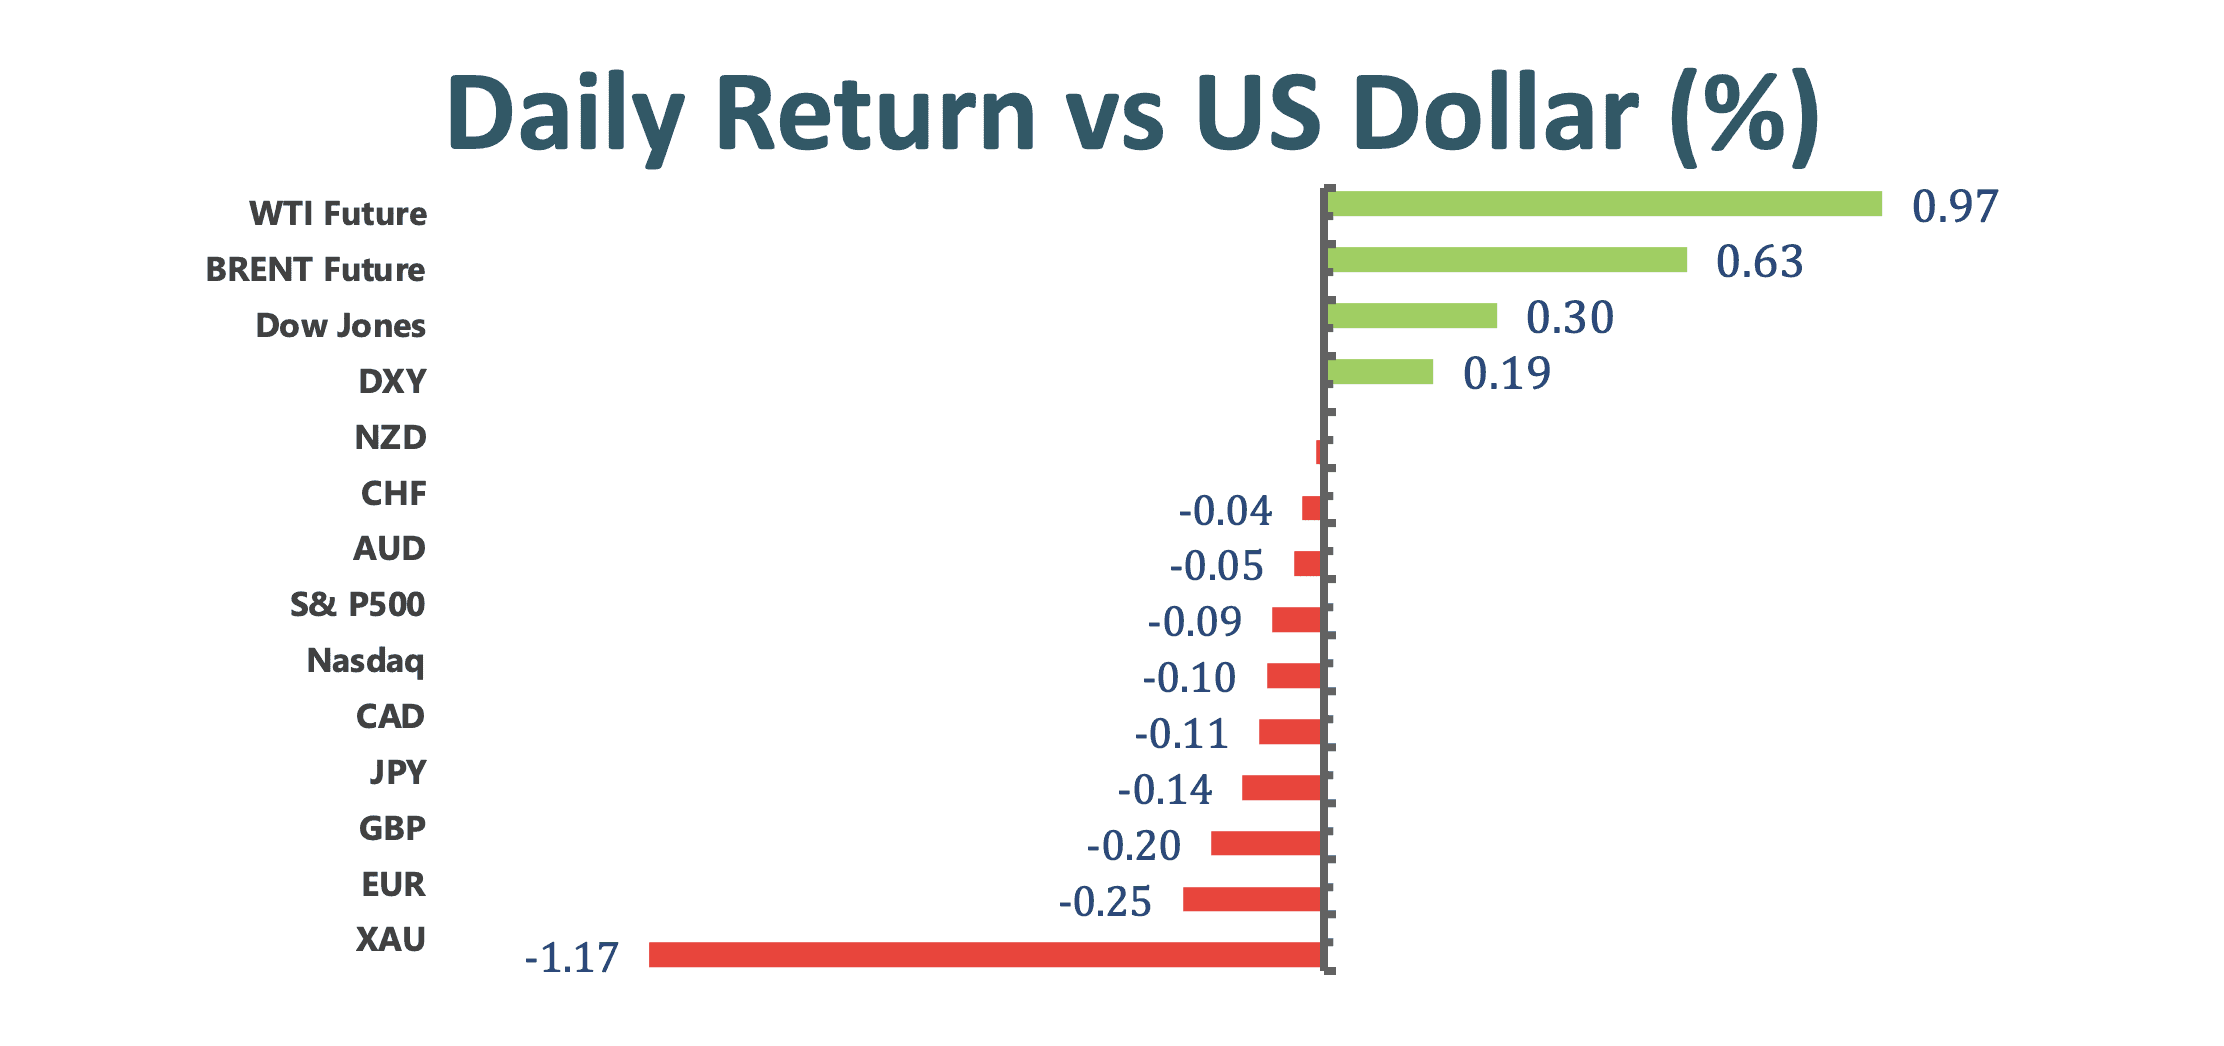
West Texas intermediate crude swung between gains and losses before turning higher. Trades focused on the demand impact of renewed coronavirus lockdowns before the OPEC+ policy discussions on Thursday. Meanwhile, the Ever Given was freed to allow the reopening of the Suez Canal. Elsewhere, Bitcoin headed for the biggest one-day gain in two weeks.
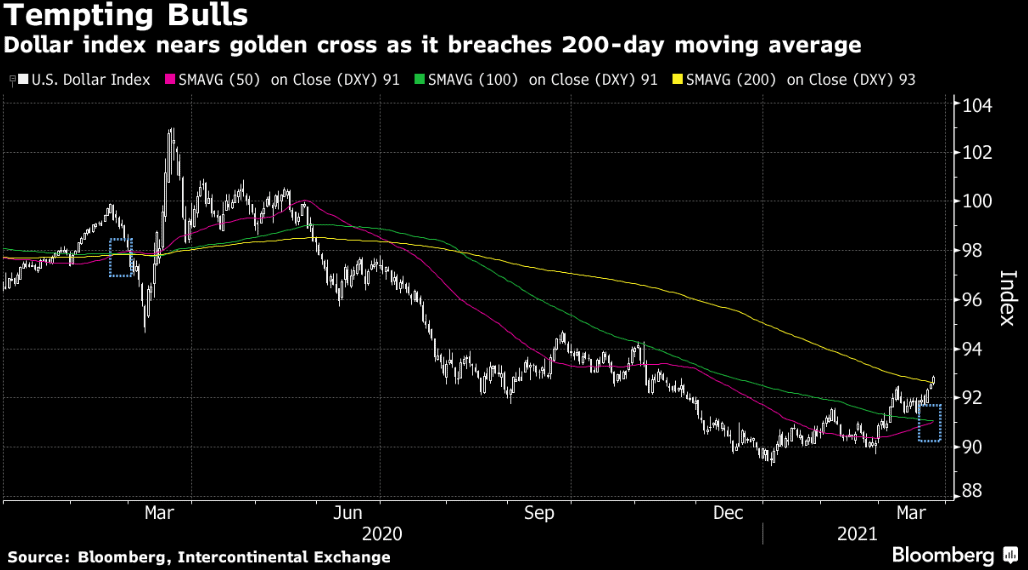
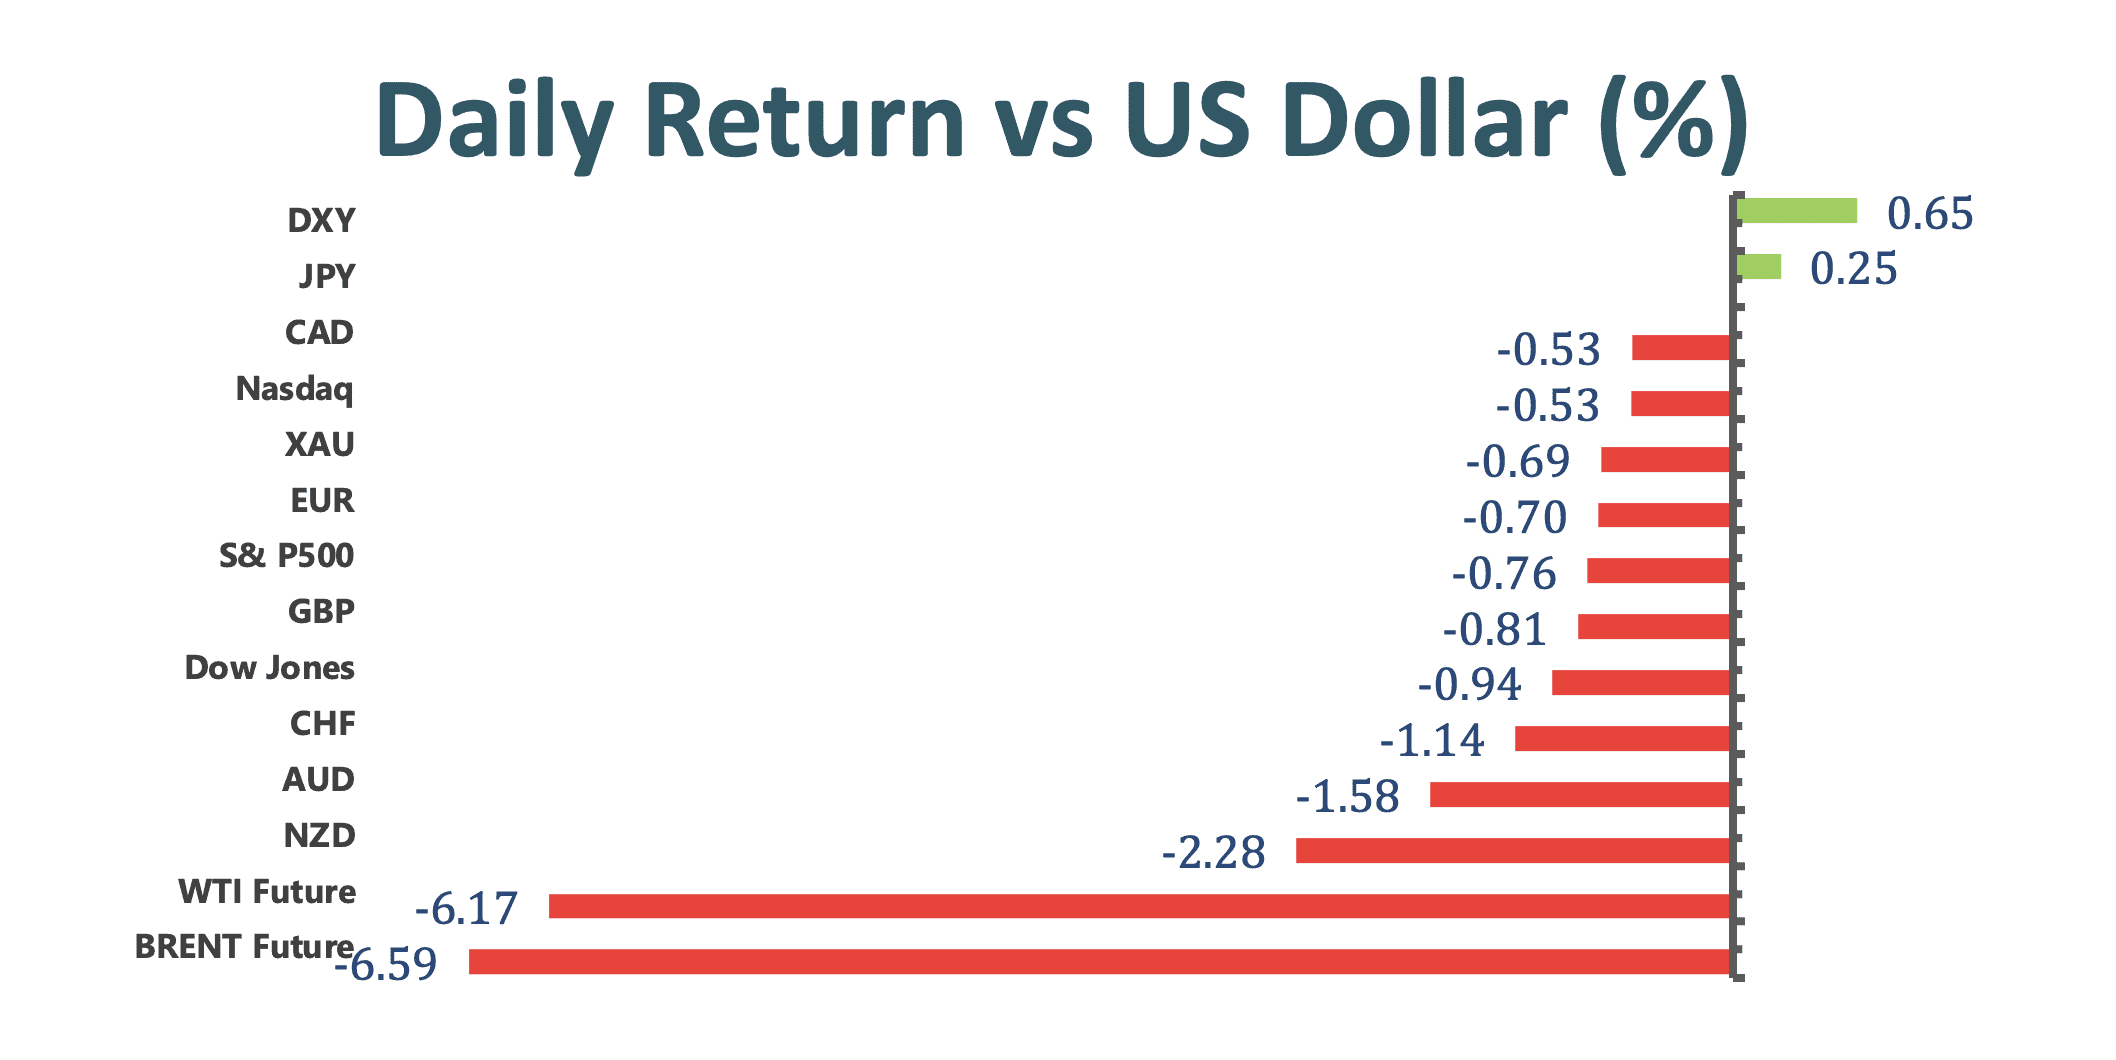
On FX side, the dollar pared gains amid improving risk sentiment as shipping traffic started moving in the Suez Canal and investors looked toward U.S. President Joe Biden unveiling an infrastructure and jobs plan this week.
Greenback is still higher on the day as Treasury yields climbed and gold slumped the most in about two weeks. Of course, greenback optimistic movement amid U.S.’s rapid vaccine roll-out program and in expectations around stimulus. According to trader, greenback gains emerge even as one rebalancing model has shifted to a USD sell signal across currencies.
Technical Analysis:
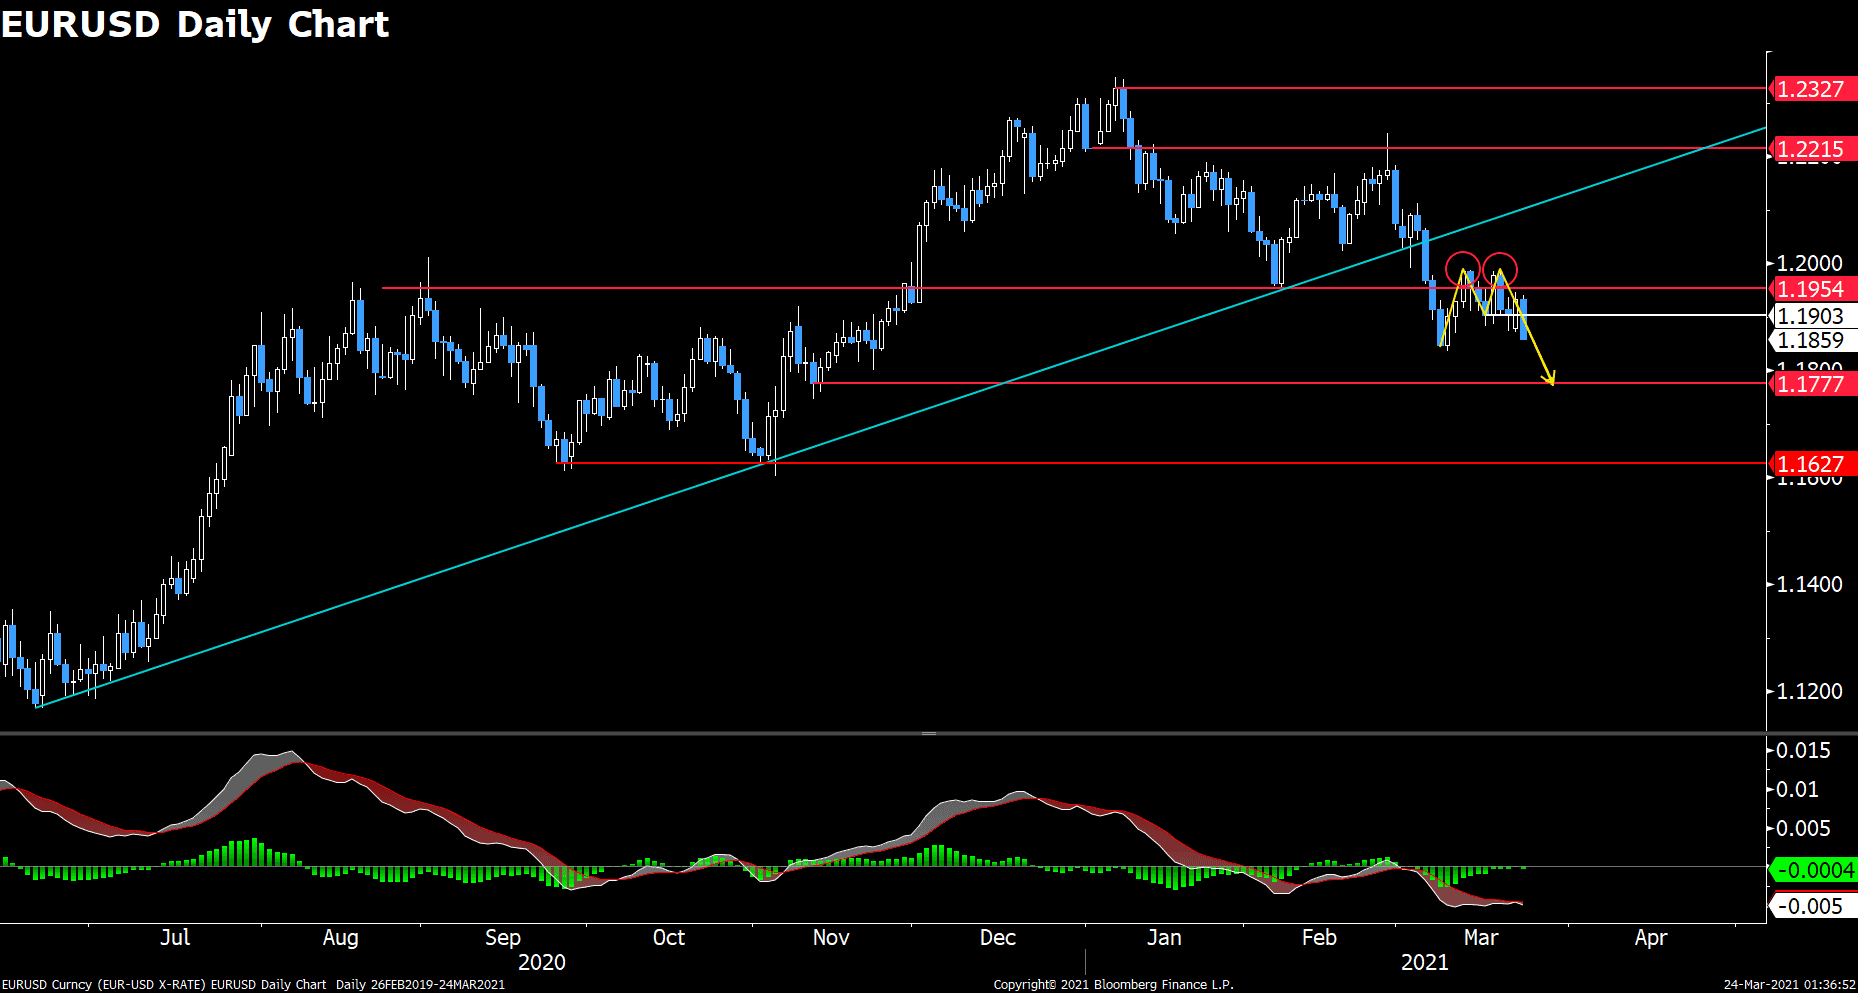
EURUSD (Daily Chart)
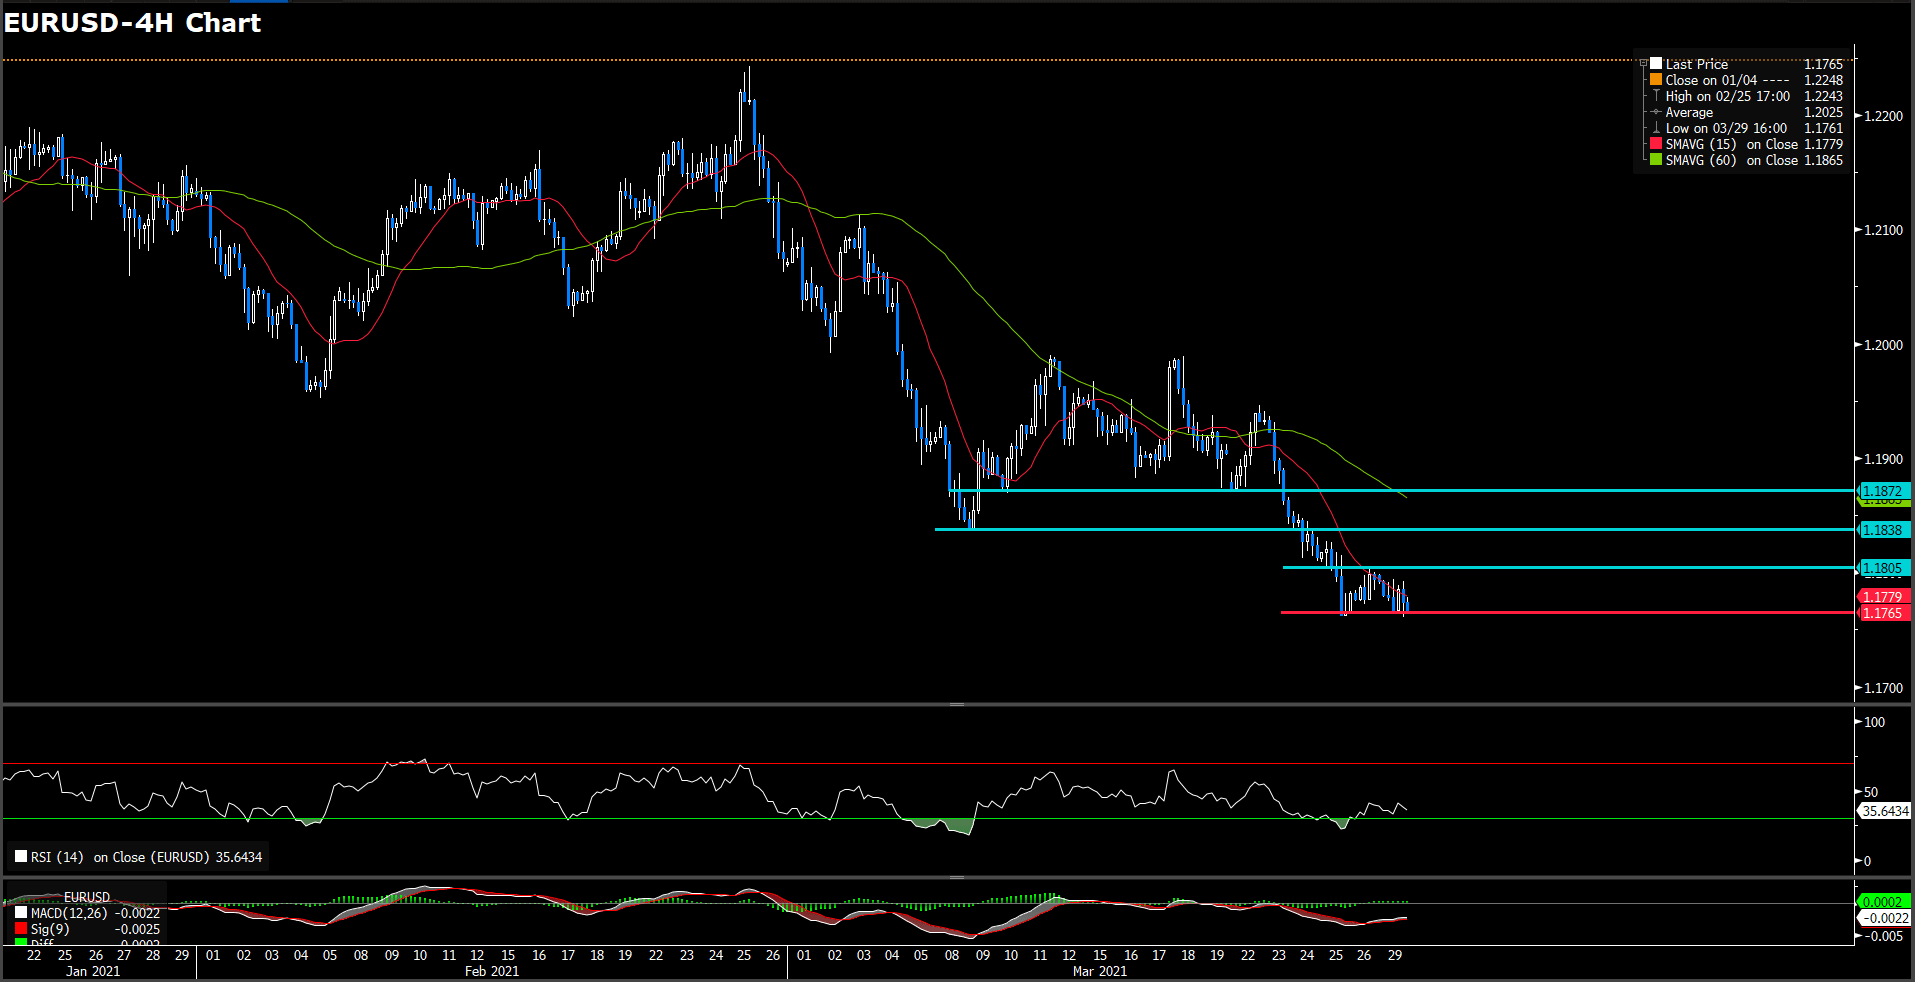
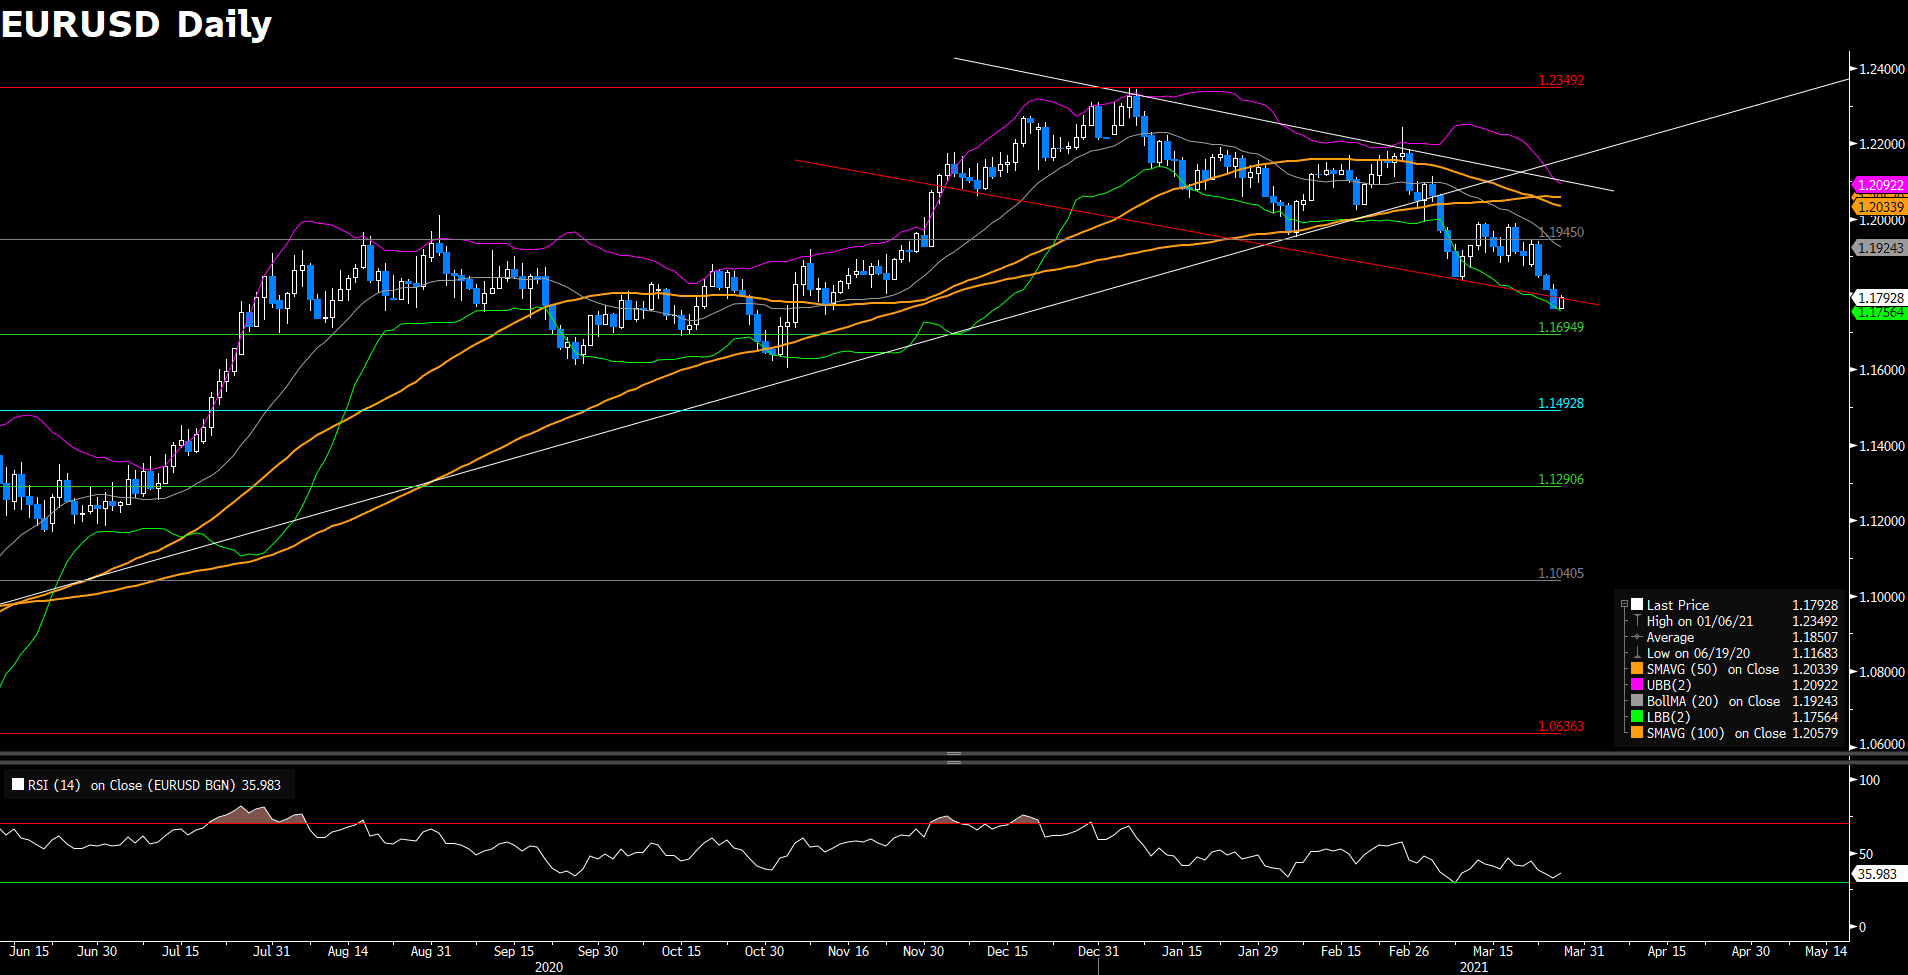
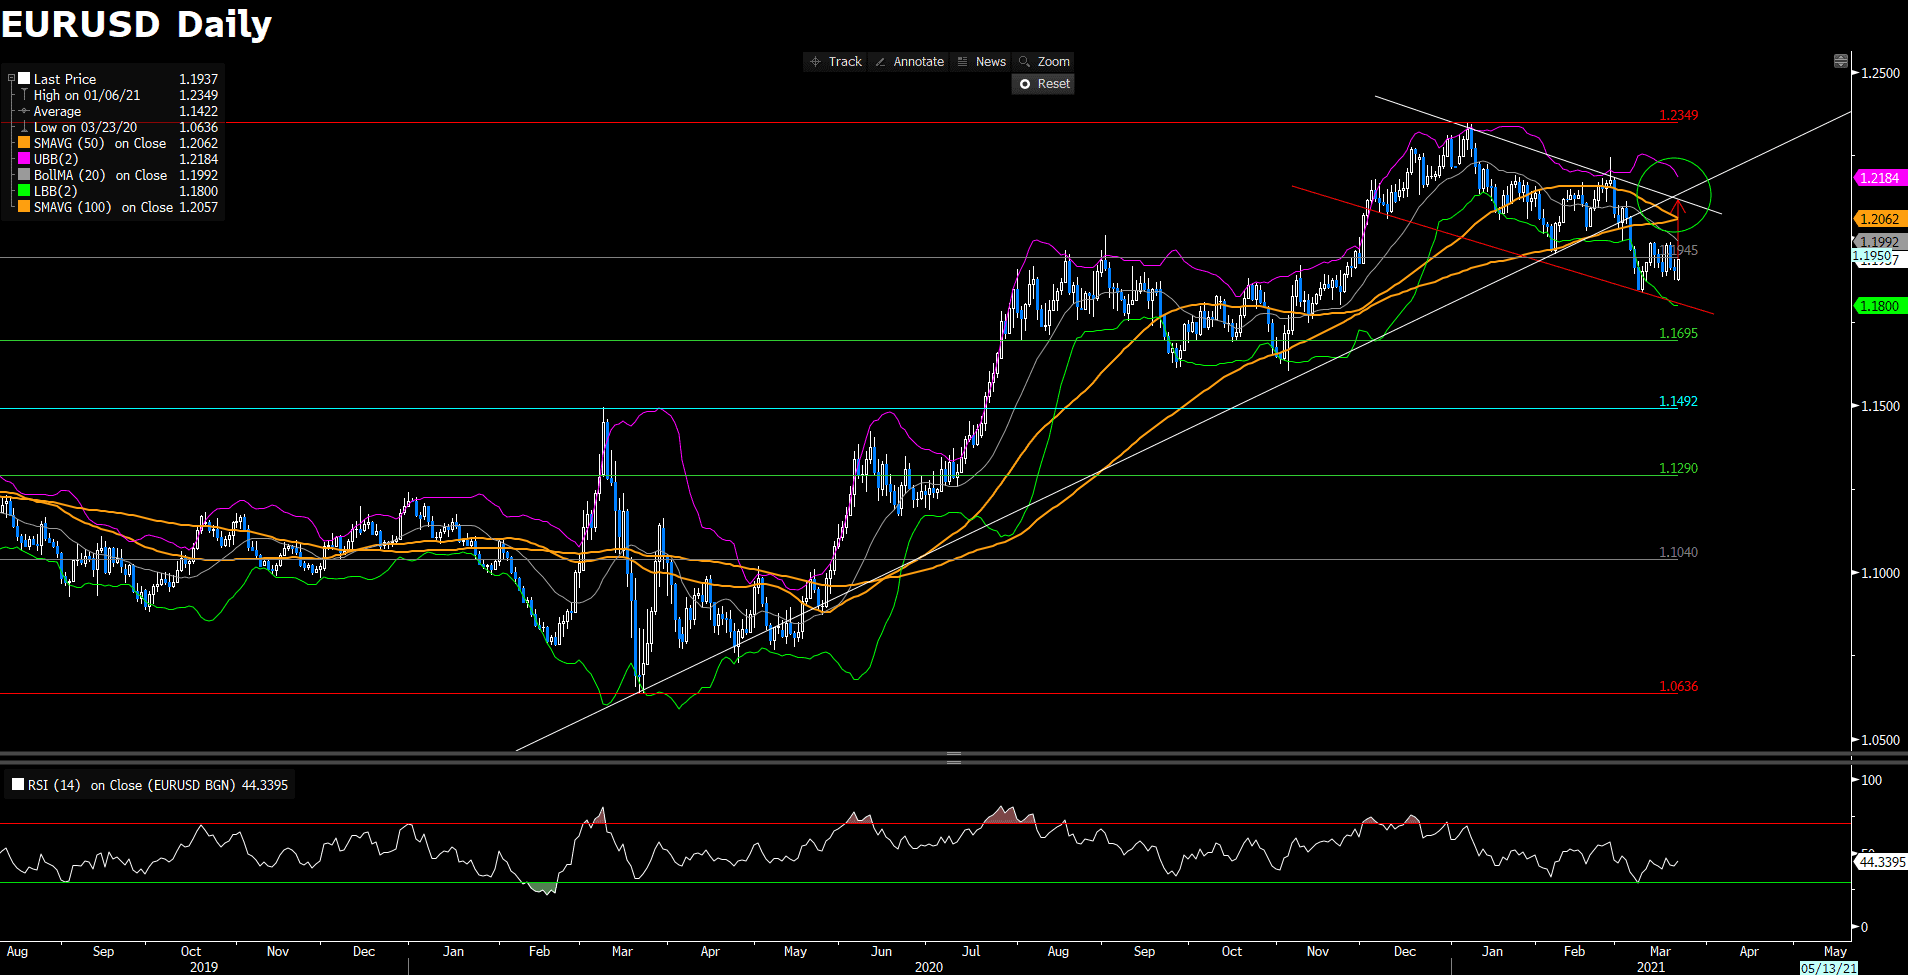
Euro dollar setted another boring down move after dollar consecutively went high. Euro dollar still under 1.18 then holding at 1.1765 level for recently low bound support and seemingly without remarkable price gathering support for further downside. On the other hands, both 15 and 60-long SMAs remaining down trend whilst RSI indictor is paltry above 30 figures, which suggest a selling mode, implying further bearish momentum ahead at list for short-run, we believe.
On the slid way, we foresee currently price level, 1.1765, would be a pivotal support for bullish favored. In the light of lacking supportive level in downside, if price tamp down currently level, we see price will get out of hands to further lower position.
Resistance: 1.1805, 1.1838, 1.1872
Support: 1.1765
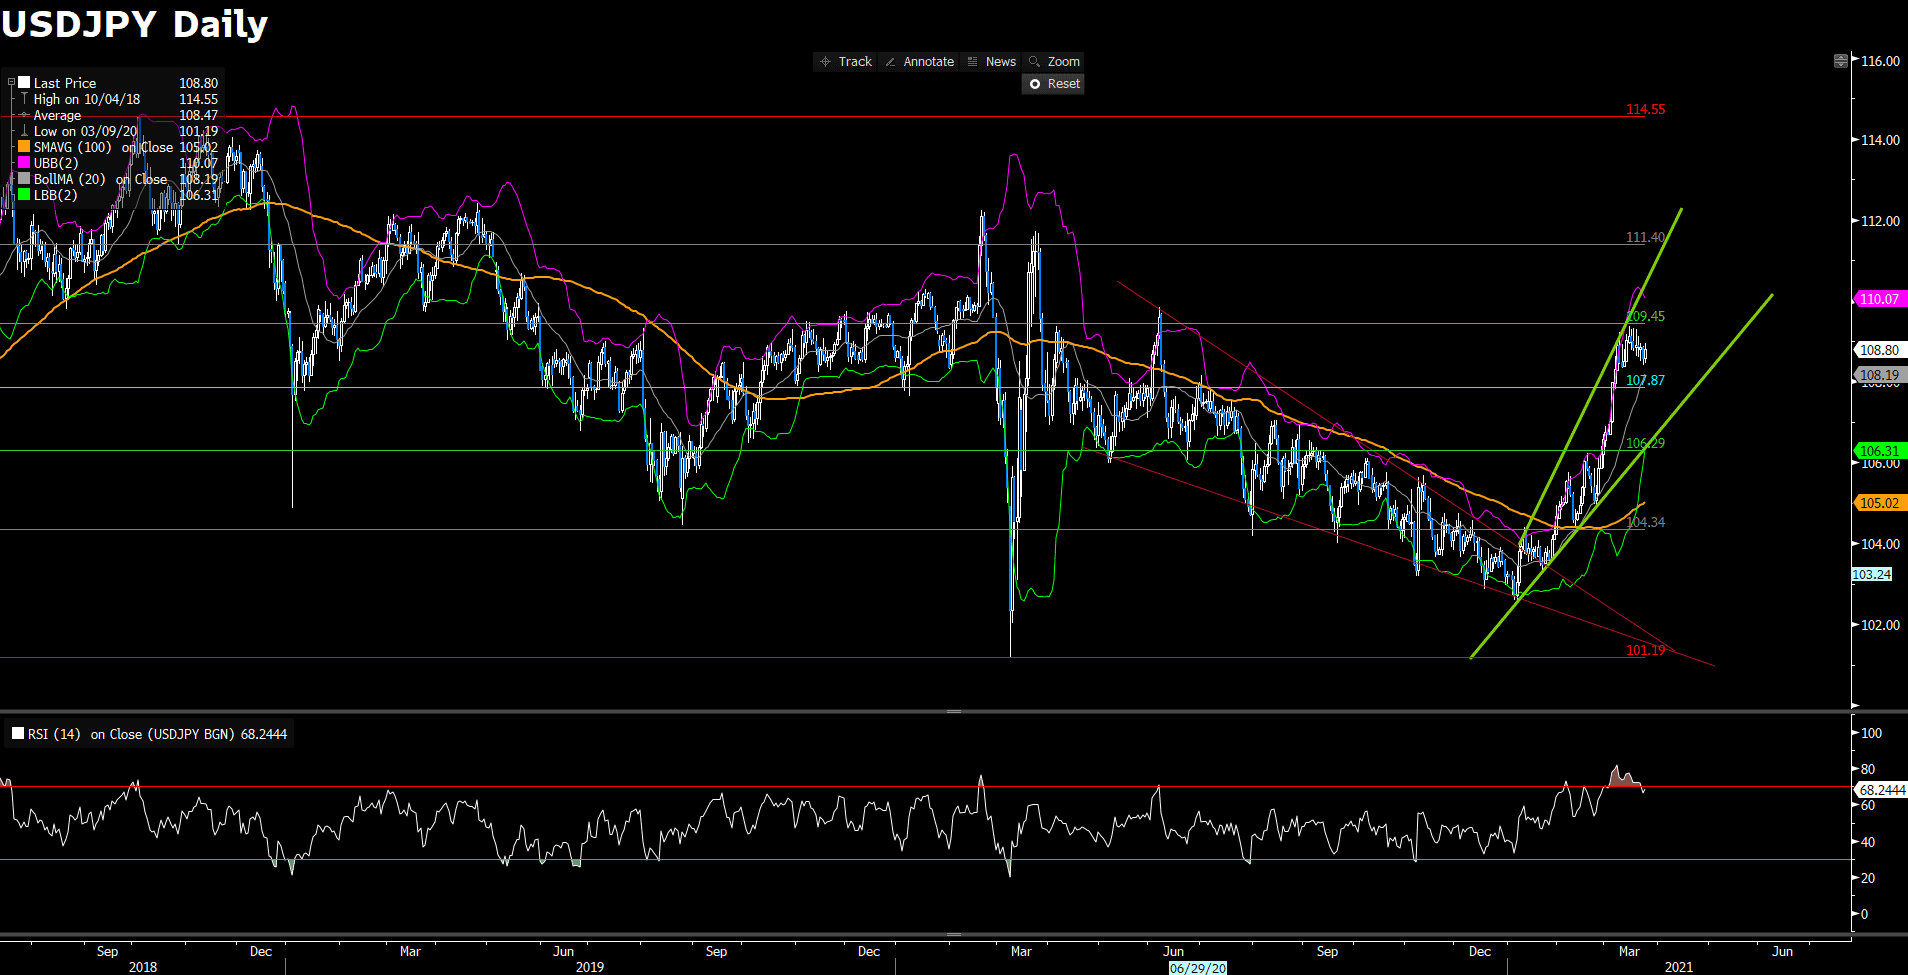
USDJPY (Daily Chart)

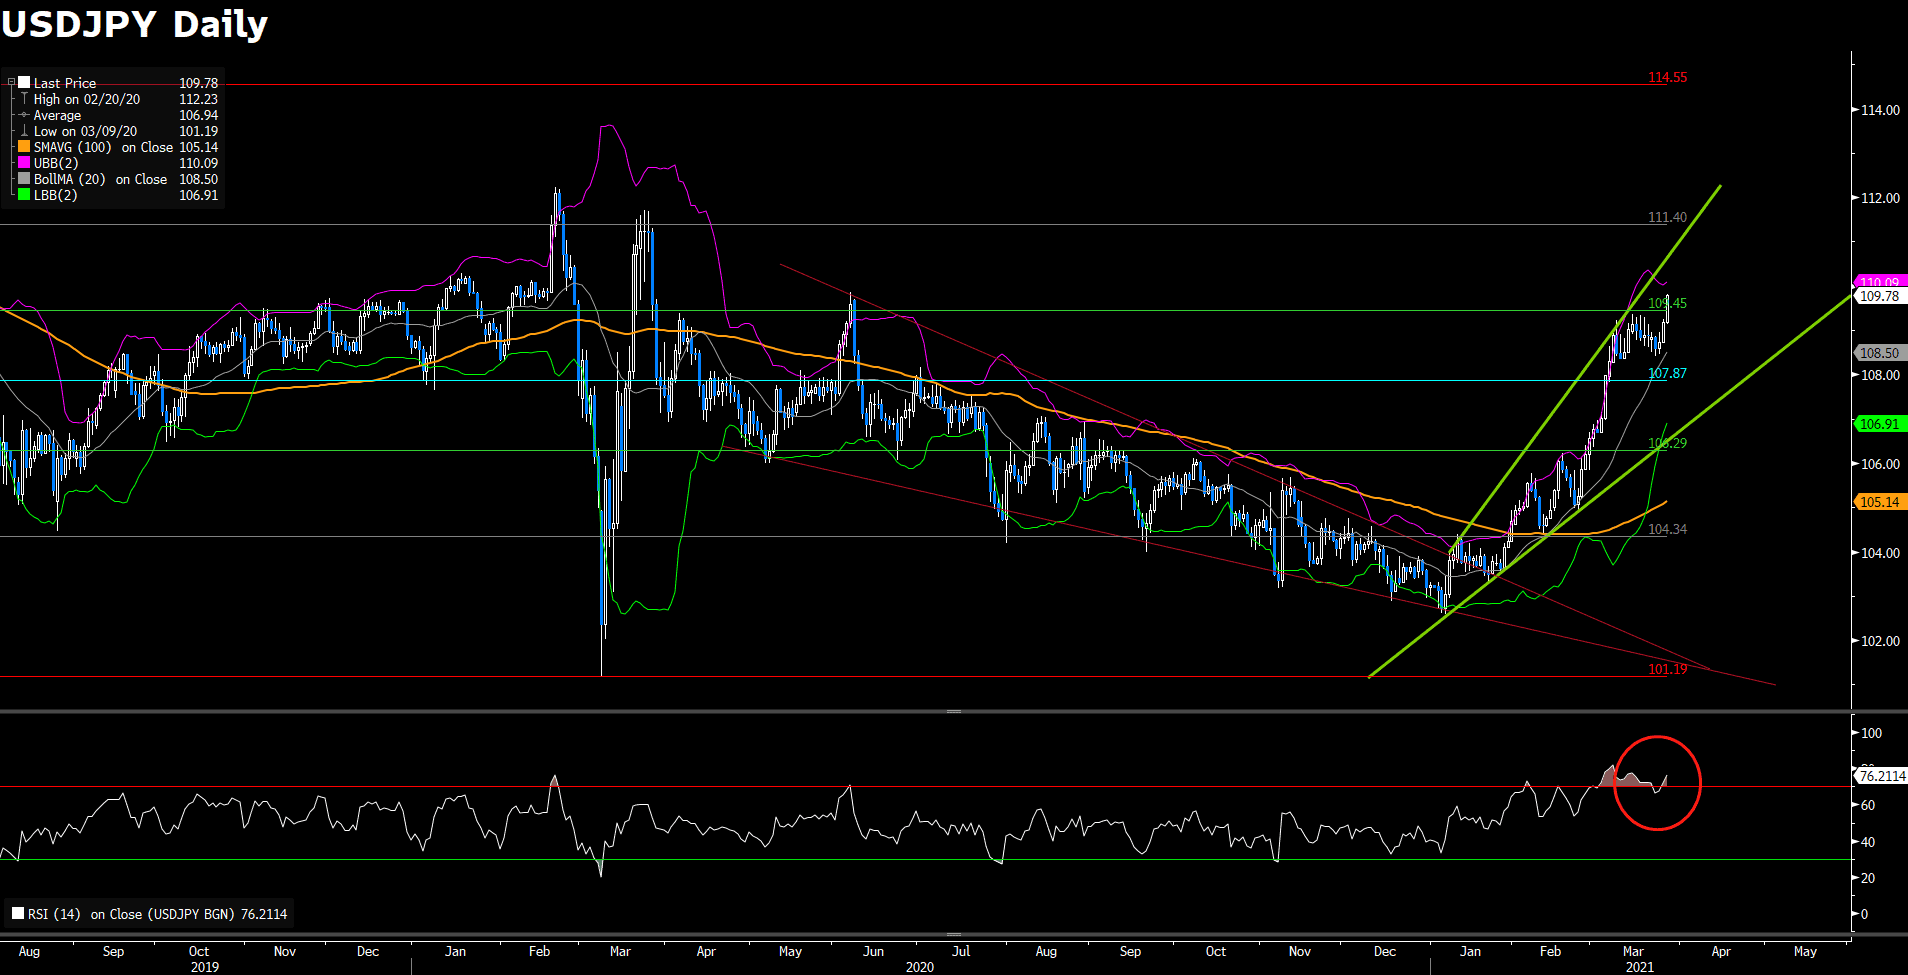
After breakthrough a cosolidation range in 108.37 to 109.24, yen seems accelerate the edging momentum then currently trading at 109.82, seesion peak nearing the highest level in a year. Other persuasive phenomenon for uptrend, 15-long SMAs have golden cross the 60-long SMAs that given a powerful upward momemtum guidance. Meanwhile, RSI indicator set at 68.82 figure, suggesting a optimistic downwind trend ahead.
On surge way, we could not find out there has other barricades ahead once it penetrate upon price cluster. However, yen have been through a dark winter, a 5.9% year-to-date declined. Since, we believe the posiblity for edge up still quite high by combing stance aforementioned, but amplitude could be limited.
Resistance: 109.82
Support: 109.47, 109.24, 108.37
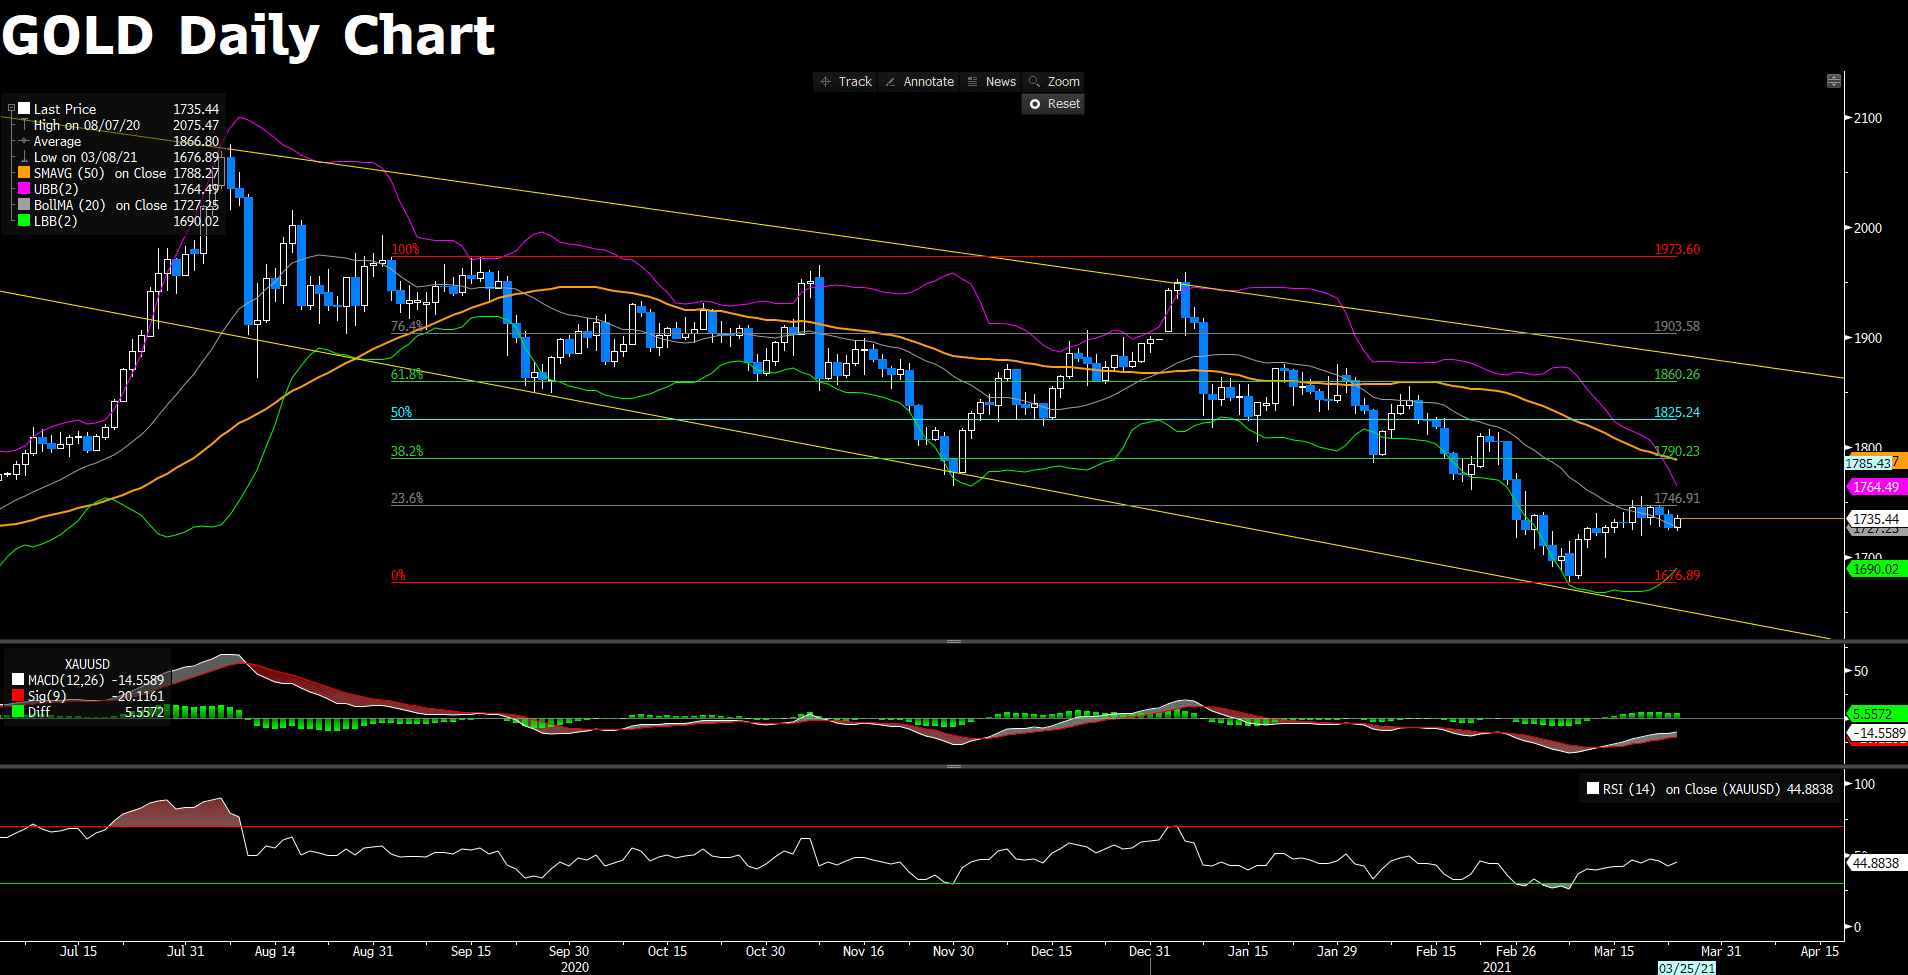
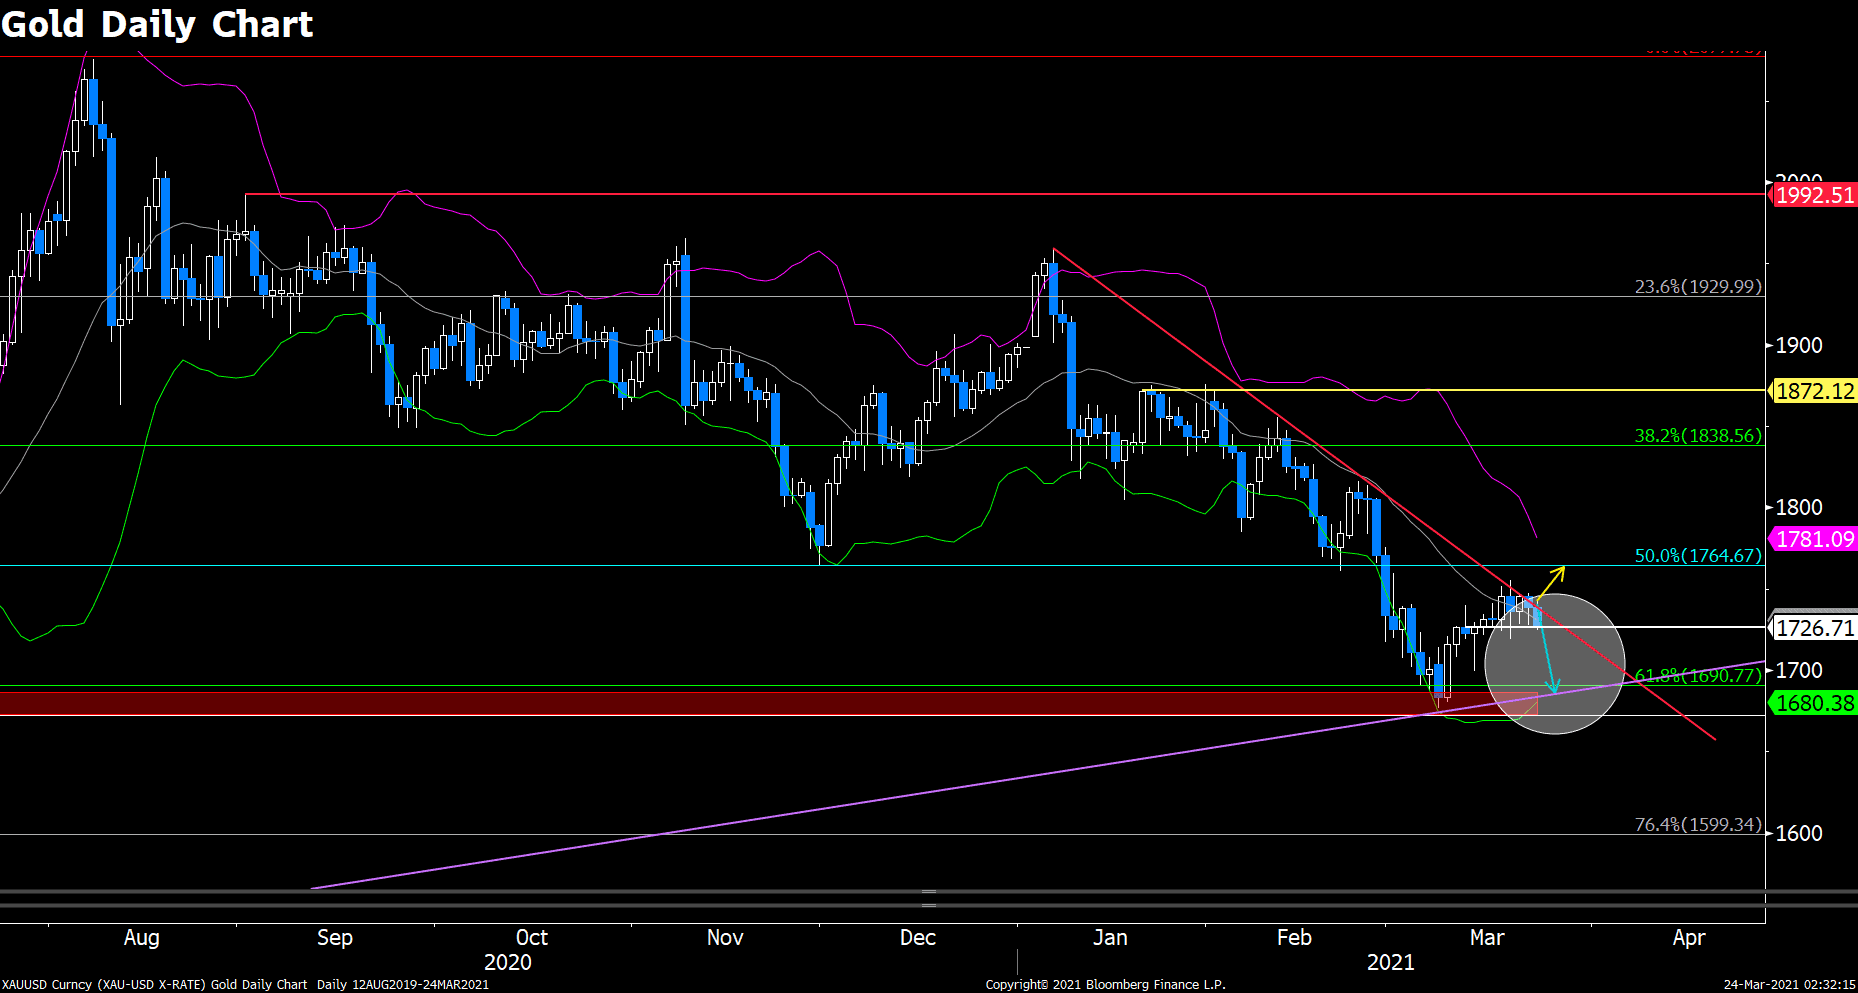
XAUUSD (Daily Chart)

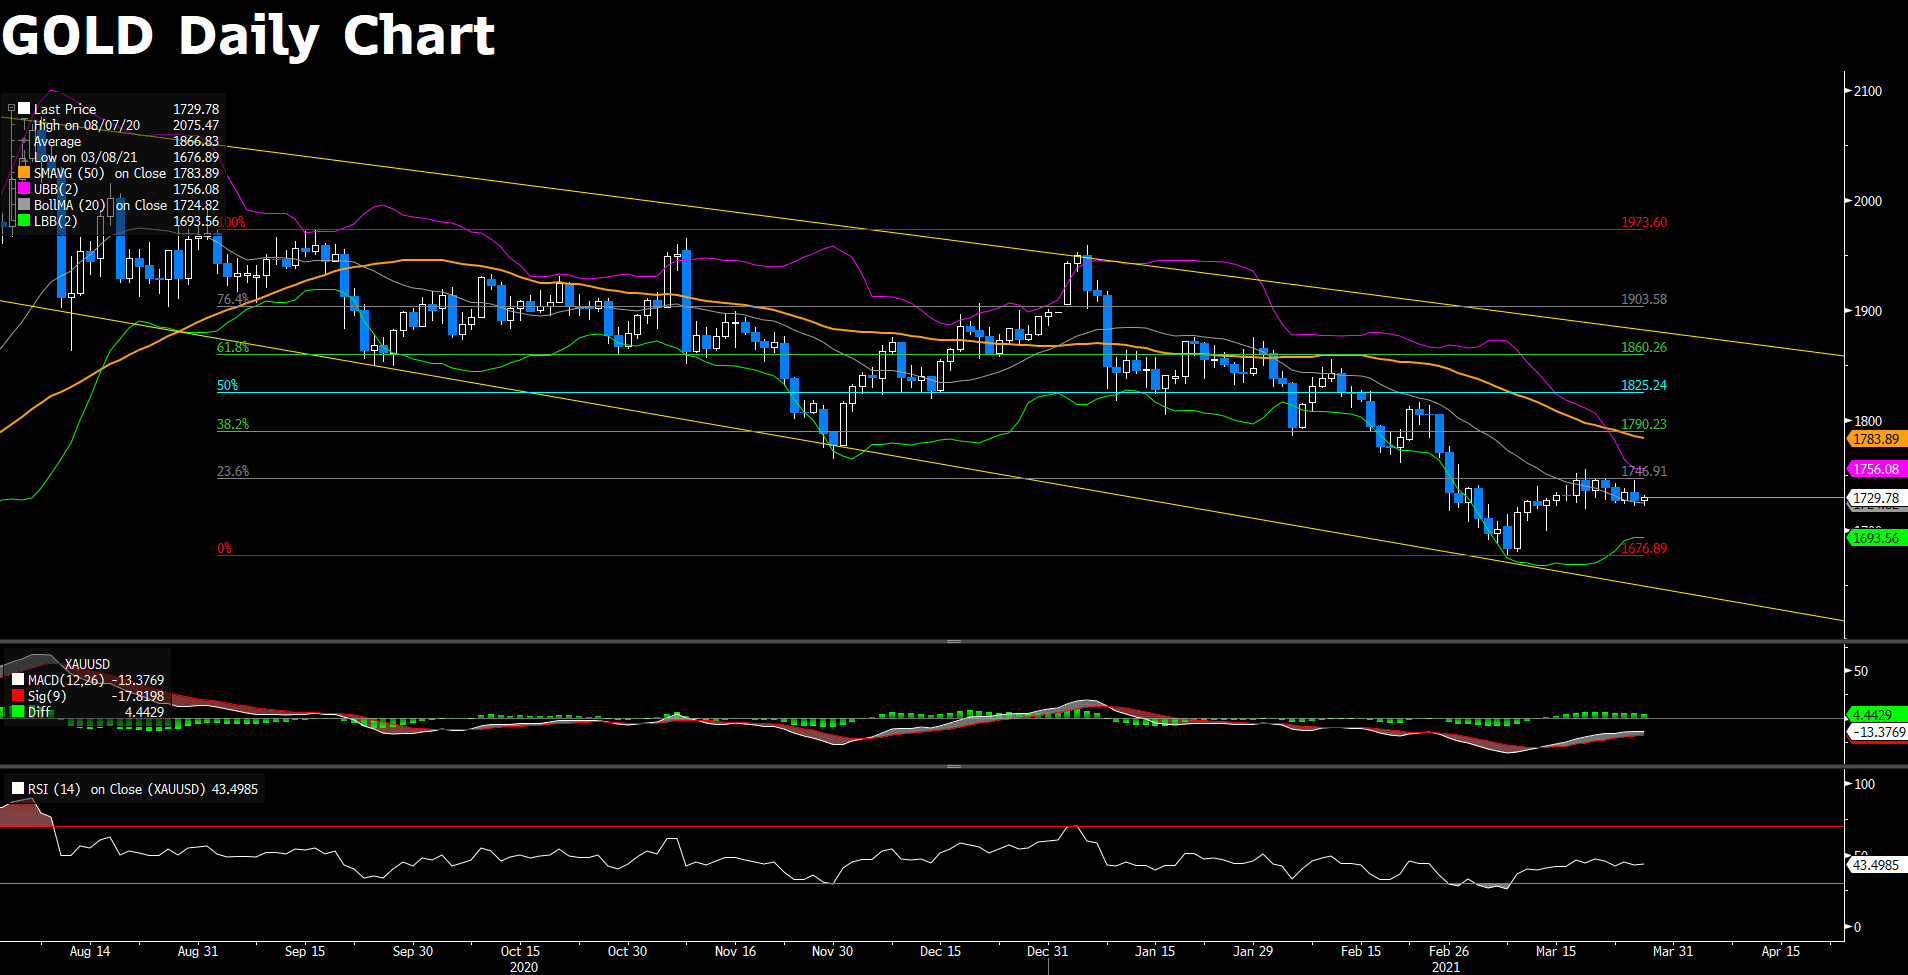
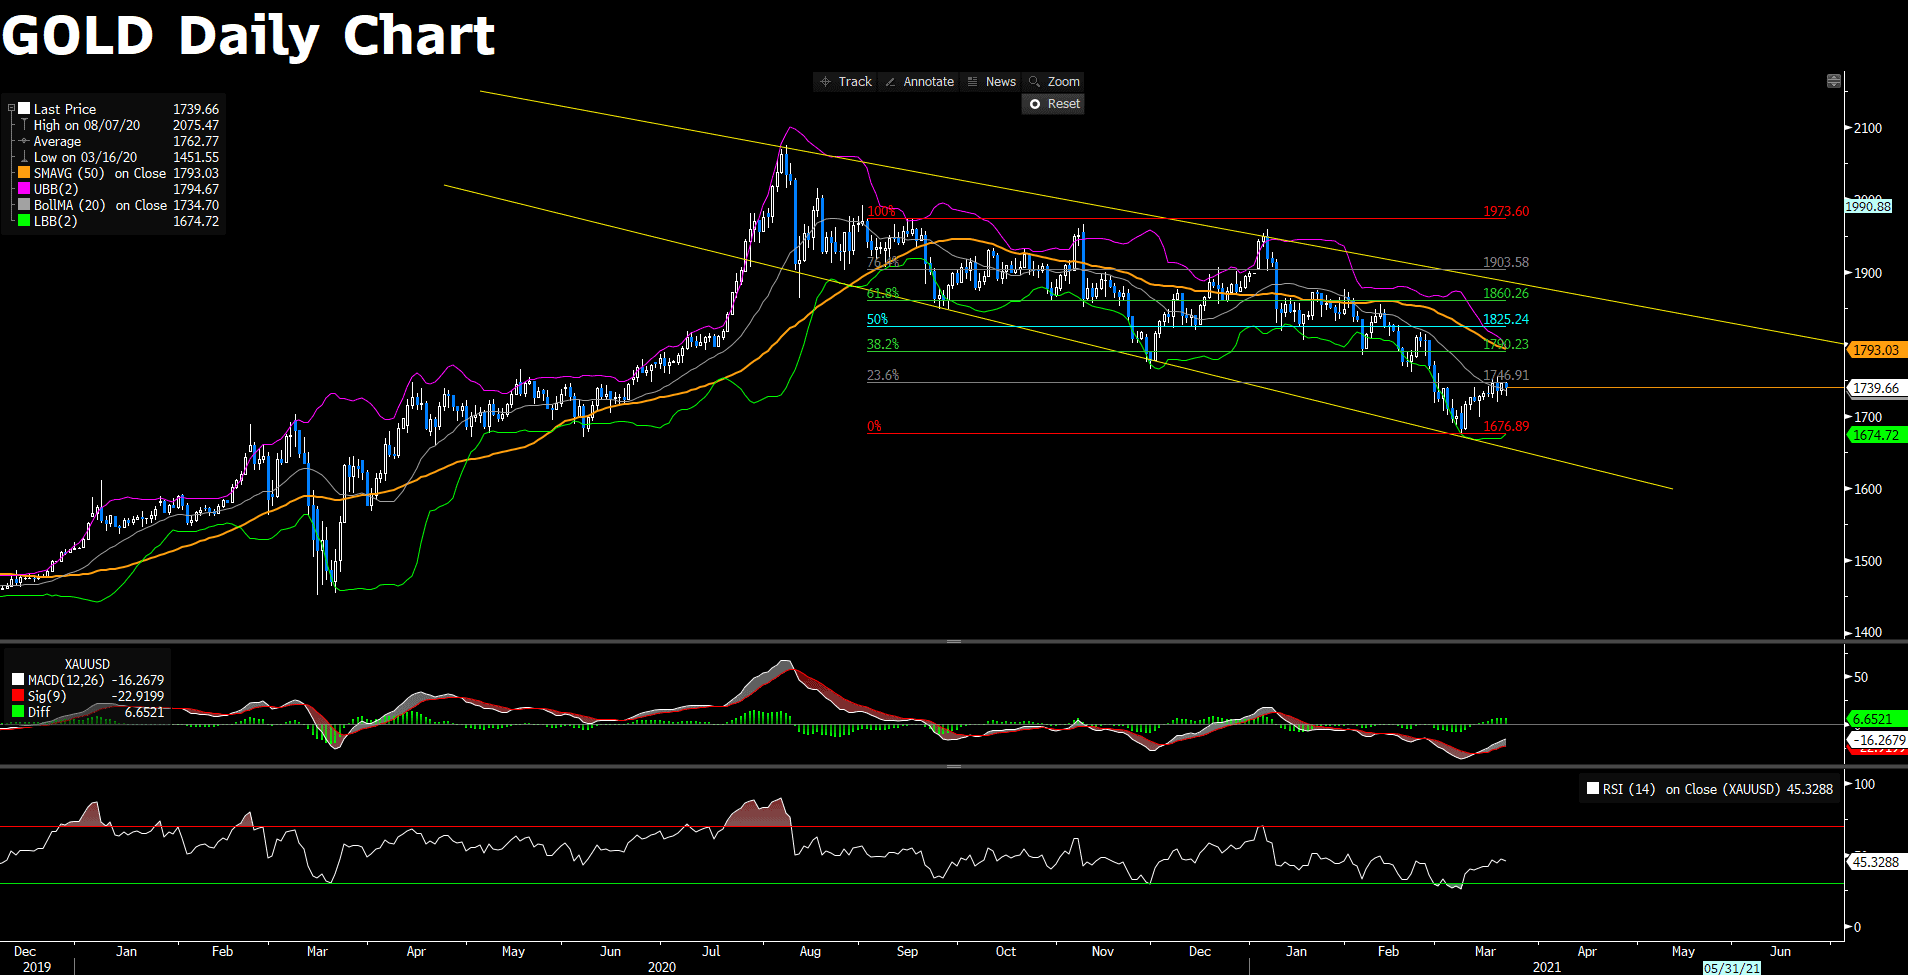
As an another yield wildly move in early NY session, gold extensively tamp down the market position to 1712.16 as of writing. At the same time, a long run down trend is pressing the marketplace as the yellow line in the chart. For technical aspect, RSI weighed a strong sell momentum as is girding at 30 figure. On the other hands, both 15 and 60-long SMAs indicators are heading south side whilst short one is above the long one.
Combing the stance above, we expect that gold market will confront another downward impetus. For support below, phycological level on 1700 will be a first pivot support, if loss defend, the sequently support will 1678.85. On contrast way, despite there is a powerful down trend pressure upon, the first resistance will be 1722.75, 1738.32 is following behind.
Resistance: 1722.75, 1738.3, 1754.53
Support: 1700, 1678.85
Economic Data
|
Currency |
Data |
Time (GMT + 8) |
Forecast |
||||
|
USD |
CB Consumer Confidence (Mar) |
22:30 |
96.9 |
||||