Daily Market Analysis
Market Focus
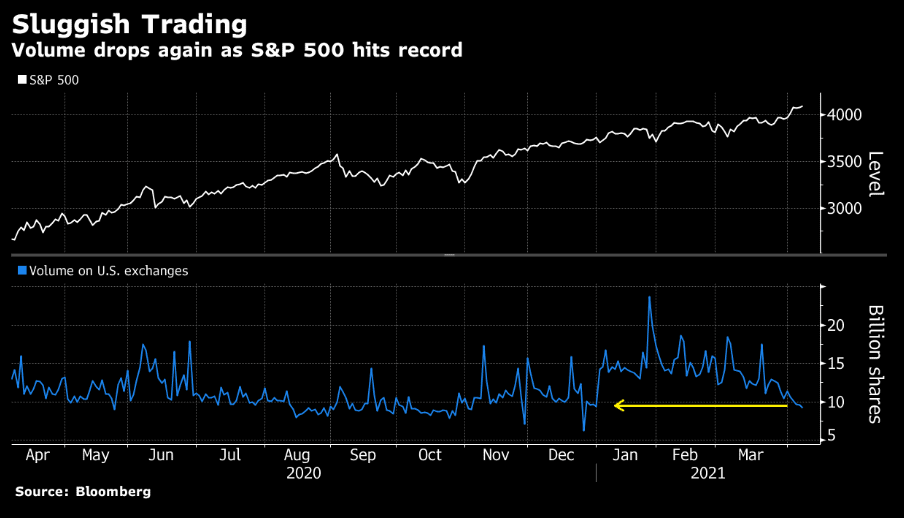
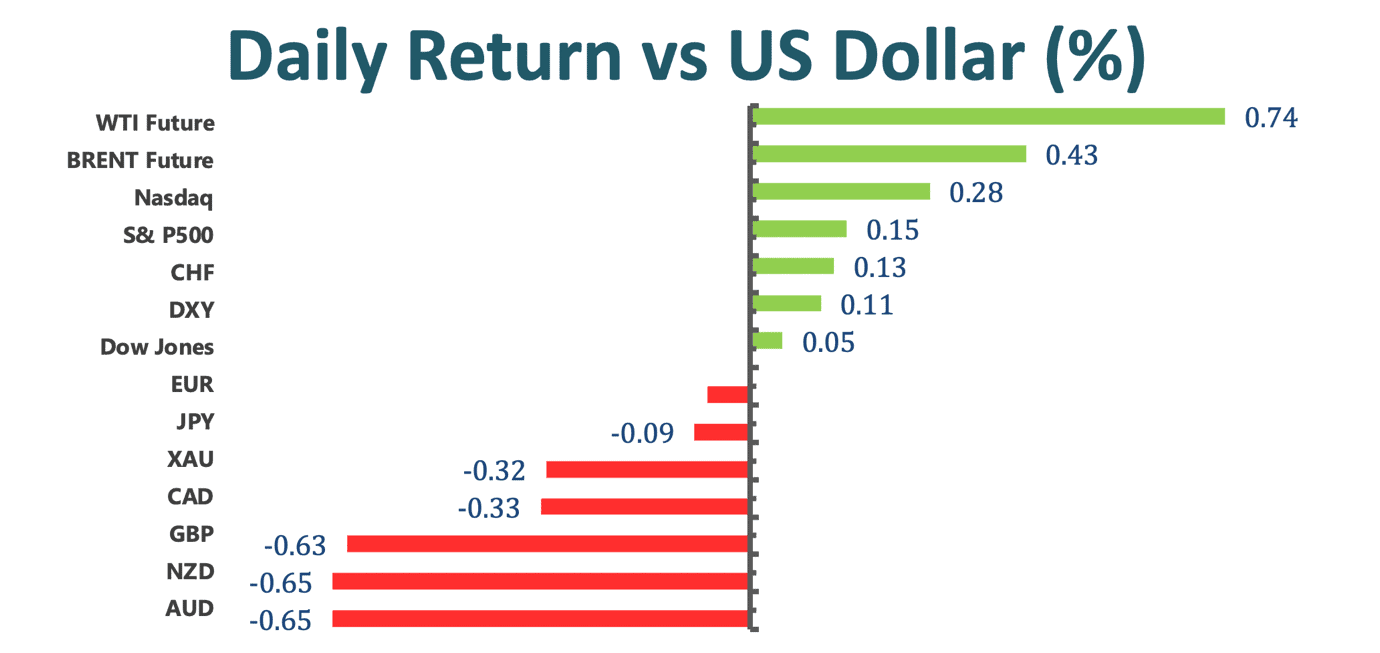
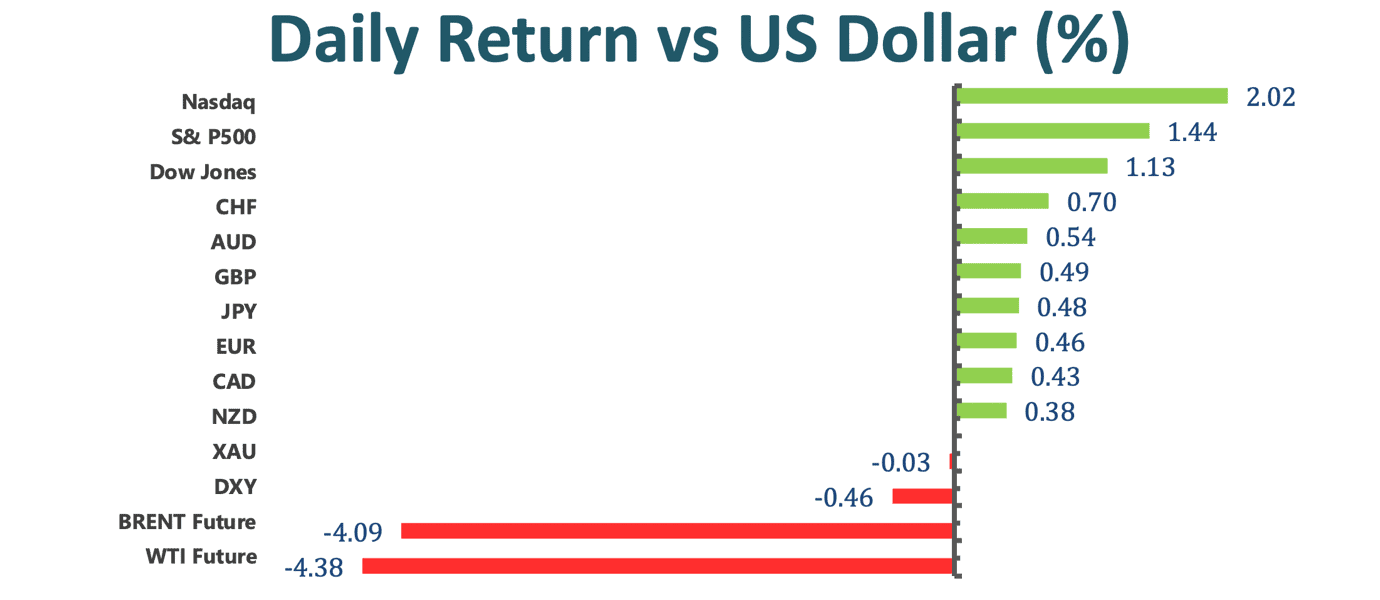
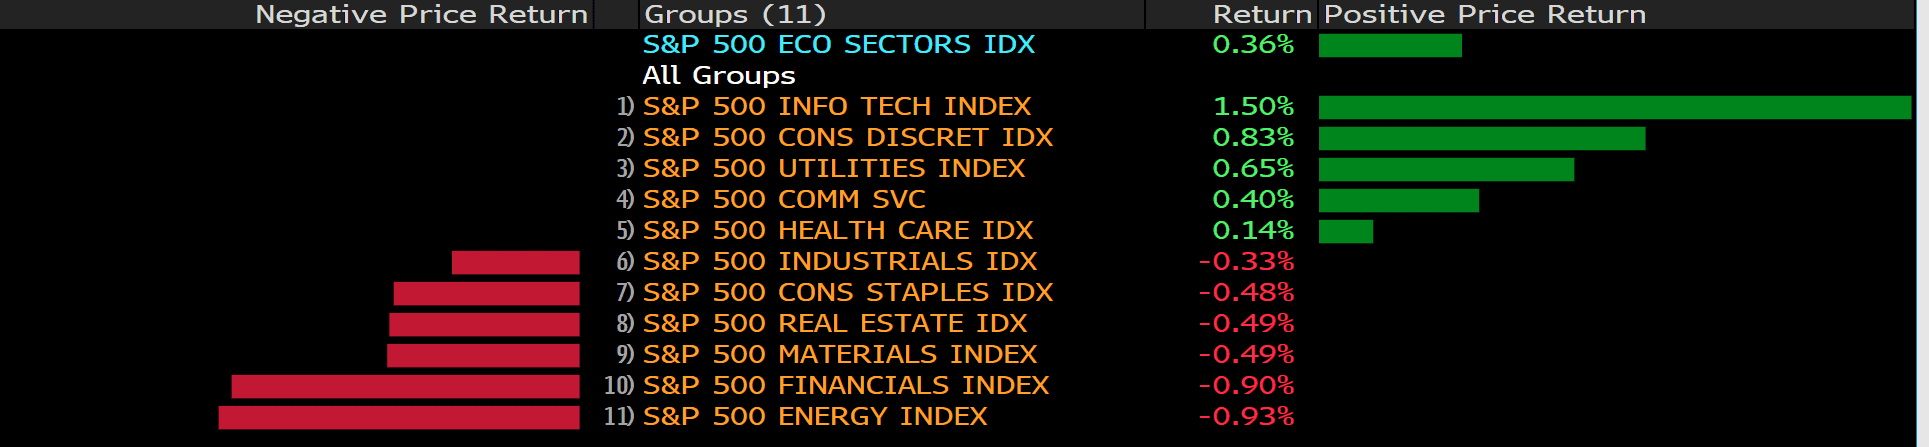
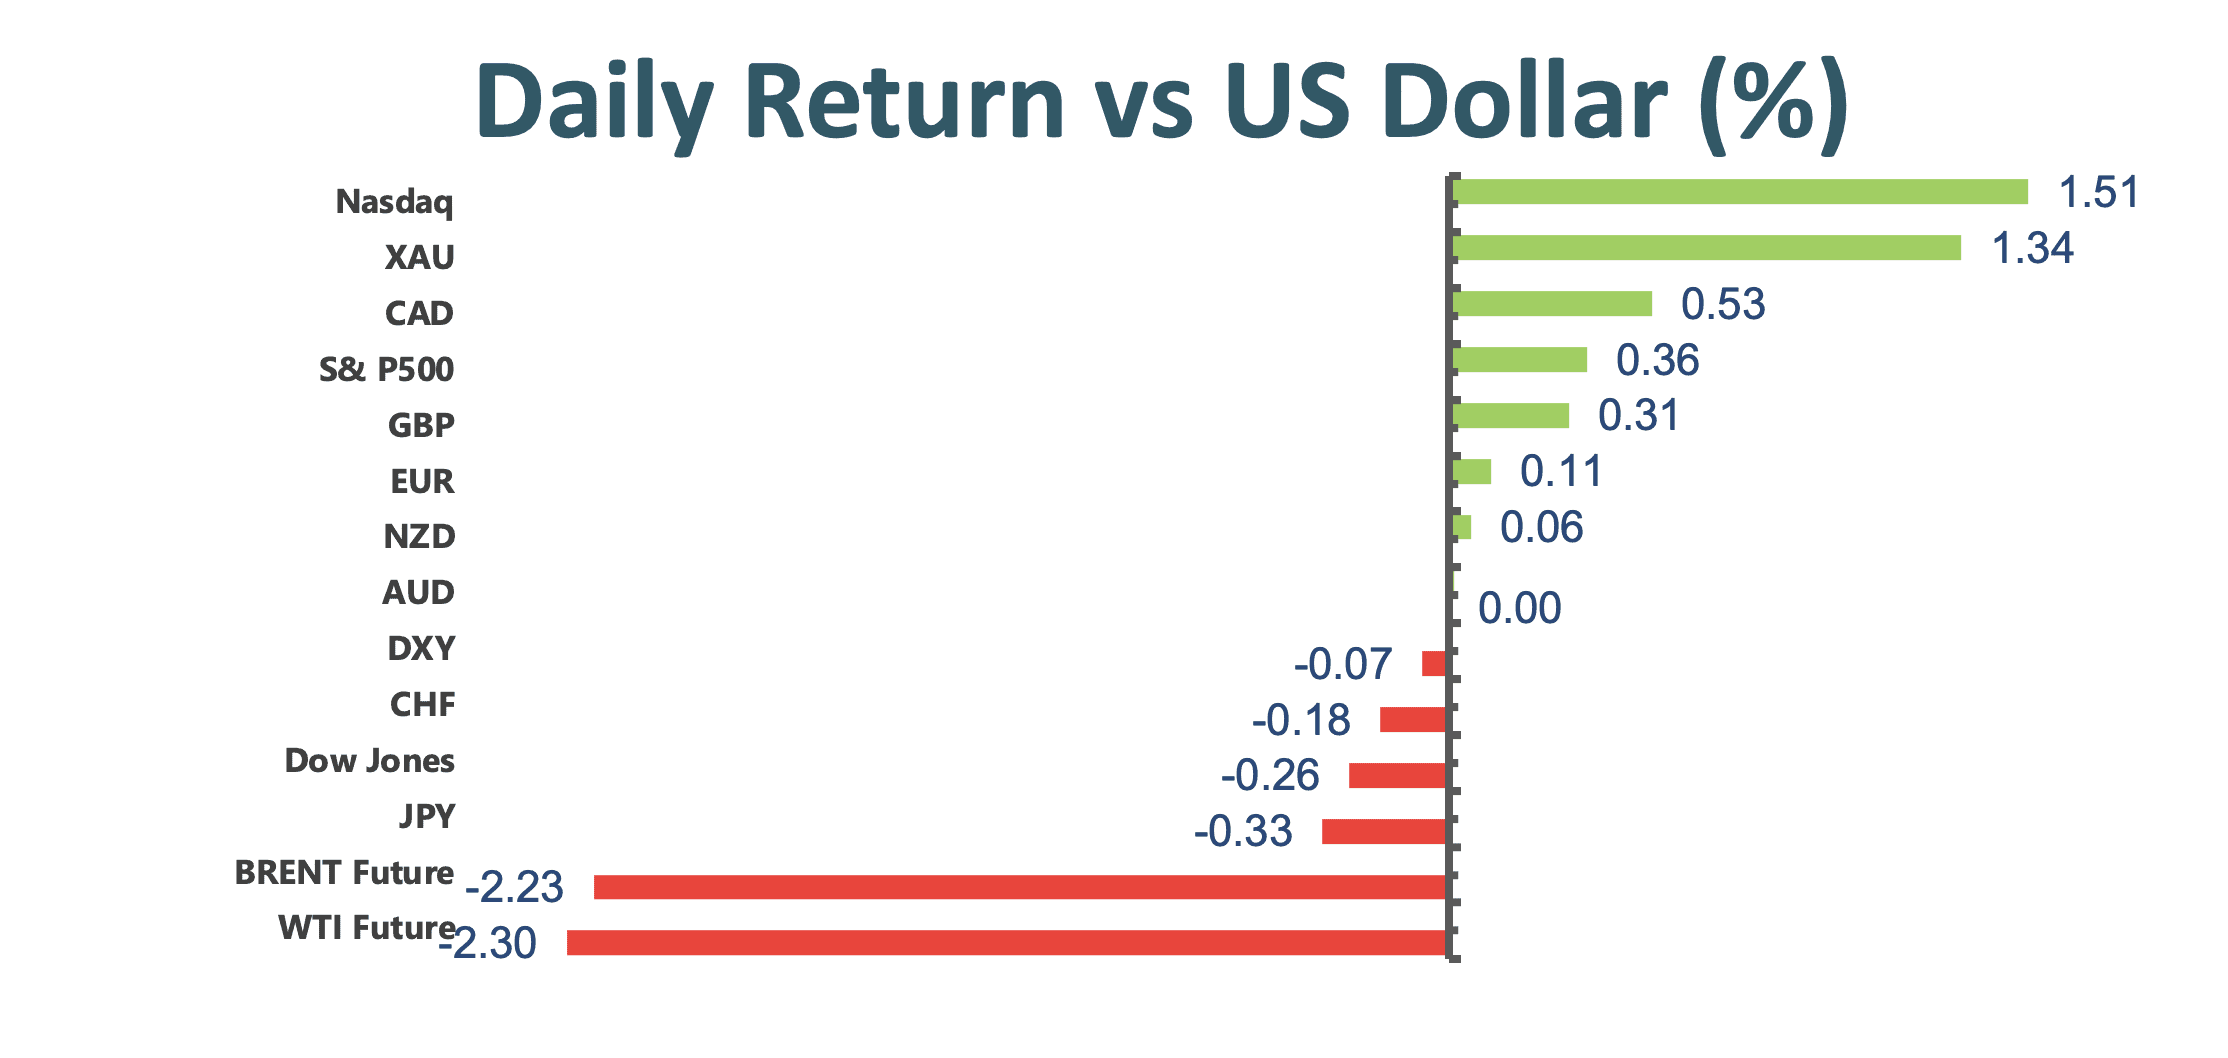
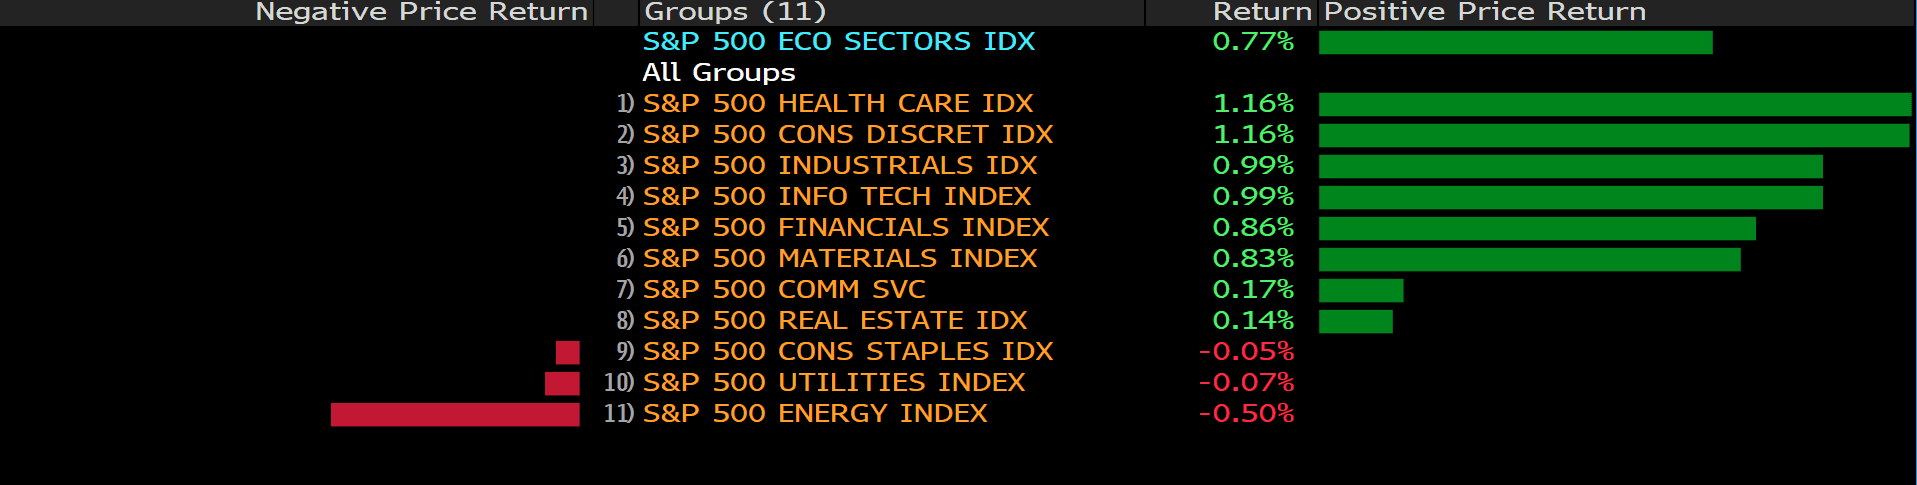
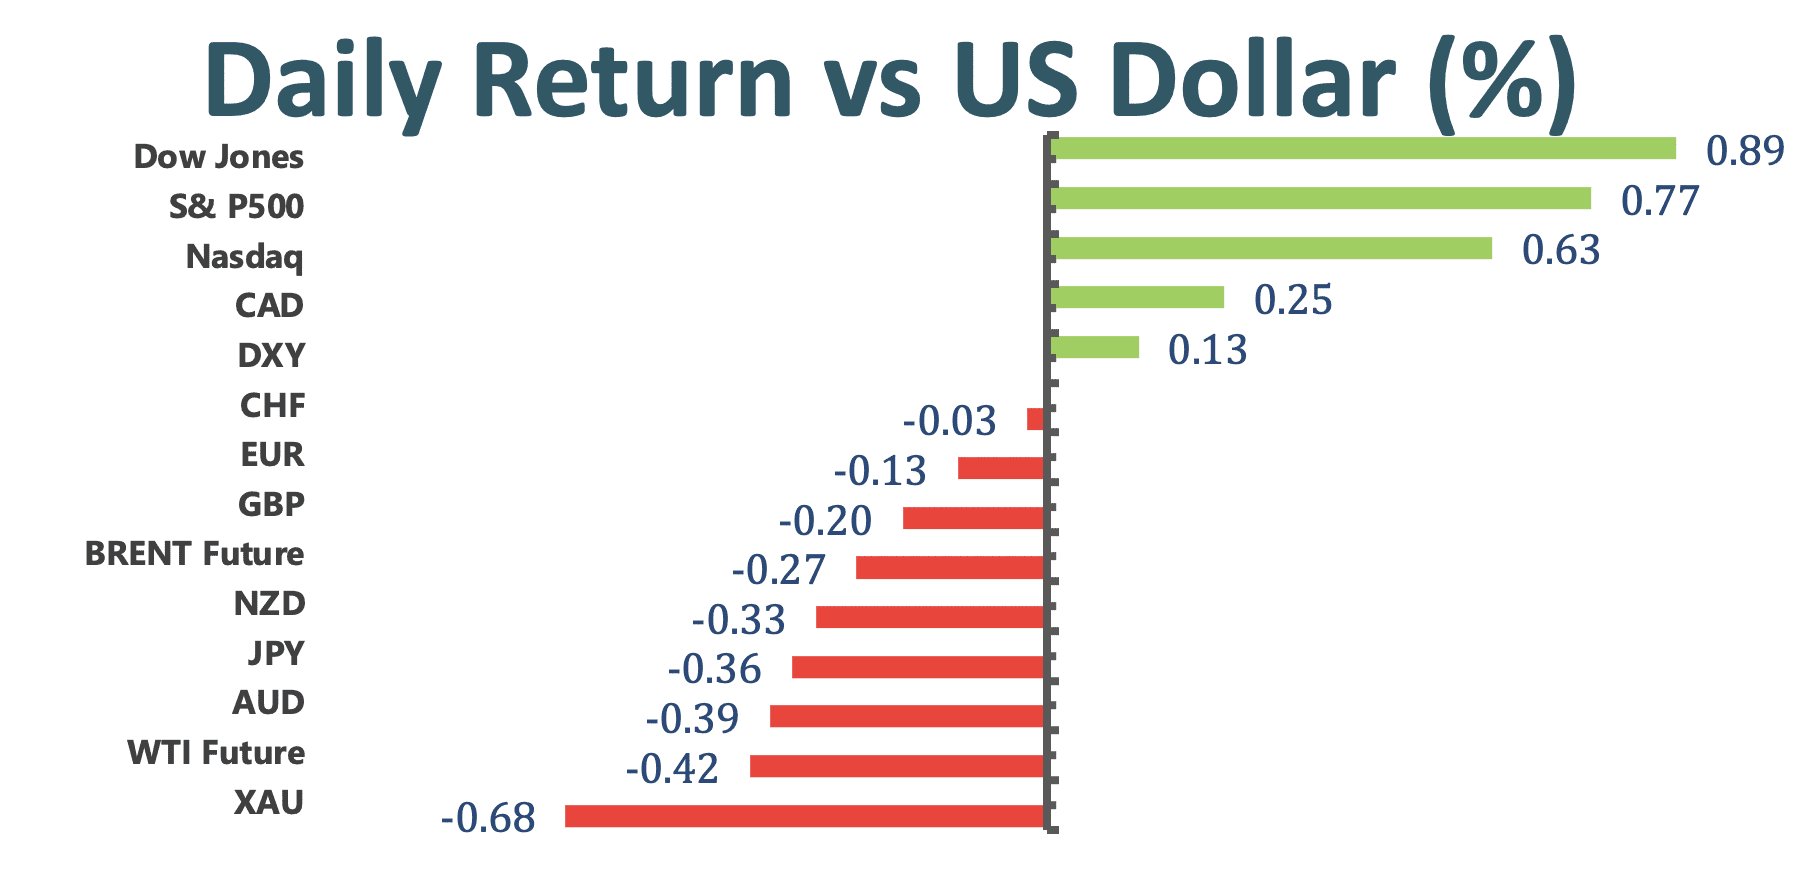
US equity markets were roughly positive as stocks rose toward another record as traders shifted attention away from inflation and focused on prospects for an economic rebound, resulting in a decline in US Treasury yields and a decline in the US dollar index. Equity market kept up its momentum and continued to surge from March 2020 lows to approx. 85% as the Federal Reserve reassured markets that the fed policy will remain supportive. All told, the Dow Jones Industrial Averages rose about 297.03 points; the Nasdaq climbed 0.5% while the S&P 500 gained 0.8%.
Joe Biden plans to request $715 billion USD for his first pentagon budget, generating concerns over how these funds would be spent. The $715 billion budget is roughly 1.6% higher than the $704 billion enacted for this year. This difference has launched the concern over the real terms adjusted for inflation.
US- China tension continues to edge up after the US Commerce Department added seven more Chinese supercomputing companies to a US economic blacklist citing national security considerations. Companies that are being blacklisted include Tianjin Phytium Information Technology, Shanghai High-Performance Integrated Circuit Design Center, Sunway Microelectronics, the National Supercomputing Center Jinan, the National Supercomputing Center Shenzhen, the National Supercomputing Center Wuxi, and the National Supercomputing Center Zhengzhou. US has complained that those Chinese companies are beholden to China, and at the same time collect sensitive information on the behalf of Chinese military.
Market Wrap
Main Pairs Movement:
WTI continued to trade in the range of $59- $60. In the near- term, as the pandemic has accelerated in some key developed countries and also some countries in Europe, like Germany, the darkening of the near- term oil demand outlook has been reflected in downwards revision.
The British Pound struggled around 1.37 against the US dollar on US dollar strength and covid concerns. The US dollar rebounded from dovish Fed- induced blow. On the UK insight, as the UK will take the next step in tis gradual easing of restrictions, the economic recovery focuses on the response of households to the reopening; as a result, the uncertainty has weakened the British Pound.
USDCAD dropped to daily lows below 1.2540 after a strong Canadian jobs report. The Canadian dollar gained strength as the monthly data published by Canada showed that the unemployment rate in March dropped to its lowest level since the beginning of the pandemic at 7.5%.
Technical Analysis:
EURUSD (Four- Hour Chart)
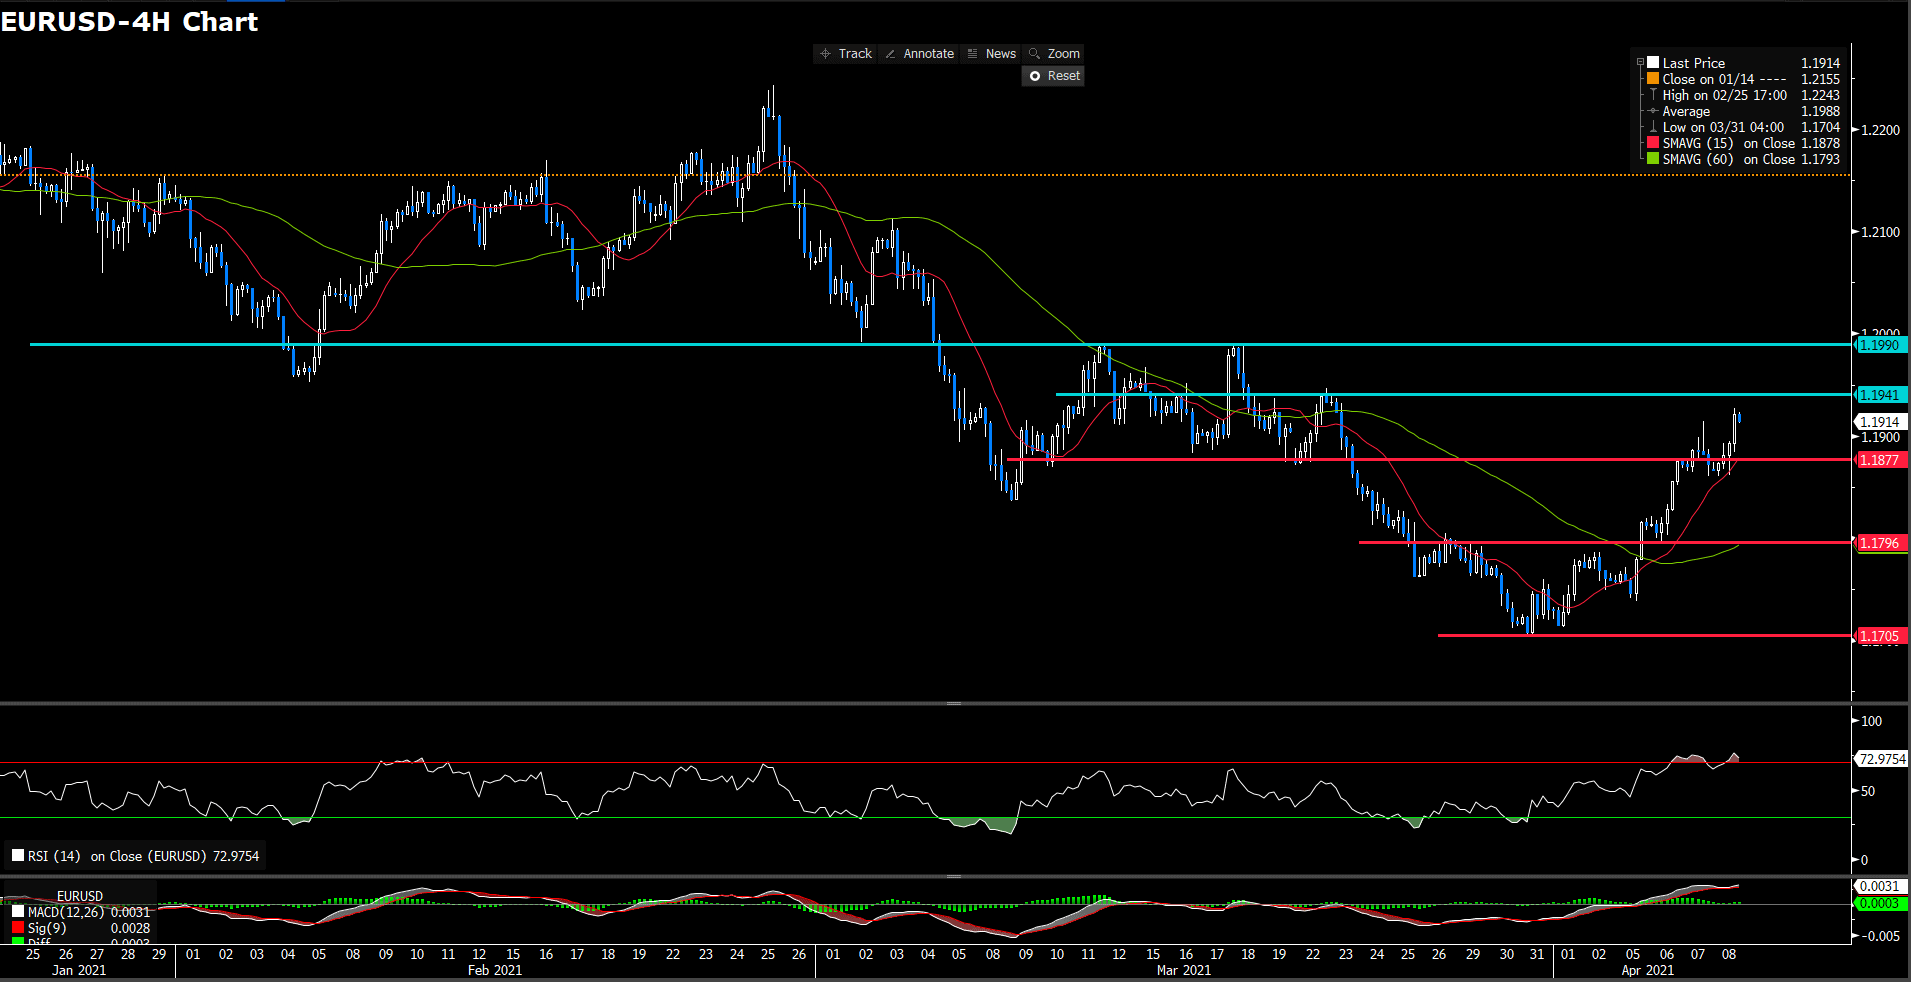
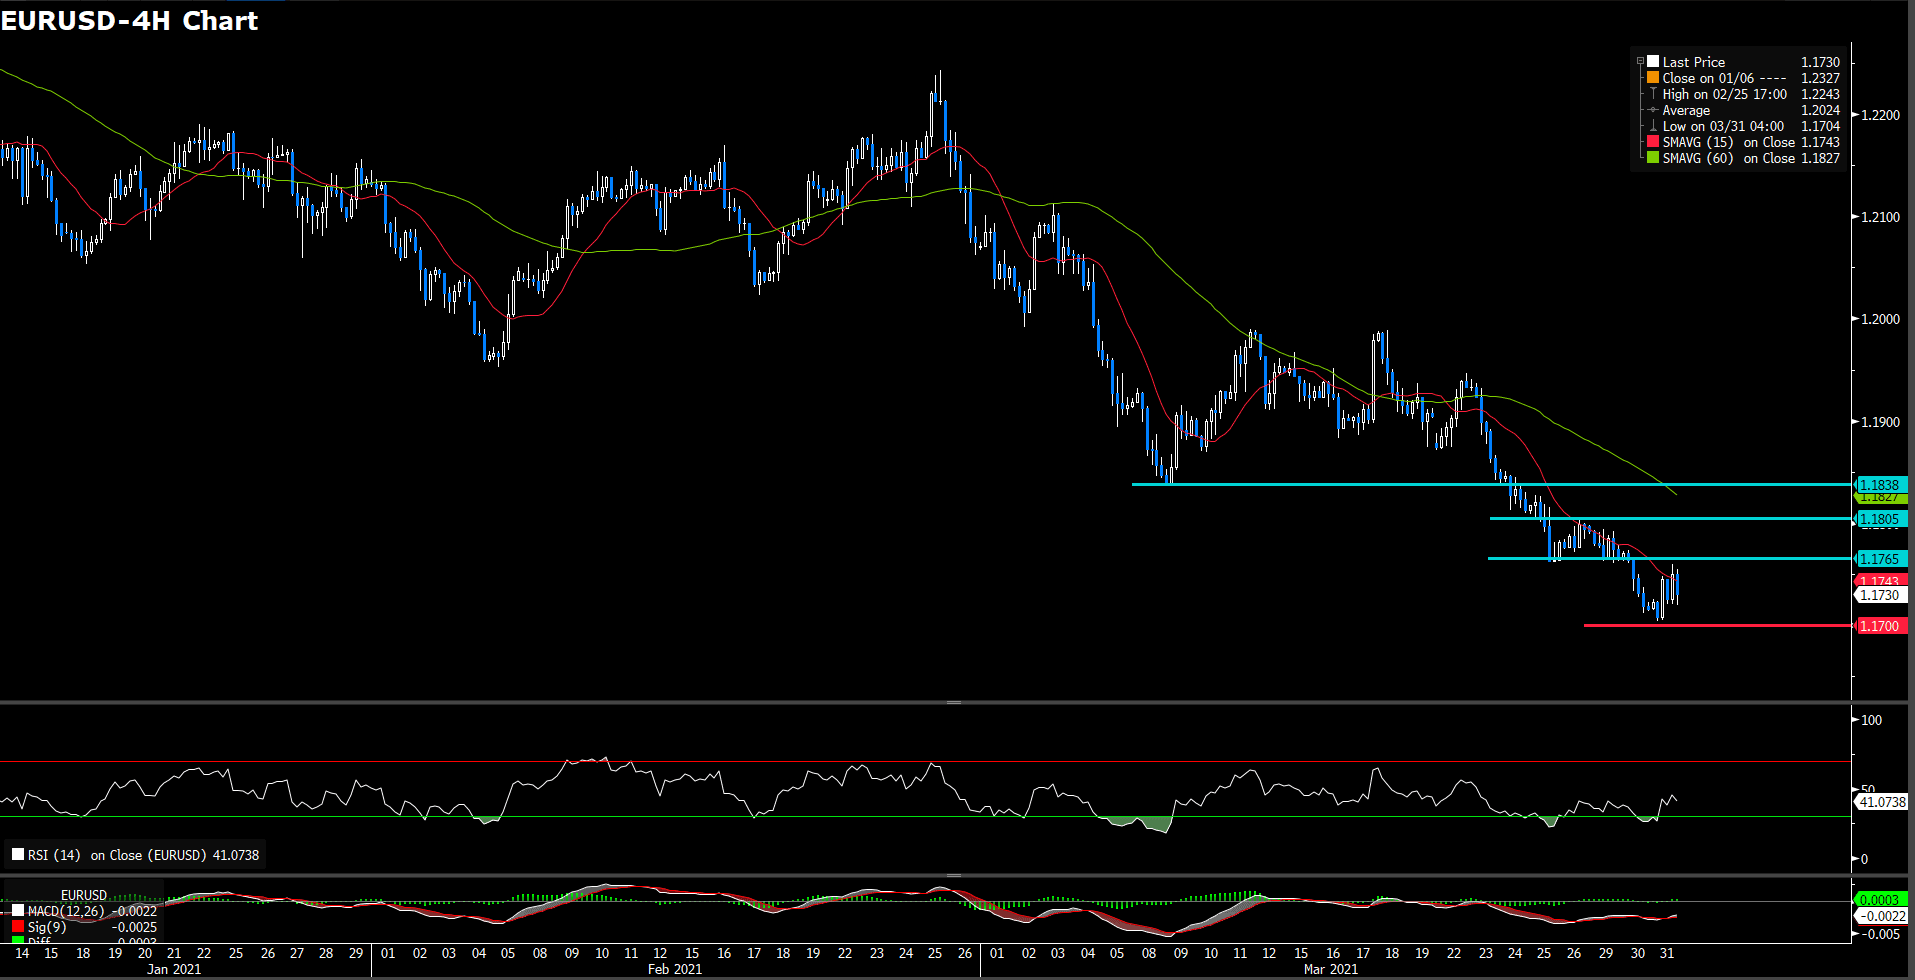
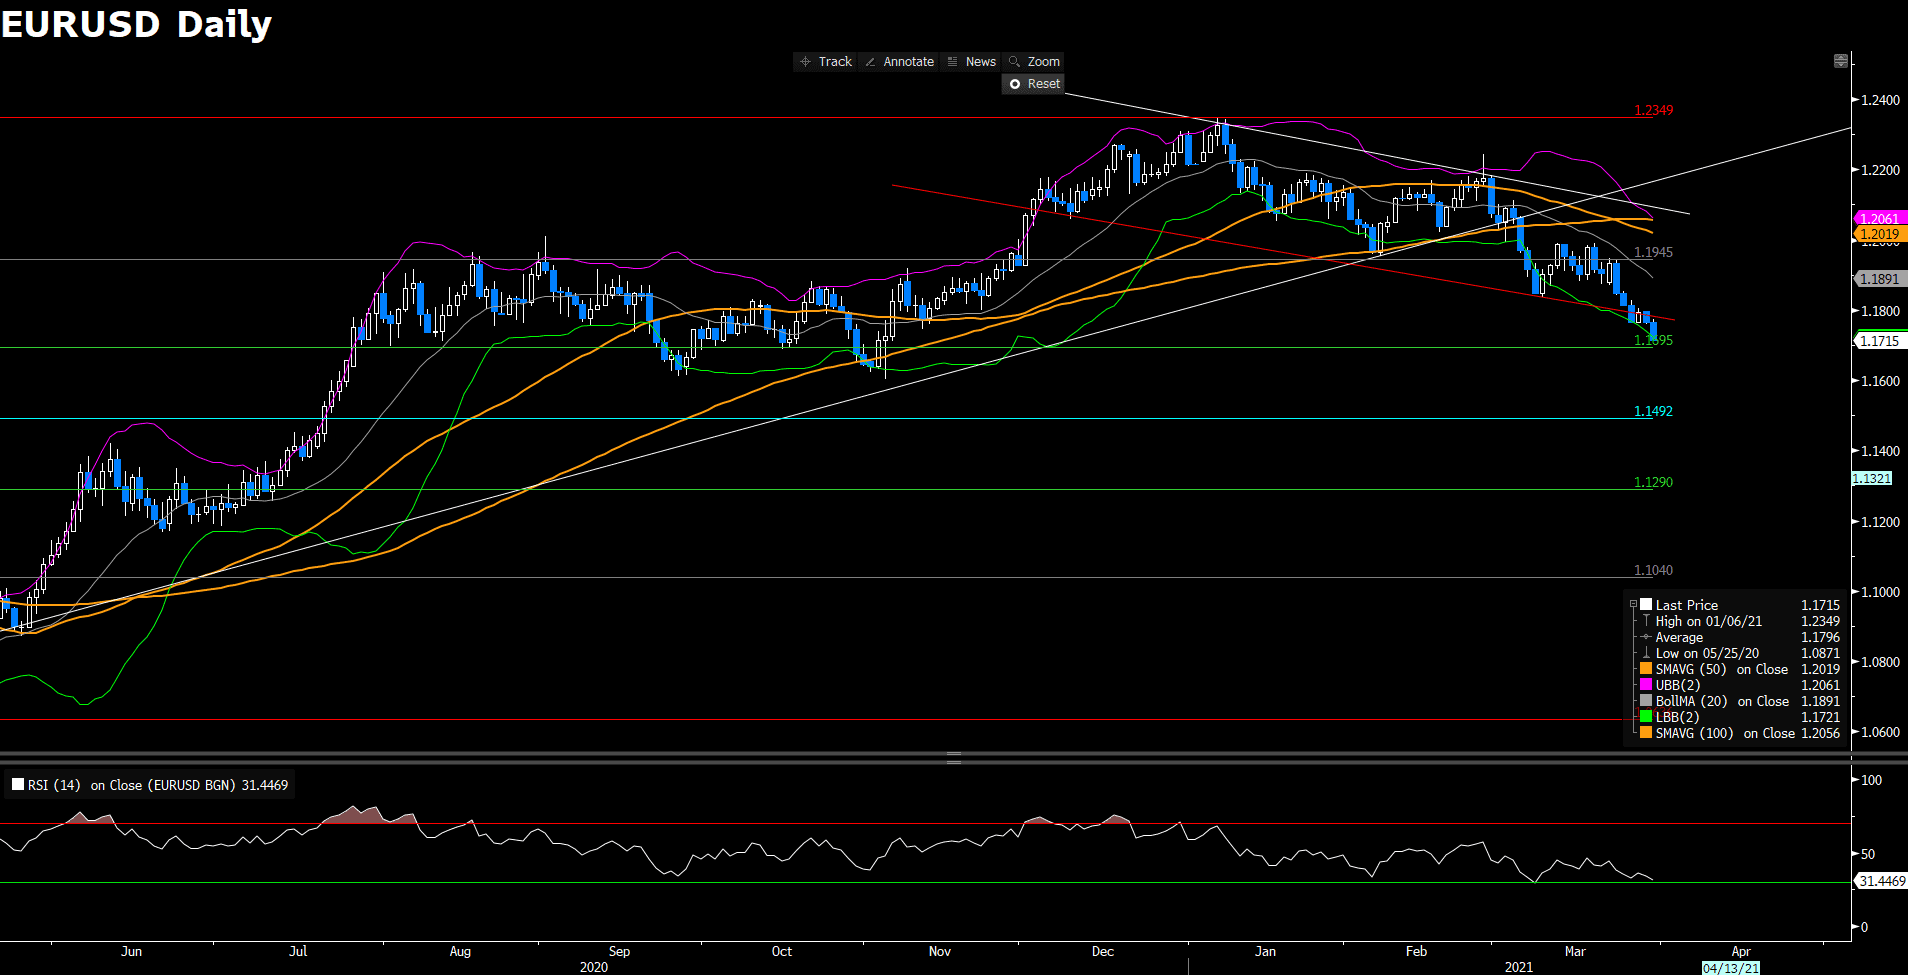
 The euro dollar markethas has retreated from nearly high, trading at 1.1904 level as of writing, amid 10 year Treasuries yields pick up whilst U.S. share market went smoothly. For RSI perspective, indicator set 62 figures which suggest a bullish trend at least for short run, despite correction today. On moving average side, 15 and 60-long indicator remained upward trend that short one was getting flat movement after market whipsaw.
Integrity our perspective and follow our anticipant from yesterday, we expect market will sucessively move neutral or consolidation at currently range. We foresee the consolidation range will be 1.1871 as lower bound and 1.1941 as upper bound which stand for first pivot support and resistance, respectively.
Resistance: 1.1941, 1.198
Support: 1.1871, 1.1796, 1.1705
GBPUSD (Four-Hour Chart)

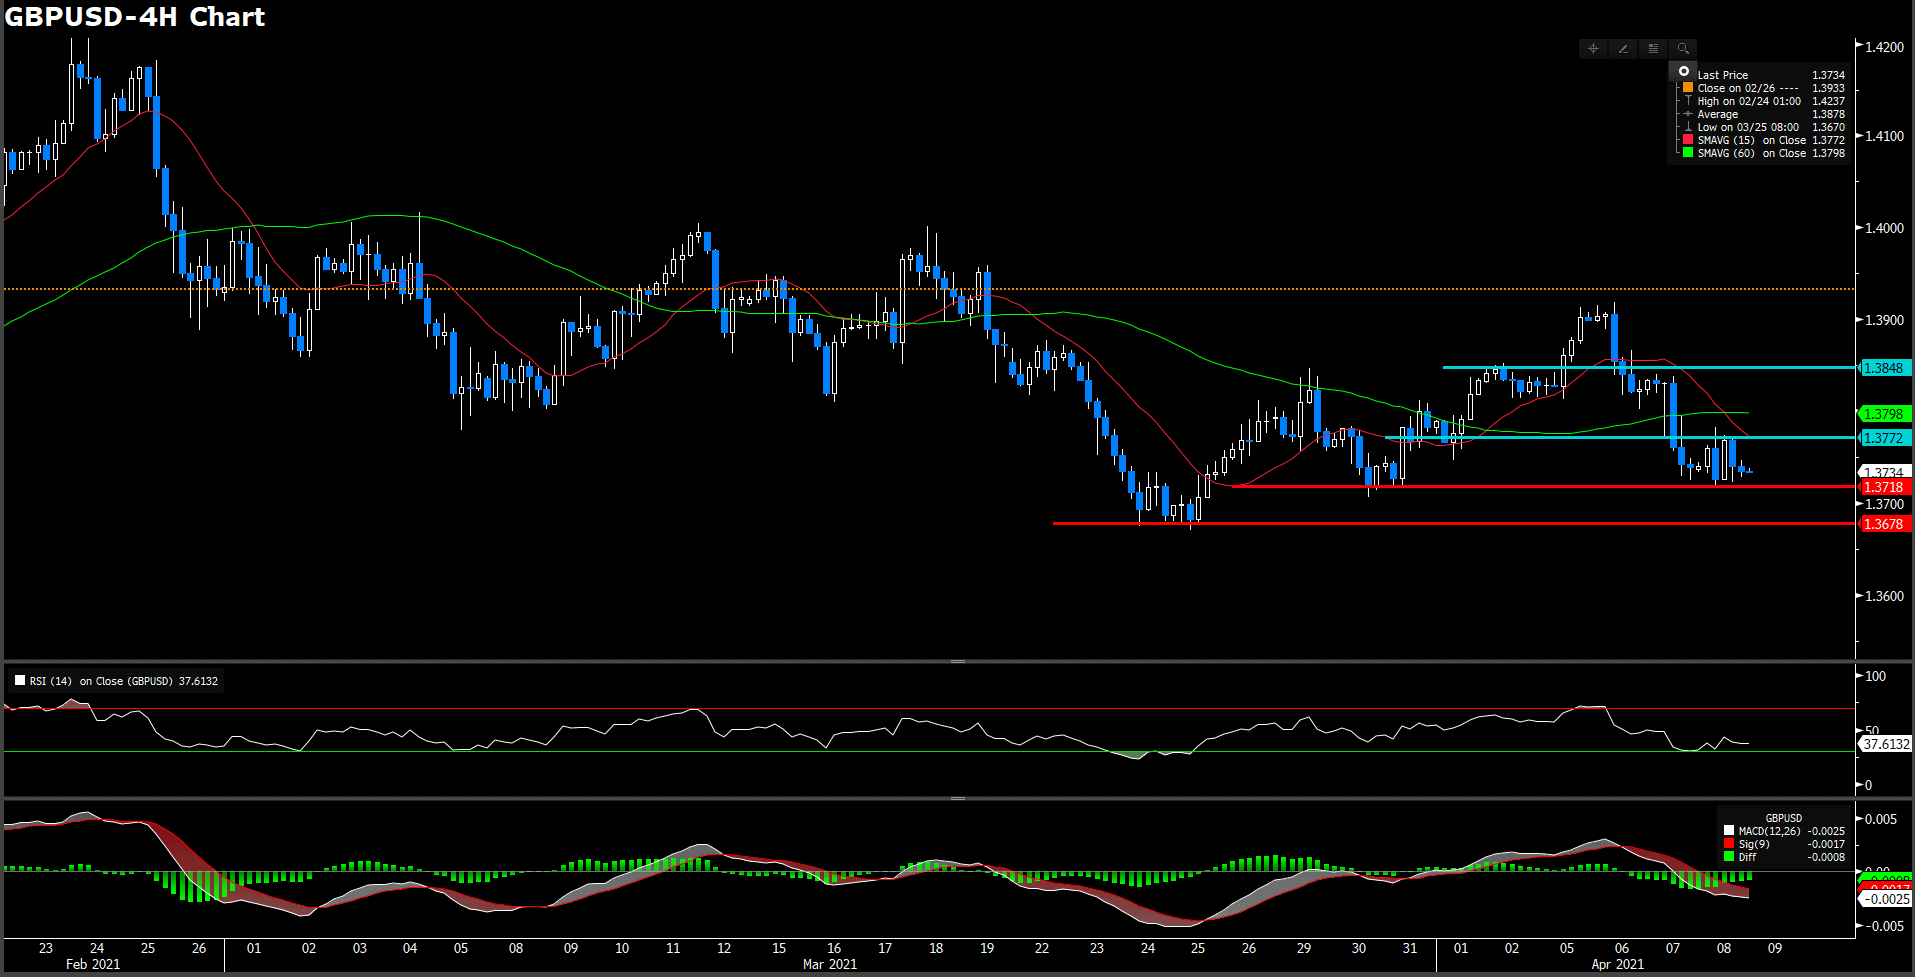
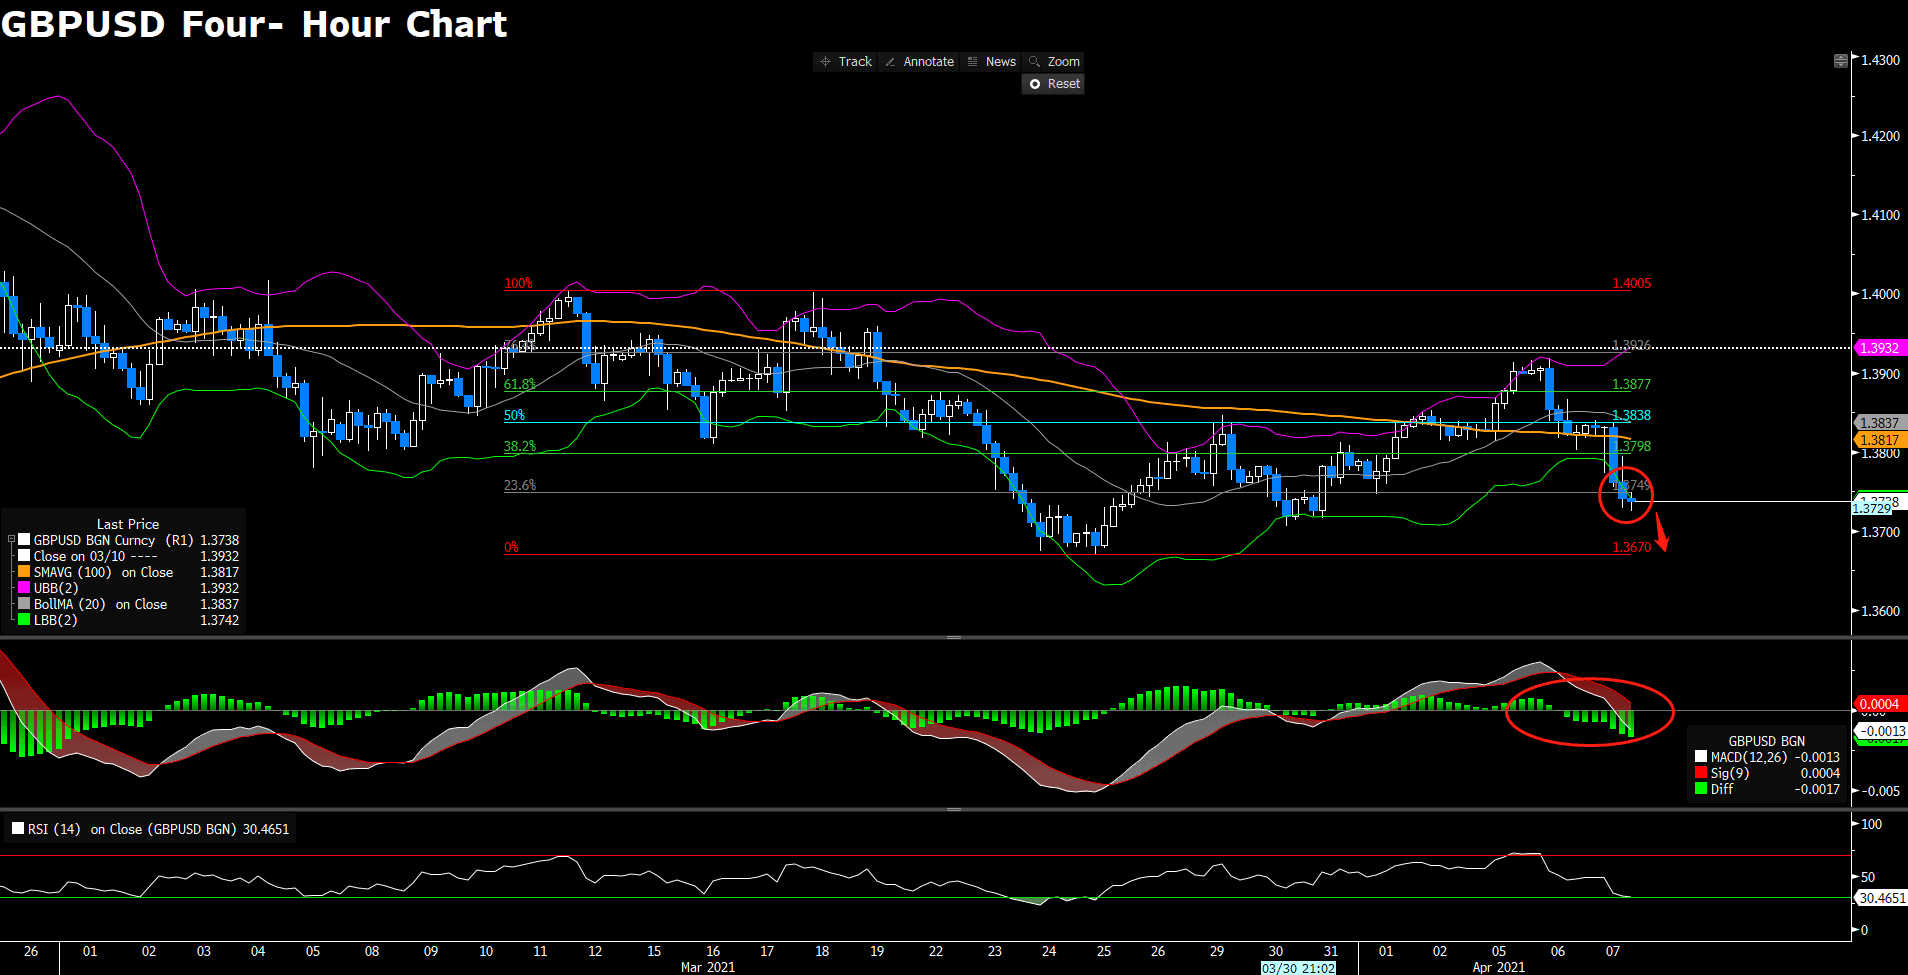
GBPUSD extends further south toward 1.37090 after breaking below the support level at 1.3749 on the four- hour chart. The pair continues to show bearish tendency as it steadily trades below the midline of the Bollinger Band and the 20 SMA. Furhtermore, the technical indicators, the RSI is above the 30 level outside oversold territory while the MACD still shows a sign of lending the support to bears. GBPUSD is expected to head toward the next support at 1.3670.
Resistance: 1.3749, 1.3797, 1.3836
Support: 1.3670
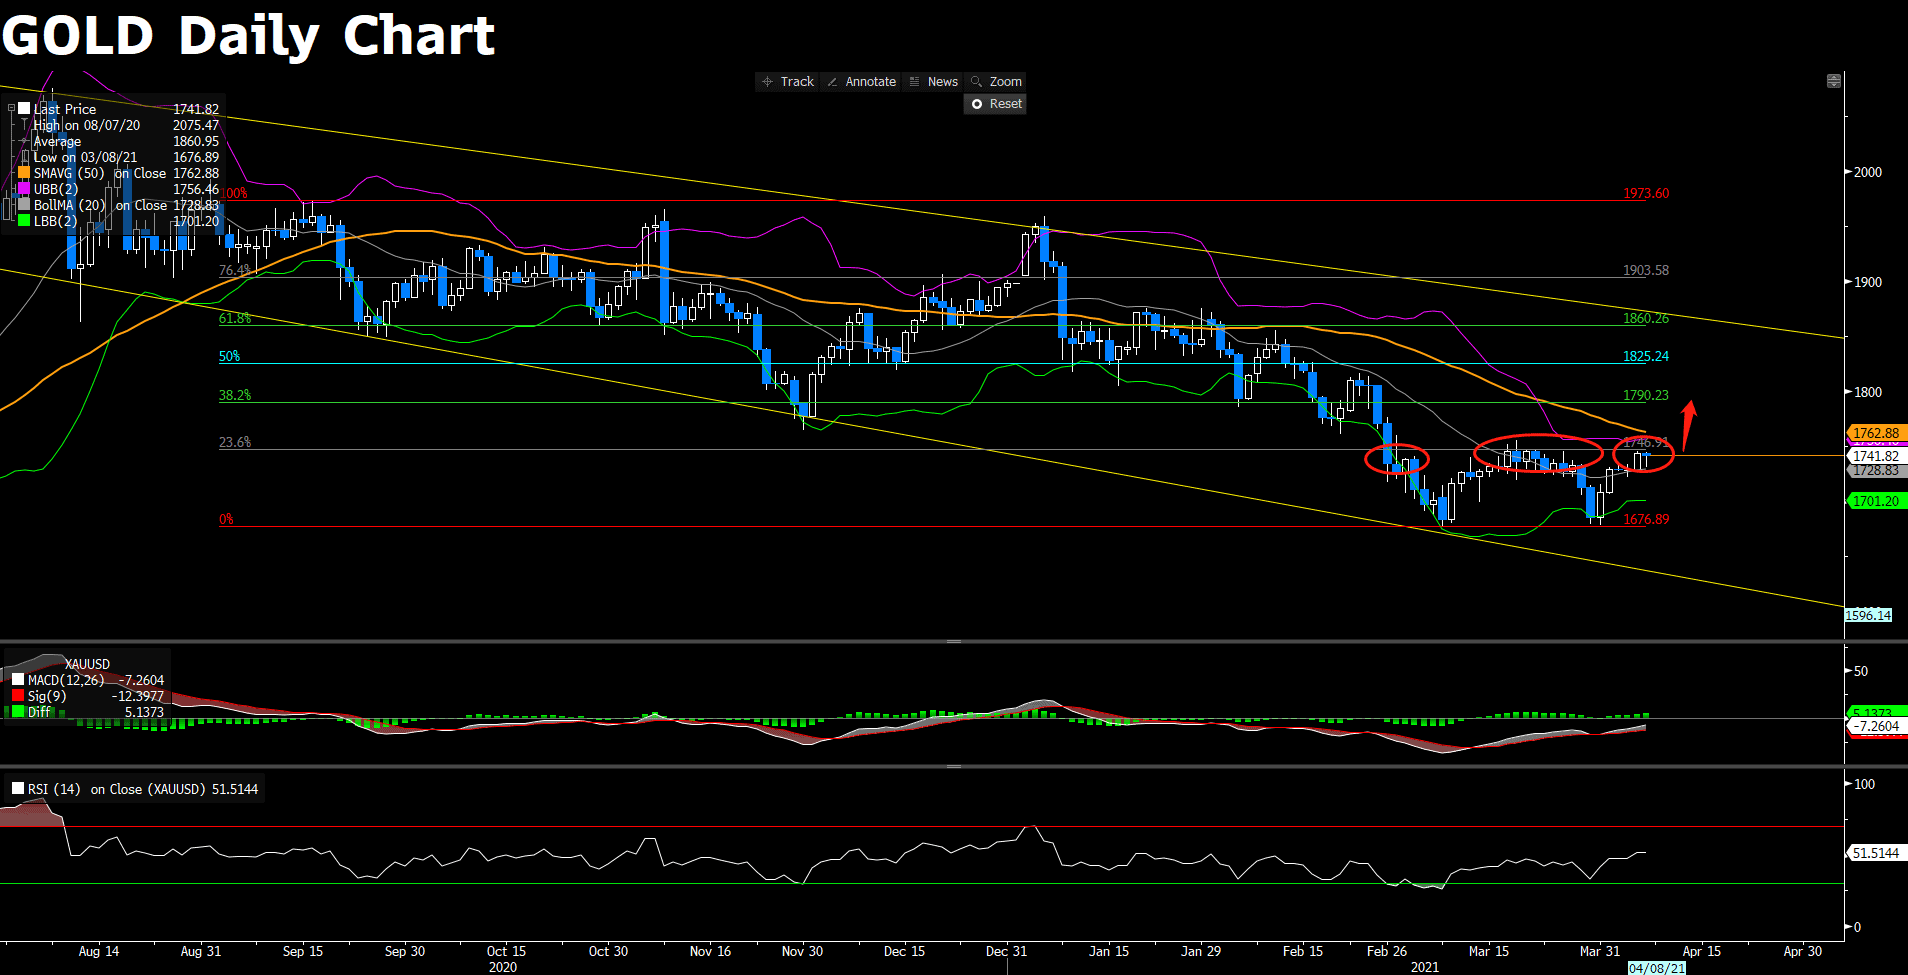
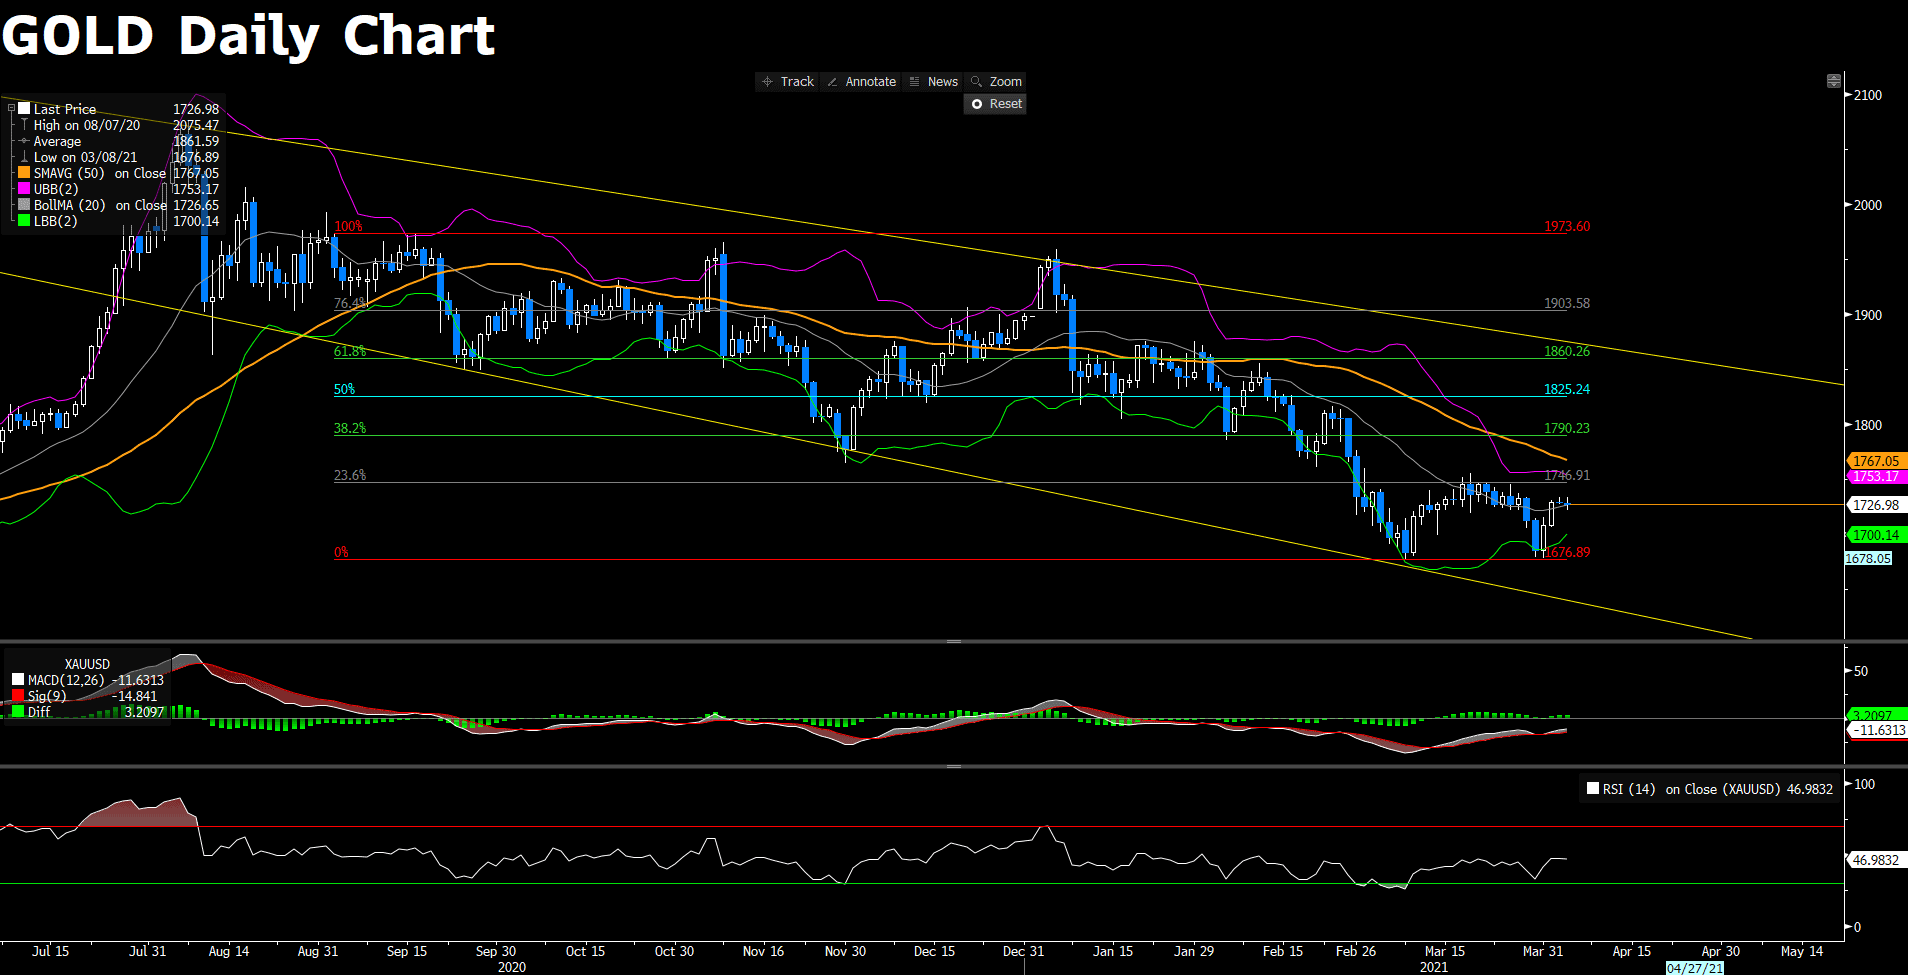
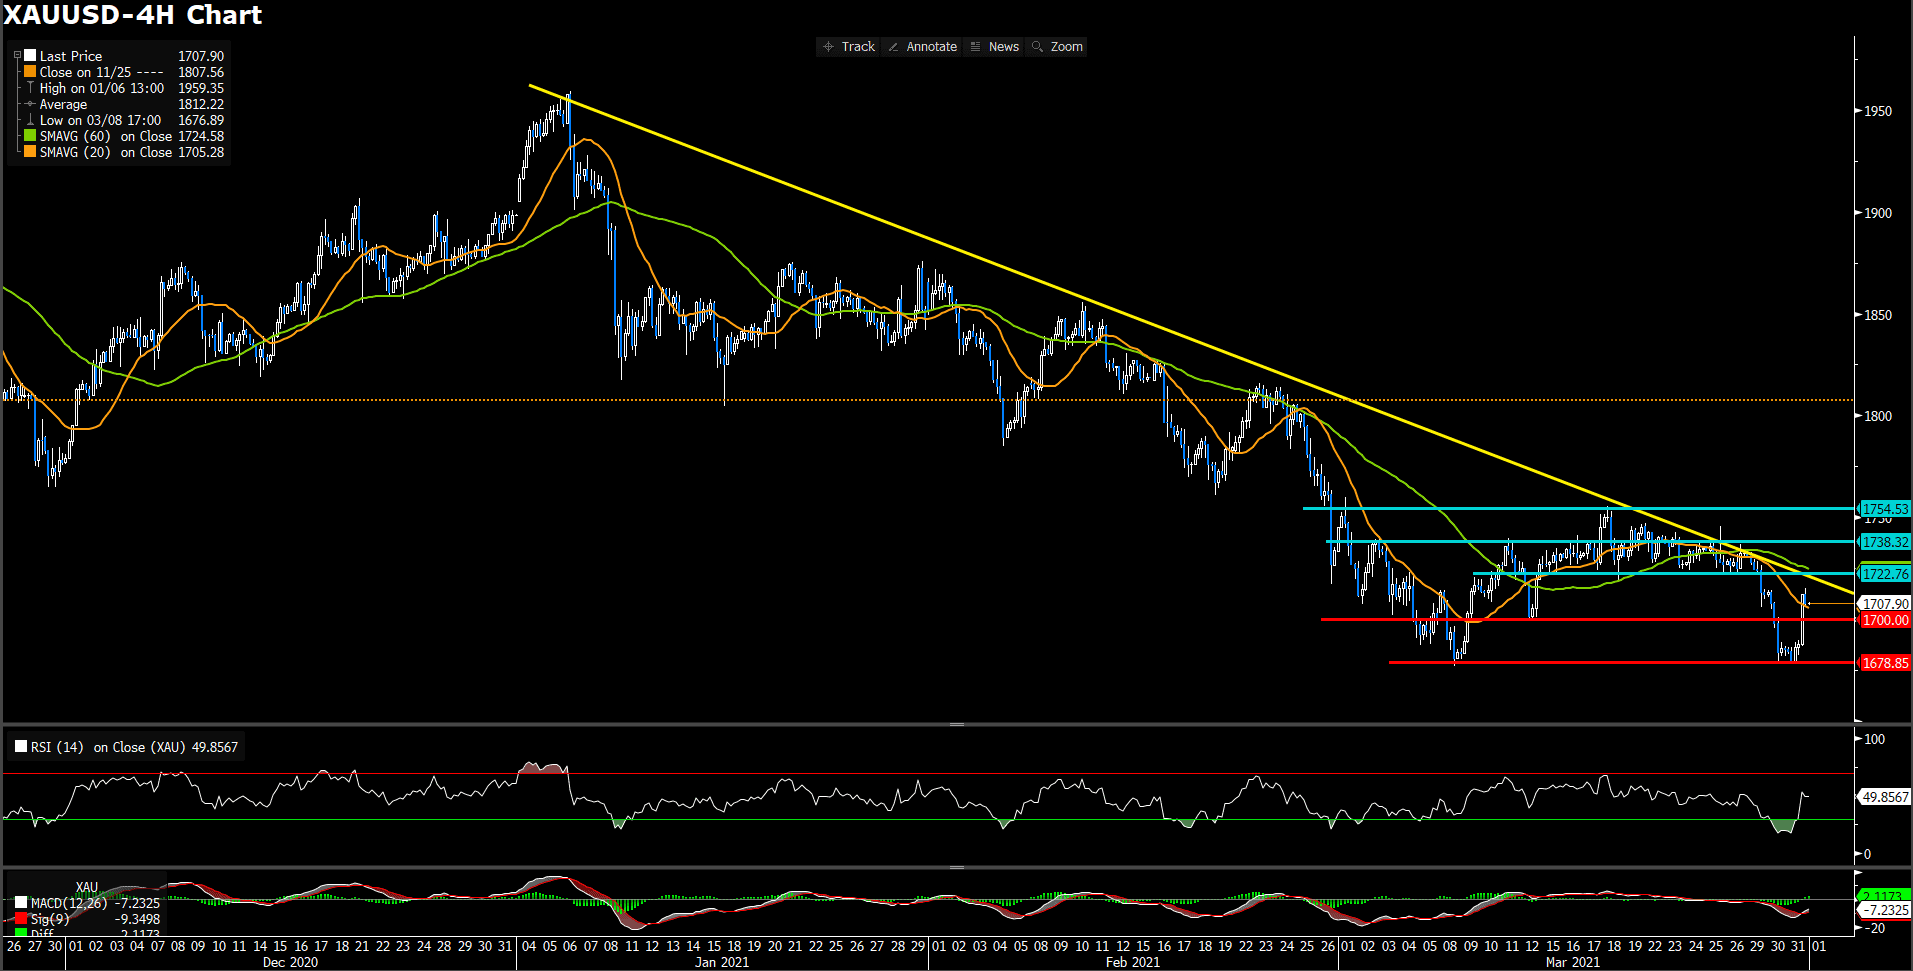
XAUUSD (Daily Chart)
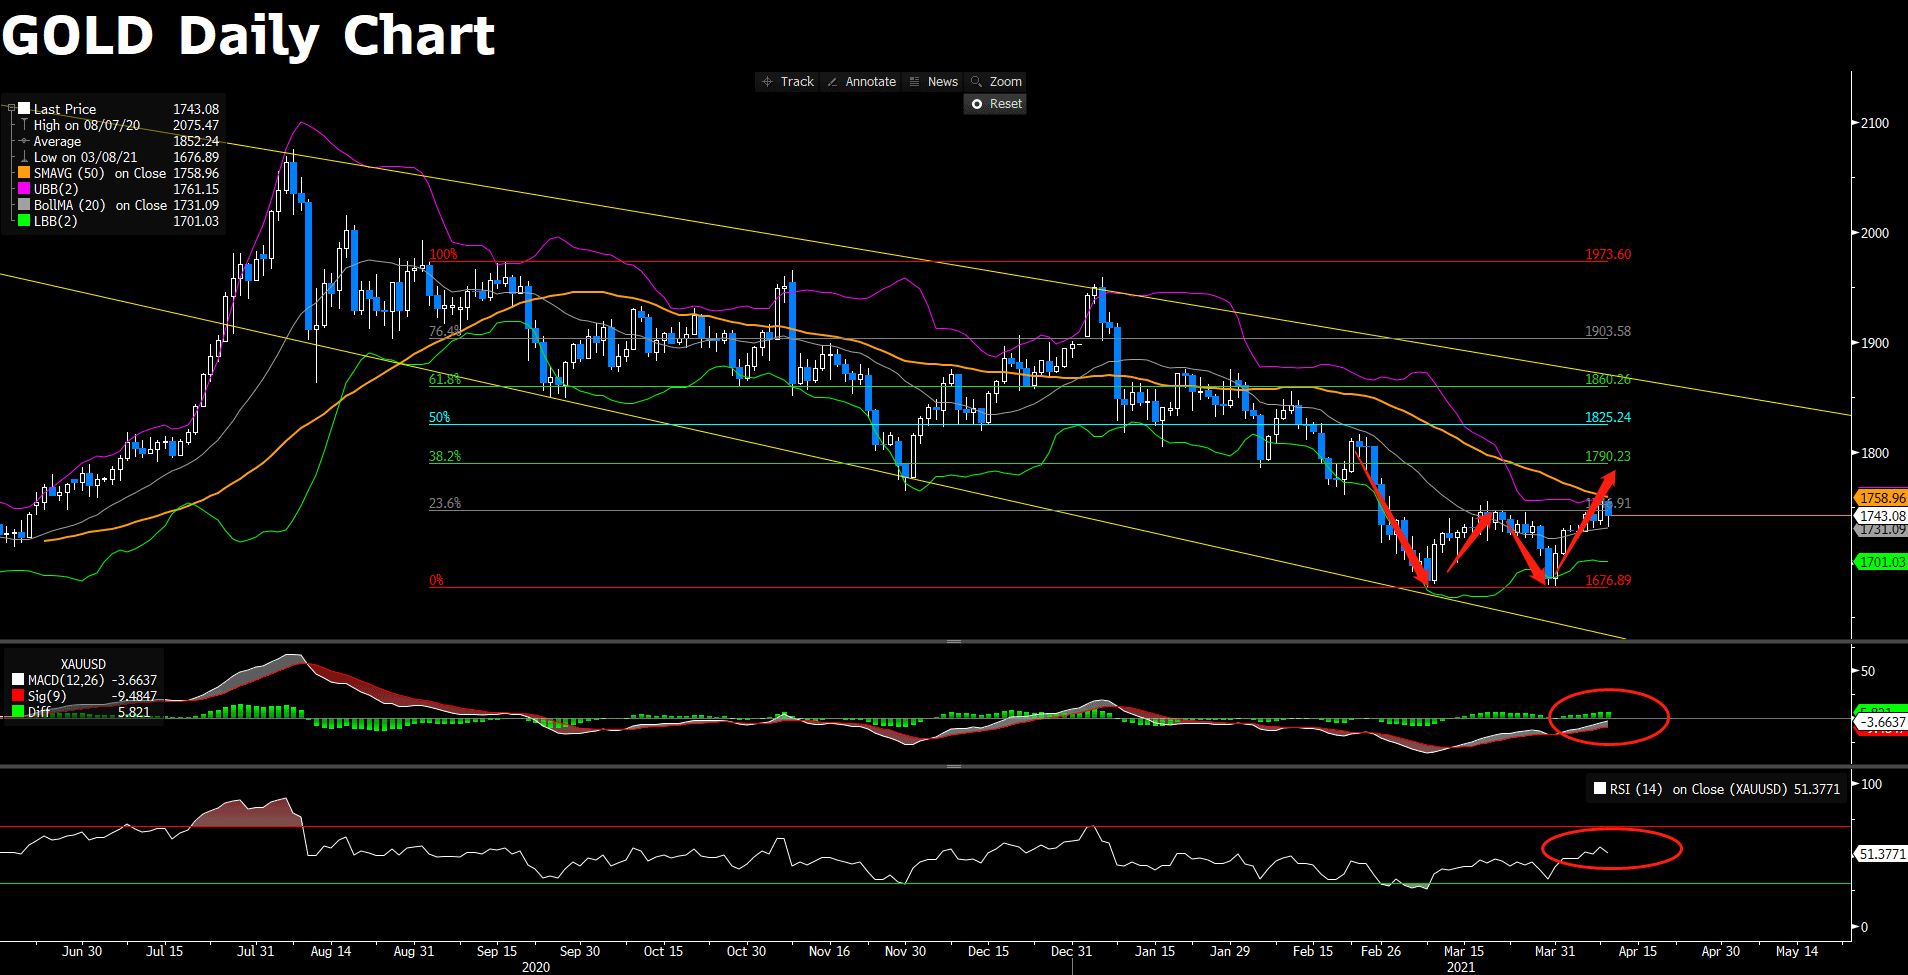
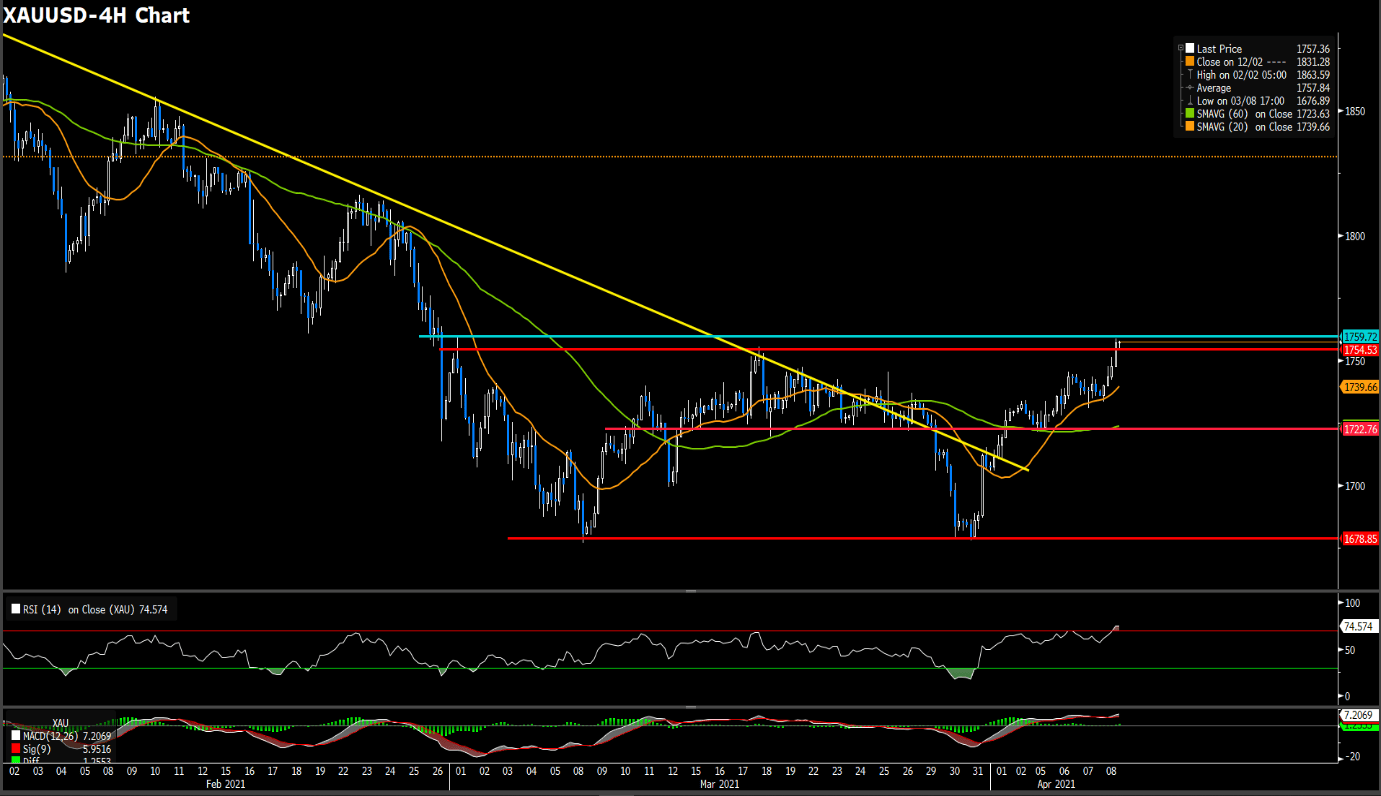
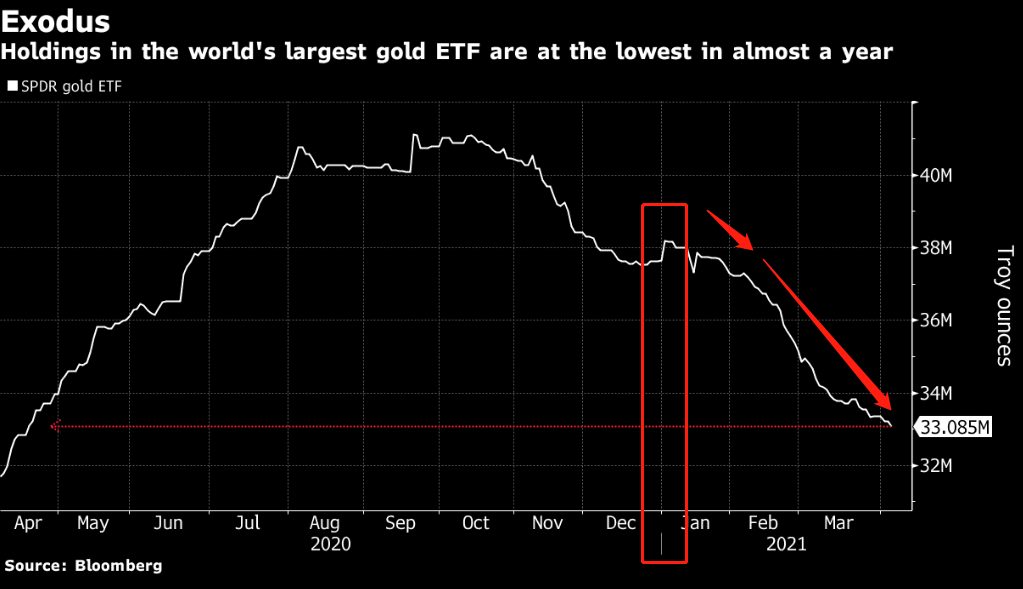
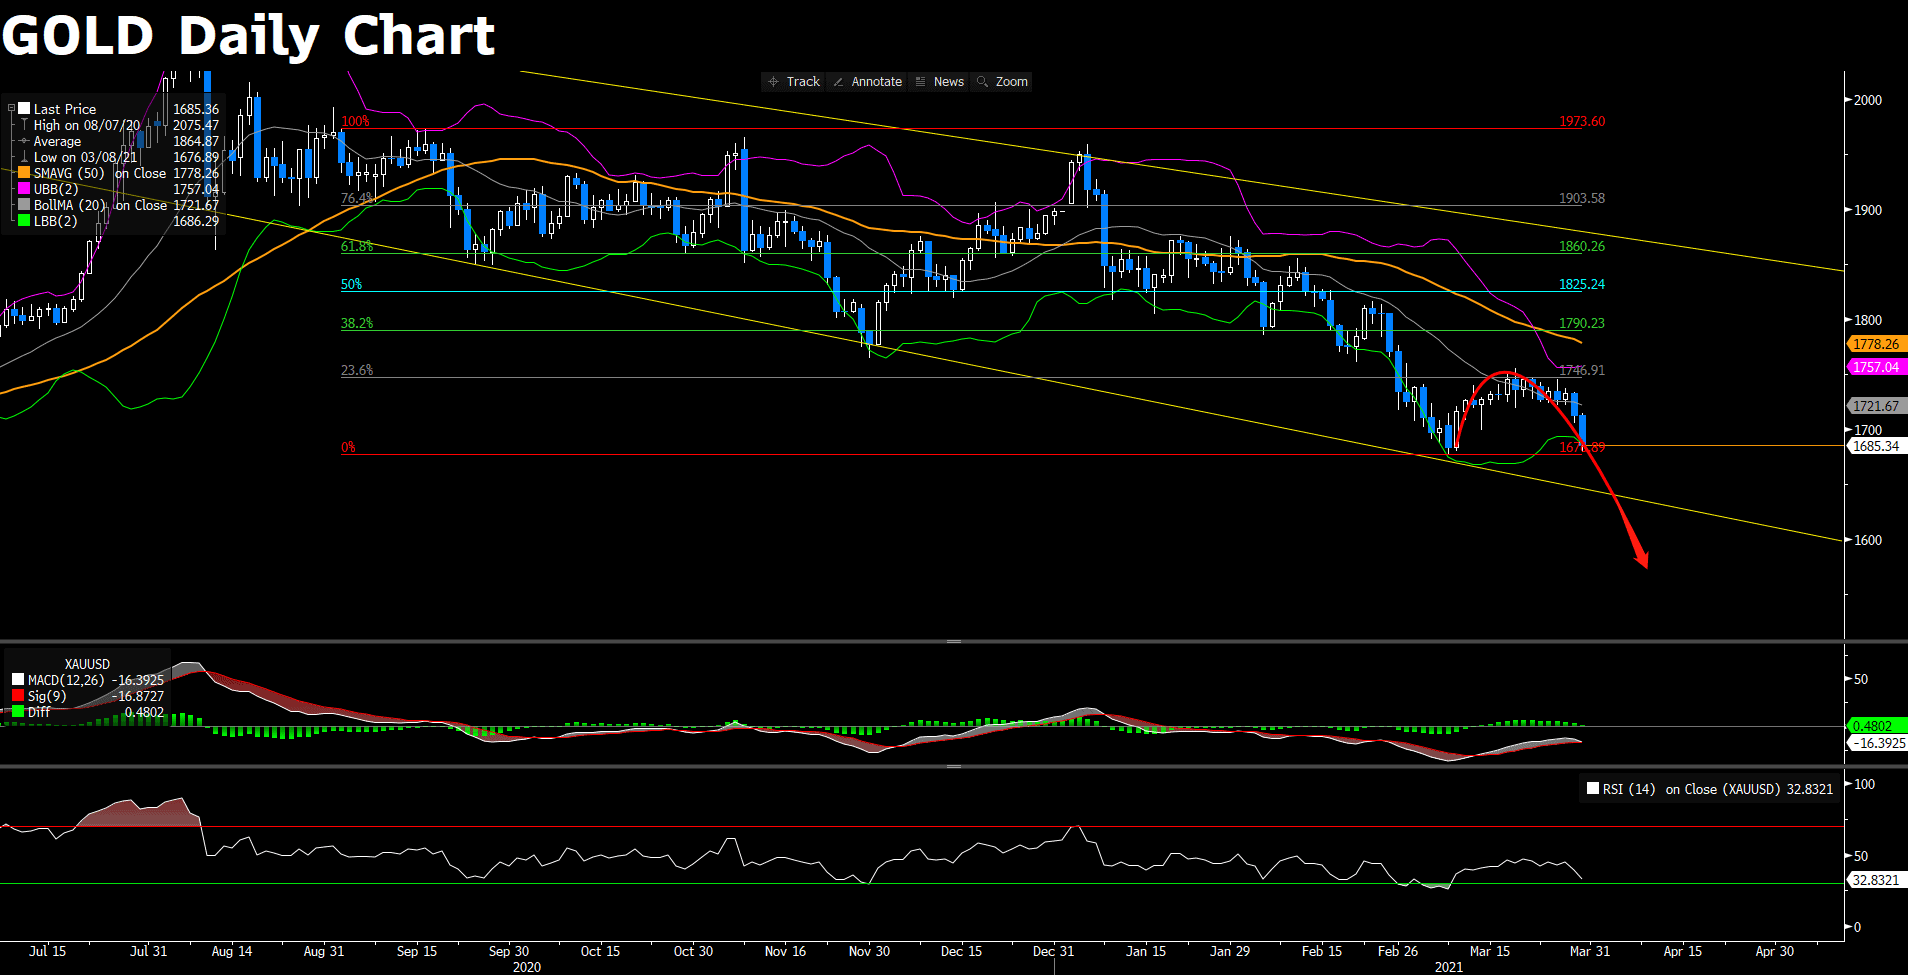
After clinging on the resistance level of $1746.91, Gold eventually breaks above the obstacle. On the daily chart, a double bottom pattern has been formed, indicating a buy and bullish signal. As the time of writing, former resistance $1746.91 now acts as a strong support pivot, possibly pushing gold toward the next resistance at $1790.23. Moreover, the MACD continunes to lend support to bulls whilst the RSI has not yet reached the overbought territory, giving gold more room to extend further north.
Resistance: 1790.23, 1825.24, 1860.26
Support: 1746.91, 1676.89
Economic Data
|
Currency |
Data |
Time (GMT + 8) |
Forecast |
||||
|
EUR |
Retail Sales (MoM) (Feb) |
1.5% |
-5.9% |
||||
|
BRL |
BCB Focus Market Readout |
N/A |
1360 B |
||||
|
INR |
CPI (YoY) (Mar) |
5.40% |
5.03% |
||||
|
CAD |
BoC Business Outlook Survey |
N/A |
N/A |
||||