Daily Market Analysis
Market Focus
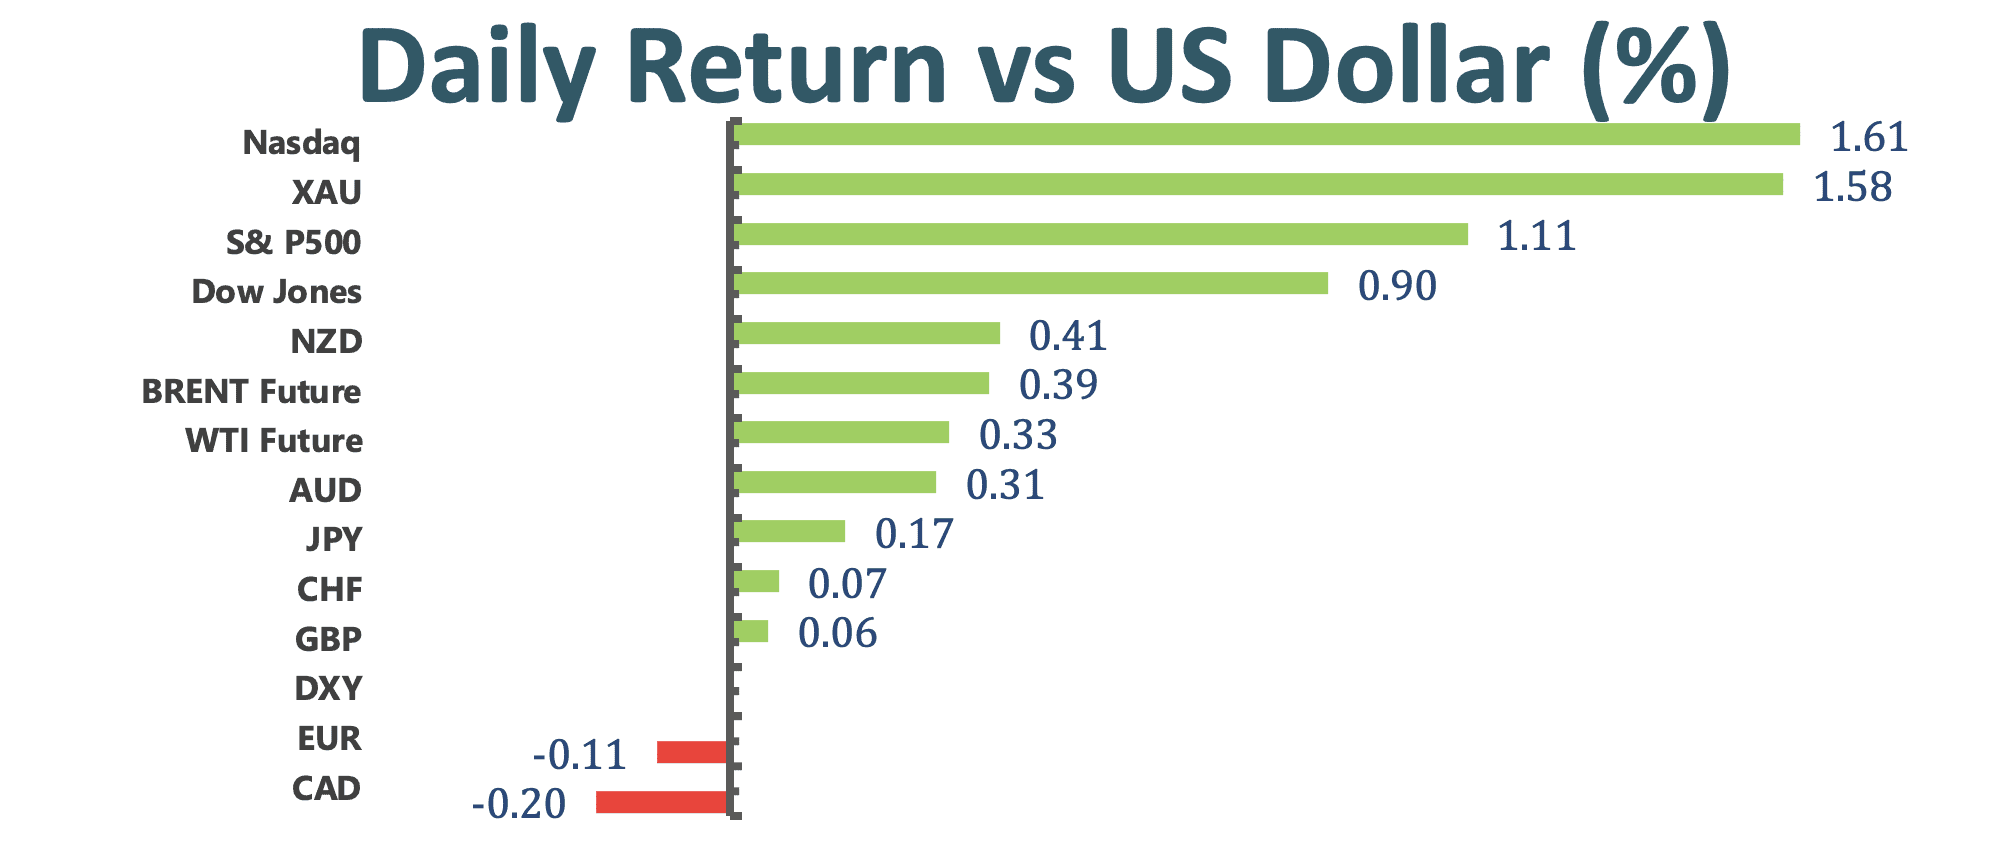
US stocks market declined from an all- term high as investors waited for the warning season later in the week. Technology shares declined, led by Tesla Inc; Tesla contributed the most to the decline as one of its cars that happened to crash and kill two passengers. At the end of the day, the Dow Jones Industrial Average fell 123 points; the Nasdaq dropped 1% while the S&P 500 declined 0.5%.
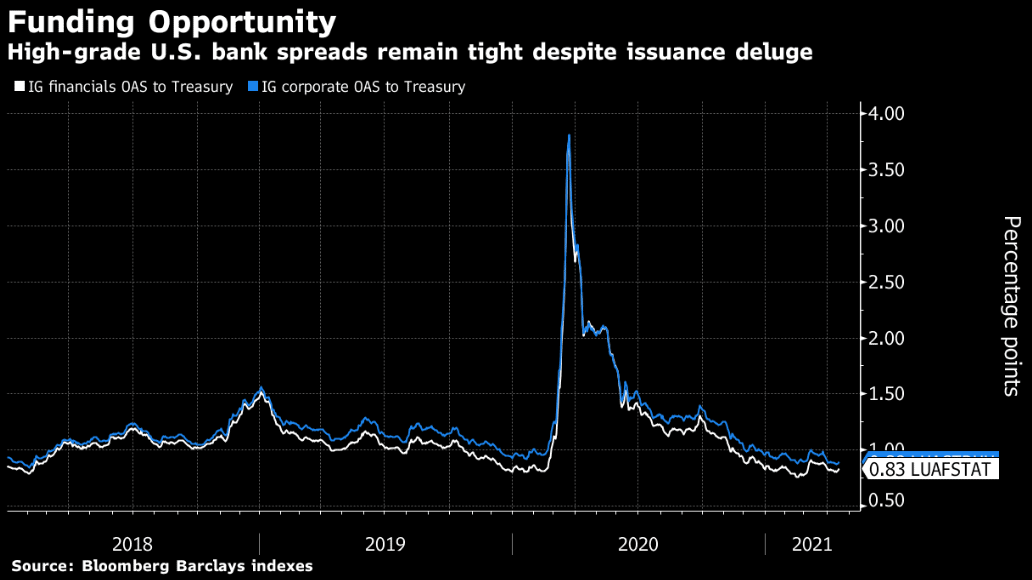
American banks are cashing in on strong earnings to raise more debt at low rates. Banks are raising debt in bond market today. Such banks like Morgan Stanley, who launched a $7.5 billion bond sale with JPMorgan. With bond rates creeping up, issuers may prefer to front load borrowing rather than spread it out over the course of a year.
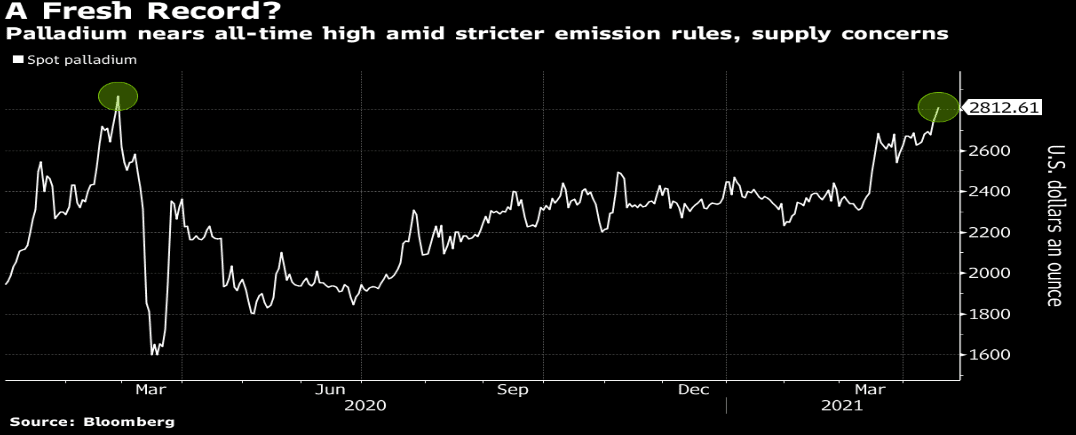
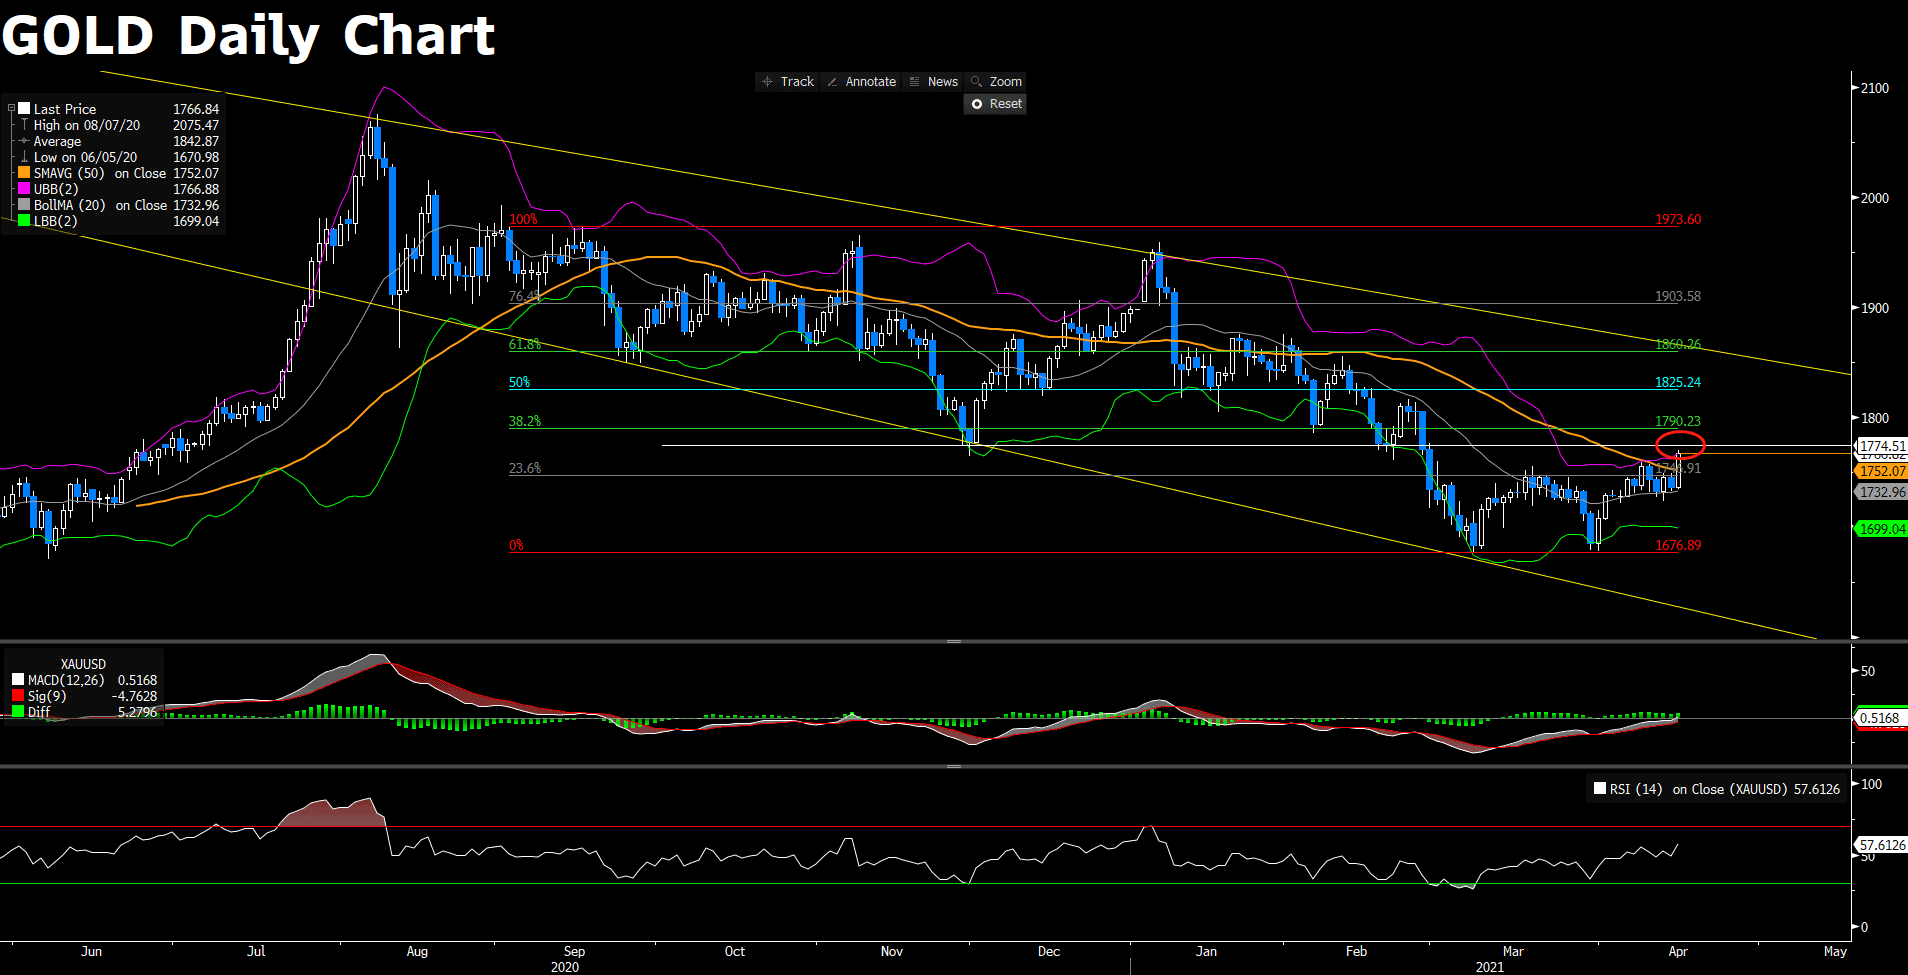
Emission- curbing metal, Palladium is on the way to its fresh record high as demand is getting back from restocking by automakers, who use palladium to build catalytic converters. As the economic recovery is getting better, restocking is expected to start taking place in the second half of 2020.
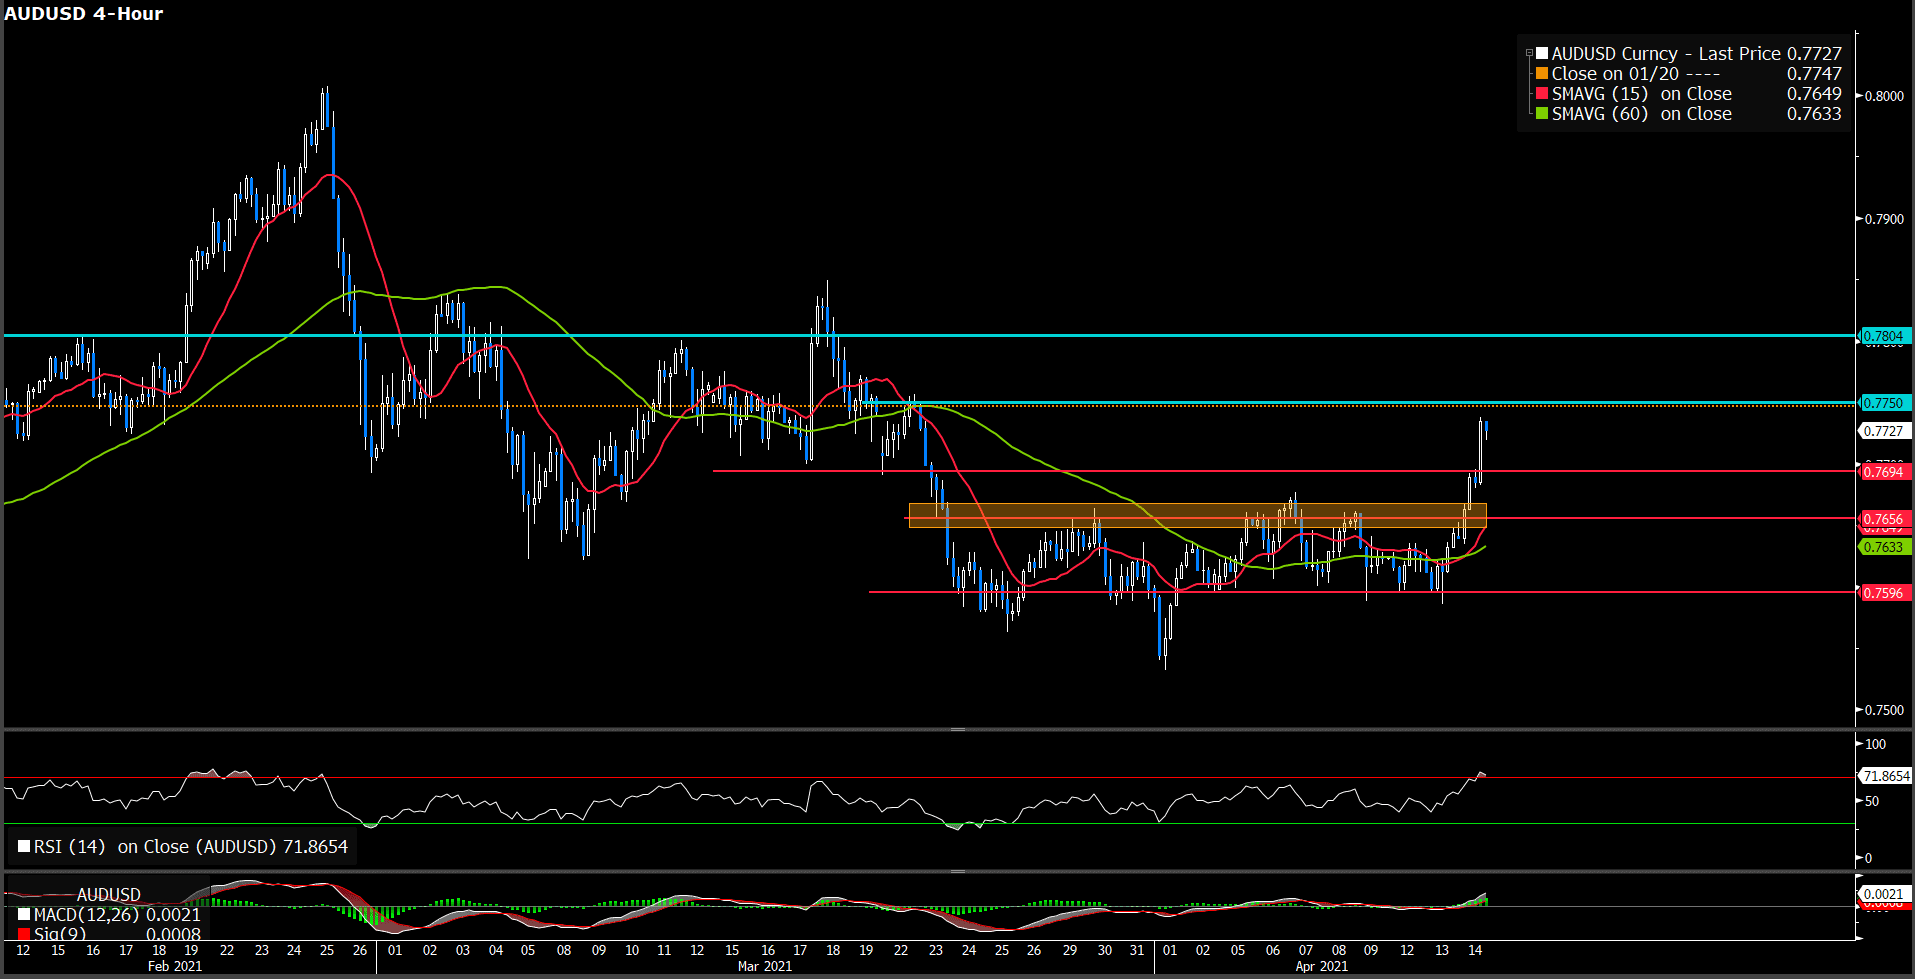
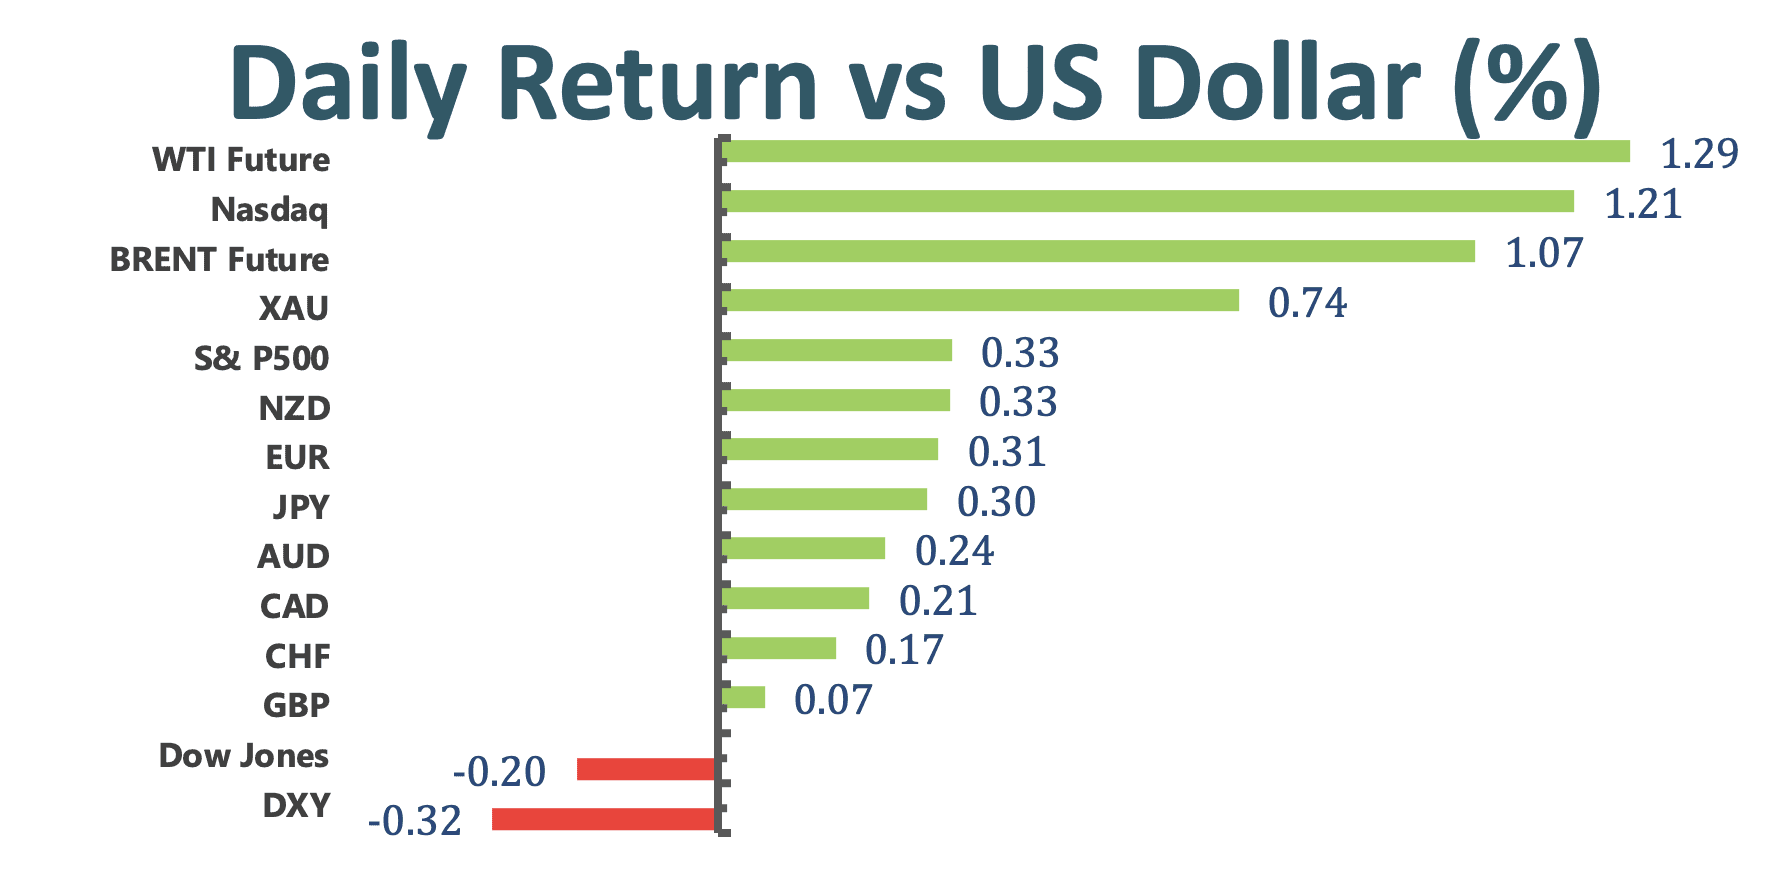
Main Pairs Movement:
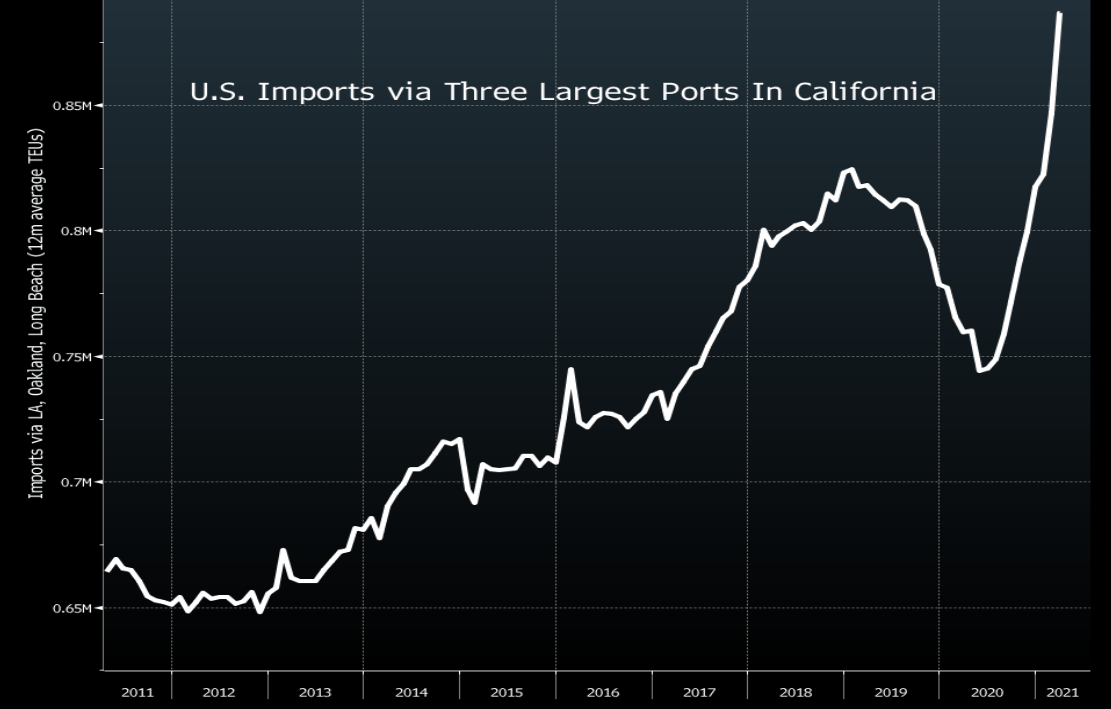
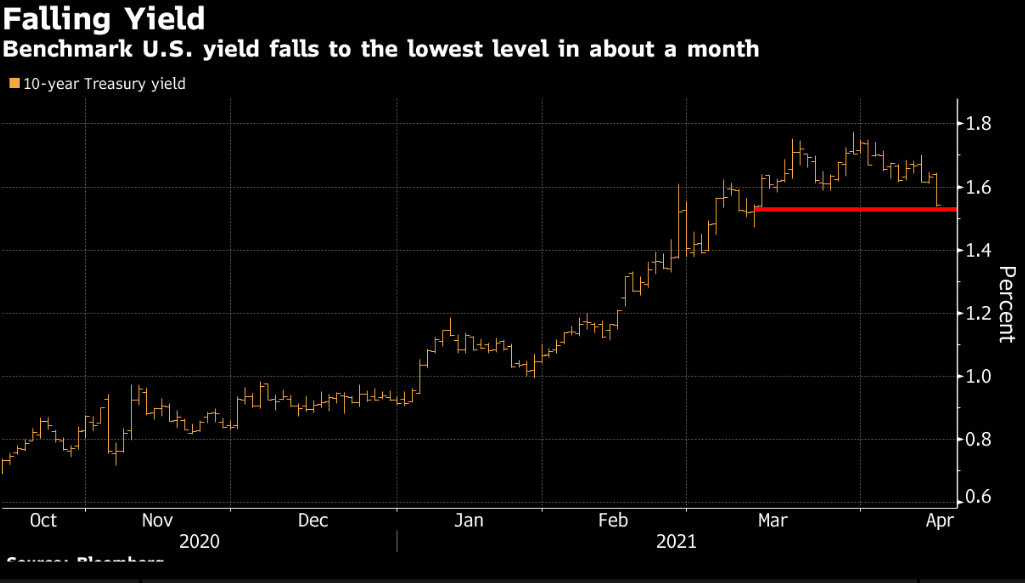
Surge in imports at US ports becomes one of reasons to drag the US dollar down. With the Federal Reserve decided to stay course in the next coming months, the deterioration in trade deficits might undermine the US dollar, strengthening the dollar negative narrative. One of the examples is the surge of imports at the largest US ports on the west coast, implying that trade deficits are essentially widening fast. The diagram below has shown that imports have significantly increased.
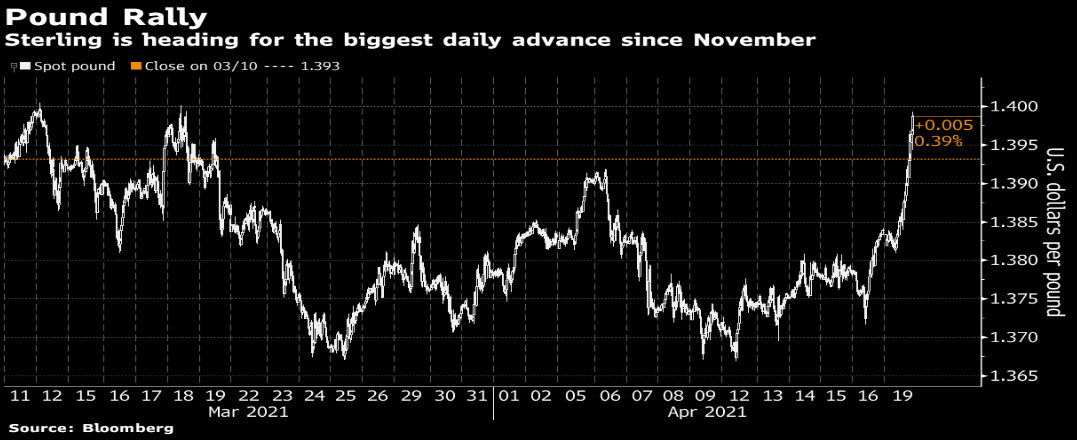
The British Pound is up more than1.1% against the US dollar, aiming for February’s high above $1.42. The rally in the British Pound seems to have taken on a life of its own. Pound’s self- rally can be seen by the rising euro and falling dollar dichotomy, but pound’s rising momentum now seems to have taken on its own rocket ride. The bulls in the British Pound can possibly be the reason that the UK was able to quickly inoculate its people, and at the same time be able to reopen its economy with a fast pace.
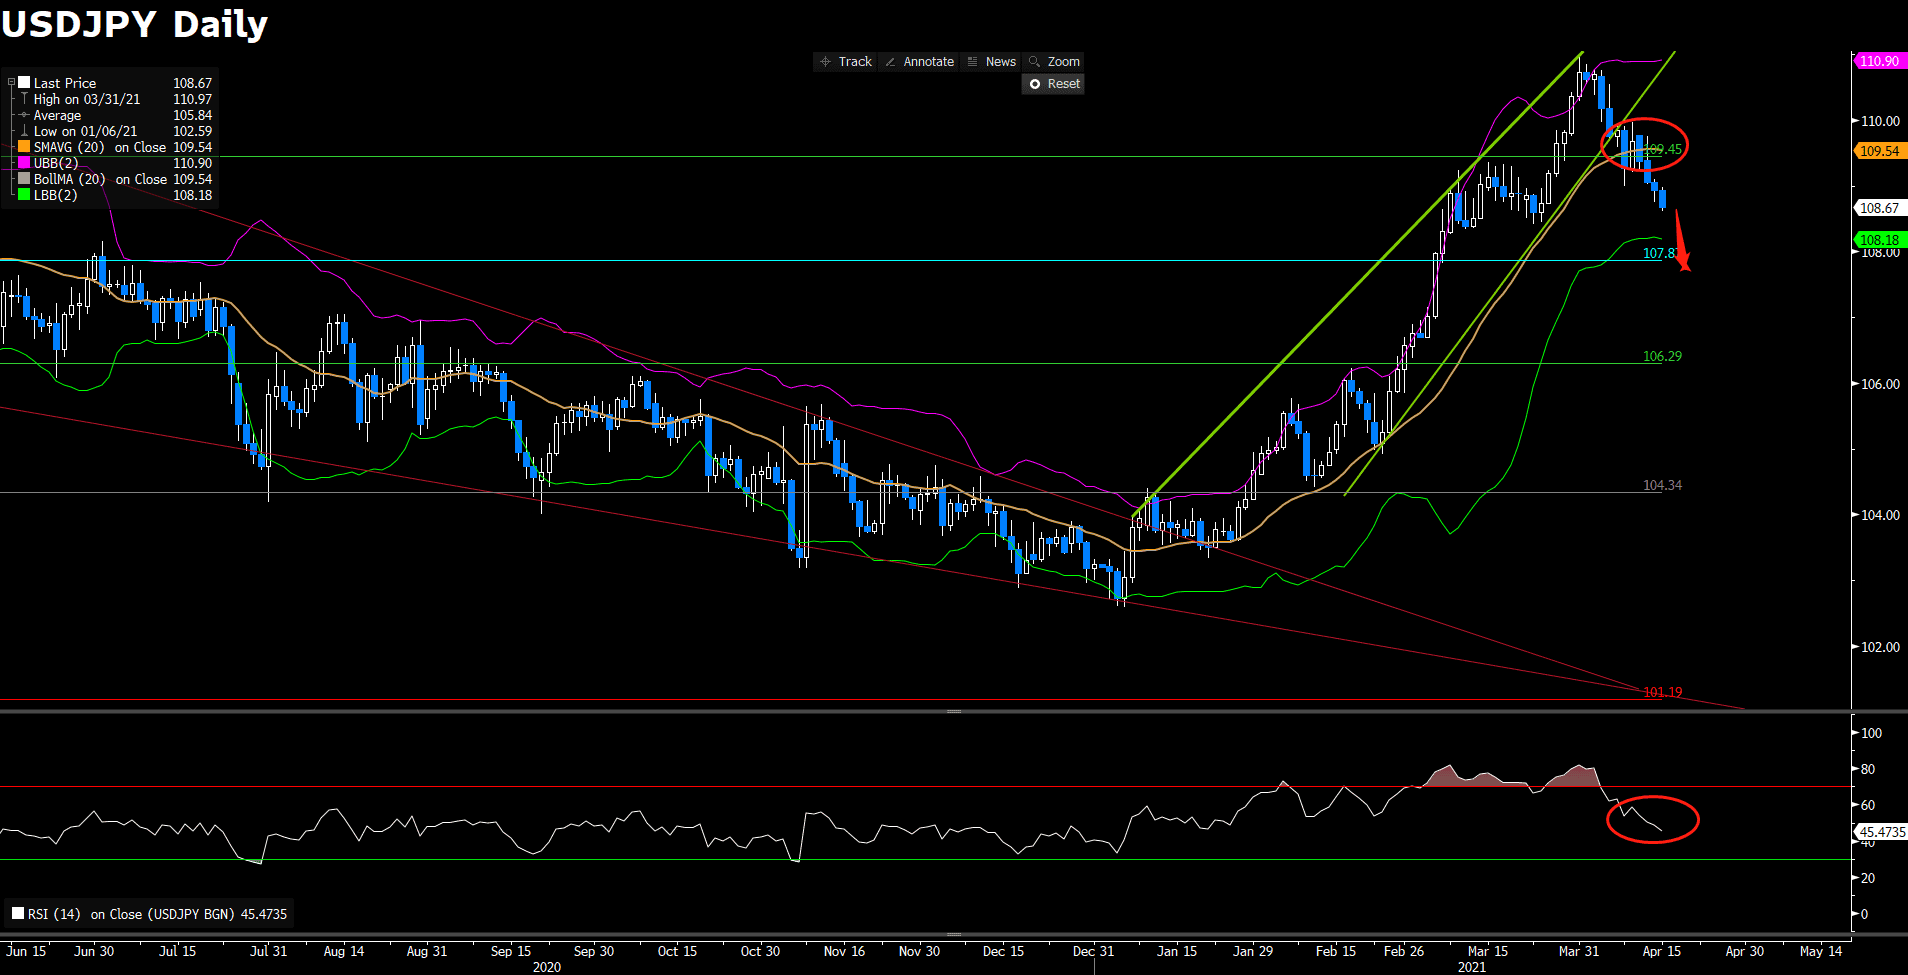
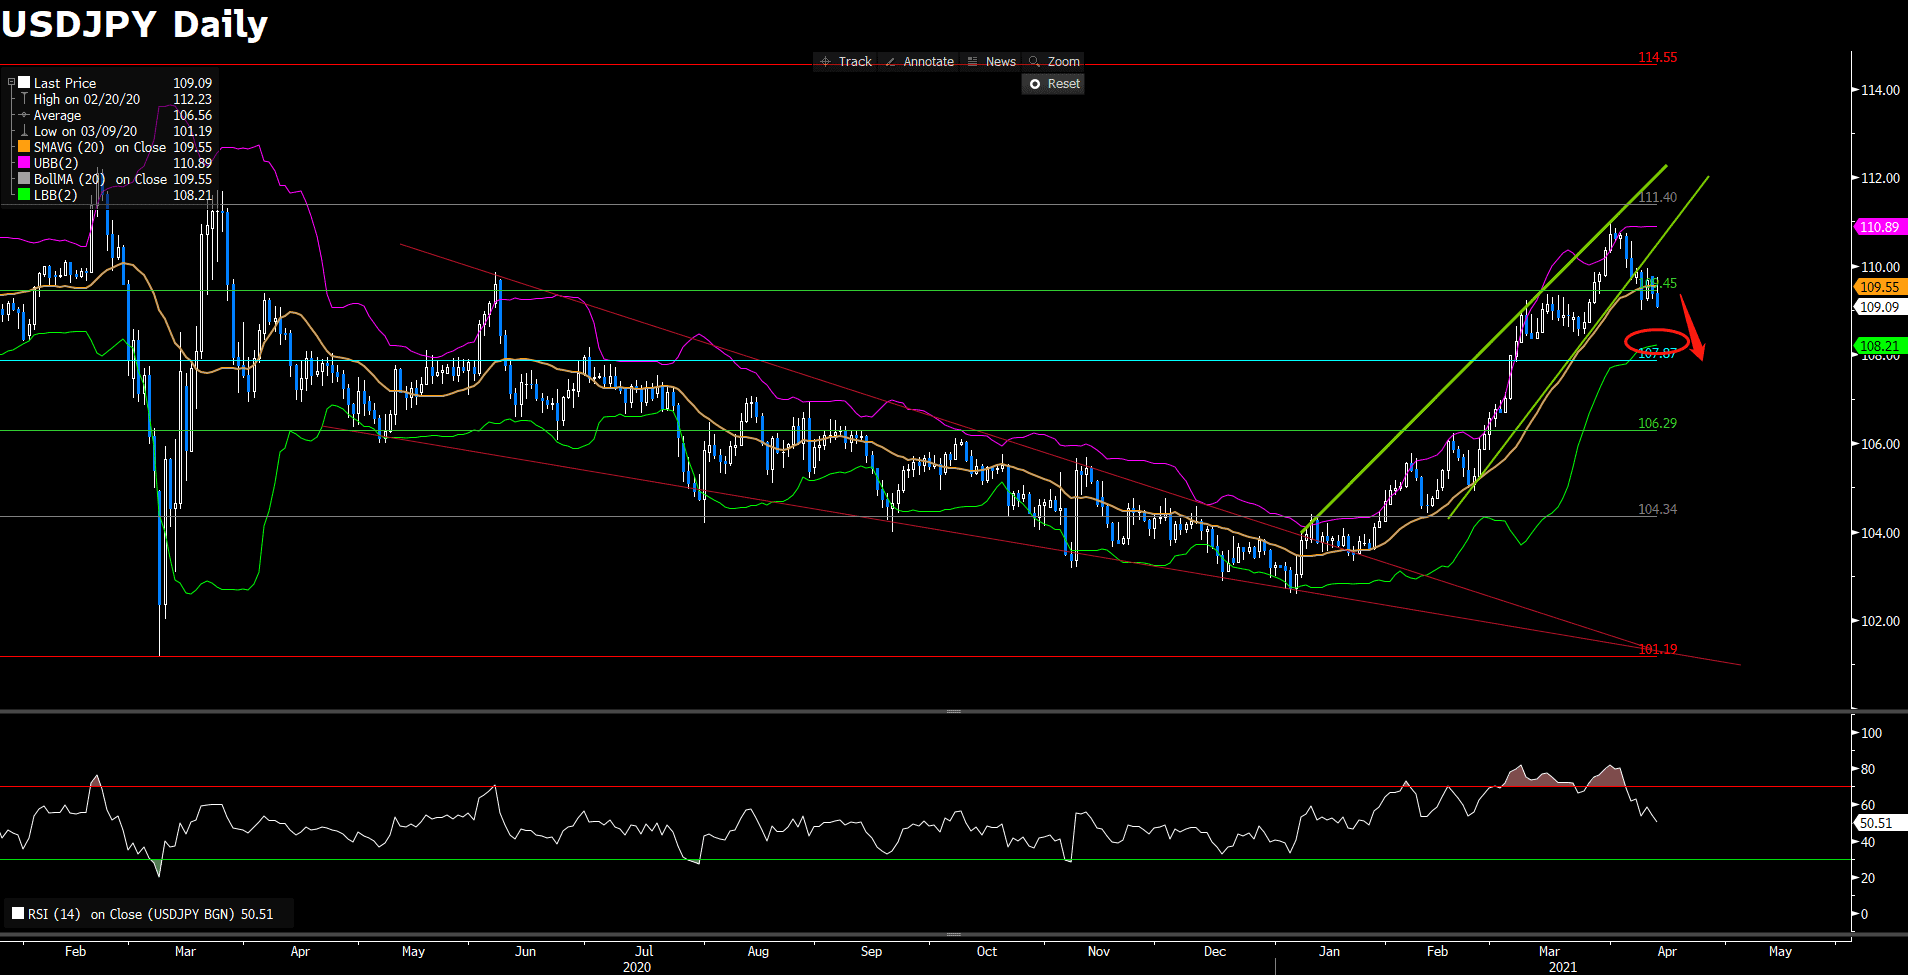
The Japanese Yen is on the way to knock on the door of the major level, 108, against the US dollar. The rally seems to be mostly based on safe- haven demand, the Yen. And one of the possible moves might be the geological risks that the current crisis in Myanmar, which most relevant to the Japanese Yen. At the same time, another possible story might be that Japanese life insurers are starting a new year and determining whether or not to hedge their currency risk.

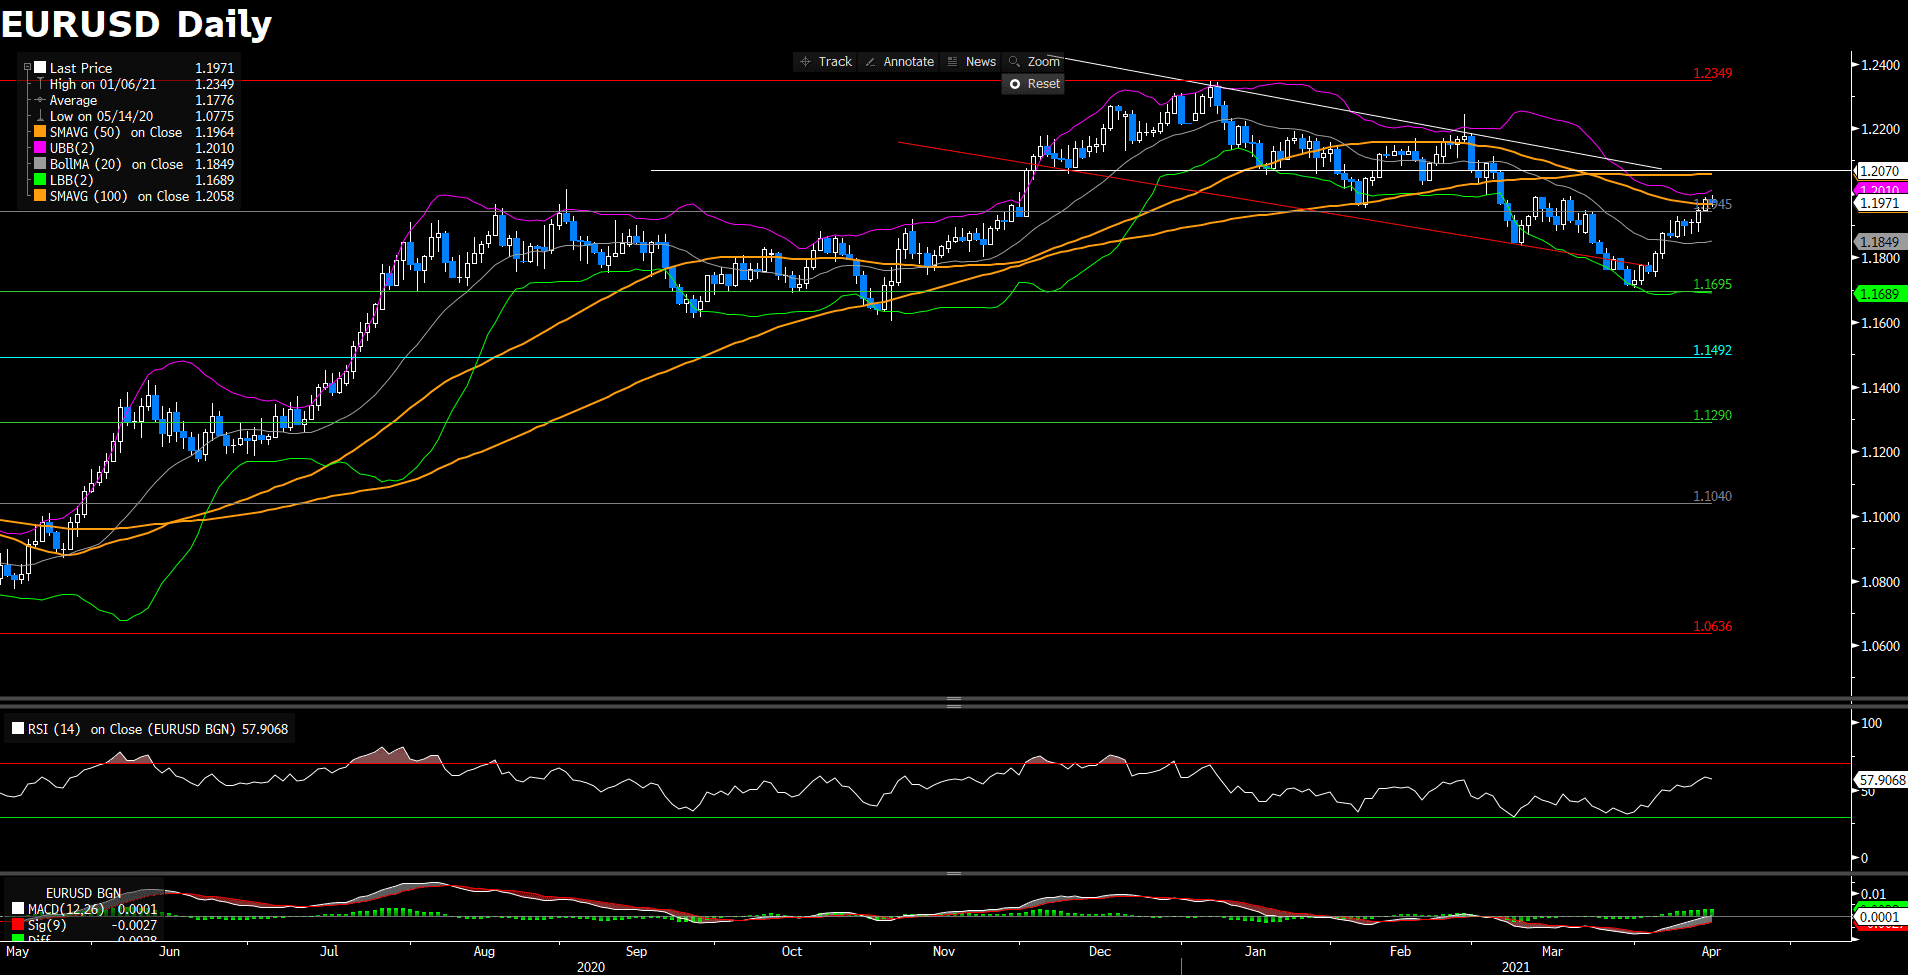
The EURUSD climbs above 1.20 level as the US dollar falls even though the US yields rise. Optimism about European region’s vaccination campaign has played a big role to help the bulls in the euro dollar.
Technical Analysis:
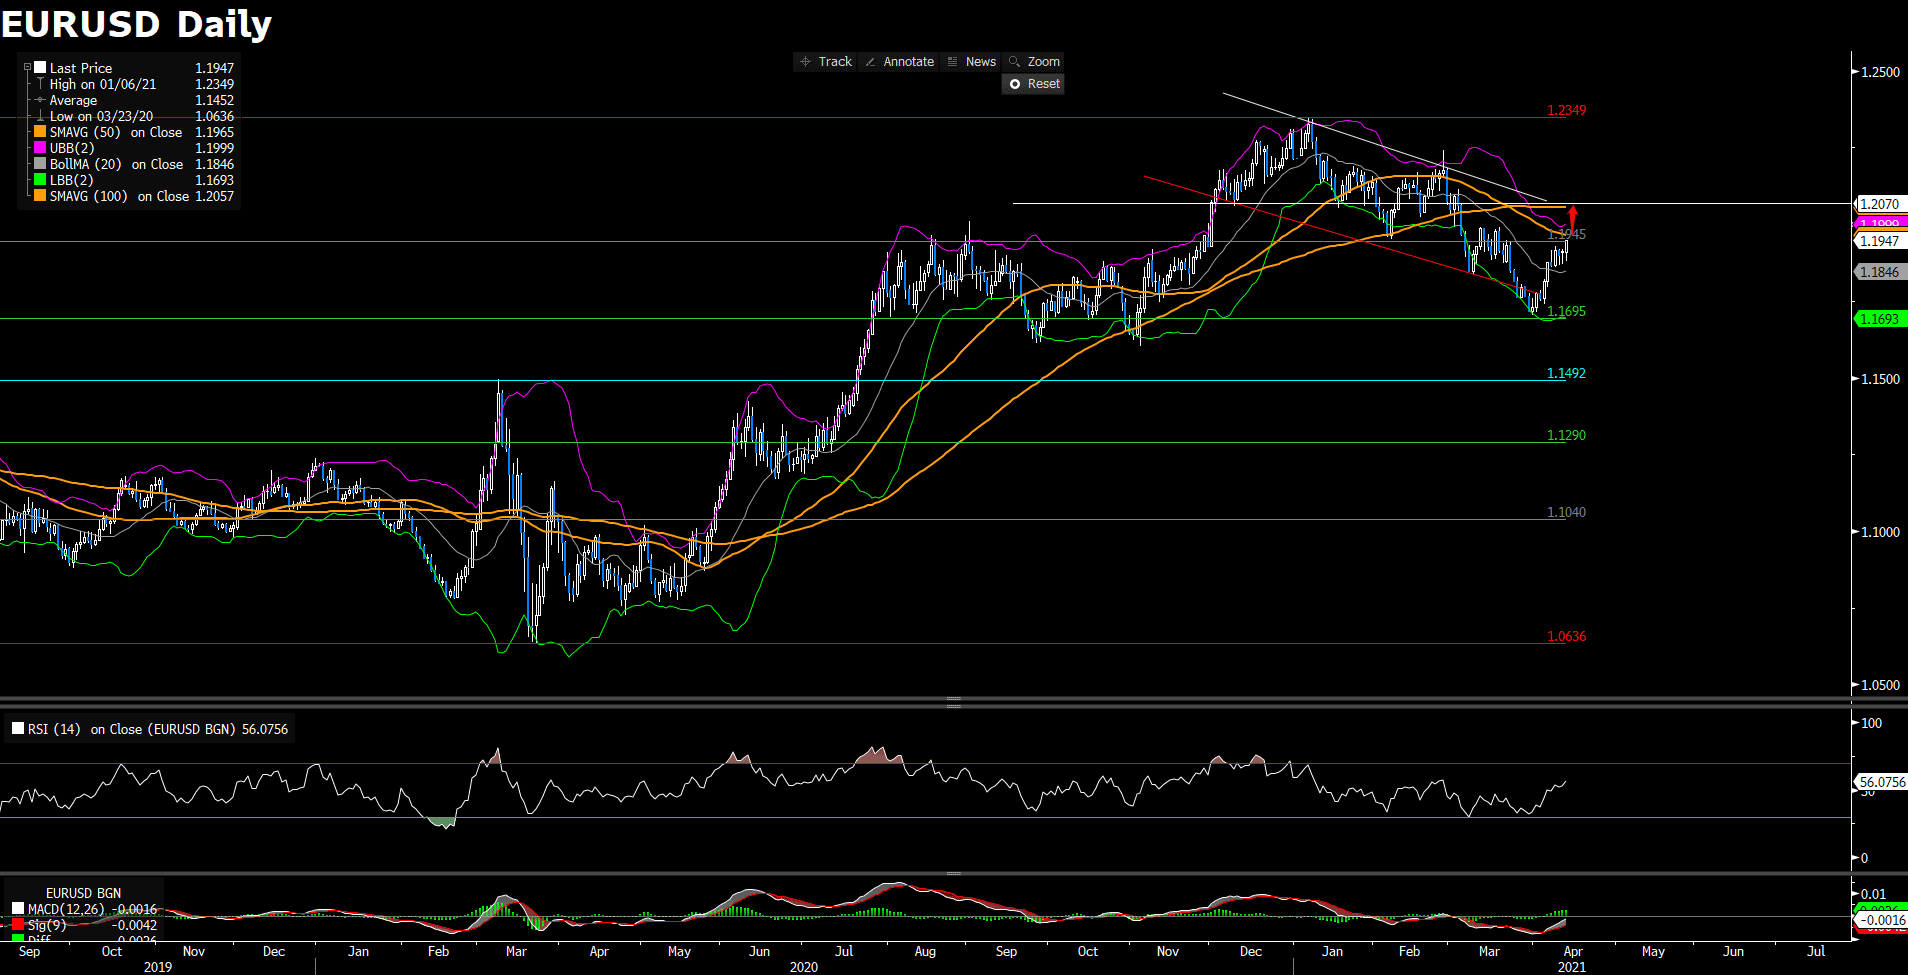
EURUSD (Daily Chart)

EURUSD has shown that the bulls are in charge, currently trading at 1.2035. With its current bullish momentum, the pair is heading toward the next immediate resistance at 1.2070. If the pair can successfully breach the resistance, it will accelerate toward the next level at 1.2175 as the upward momentum will lead the pair trade above both 20 SMA and 50 SMA. Moreover, the technical indicator, the MACD continues to lend support to the bulls while the RSI has not yet reached the overbought condition. That being said, EURUSD still sustains its upward traction.
Resistance: 1.2070, 1.2349
Support: 1.1945, 1.1695, 1.1492
GPBUSD (4 Hour Chart)
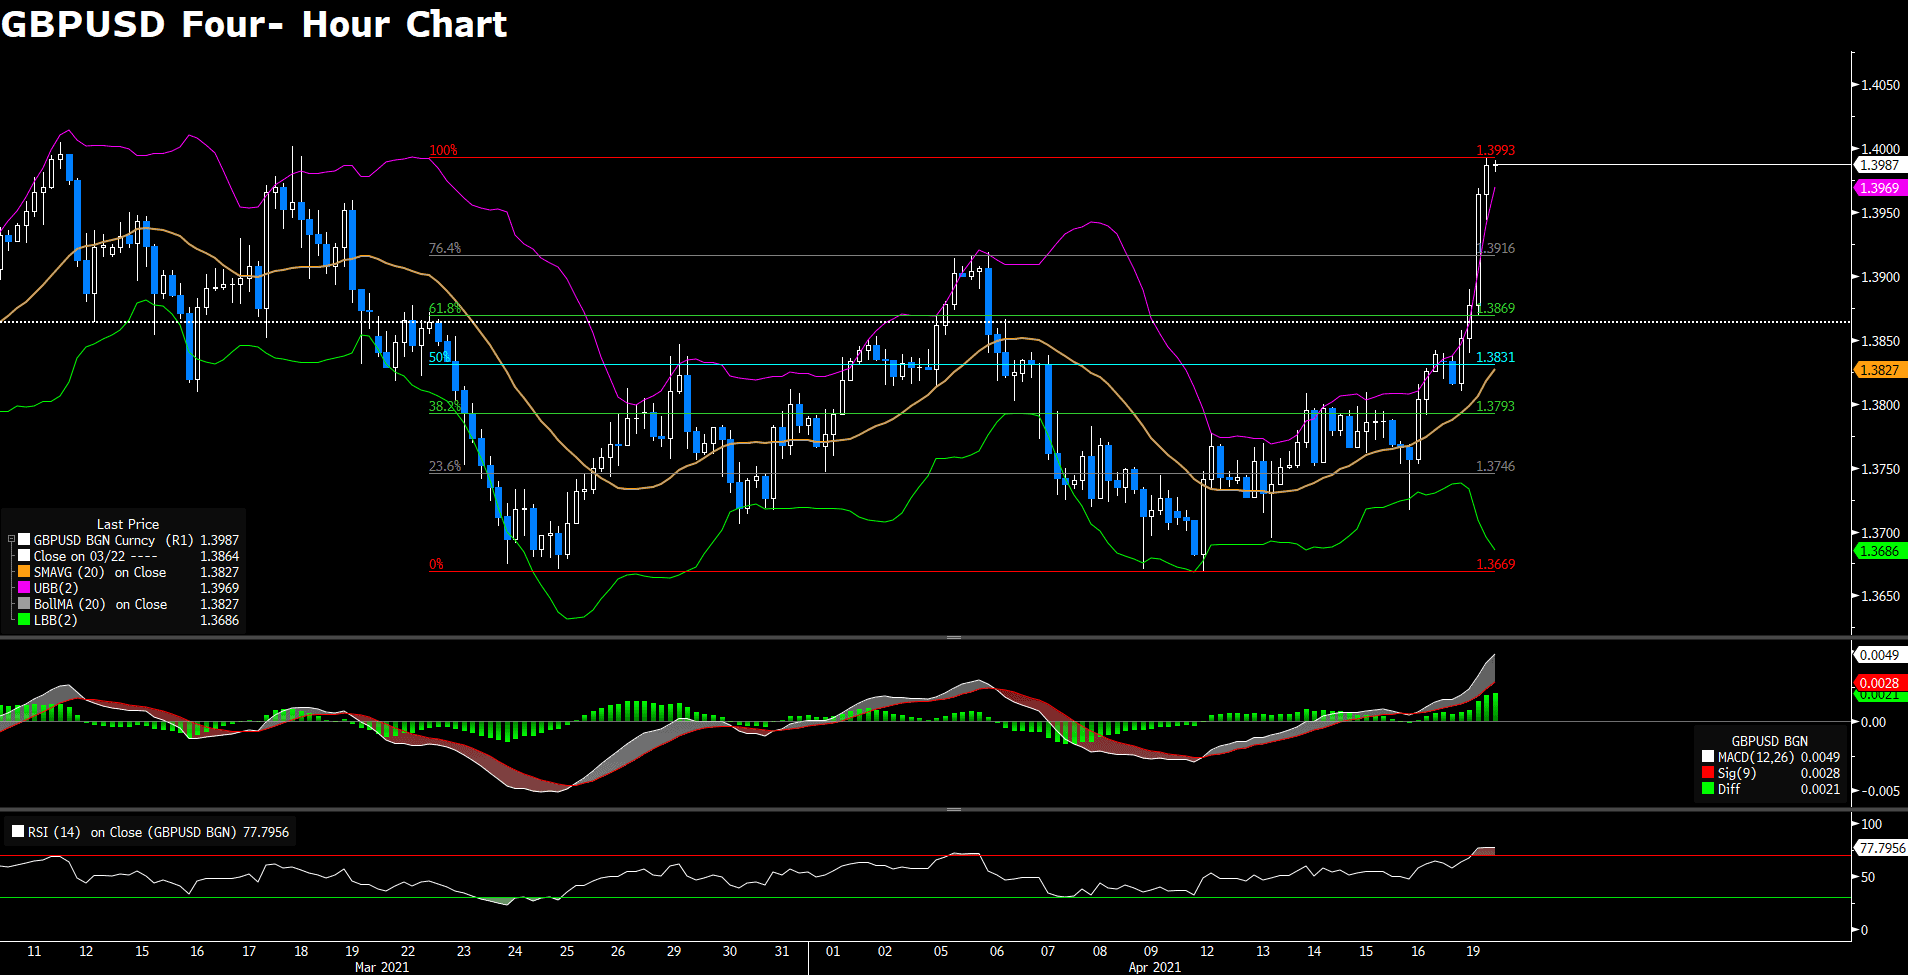
GBPUSD surges toward 1.40, extending its gain for a siixth consecutive day. However, in the near- term, its gain might pause as it nearly reaches the next immediate cap at 1.3993. At the same time, the RSI of 77 shows that the pair is extremely overbought despite of the MACD’s bullish signal remains very strong. In a bigger outlook, GBPUSD retains its bullish momentum since the pair has broken above its 200 SMA before rally over 150 pips while it is about 100 pips above the 50 SMA.
Resistance: 1.3993
Support: 1.3916, 1.3869, 1.3831
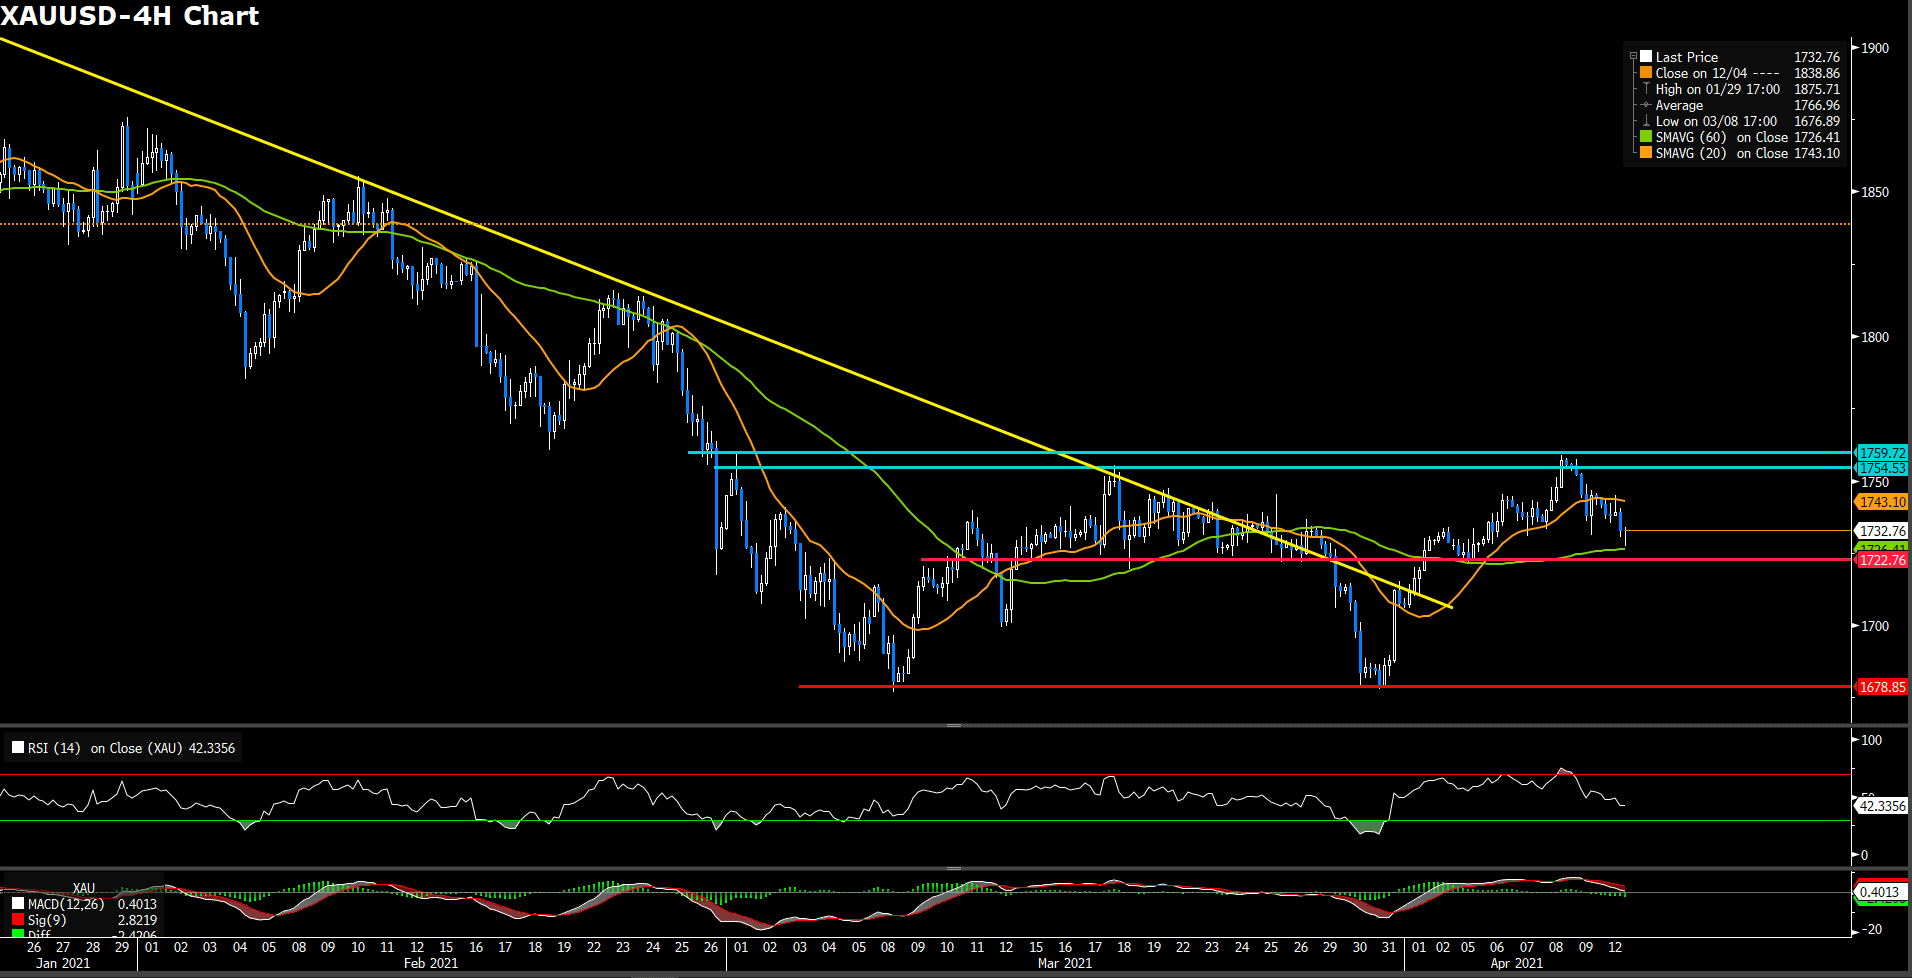
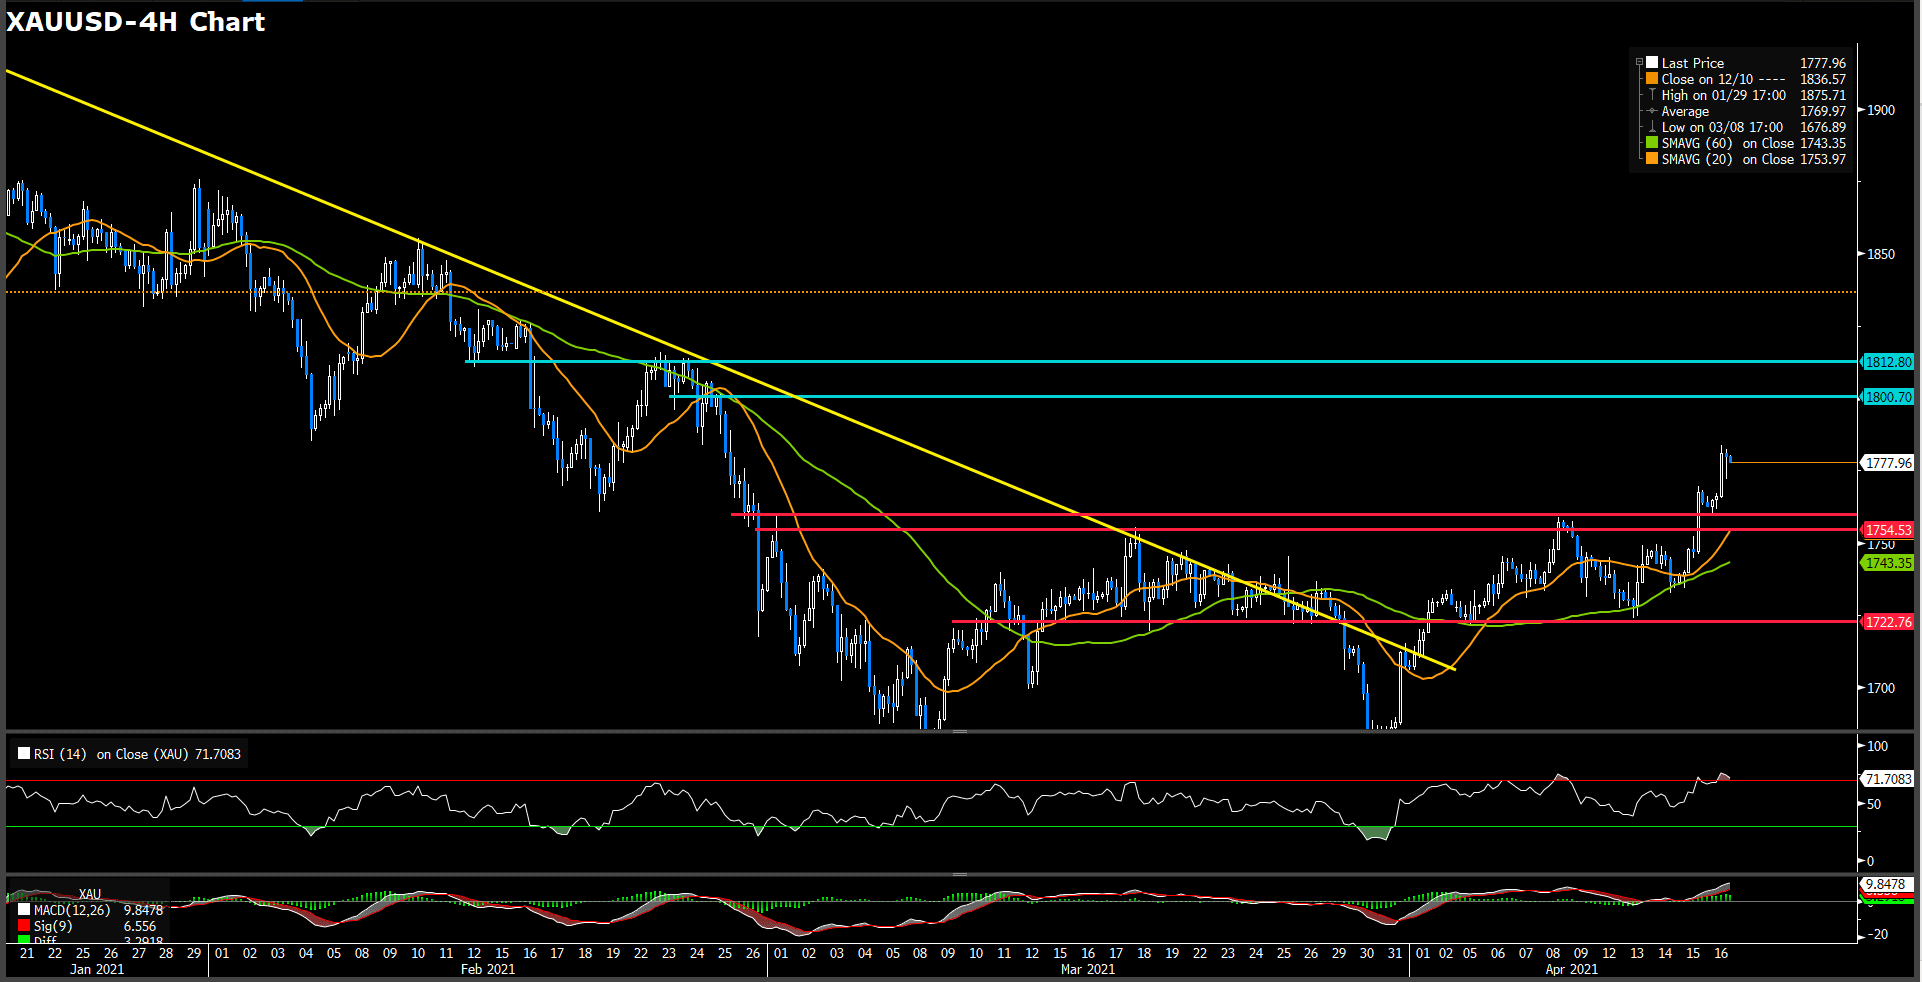
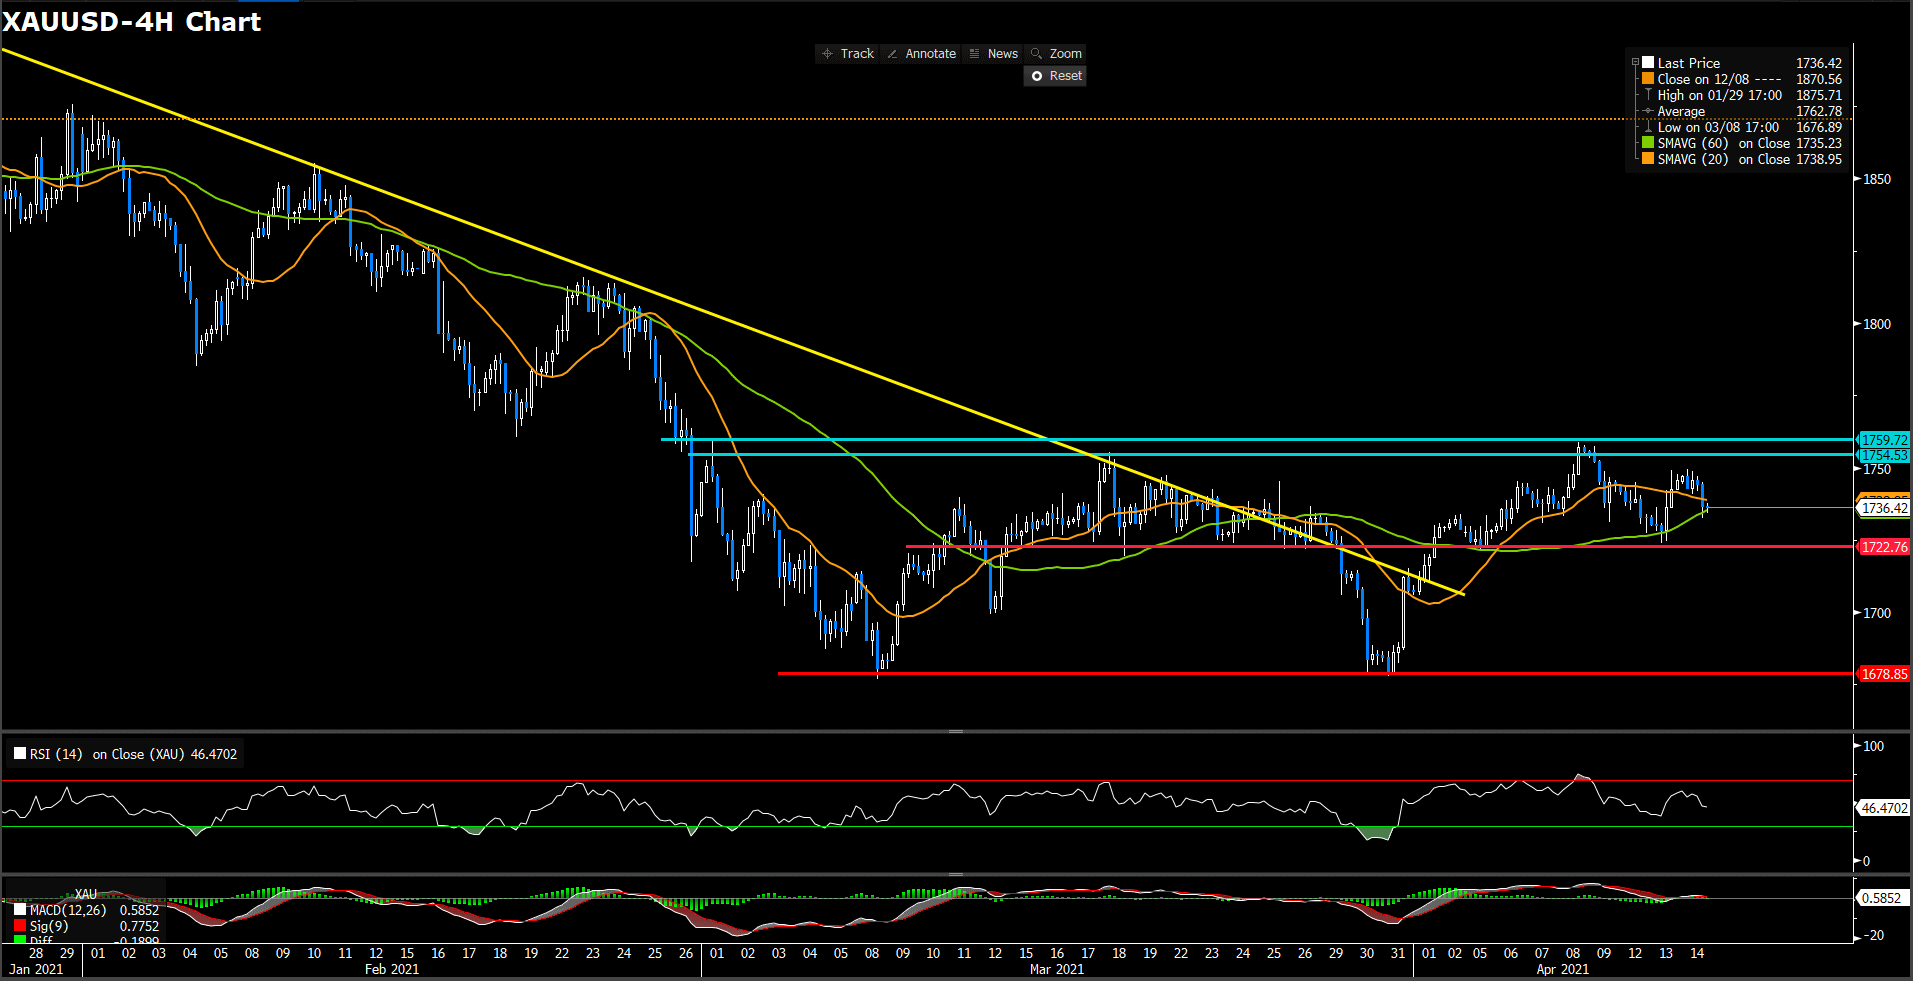
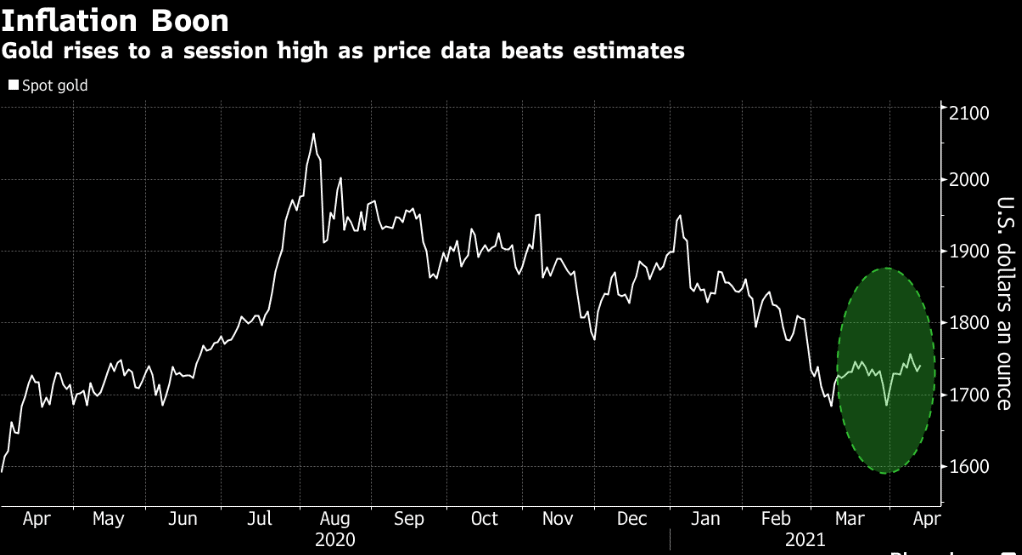
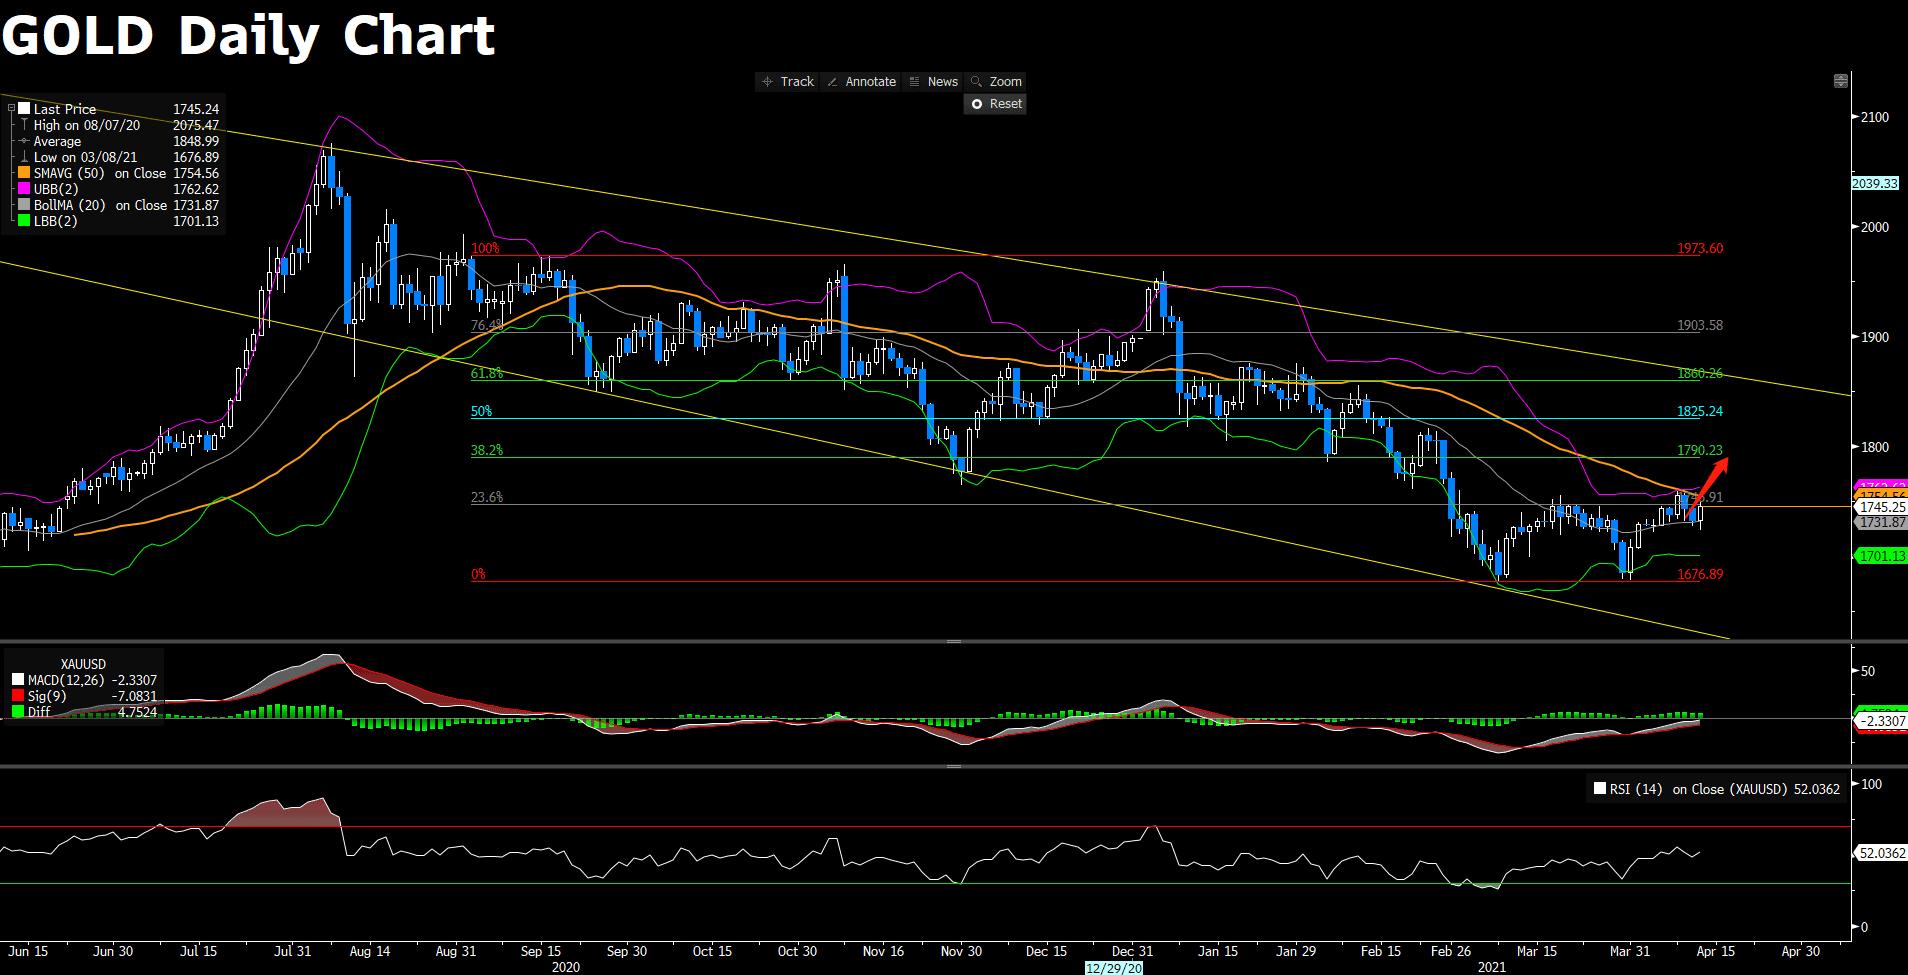
XAUUSD (Daily Chart)
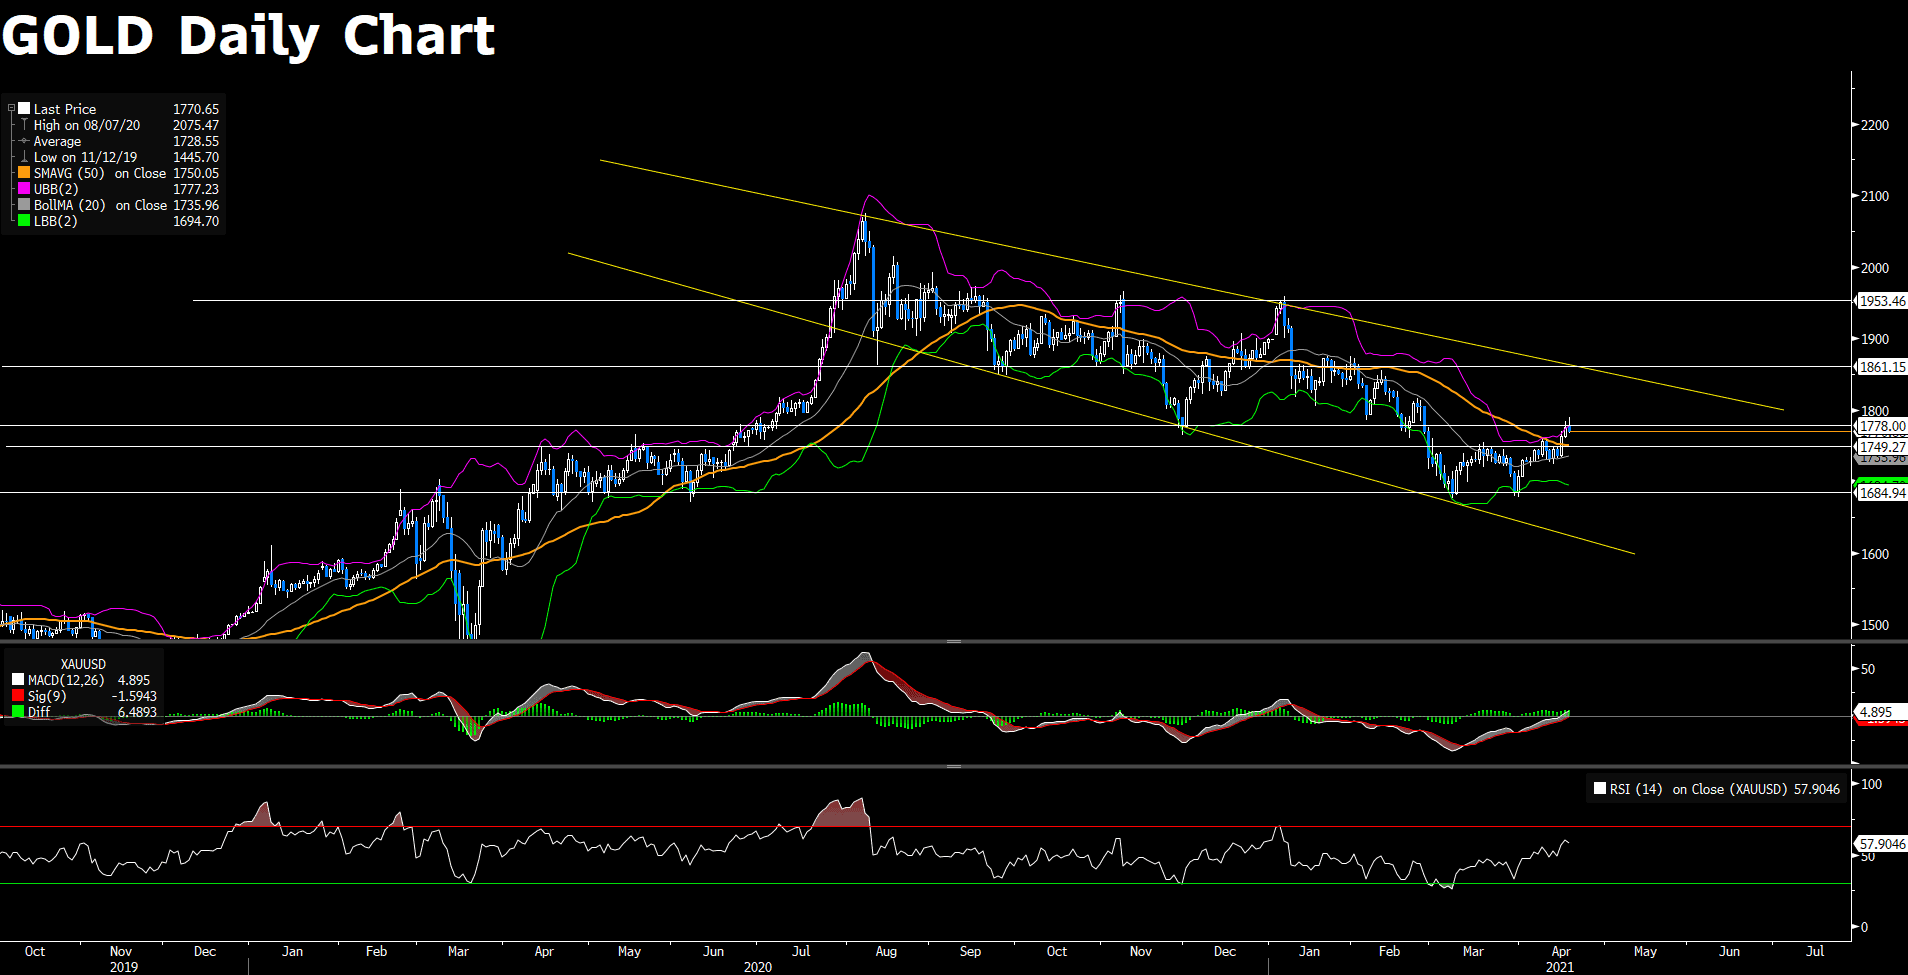
After contesting the initial hurdle at $1778, Gold faces the adjustment, currently trading at 1770.45. In the near- term, gold retains bullish as its upward momentum remains valid according to the technical indicators; the MACD continues to lend support to gold’s bulls while the RSI is outside of the oversold territory, giving the pair continuation to extend further north. At the moment, the pair is in the stage of adjustment since it has reached the upper band of Bollinger Band, suggesting a temportary pause for the upside trend. On the upside, if gold can once again breach the resistance at 1778, then it will open up a path toward the next resistance at 1861.15; to the downside, if gold fails to break through the hurdle, then the initial price range of the adjustment is expected to see in between 1778 and 1749.27.
Resistance: 1778, 1861.15, 1953.46
Support: 1749.27, 1684.94
Economic Data
|
Currency |
Data |
Time (GMT + 8) |
Forecast |
||||
|
AUD |
RBA Meeting Minutes |
09:30 |
N/A |
||||
|
CNY |
PBoC Loan Prime Rate |
09:30 |
N/A |
||||
|
GBP |
Average Earning Index + Bonus (Feb) |
14:00 |
4.8% |
||||
|
GBP |
Claimant Count Change (Mar) |
14:00 |
N/A |
||||


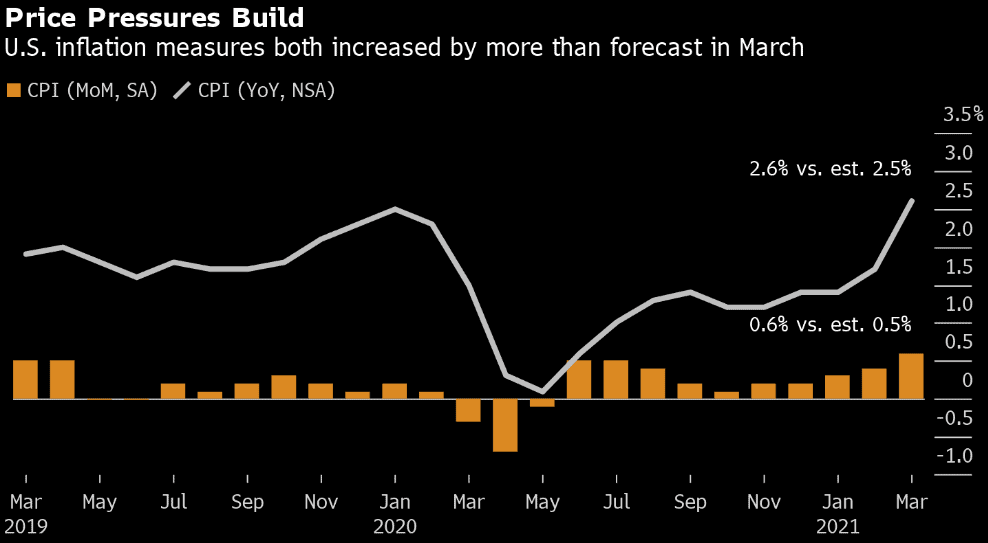
 At the same time, massive government spending and central-bank stimulus could stoke excessive inflation. In an interview aired Sunday with CBS’s 60 Minutes, Federal Reserve Chair Jerome Powell sought to provide reassurance that any surge in price pressures won’t last.
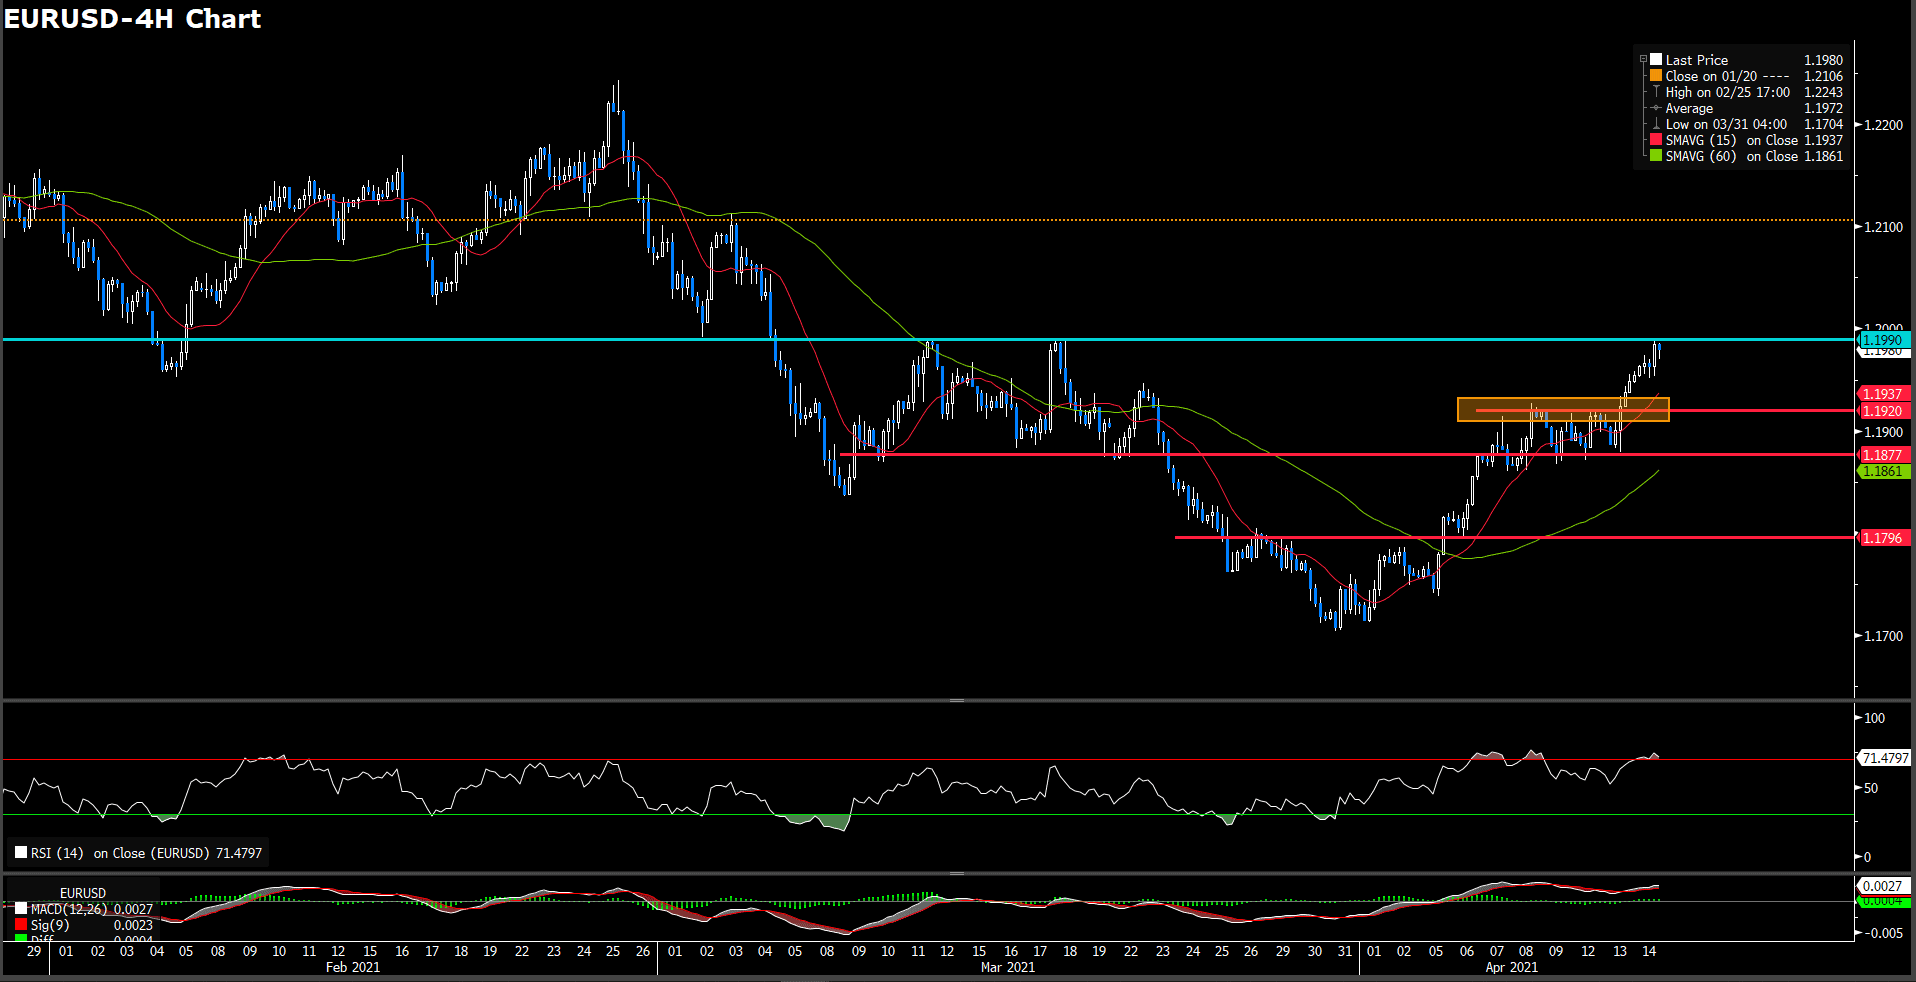
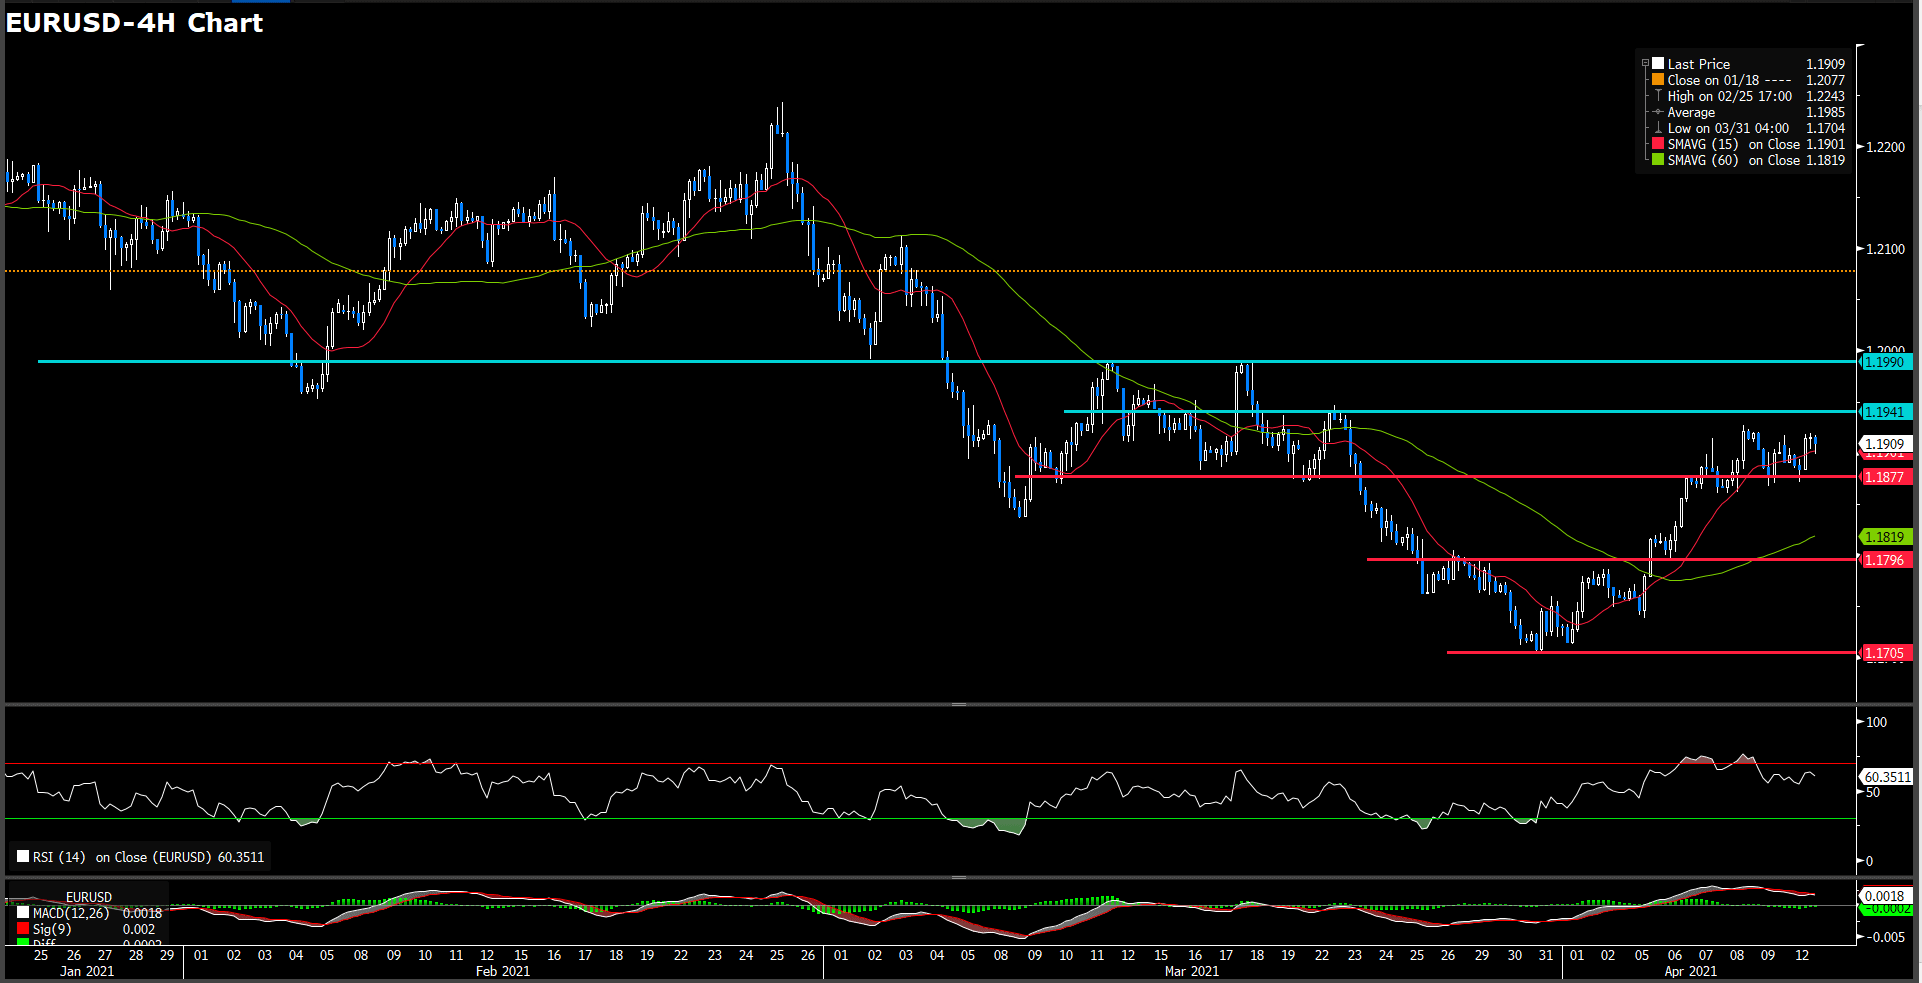 The euro dollar continue consolidation in tiny range between 1.194 and 1.1877 which accord our recently perspective, trading at 1.1908 as of writing. Earlier in the day, Eurostat revealed Retail Sales in February increased by 3% following January’s contraction of 5.2%. This data beat the market expectation of 1.5% and helped the shared currency stay resilient against its rivals. On RSI side, indicator shows 60 figure which suggest a bullish momentum for ongoing short term. On average price momentum perspective, 15 and 60-long SMAs remain it upward movement, yet 15-long SMAs turn flat sign.