Daily Market Analysis
Market Focus
An exhange-traded fund tracking the Nasdaq 100 Index jumped in late trading after Apple Inc. crushed revenue estimates and Facebook Inc. reported gains in sales and users.
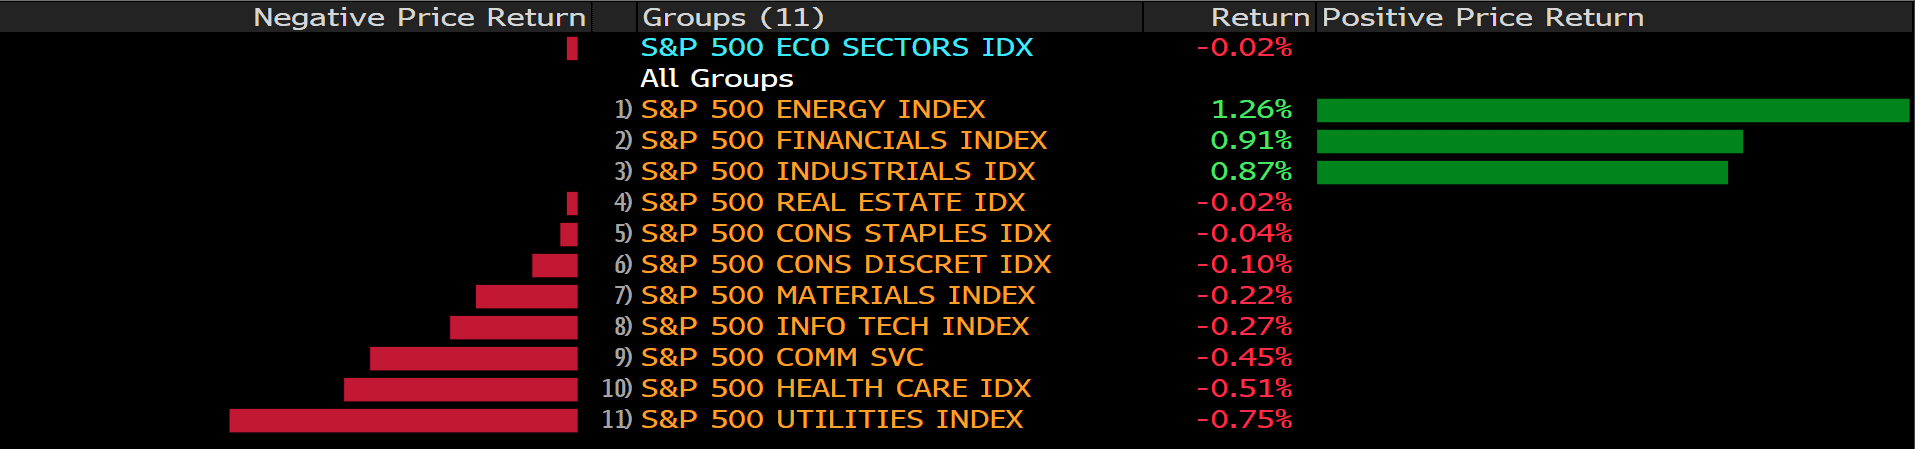
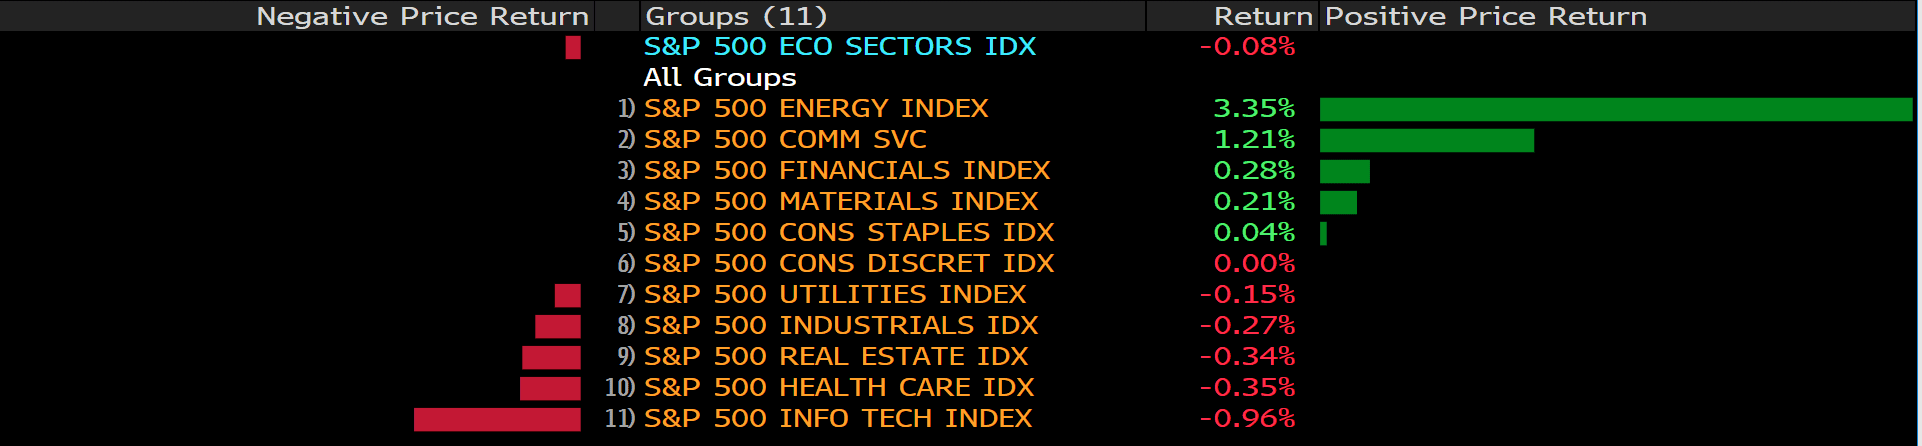
Stocks ended the cash session lower after a back-and-forth day.
The S&P 500 reached a session high after Jerome Powell said the central bank is not considering cutting back on asset purchases that have helped the economy recover from the pandemic. Treasuries rose after the Fed kept interest rates at zero and policy makers strengthened their view of the economy.
Here are three takeaways of Fed Chairman speaking and FOMC statement:
1. Federal Reserve Chair Jerome Powell and his colleagues upgraded their assessment of the U.S. economy but said they were not yet ready to consider scaling back pandemic support.
2. The recovery has been faster than expected but “it remains uneven and far from complete” and the economy “is a long way from our goals.” U.S. central bankers repeated they would not change the pace of bond buying until “substantial further progress”.
3. The statement also noted that sectors hit hardest by the Covid-19 pandemic had “shown improvement.” And on the risk of prices rising, policy makers said: “Inflation has risen, largely reflecting transitory factors.”
Main Pairs Movement:
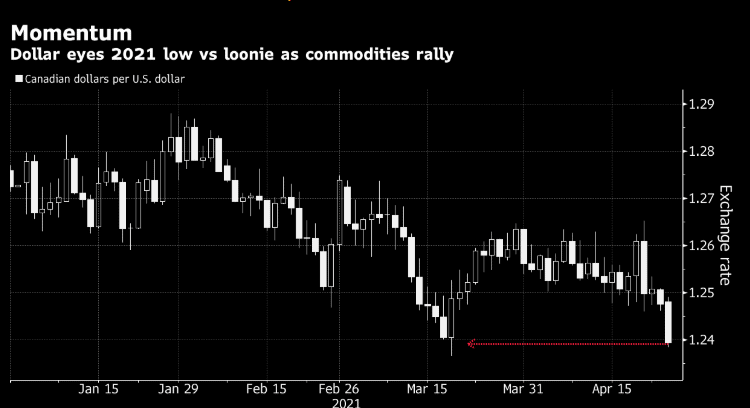
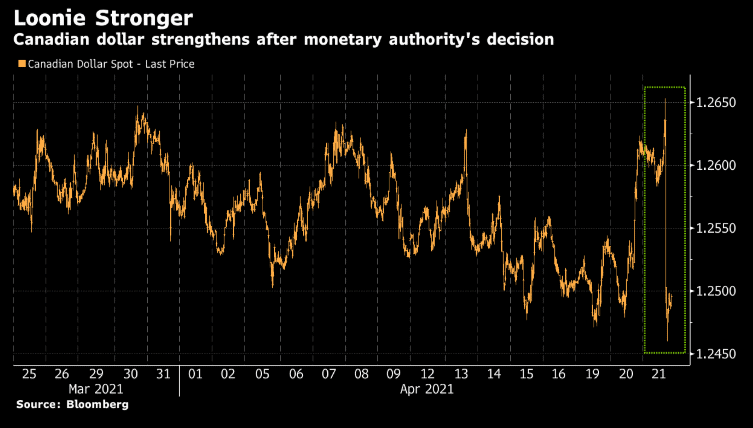
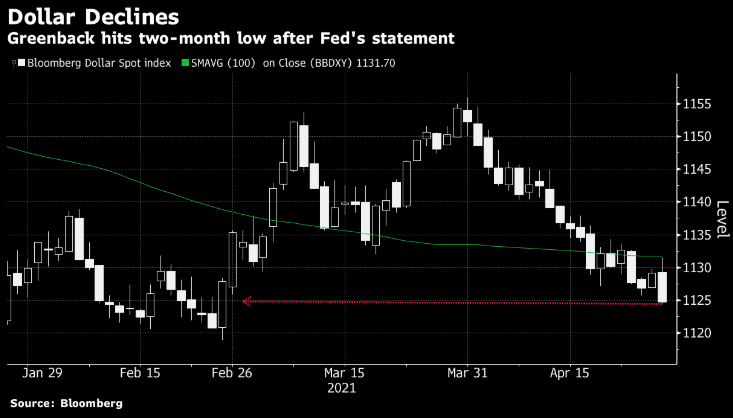
The dollar slid to session lows Wednesday as the Federal Reserve signaled risks to the economy from the coronavirus have abated and left the current pace of asset purchases unchanged. Resource-linked currencies led gains, with the Canadian dollar hitting the highest level since 2018 as a key gauge of commodities touched a fresh almost three-year high.
Among G-10 peers, the Norwegian krone, New Zealand, and Canadian dollars led gains. EUR/USD trading +0.3% at 1.2124 in the day as European Central Bank President Christine Lagarde says the region is probably past the peak of the third wave of coronavirus infections, but there are still downside risks in near term.
ECB’s response to the crisis has proven efficient; euro area still needs monetary, fiscal stimulus. ECB is closely watching exchange rate’s impact on inflation.
Technical Analysis:
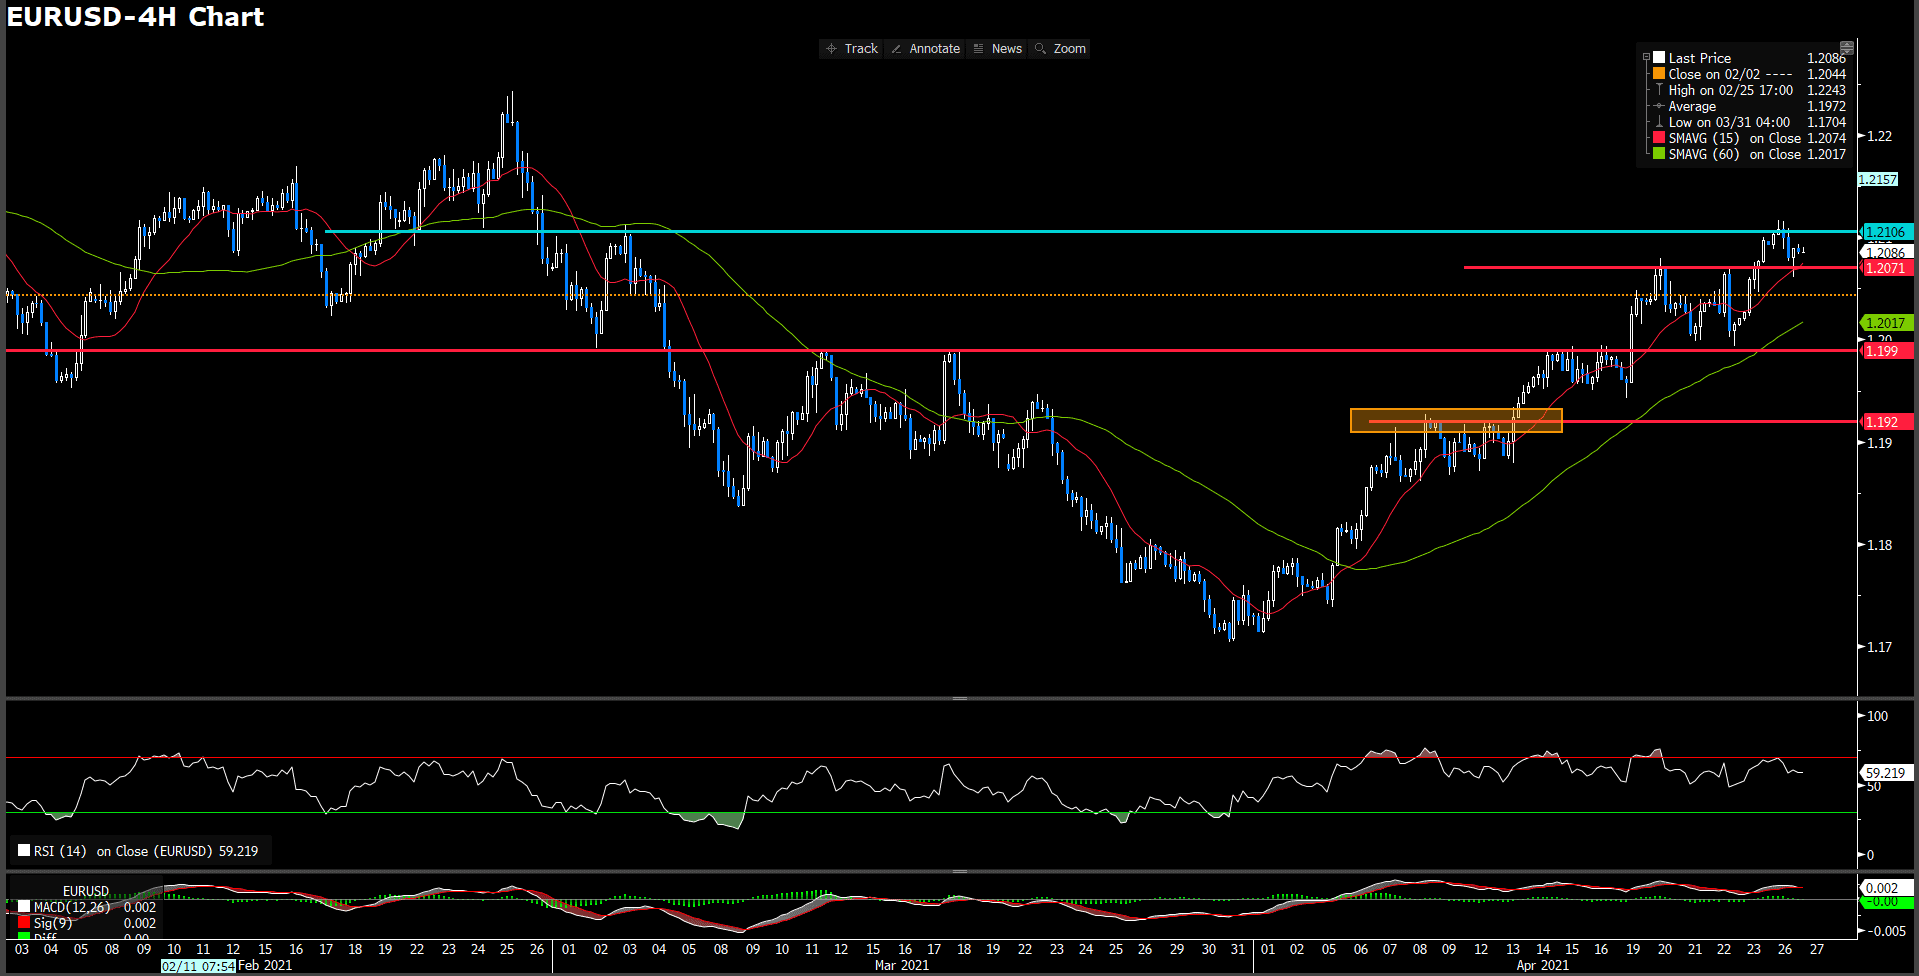
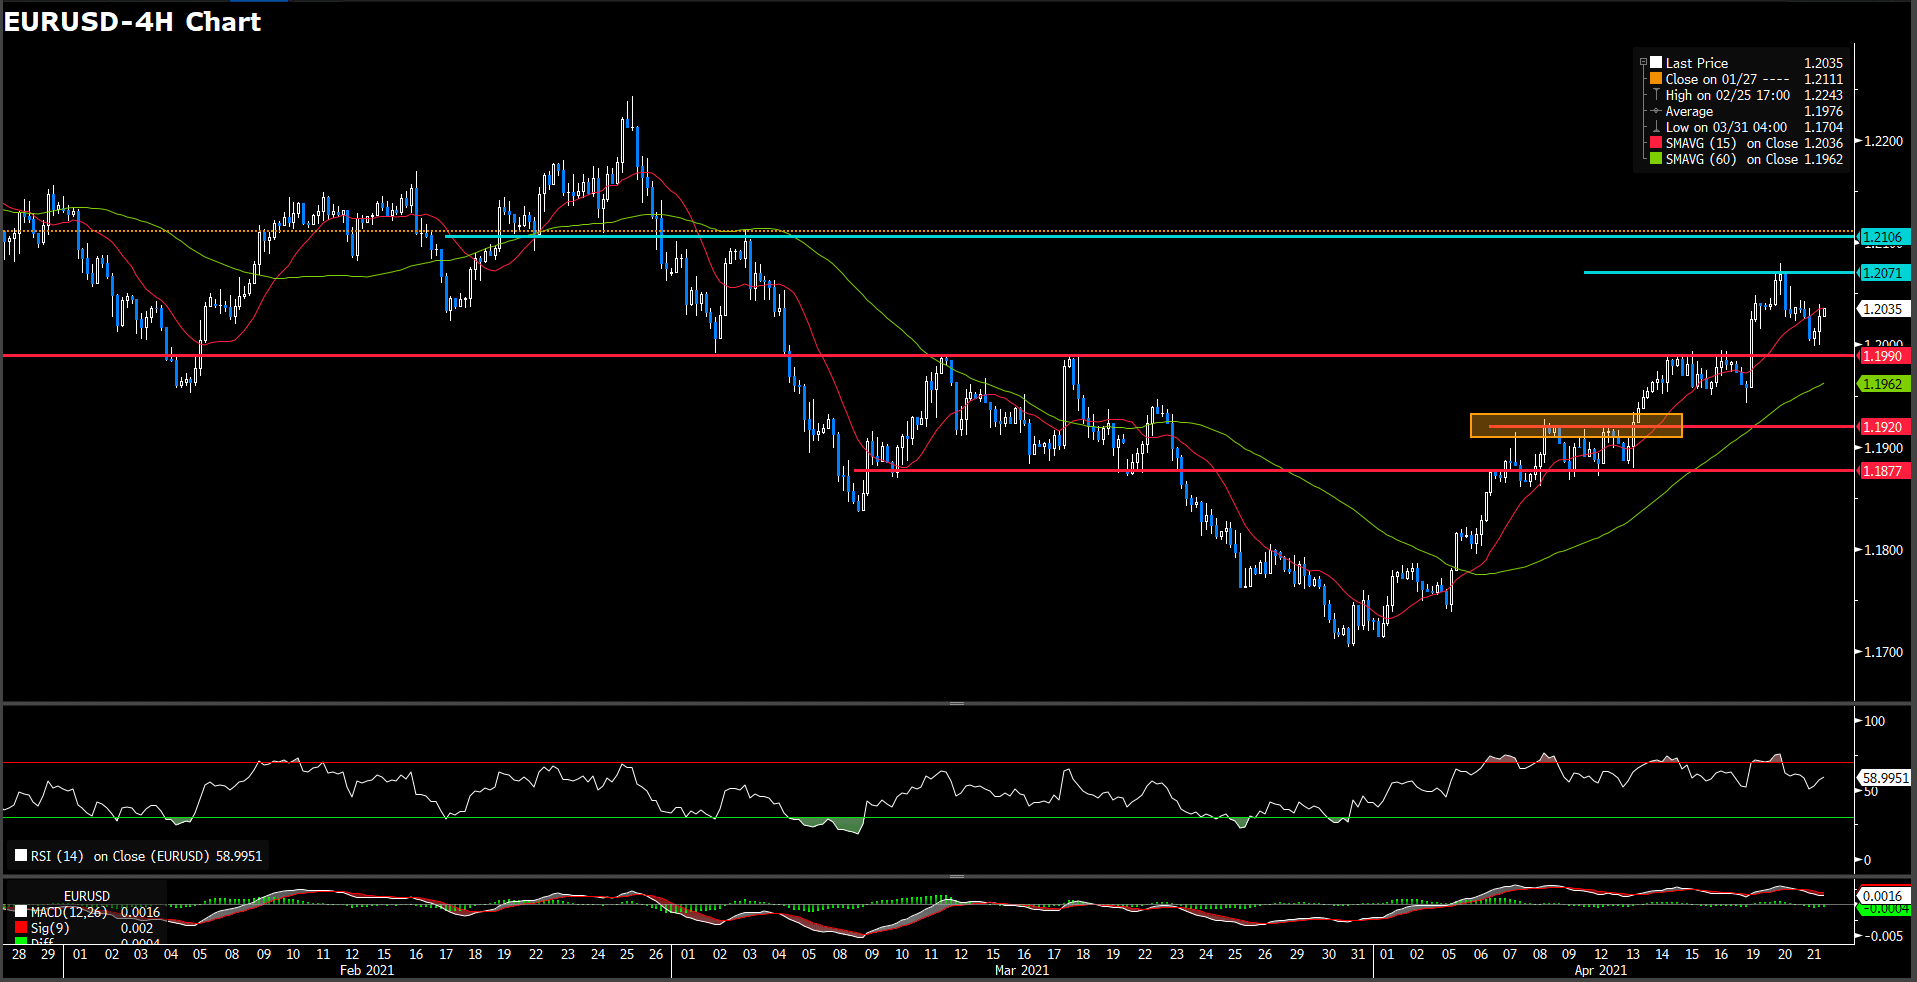
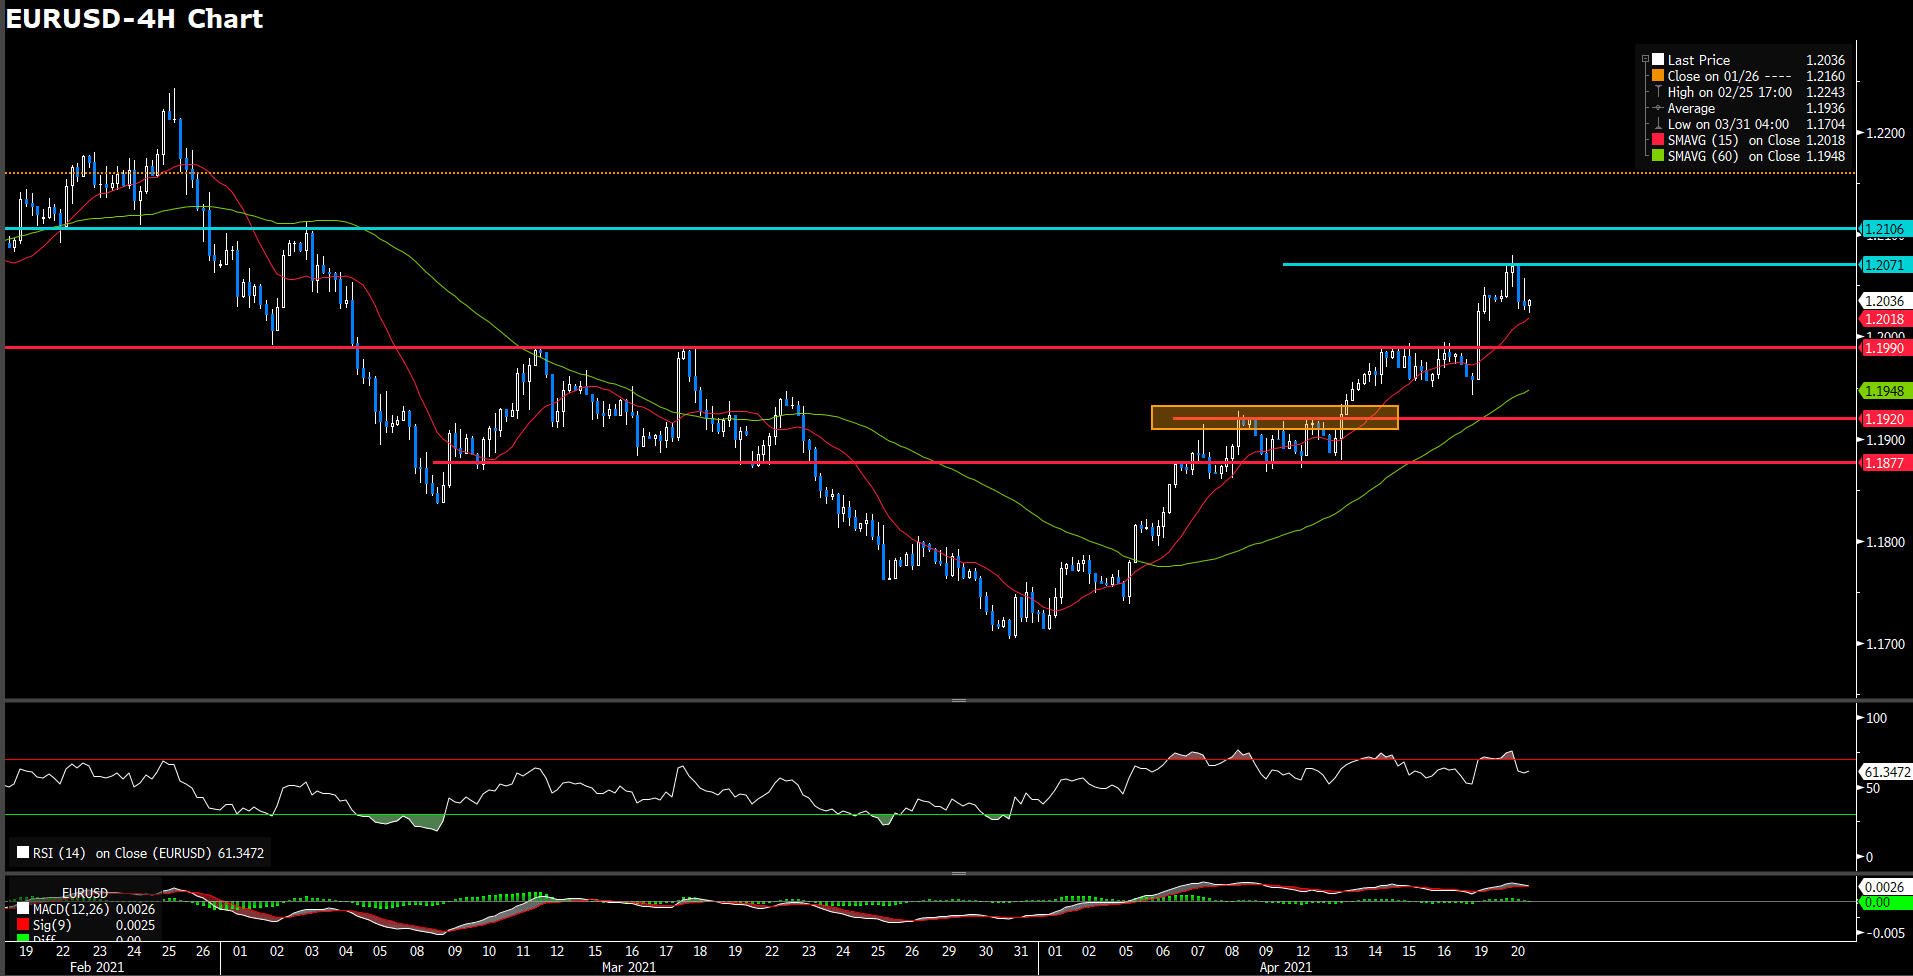
EURUSD (4 hour Chart)
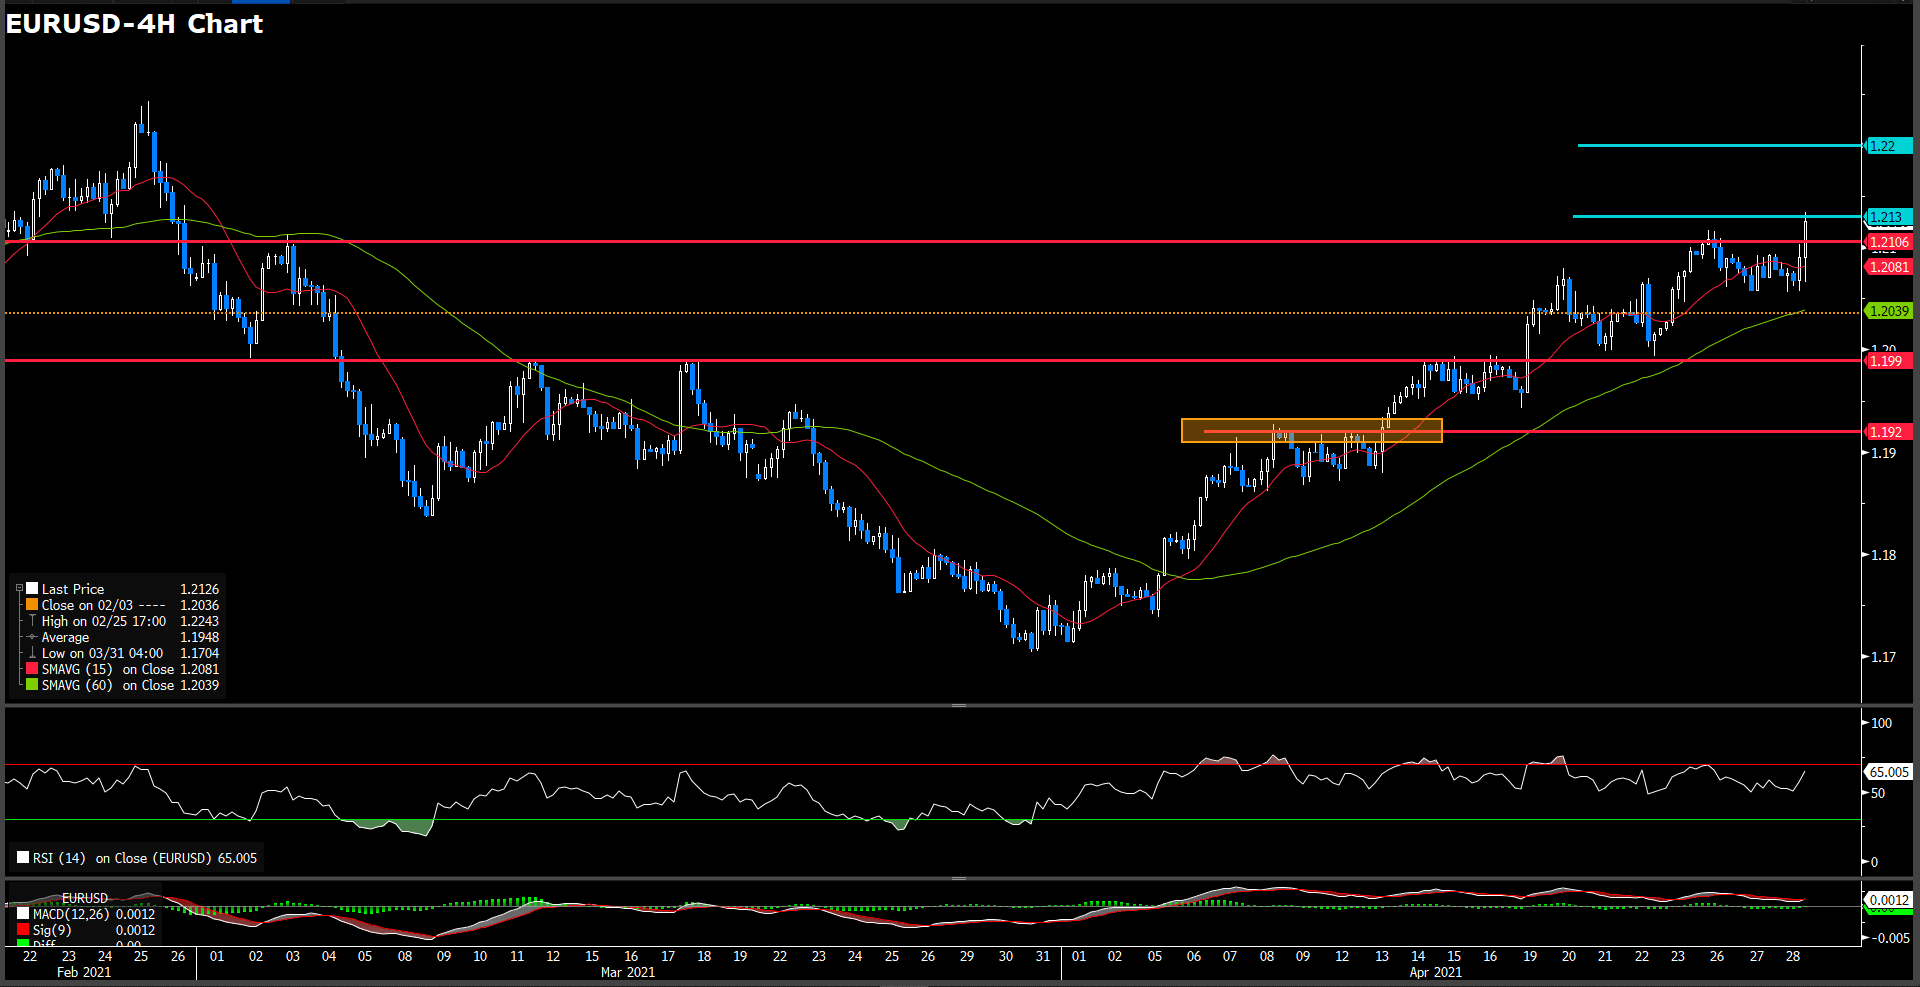
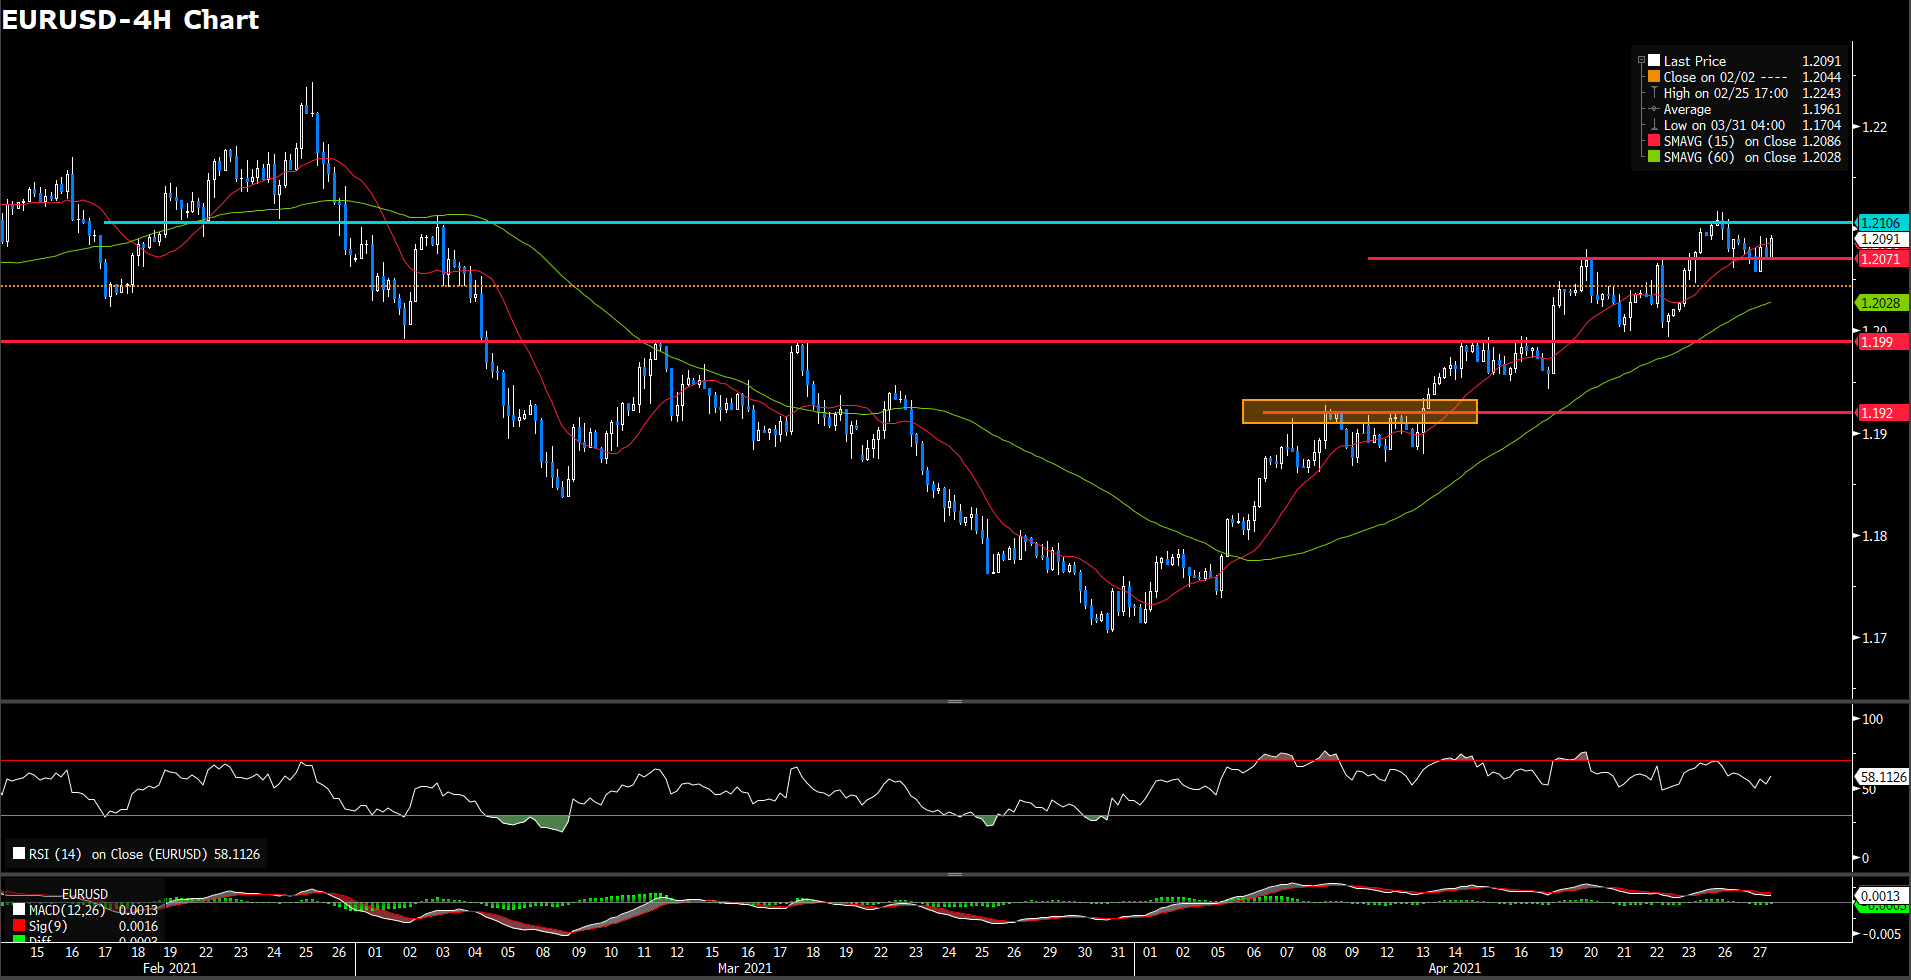
Euro dollar has soared up to highest level; earlier fell as much as 0.3% to 1.2056; since March after Fed left key rate unchanged, trading at 1.2124 as of writing. For RSI side, indicator shows 65 figures, suggesting a room for upward side before tap into over bought sentiment. On moving average price, 15-long SMA indicator turn positive slope and 60-long SMA indicator retaining an ascending movement.
Therefore, we foresee there still have a upper-space as market sentiment remain a benign bullish momentum. Before optimistic views, we need to eyes on euro dollar whether could emphatically stand above 1.2106 level.
Resistance: 1.213, 1.22
Support: 1.2106, 1.199, 1.192
USDJPY (4 Hour Chart)
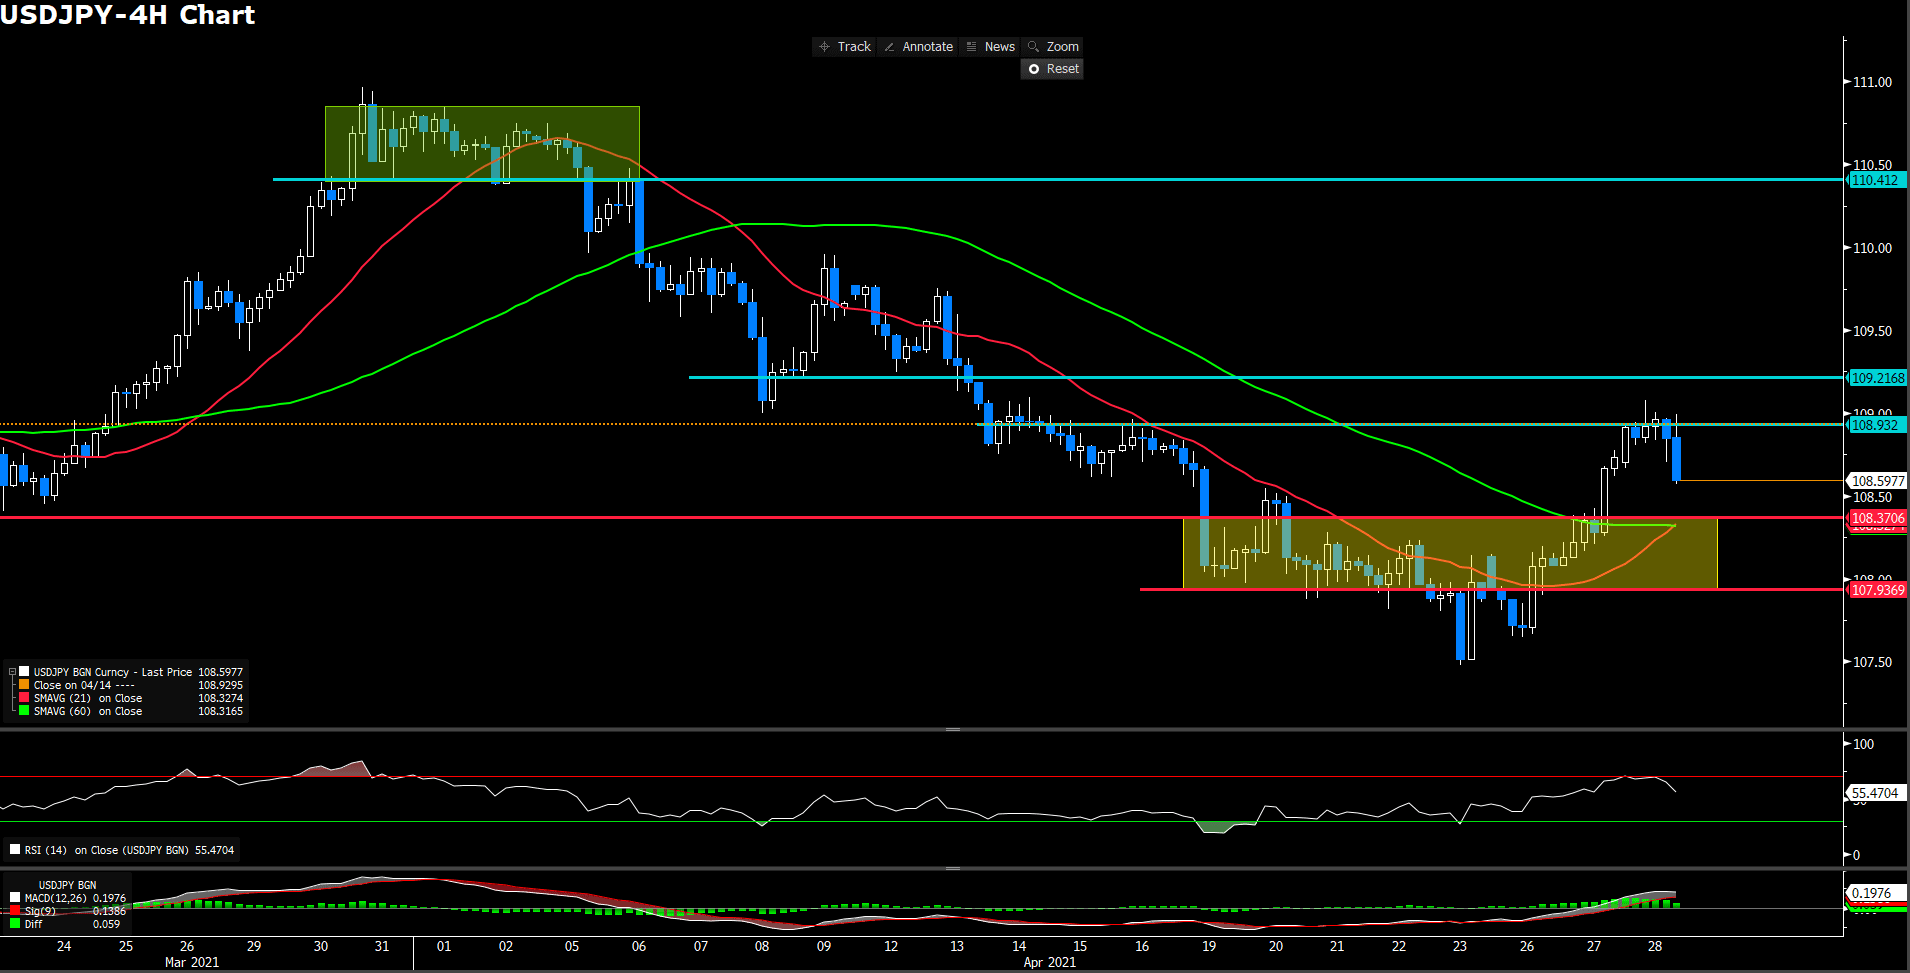
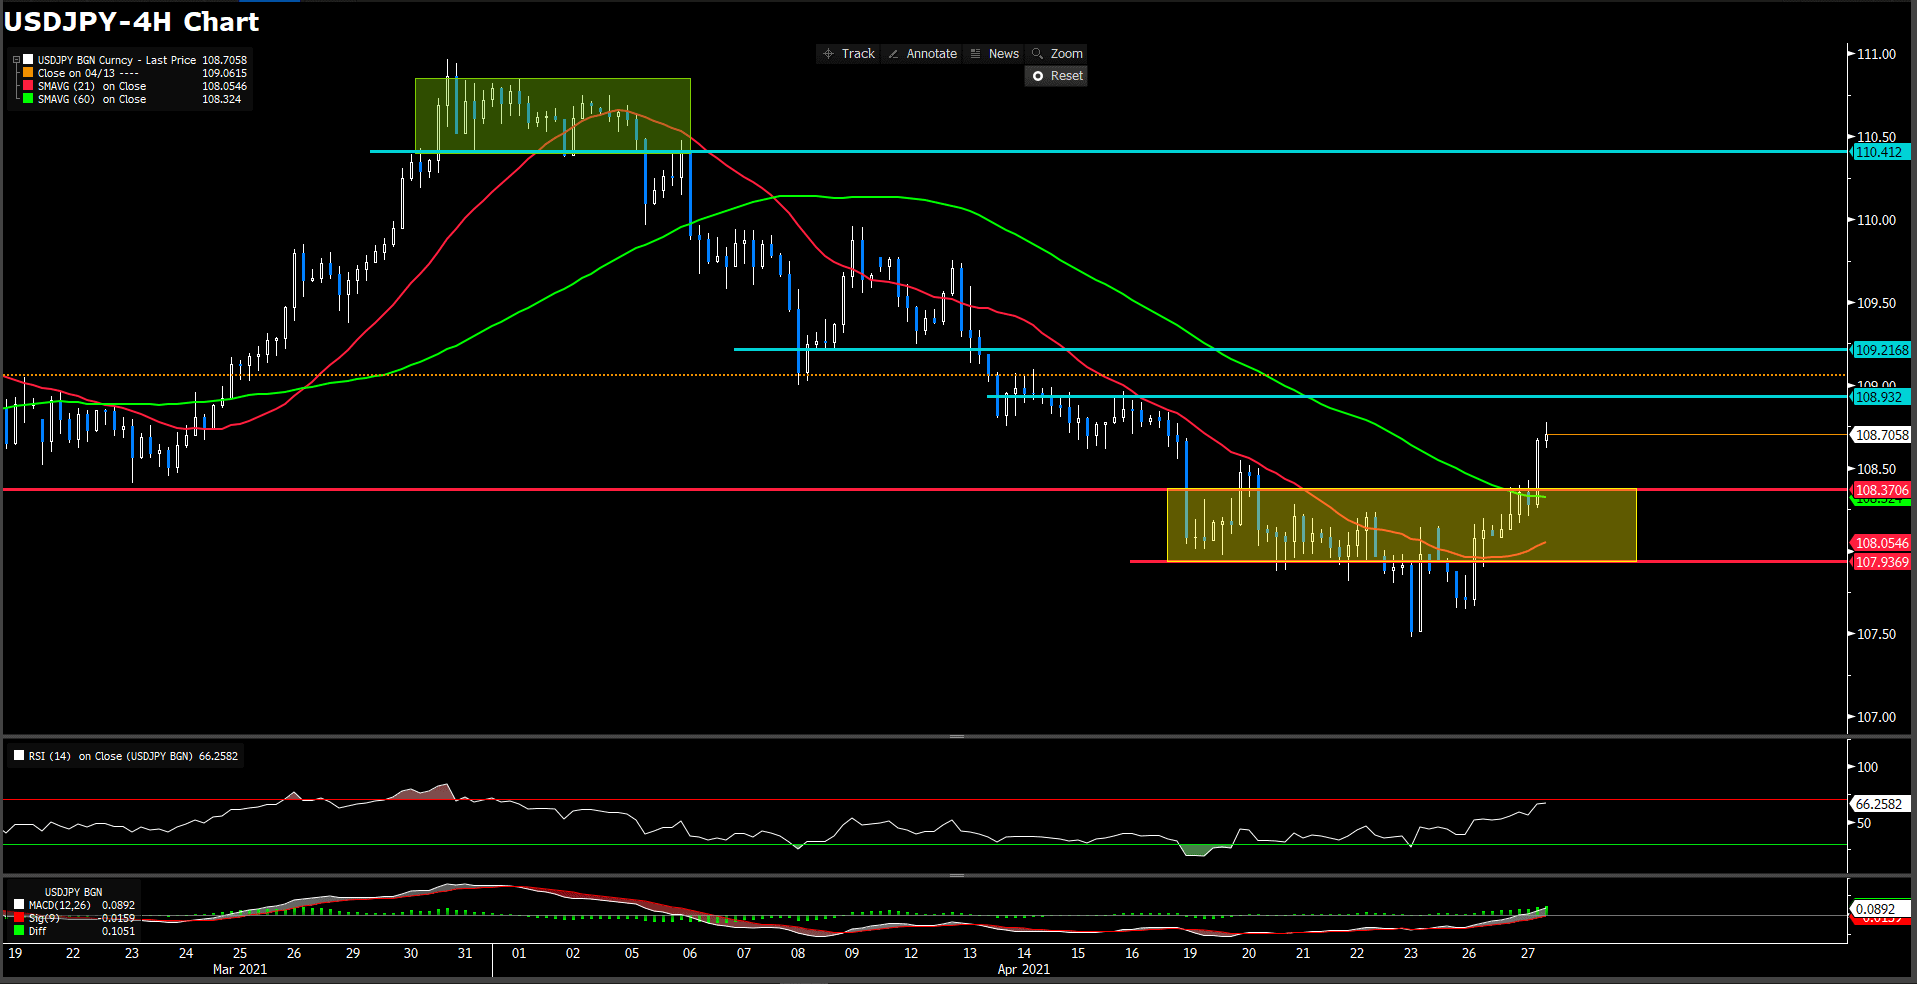
Japan yen wiped out earlier session gains after Fed’s rate decision and chairman’s dovisk statement, trading nearly day low at 108.618 as of writing. Meantime, 10 years Treasuries yields turn negative territory at 1.611% which once pick up to day high 1.664%. For RSI side, indicator was close to the neutral area at 55 around which suggest a mixed movement in forthcoming market. On the other hand, 60-long SMA indicator hold an opaque movement but 15-long SMA indicator seems is going to golden cross with 60 one.
Continuing our yesterday perspective, we deem market bounced up was too rapidly thence a correction is necessary, yet, for bullish aspect, 108.37 have to be defended. Currently, we expect market will intend to choppy in a tiny range which between neckline at 108.37 and first resistance.
Resistance: 108.93, 109.22
Support: 108.37, 107.936
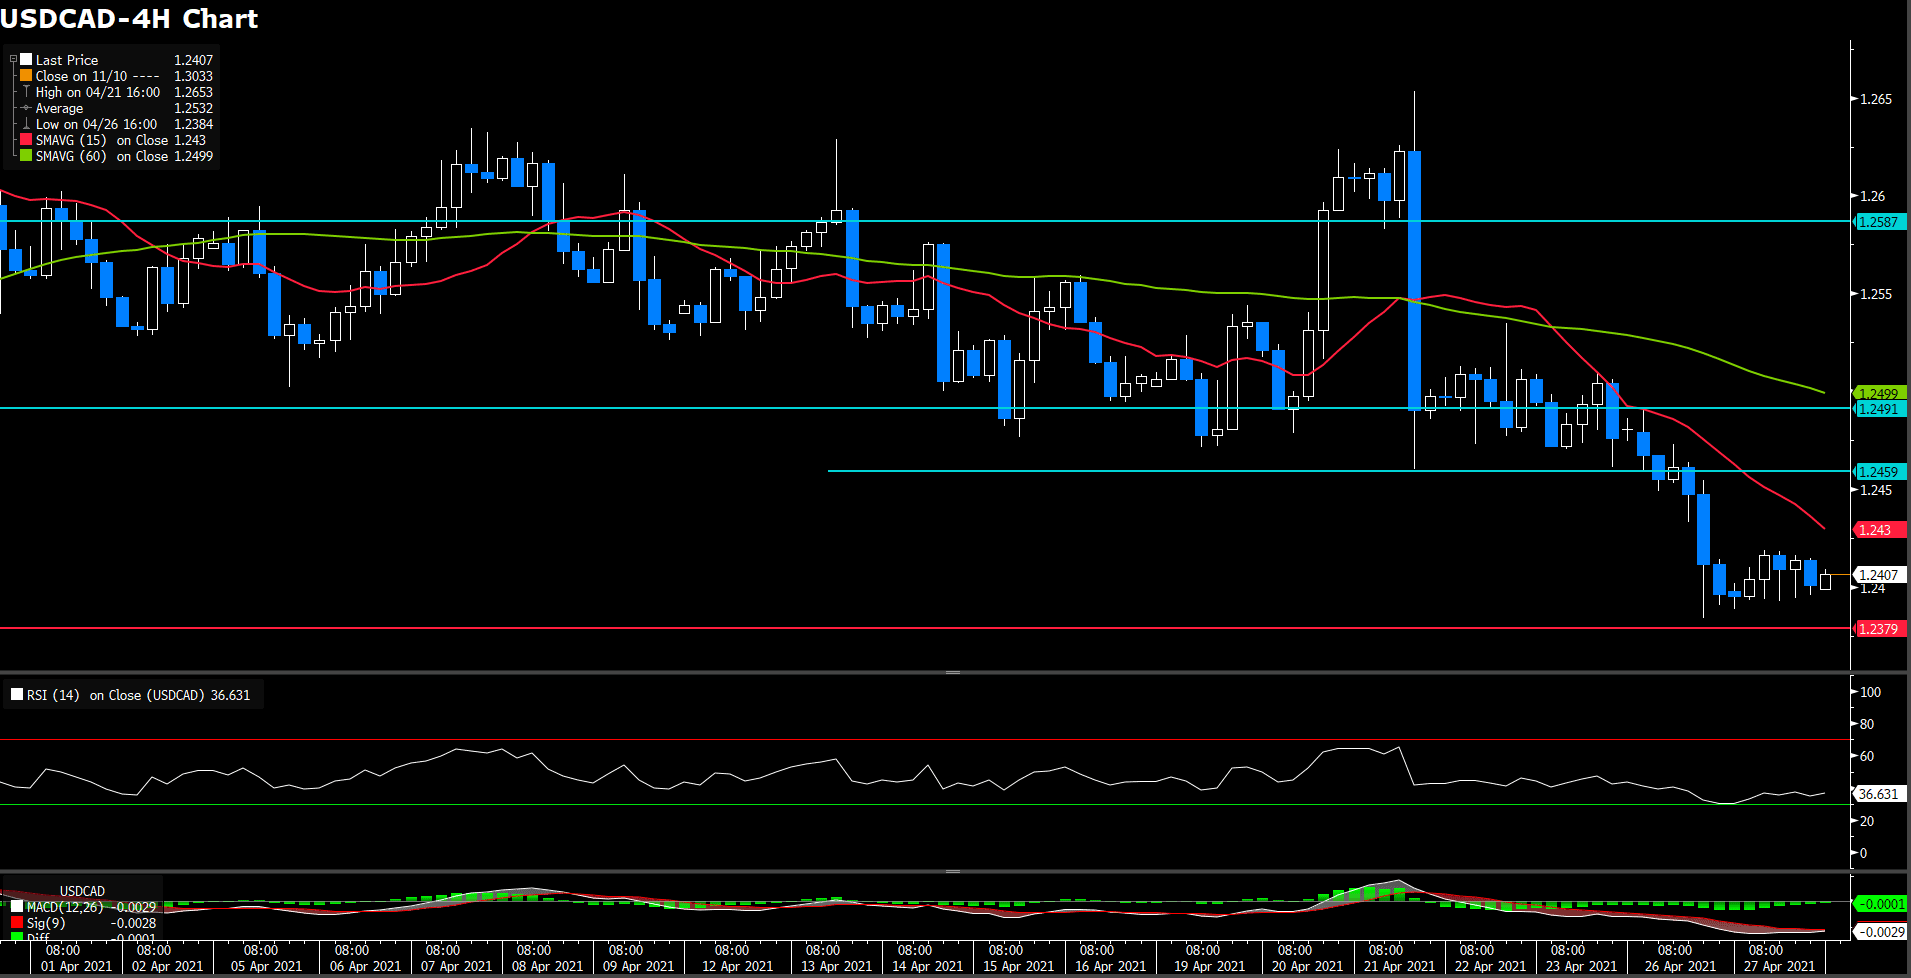
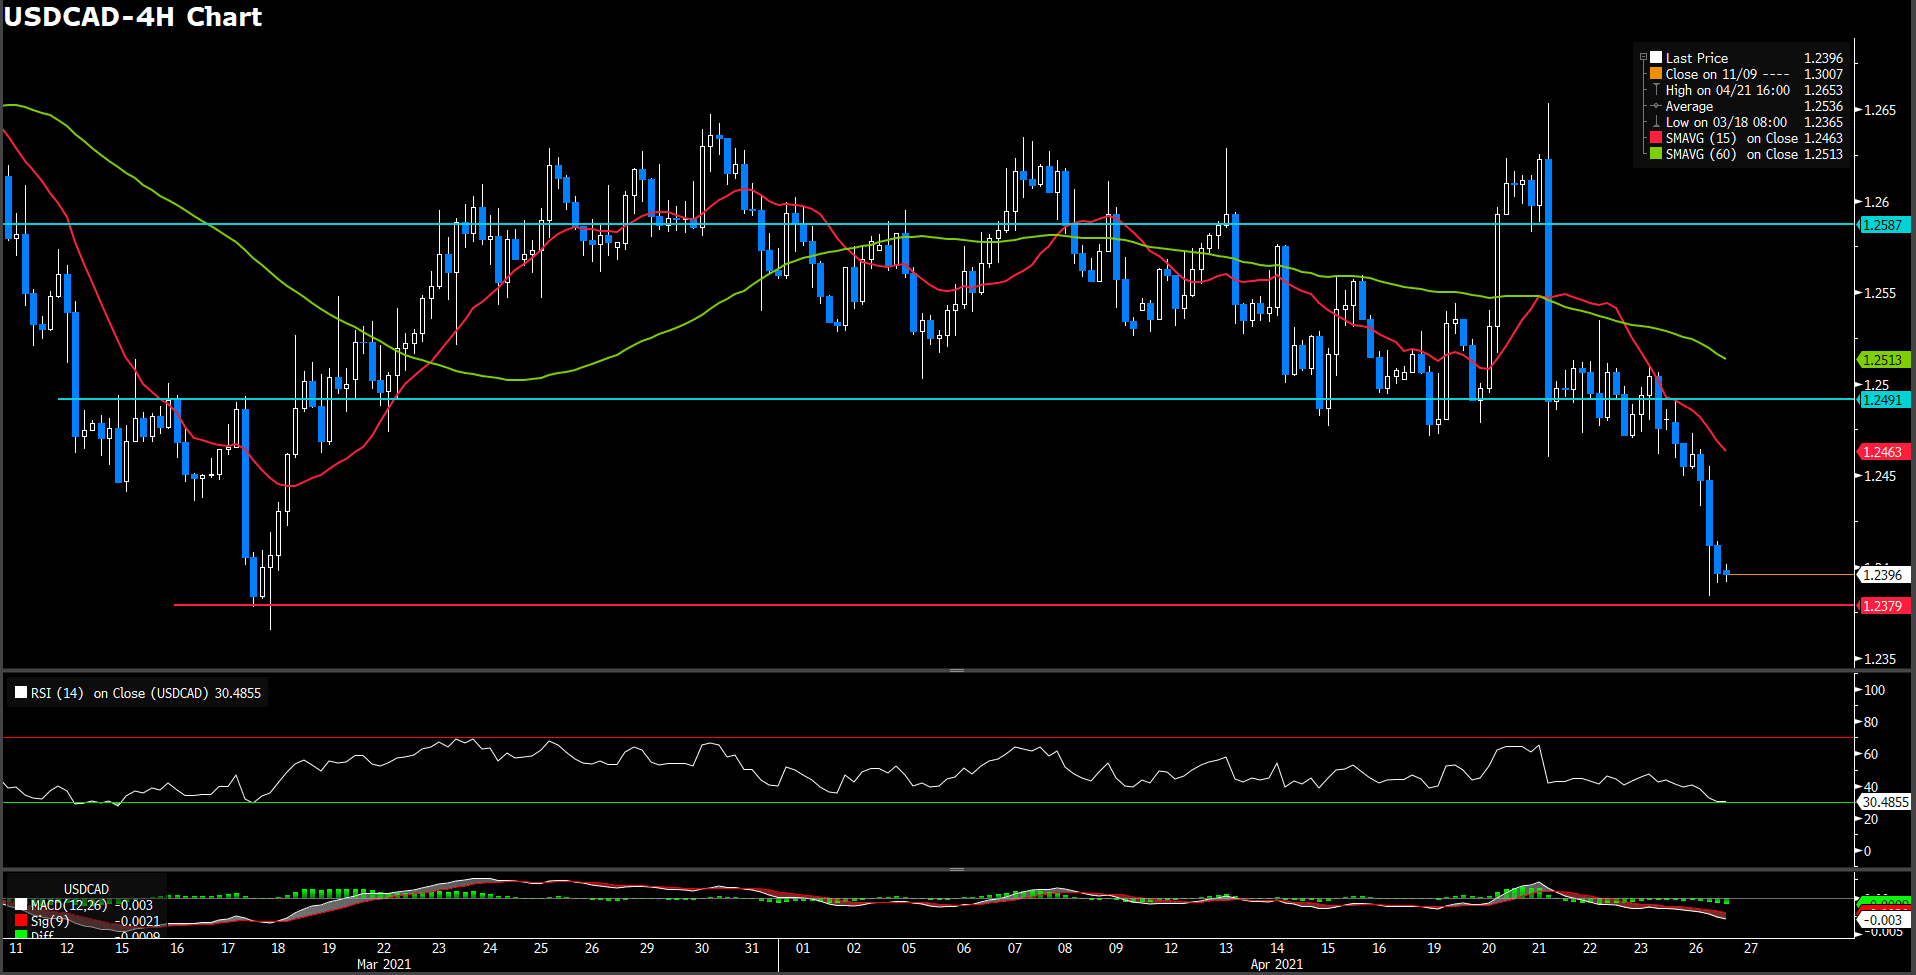
USDCAD (Daily Chart)
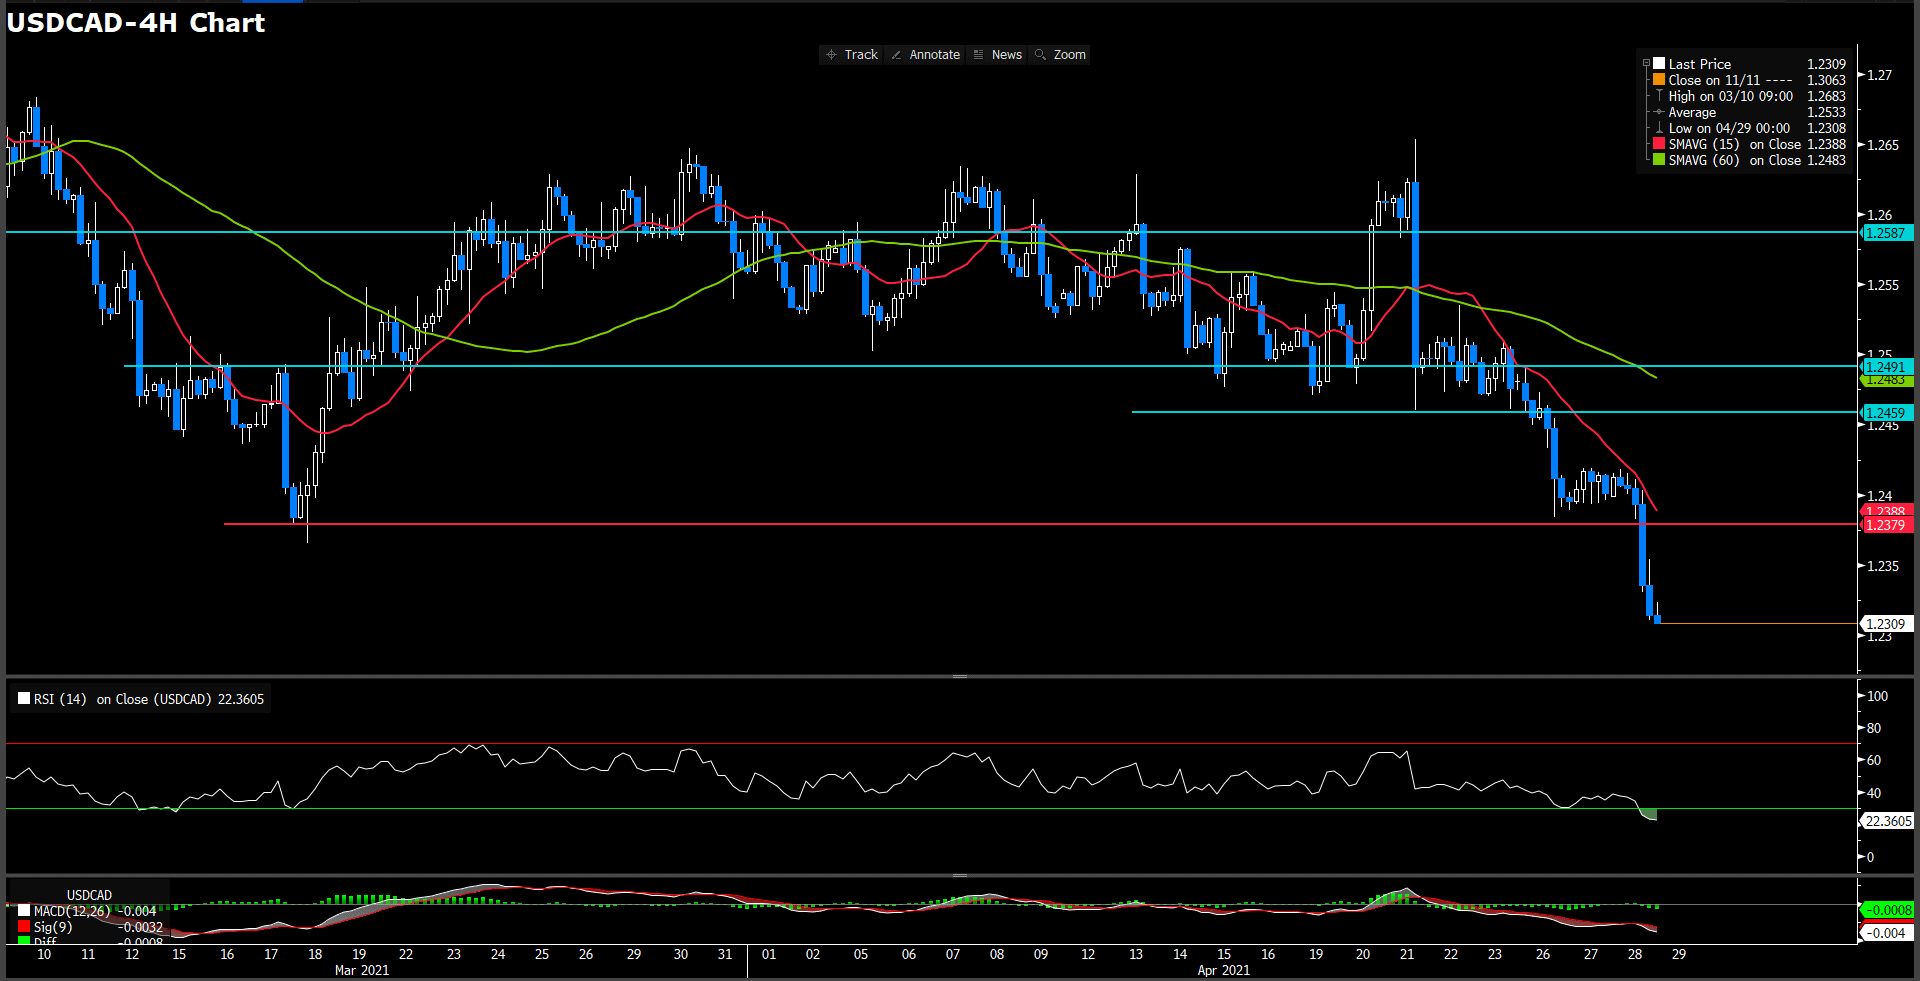
Loonie finally breakthrough the critical support at 1.238, of course driven by Fed’s rate decision, trading at 1.23144 nearly all time low in this 2 years. At the meantime, Dollar index drop to a nadir of price action since March. For moving average side, 15 and 60-long SMAs remaining a descending trend. For RSI side, indicator has slipped into the over sought territory at 23 figure, suggesting an over pessimetic at the moment.
Sum up aforemention, we expect loonie will have a substantial space for downward trend as it penetrated 2 years neckline. Therefore, 1.238 level would be the vital resistance for our perspective.
Resistance: 1.238, 1.246, 1.2491
Economic Data
|
Currency |
Data |
Time (GMT + 8) |
Forecast |
||||
|
USD |
U.S. President Speaking |
Tentative |
– |
||||
|
EUR |
German Unemployment Change |
15:55 |
-10 K |
||||
|
USD |
GDP (QoQ)(Q1) |
20:30 |
6.1% |
||||
|
USD |
Initial Jobless Claims |
20:30 |
549 K |
||||
|
USD |
Pending Home Sales (MoM)(Mar) |
22:00 |
5% |
||||