Daily Market Analysis
Market Focus
US stocks market is closed for Memorial Day holiday, but futures was still open to trade. Futures on the three big equity indices declined as traders await fresh catalysts. This Friday’s Non-farm Payroll report will be crucial as it could materially changes Fed’s views on inflation and job market. “Policy makers have committed to accepting a higher level of inflation, higher volatility in inflation and as that happens you will see inflation moving structurally higher,” said Mixo Das, JPMorgan Asia equity strategist.
Germany’s inflation rate reached the peaking point since October 2018. The termination of lockdowns played a major part in reviving German economy. We are also seeing consumer prices picked up in Spain and Italy, a report for the euro area on Tuesday is expected to show inflation rising to 1.9%.
The world’s biggest meat supplier was the target of a cybersecurity attack Sunday. These ransom-ware attacks are getting wild, and are mostly claimed by a hacker group named DarkSide. The most noticeable attack forced Colonial Pipeline Co. to stop the flow of fuel for several days earlier this month, causing severe gasoline shortages in many cities.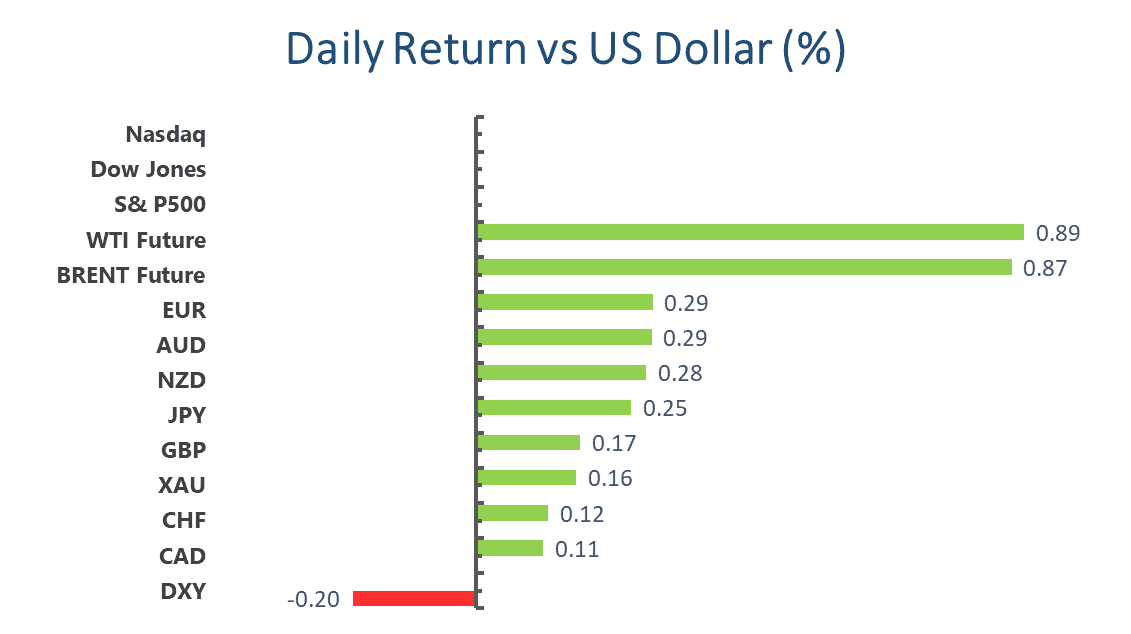
Main Pairs Movement:
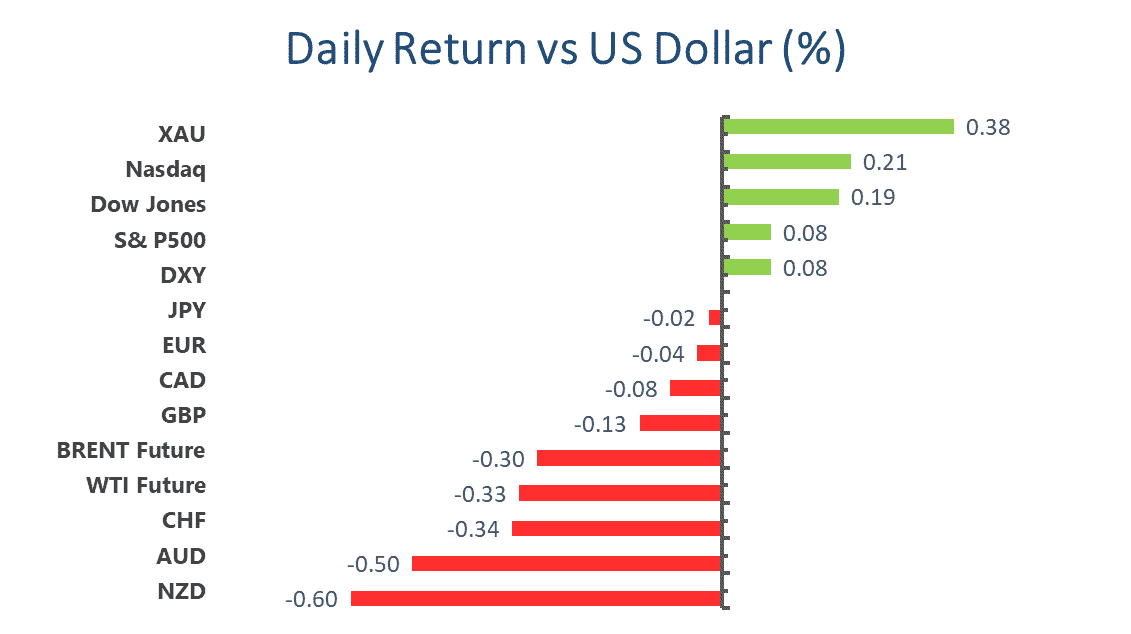
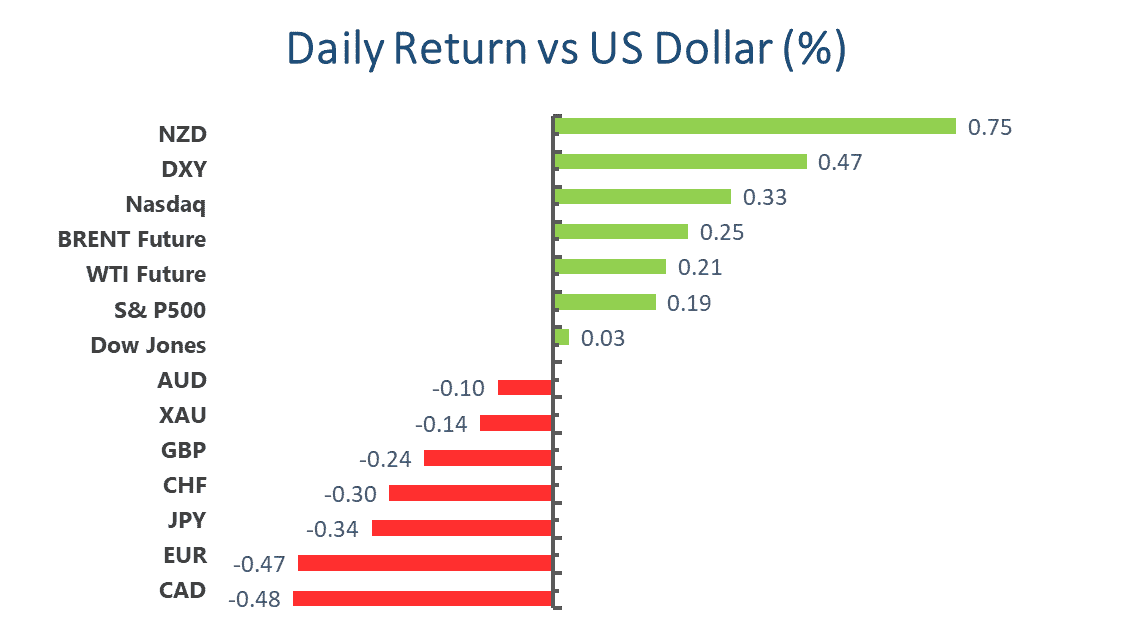
Dollar is on the back foot amid thin liquidity in the market, with the dollar index dipping 0.23%, currently trading 89.85. Euro was the best performer among the G-7 space, rose 0.29% on Monday. Tuesday will be a busy day as the economic docket is packed with releases from several major economies. Traders will be closely watching any policy shifts from Reserve Bank of Australia.
Cable also edged 0.15% higher despite possible postpone of reopening. UK may halt the next and last phase of Britain’s reopening due on June 21. Health experts have been calling on the government to react to the strain first identified in India by postponing this loosening. In the meantime, authorities have settled for accelerating the vaccination campaign.
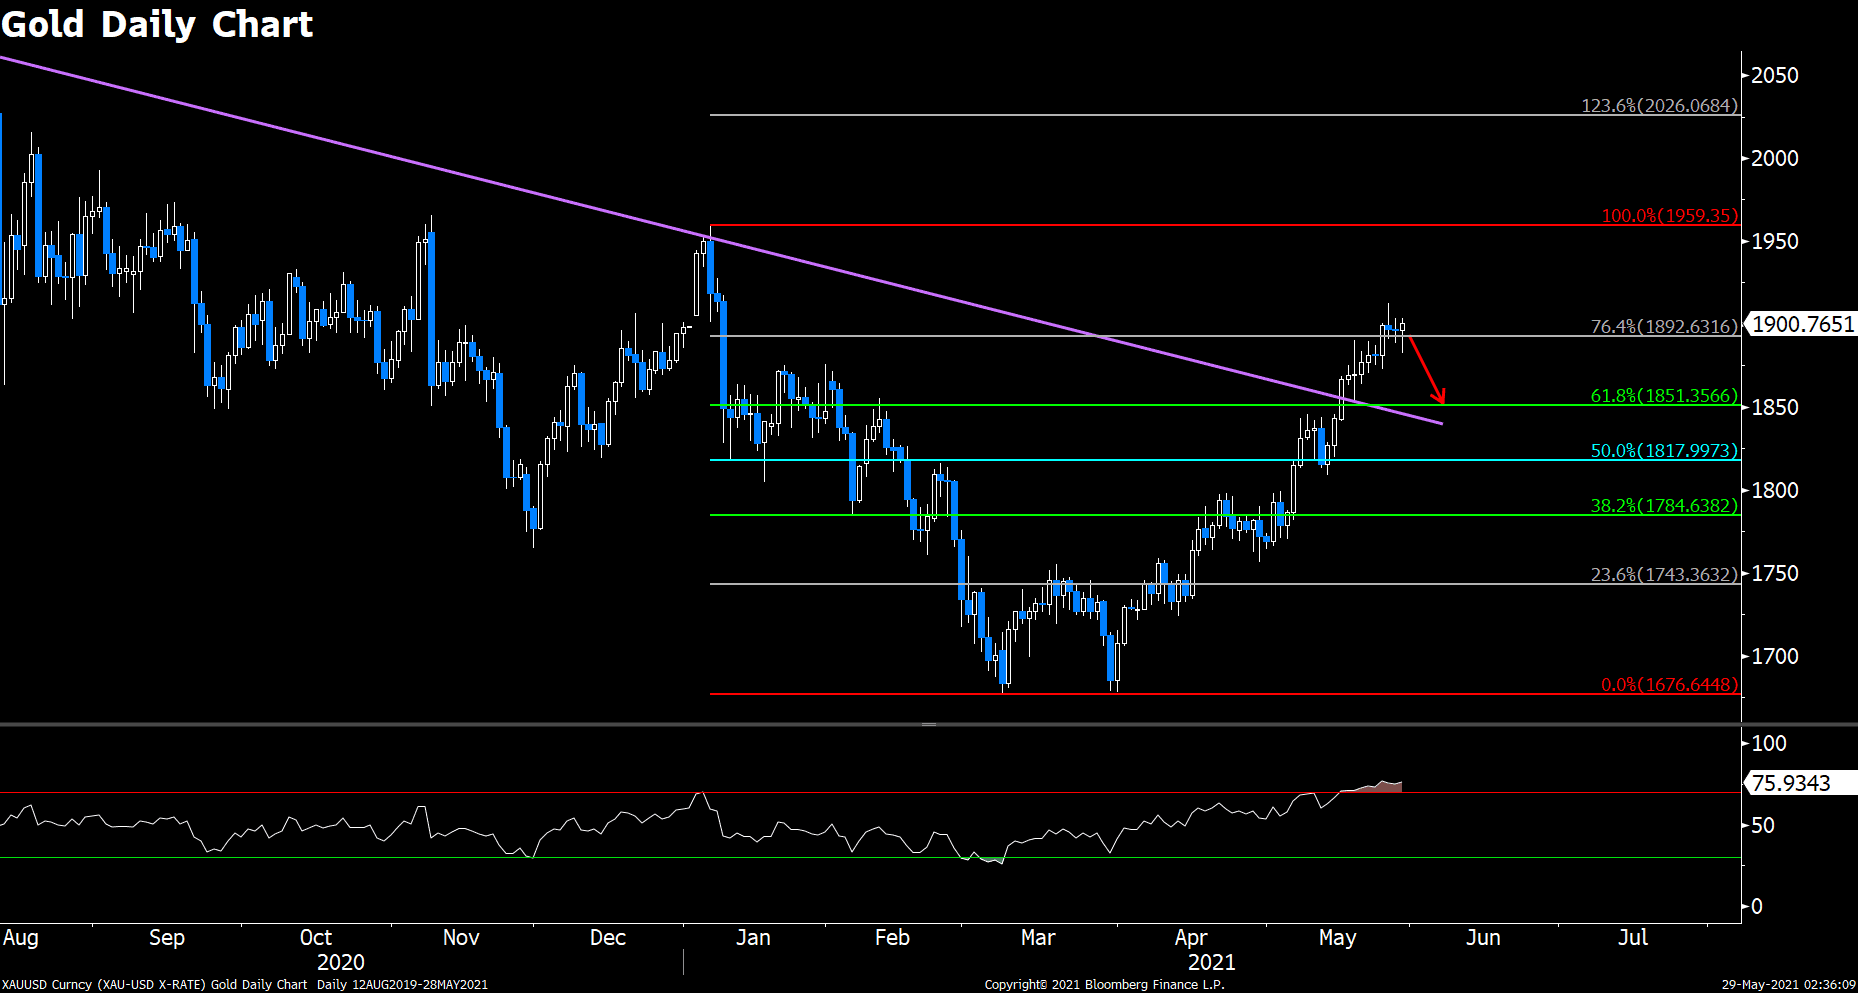
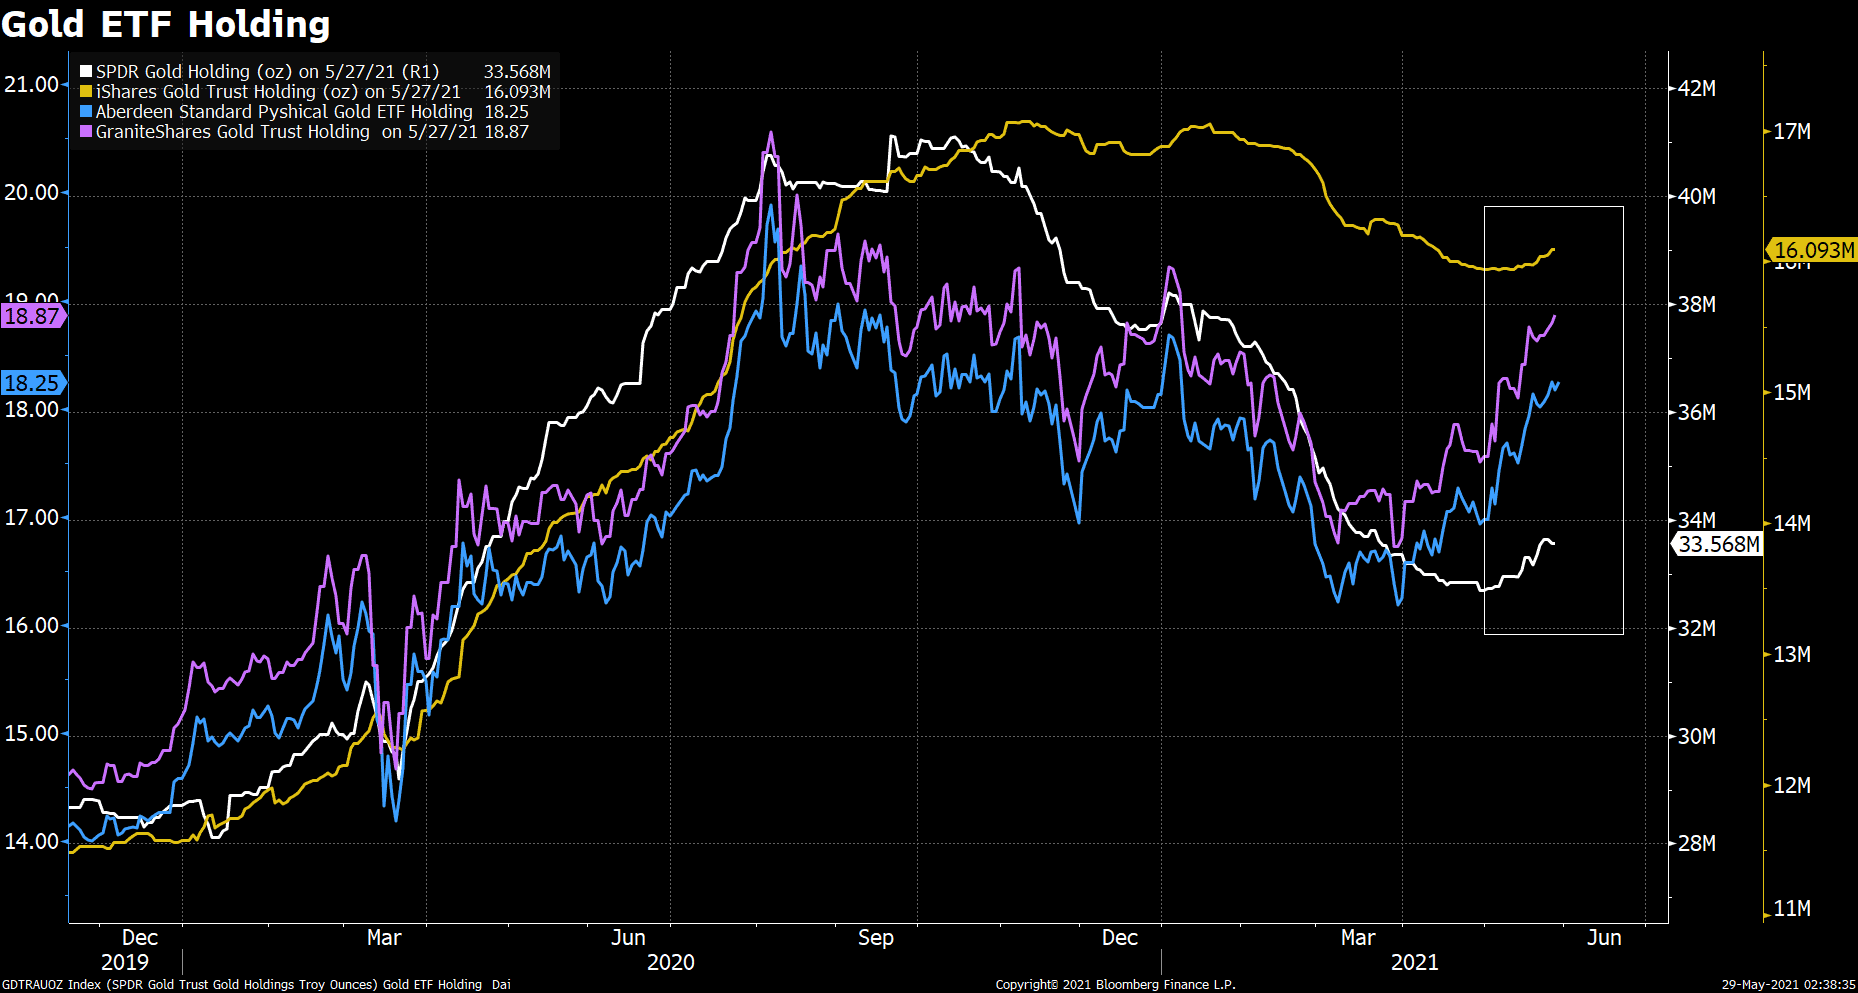
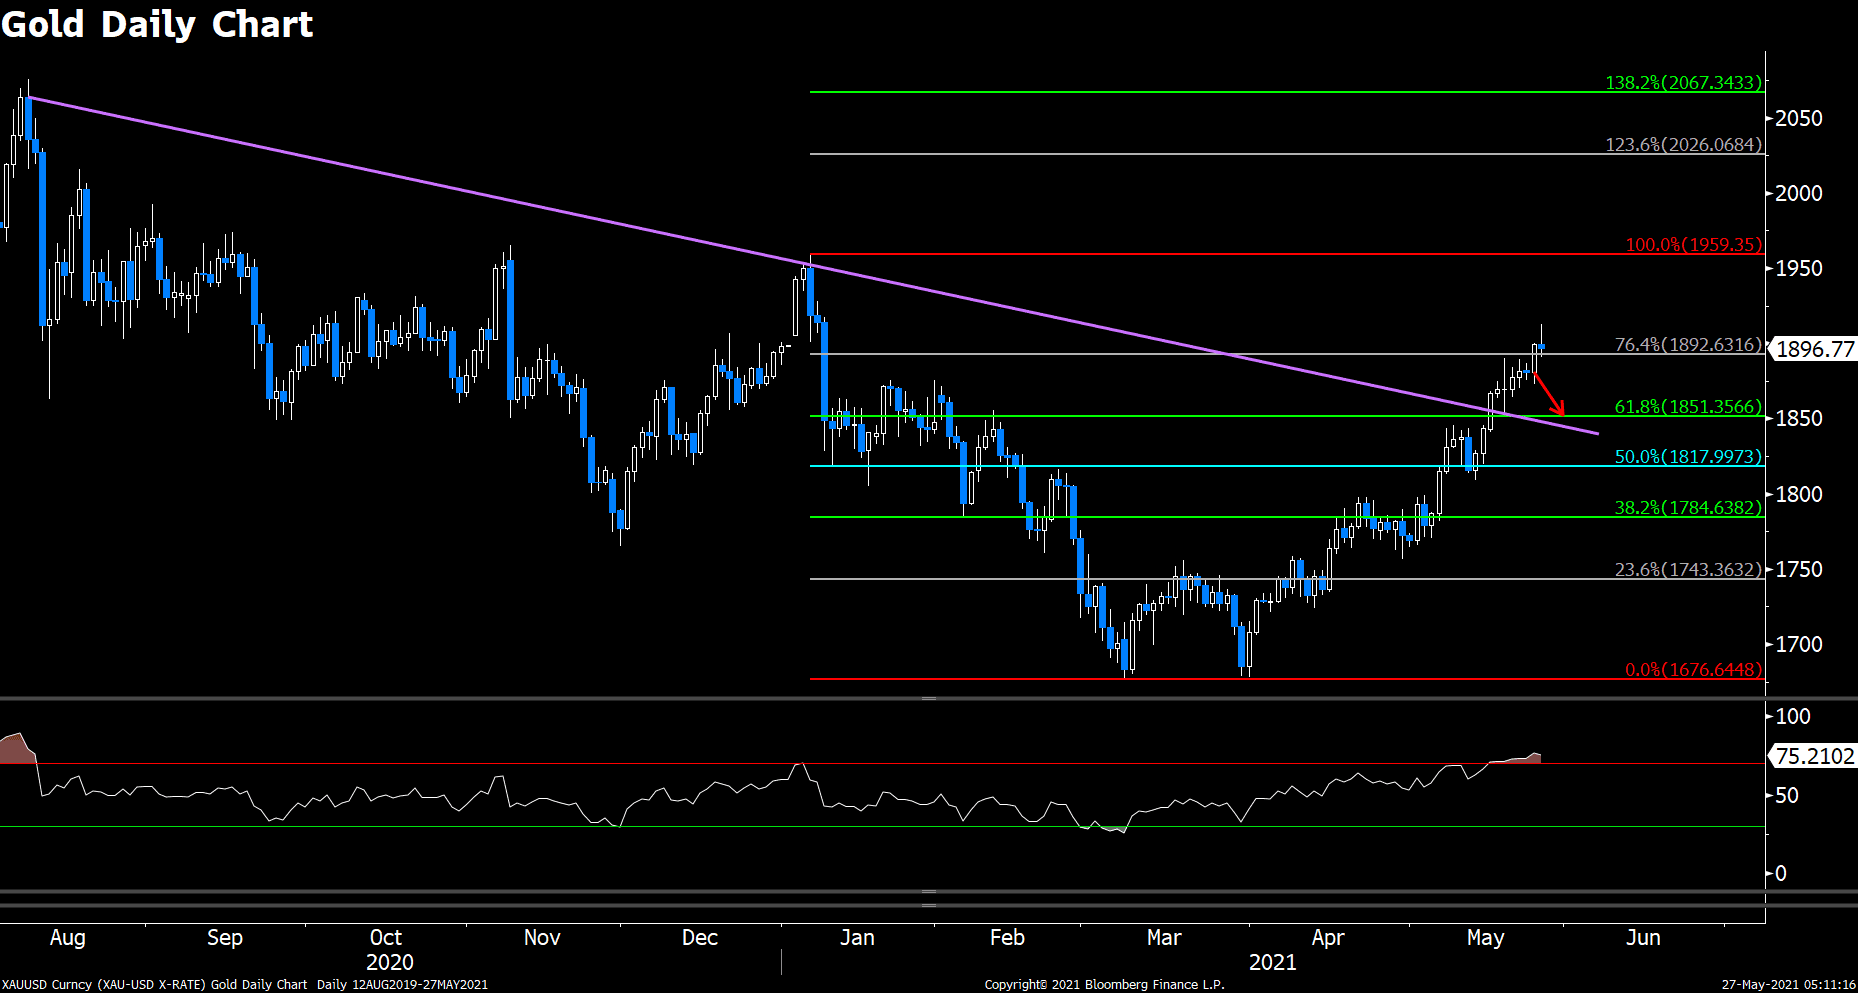
Gold continues to head higher, climbed 0.16% on Monday. Recent rally in Gold may be contributed by a short squeeze in Europe, and exploding demand from China. According to GoldMoney.com, European bullion bank trading desks were under instructions to close their Comex positions and not roll them, because of the new Basel 3 regulations imposed upon them from end-June. The elimination of players in the Swaps category by Basel 3 regulations is a growing threat to Comex liquidity, leaving the shorts effectively trapped. On the other hand, Reuters reported over the weekend that gold exports from Switzerland to China and India have picked up, with 40.2 tonnes sent to China in April — more than the previous 14 months combined. Bernard Sin, regional director, Greater China at MKS, said “banks will continue to steadily import gold in May, as PBOC wants to manage the pace of RMB appreciation.” Pent-up demand for gold luxuries is also making a come back after depressed household spending back in 2020.
Technical Analysis:
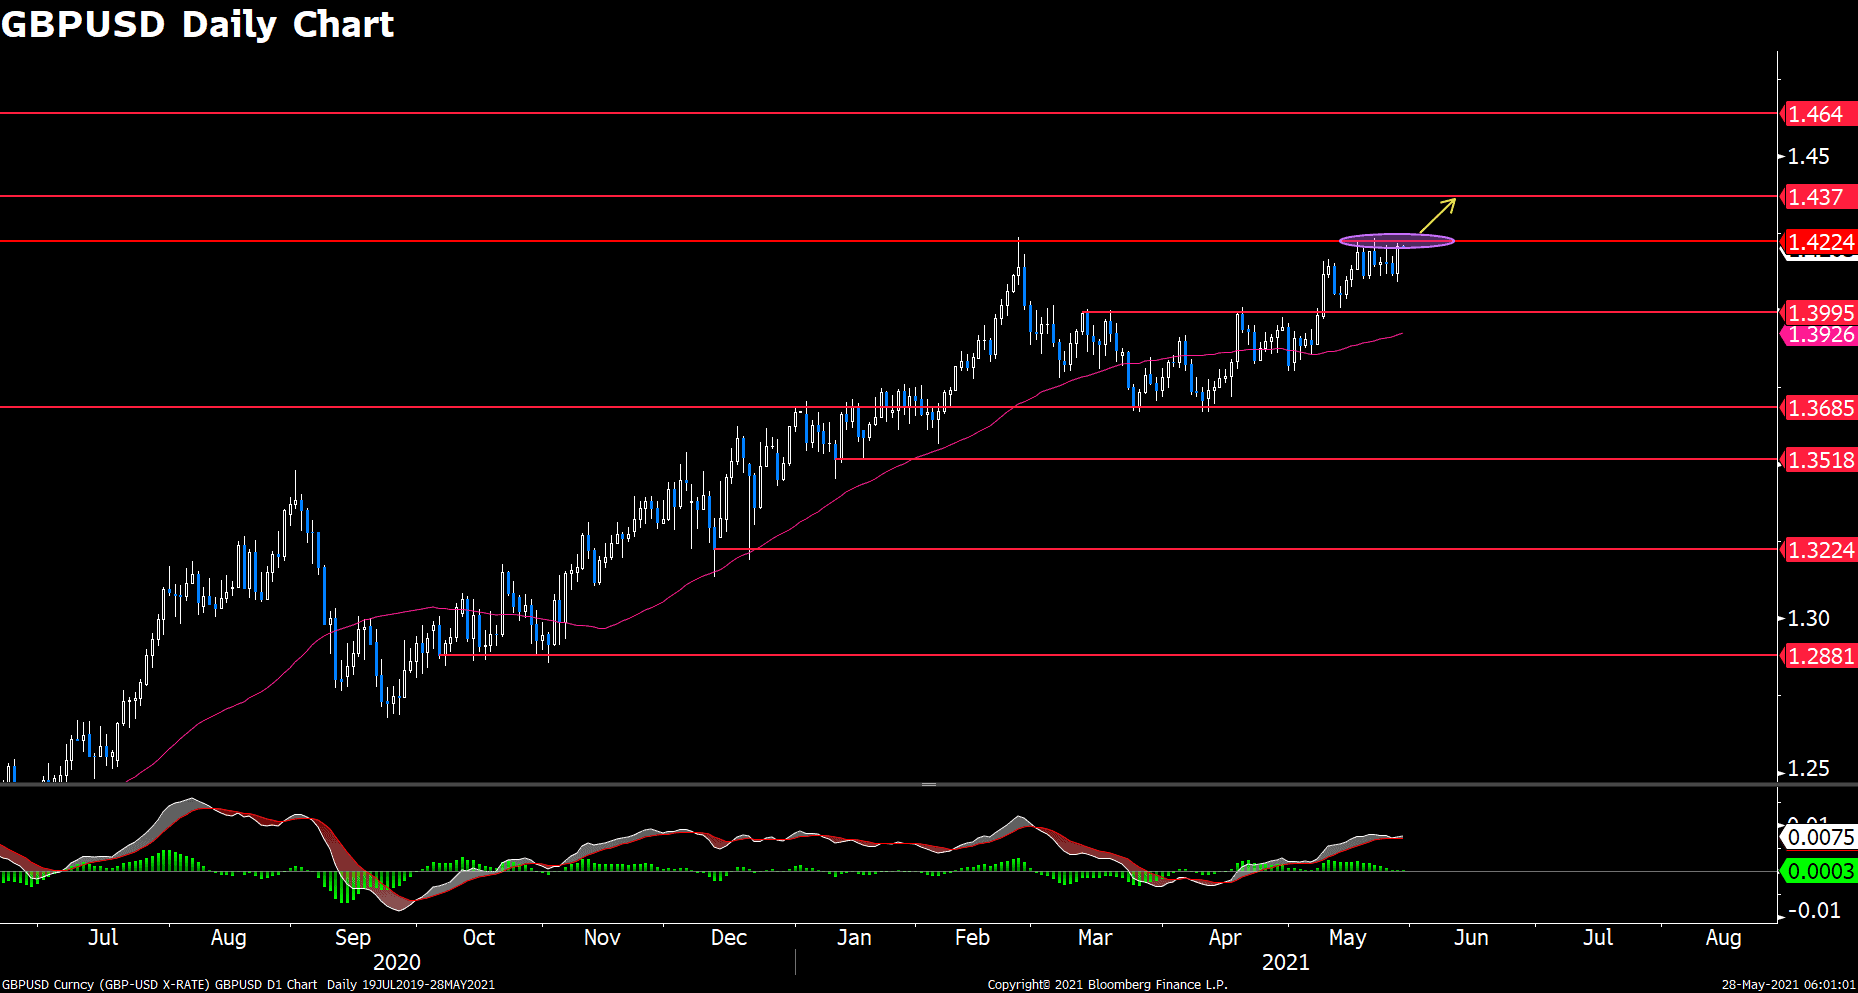
GBPUSD (Daily Chart)
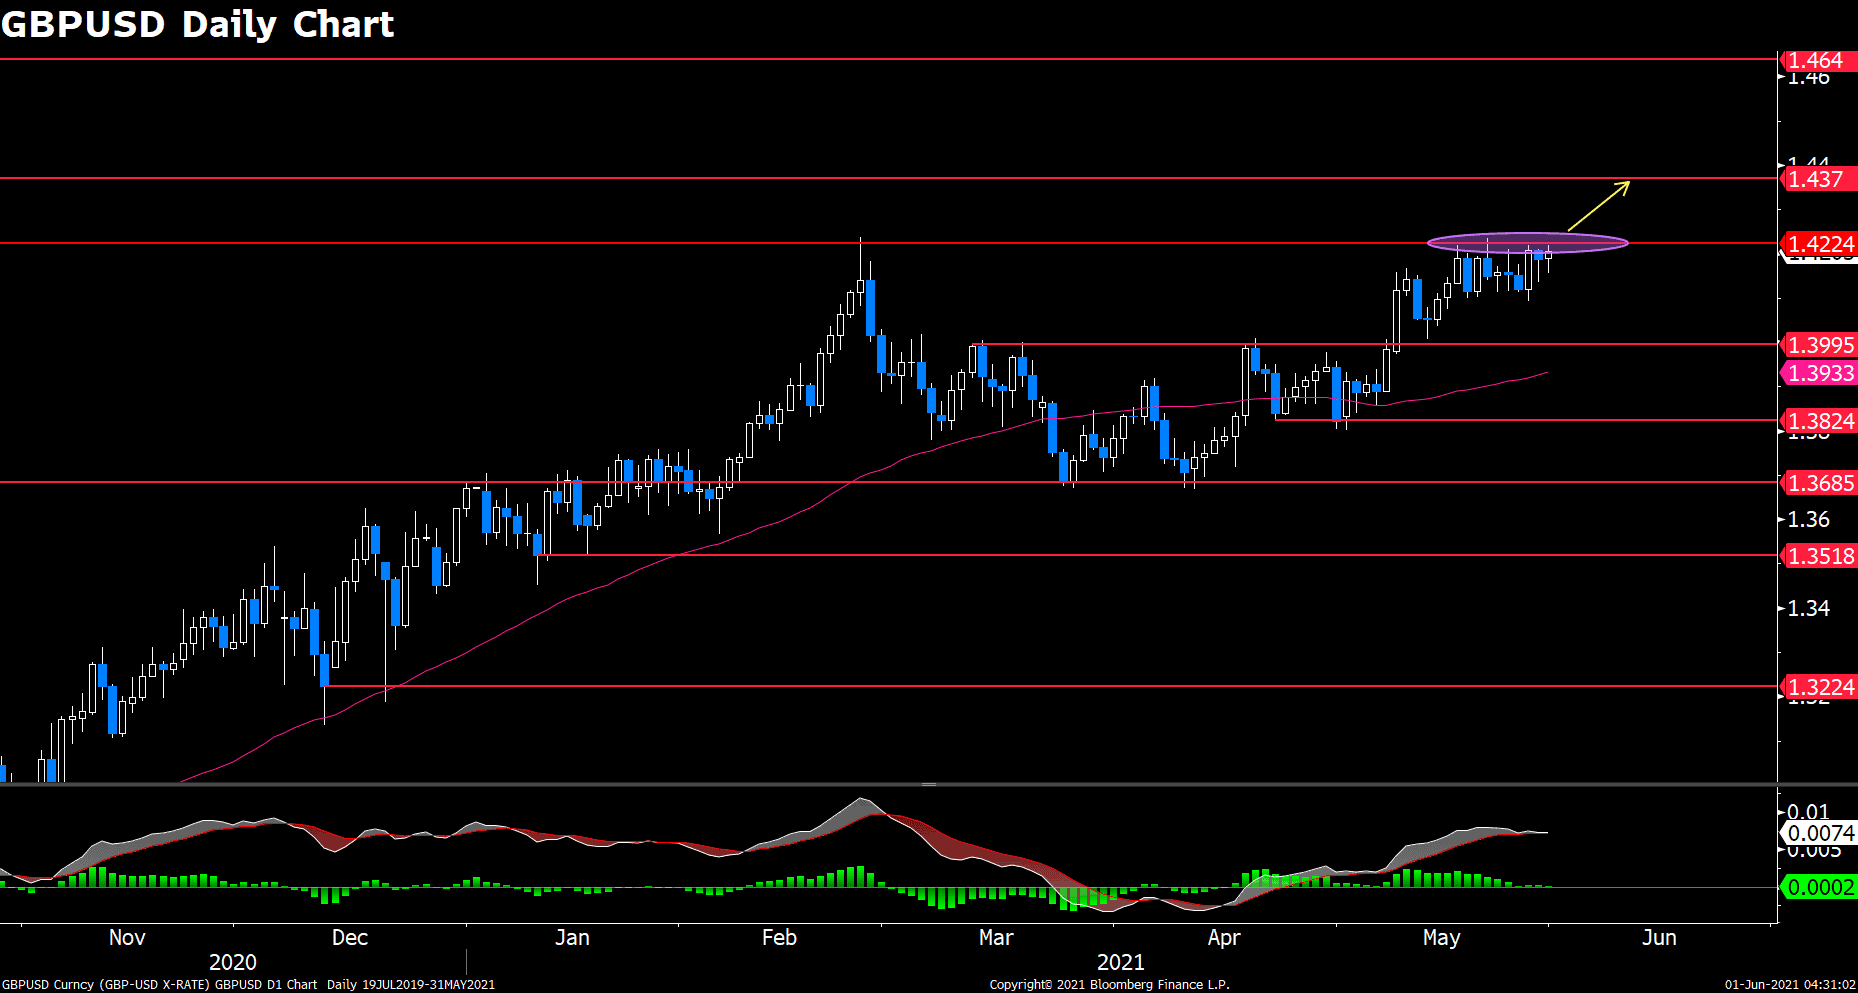
Cable climbed 0.11% as price clings to 1.42. Due to UK and US’s holiday on Monday, trading signals could be misleading given the thin volume in the market. Nonetheless, the bulls are eager to break above this hurdle, which has been capping price from advancing for two weeks. Traders were frustrated by the heavy sideline trading within an impossible tight range between 1.411 and 1.425, if a breakout is about to happen, we expect some big moves coming. Further on the north, the nearest resistance sits at 1.437, next to 1.464.
Resistance: 1.42, 1.437, 1.464
Support: 1.4, 1.382, 1.369
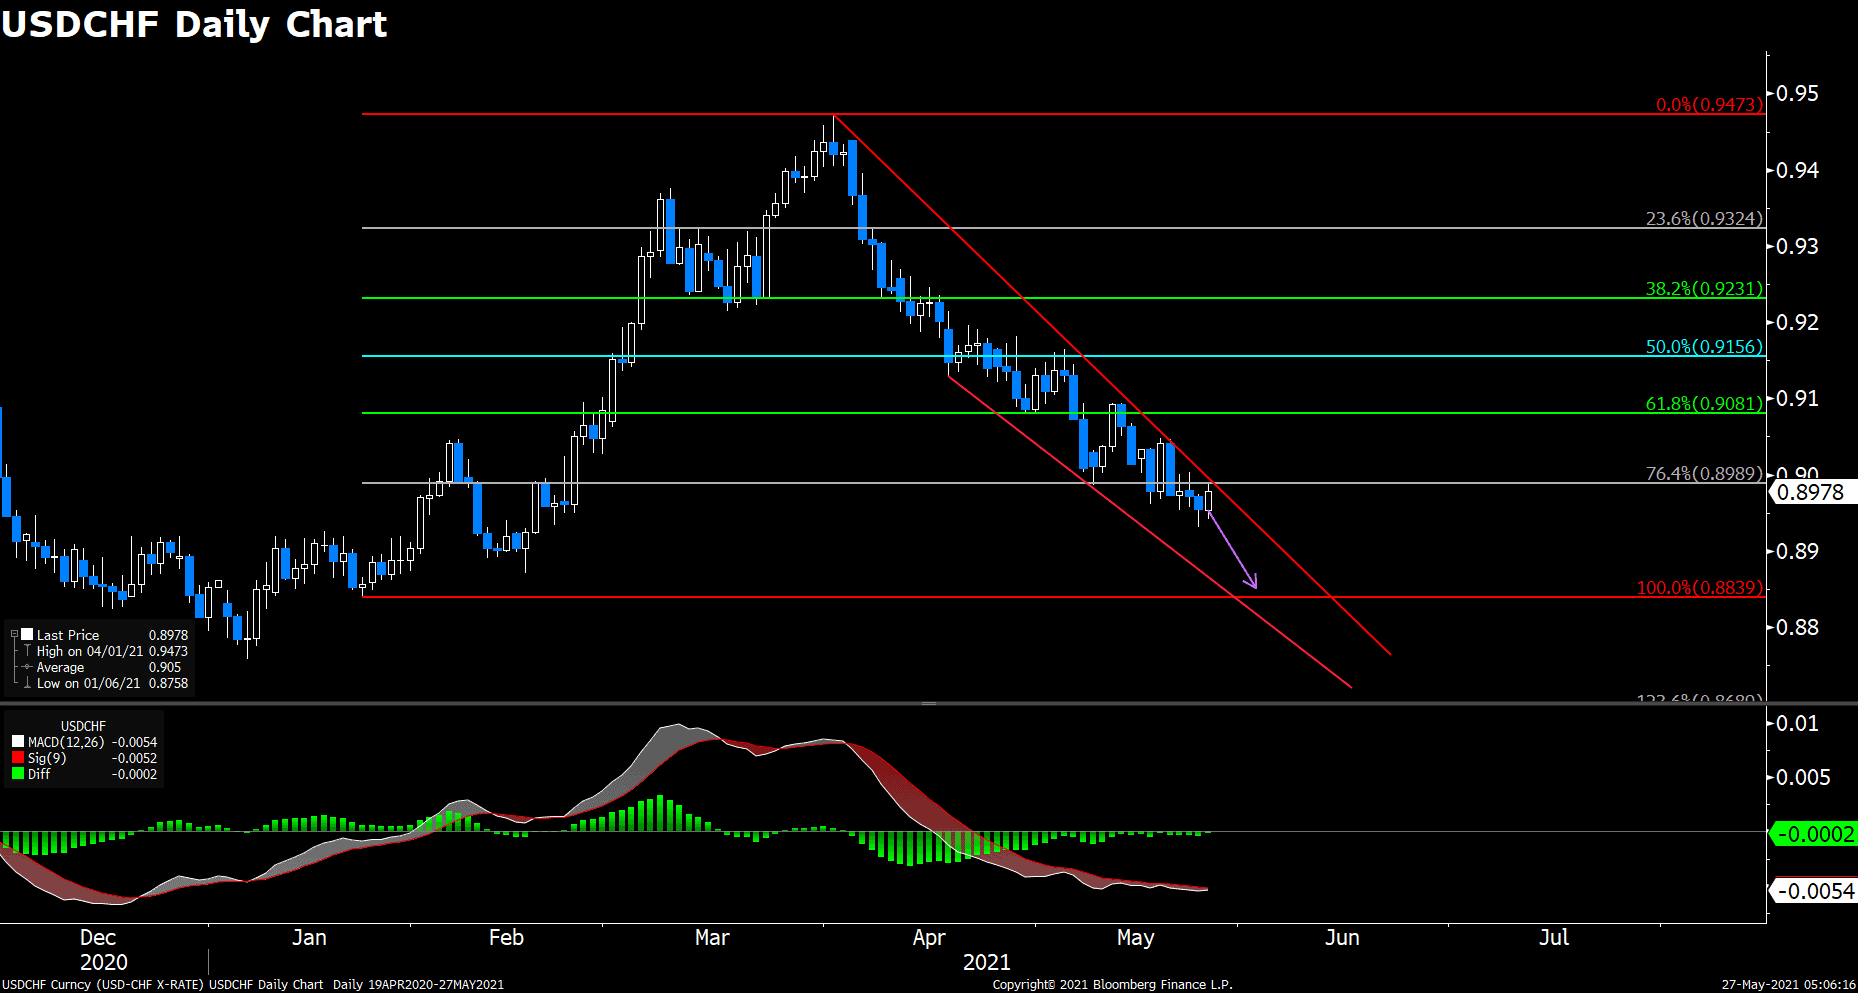
USDCHF (Daily Chart)
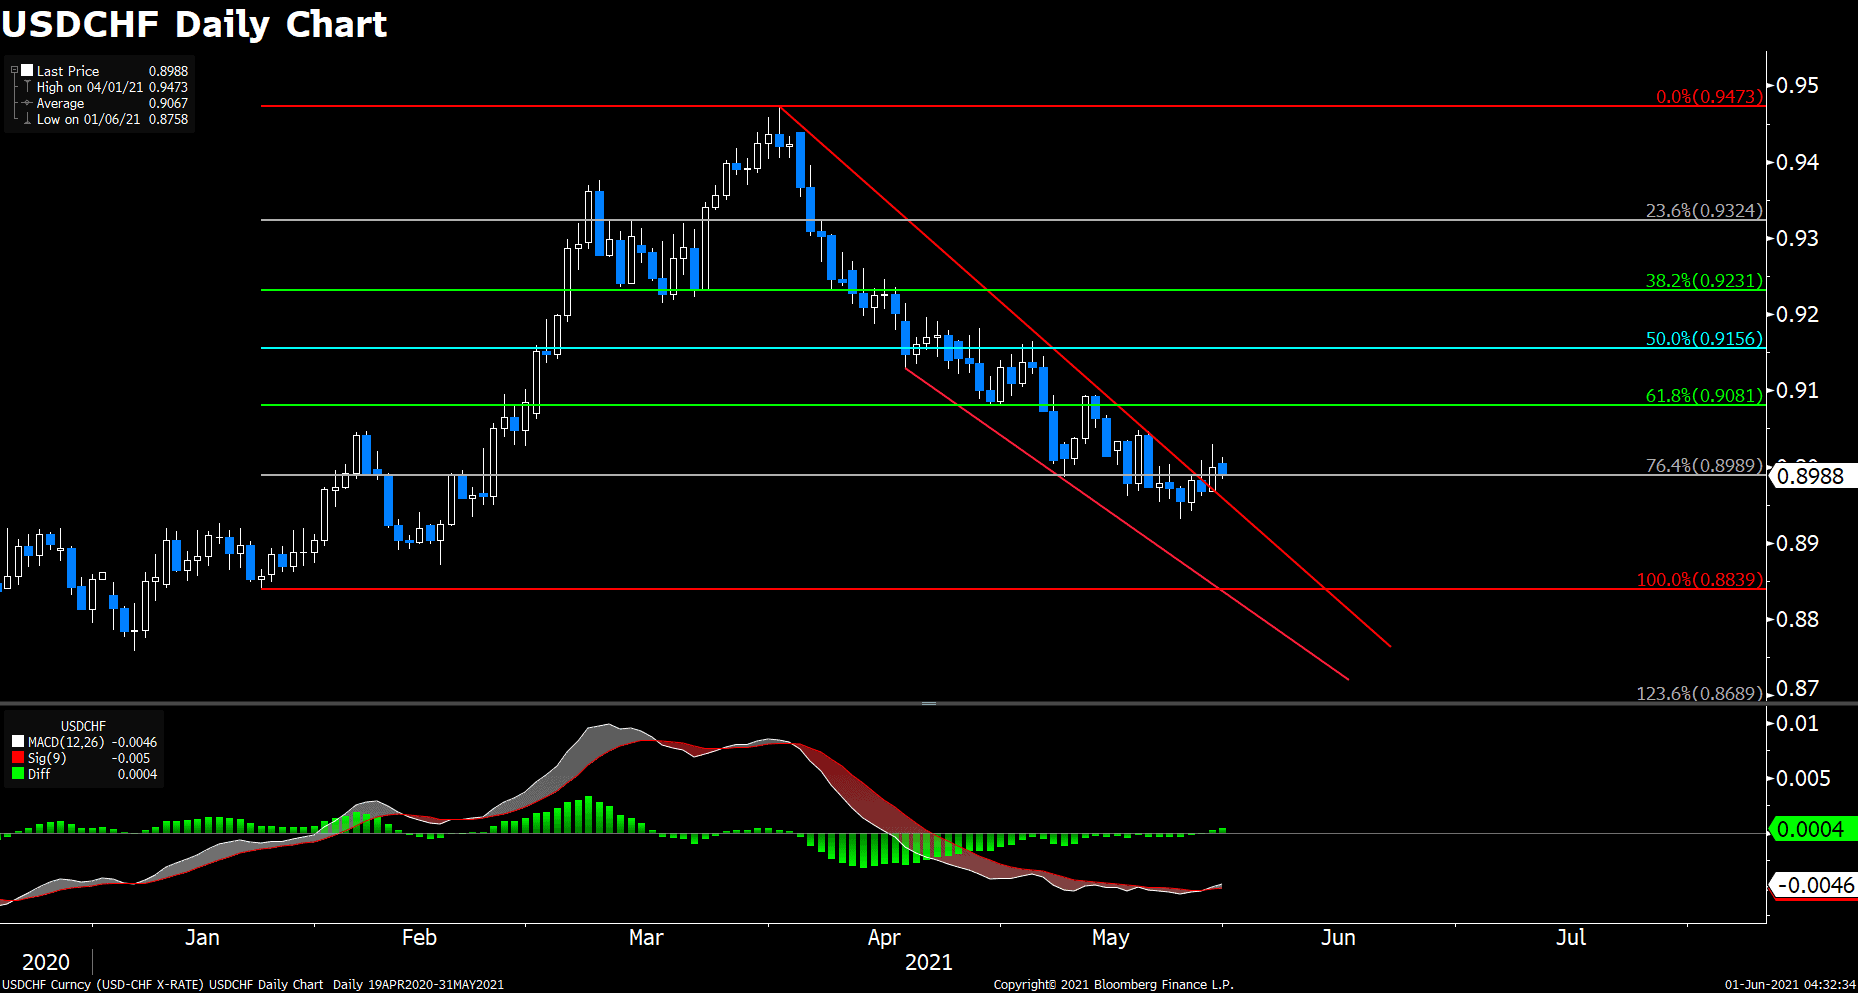
USDCHF is aiming to extend its correction further in the north. The first attempt to break above SMA 20 resulted in failure on last Friday. It is currently revisiting 23.6% Fibonacci at 0.8988, if it could find solid support around this level, then we could see a potential breakthrough from SMA20. Worth noting that this pair has constructed an inverted head-and-shoulder pattern, which echoes with our hypothesis. Conversely, if bidders fail to defend the support line, then bears could threat to take price further south, likely hitting 0.884.
Resistance: 0.9081, 0.9156, 0.9231
Support: 0.8988, 0.884
NZDJPY (Weekly Chart)
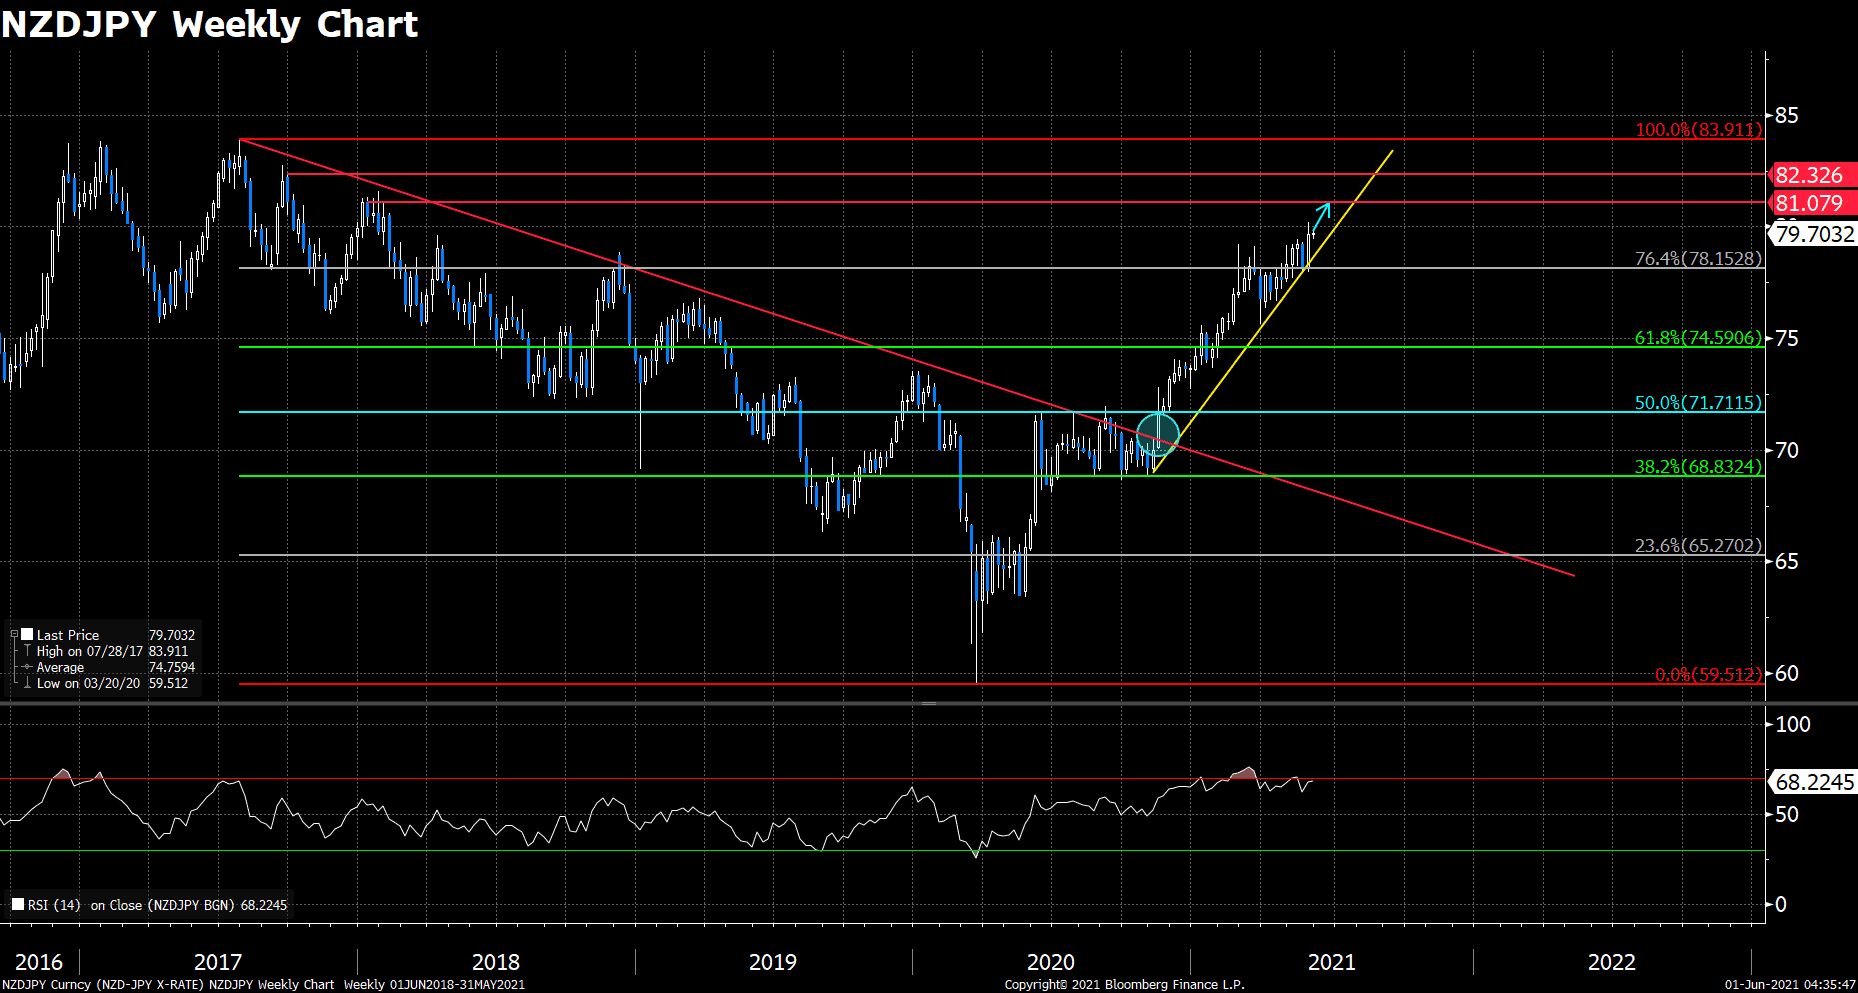
NZDJPY is well placed on an upward trend, gained 0.3% to 79.69 on Monday. This pair has reversed a longer-term bearish trend last November and marked an eye-popping 33% recovery since last year’s low at 59.76. The bulls spent few months struggling to overcome 76.4% Fibonacci level at 78.15, and finally nailed it last week. The overall sentiment remains bullish for NZDJPY given a hawkish RBNZ and concerning virus spread in Japan. In the north, the nearest resistance sits around 81.08, next to 82.3. RSI is very sticky to the overbought zone, but we still expect strong fundamental to overcome technical.
Resistance: 81.08, 82.3
Support: 78.15, 74.59, 71.71
Economic Data
|
Currency |
Data |
Time (GMT + 8) |
Forecast |
||||
|
CNY |
Caixin Manufacturing PMI (May) |
09:45 |
51.9 |
||||
|
AUD |
RBA Interest Rate Decision (Jun) |
12:30 |
0.10% |
||||
|
AUD |
RBA Rate Statement |
12:30 |
|||||
|
EUR |
German Manufacturing PMI (May) |
15:55 |
64.0 |
||||
|
EUR |
German Unemployment Change (May) |
15:55 |
-9K |
||||
|
GBP |
Manufacturing PMI (May) |
16:30 |
66.1 |
||||
|
EUR |
CPI (YoY) (May) (P) |
17:00 |
1.9% |
||||
|
CAD |
GDP (MoM) (Mar) |
20:30 |
1.0% |
||||
|
USD |
ISM Manufacturing PMI (May) |
22:00 |
60.7 |
||||
|
GBP |
BoE Gov Bailey Speaks |
23:00 |


 Euro dollar swing traders could be baffled by the pairs undecisive moves in the past couple days, rose and fell around 50 pips each day. Horizontal support of 1.217 was under fire, and it survived, showing the resilient support level is worthy to defend. Now that we have established a rather strong foundation, the shared currency is set to edge higher against the dollar greenback, likely toward yearly high of 1.235. Recent German bund yields keep rising, with the 10-year yield recovered to -0.142% from January’s -0.6%, and exerts pressure on its US counterpart.