Dear Client,
Please note that adjustment on following products due to Queen Birthday and Youth Day.
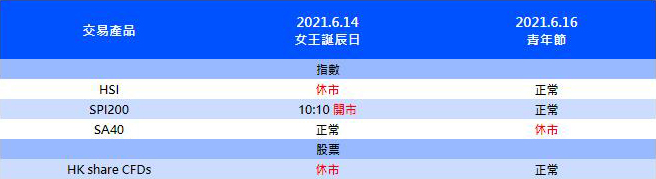
If you have any questions, our team will be happy to answer your questions.Please mail to [email protected] or contact the service online.
Back
Dear Client,
Please note that adjustment on following products due to Queen Birthday and Youth Day.
If you have any questions, our team will be happy to answer your questions.Please mail to [email protected] or contact the service online.
Daily Market Analysis
Market Focus
US equity market was quiet on Tuesday as investors are waiting for the big CPI release on Thursday. The three big equity indices moved less than 0.1% at the end of the day. Meanwhile, the 10-year Treasury yield fell to the lowest in a month, trading at 1.536%.

The economist who helped to shape Federal Reserve’s long-run inflation expectations says central bank needs to get their hands on cutting back its massive bond-purchase program. Brian Sack, former head of Fed Board of Governors two decades ago, says the so called 5Y 5Y forward breakeven inflation rate climbed to a level where further increases would be problematics for the central bank. The mentioned rate reached a seven-year high last month of 2.55%, which implies market participants expect inflation to be 2.55% in the next 5 years on average. Debates over inflation is heating up with economists like Lawrence Summers warns Biden’s infrastructure plan will overheat US economy, but Treasury Secretary Janet Yellen suggests the package wouldn’t be enough to cause an inflation over-shoot.
US is easing its travel advisories on many nations, including Canada, France, and Germany. The CDC lowered 61 countries from a ‘level 4’ discouraged all travel to a ‘level 3’ recommending travel under full vaccination, and 50 countries and territories from ‘level 2’ to ‘level 1’.
The Internal Revenue Service (IRS) asks Congress to authorize data collection on cryptocurrency transactions valued over $10,000. IRS’s Chief Charles Rettig estimates around $1 trillion tax generated in crypto space escapes from IRS each year. Perhaps a much urgent need for the data probing power is to crack down illicit usage of these digital currencies, which have been demanded increasingly by perpetrators of ransomware attacks on corporate computer networks.

Main Pairs Movement:
Moves in the forex space was dollar driven, with the dollar up and other currencies down. Volatility is extremely depressed as traders await for the Federal Reserve to throw something new at the market, until then, most pairs will stay in tight range.
Yen is the worst performer among the G-7 group so far this year. It depreciated 6% against the US dollar, 6.5% against Aussie, 7% against Kiwi, and 11.3% against the Canadian dollar. With developed economies racing to completely eliminate COVID-19, Japan is lagging significantly behind. ‘Only 2.8% of the population has received at least one vaccine dose, and just 1% have had both shots of vaccine,’ according to Forbes. Japanese government is having a hard time carrying out their inoculation plan due to wide distrust of immunizations, which have been rooted within the country for decades. That being said, we will not be surprised to see further extension of emergency lockdowns and a postpone to summer Olympic game. As domestic recession lingers, Japanese investors are set to expand their search for yields abroad, and companies seek expansions in merger and acquisition overseas. These money outflows could further weigh down on the Japanese Yen.
Technical Analysis:
EURUSD (Daily Chart)

EURUSD broke a two-month ascending trendline from downward, and the move was triggered by upbeat ADP data released last Thursday. The fact that the miss in NFP itself did not put the Euro back above the trendline showed traders are perhaps leaning towards a dollar favourable environment in coming weeks. As of current, price is capped by 23.6% Fibonacci level at 1.22, which belongs to a broader consolidation range between 1.225 and 1.217. We expect trading to be sideways until Thursday’s US CPI tells otherwise.
Resistance: 1.22, 1.235, 1.246
Support: 1.21, 1.203
EURCHF (Daily Chart)

EURCHF is well placed within a downward tunnel since March. After rejected by big 1.1 hurdle, price now looks to contest another round number of 1.09, which marks the 28.2% Fibonacci level. We saw this pair had a decent W-formation, but failed to extend above 1.1, which prompted sell orders to pile in and validated a bullish reversal was immaterial. Bears should still be dominant in the medium term. Further on the downside, EURCHF could hit the lower-bound of a descending tunnel if 1.1 is breached.
Resistance: 1.1, 1.112
Support: 1.09, 1.074, 1.067
AUDNZD (Daily Chart)

AUDNZD recovered most of its loss from previous RBNZ’s hawkish shock. The antipodean pair managed to regain 1.072 on Tuesday. We thought defense at 1.072 could be stronger given the confluence of SMA20 and a horizontal resistance line. That being said, it is not far away from a previous trendline, which now could act as a dynamic resistance. We are sticking with our bearish view on this pair given a relatively more hawkish stance from RBNZ and better economic prospect in New Zealand. The jobless rate in New Zealand was 4.7% compared to 5.5% in Australia.
Resistance: 1.08, 1.1
Support: 1.065, 1.052, 1.04
Economic Data
|
Currency |
Data |
Time (GMT + 8) |
Forecast |
||||
|
CAD |
BoC Interest Rate Decision |
22:00 |
0.25% |
||||
|
USD |
Crude Oil Inventories |
22:30 |
-2.036M |
||||
Dear Client,
New contracts will automatically rolled-over as follow.
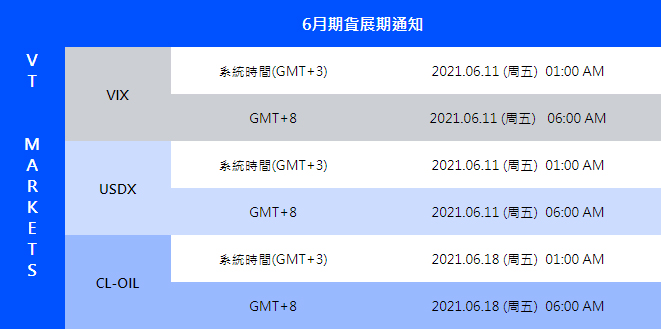
Please note:
• The rollover will be automatic, and any existing open positions will remain open.
• Positions that are open on the expiration date will be adjusted via a rollover charge or credit to reflect the price difference between the expiring and new contracts.
• To avoid CFD rollovers, clients can choose to close any open CFD positions prior to the expiration date.
• Clients should ensure that take profits and stop losses are adjusted before this rollover occurs.
If you have any questions, our team will be happy to answer your questions.Please mail to [email protected] or contact the service online.
Daily Market Analysis
Market Focus
US equity market was mixed as investors remain clueless about Fed’ upcoming move given last Friday’s Non-Farm Payroll data miss. The S&P 500 and Dow Jones Industrial Average closed in the red, down 0.08% and 0.36% respectively. On the other hand, the Nasdaq 100 climbed 0.23% as Biogen Inc. soared on its Alzheimer’s drug approval. Real Estate shares led the gains within S&P 500, while Industrials and Materials performed the worst.

The G-7 nations struck a deal on Saturday to push for a minimum 15% corporate tax. The accord requires large companies to pay more in countries where they operate rather than just where they’re headquartered. “It gives tech companies much more certainty, which is as valuable as lower tax rates, now companies can model out how the tax is going to impact them. It’s much harder to respond to patchwork of digital taxes and tit-for-tat trade disputes,” commented Andrew Silverman, government analyst at Bloomberg.
A report from home financing giant Fannie Mae showed Americans’ record-low willingness to buy home. The percentage of consumers believes now it is a good time to purchase a house dropped to 35% in May, the lowest since Fannie Mae began the survey a decade ago. Although jobs market is improving in the US, consumers fear that rising house prices may not be affordable to them in the near term.
The amount of cash parked at the Federal Reserve’s reverse repo facility is at record high of $486.1 billion on Monday. The money lend to the US central bank are earning 0% interest rate. This reveals commercial banks are in a dire situation by holding a ton of cash, but little investment options.

Main Pairs Movement:
The macroeconomic calendar had little to offer today. Investors are waiting for first-tier events to be out later this week, including the release of US CPI figures and the European Central Bank (ECB) statement on monetary policy.
The dollar index is falling for the second day in a row. Market participants seem continue to digest the NFP disappointment. The Treasury Bond yield is still lingering below 1.6%, while the Dow Jones dropped around 0.4%.
EURUSD has increased 0.52% since last Friday, while GBPUSD levitates few pips below the 1.42 figure. The Japanese pair approaches the 109 level, and commodity-linked currencies like AUDUSD and NZDUSD remain their uptrend, both gained around accumulated 1% in the past two trading days.
Gold once touched $1900 soon after the end of the North America Session, and then declined due to the lack of buying power.
Loonie pair closed positive due to the decrease in oil prices, both WTI and Brent fell at the start of the week.
Technical Analysis:
USDCAD (Daily Chart)

Loonie has consolidated between the 1.20 to 1.215 interval for 3 consecutive weeks. After the disappointing NFP data, the pair lost nearly half of its gain from the previous day last Friday, and the dimming hope of rebound seemed shattered. The MACD histogram shows a bullish trend ongoing, while RSI suggests that USDCAD faces a selling pressure. Amid the mixed market sentiment, maybe the BoC Rate Statement on Wednesday will provide investors a better view of the pair’s future movement.
Resistance: 1.215, 1.225, 1.237
Support: 1.20, 1.192
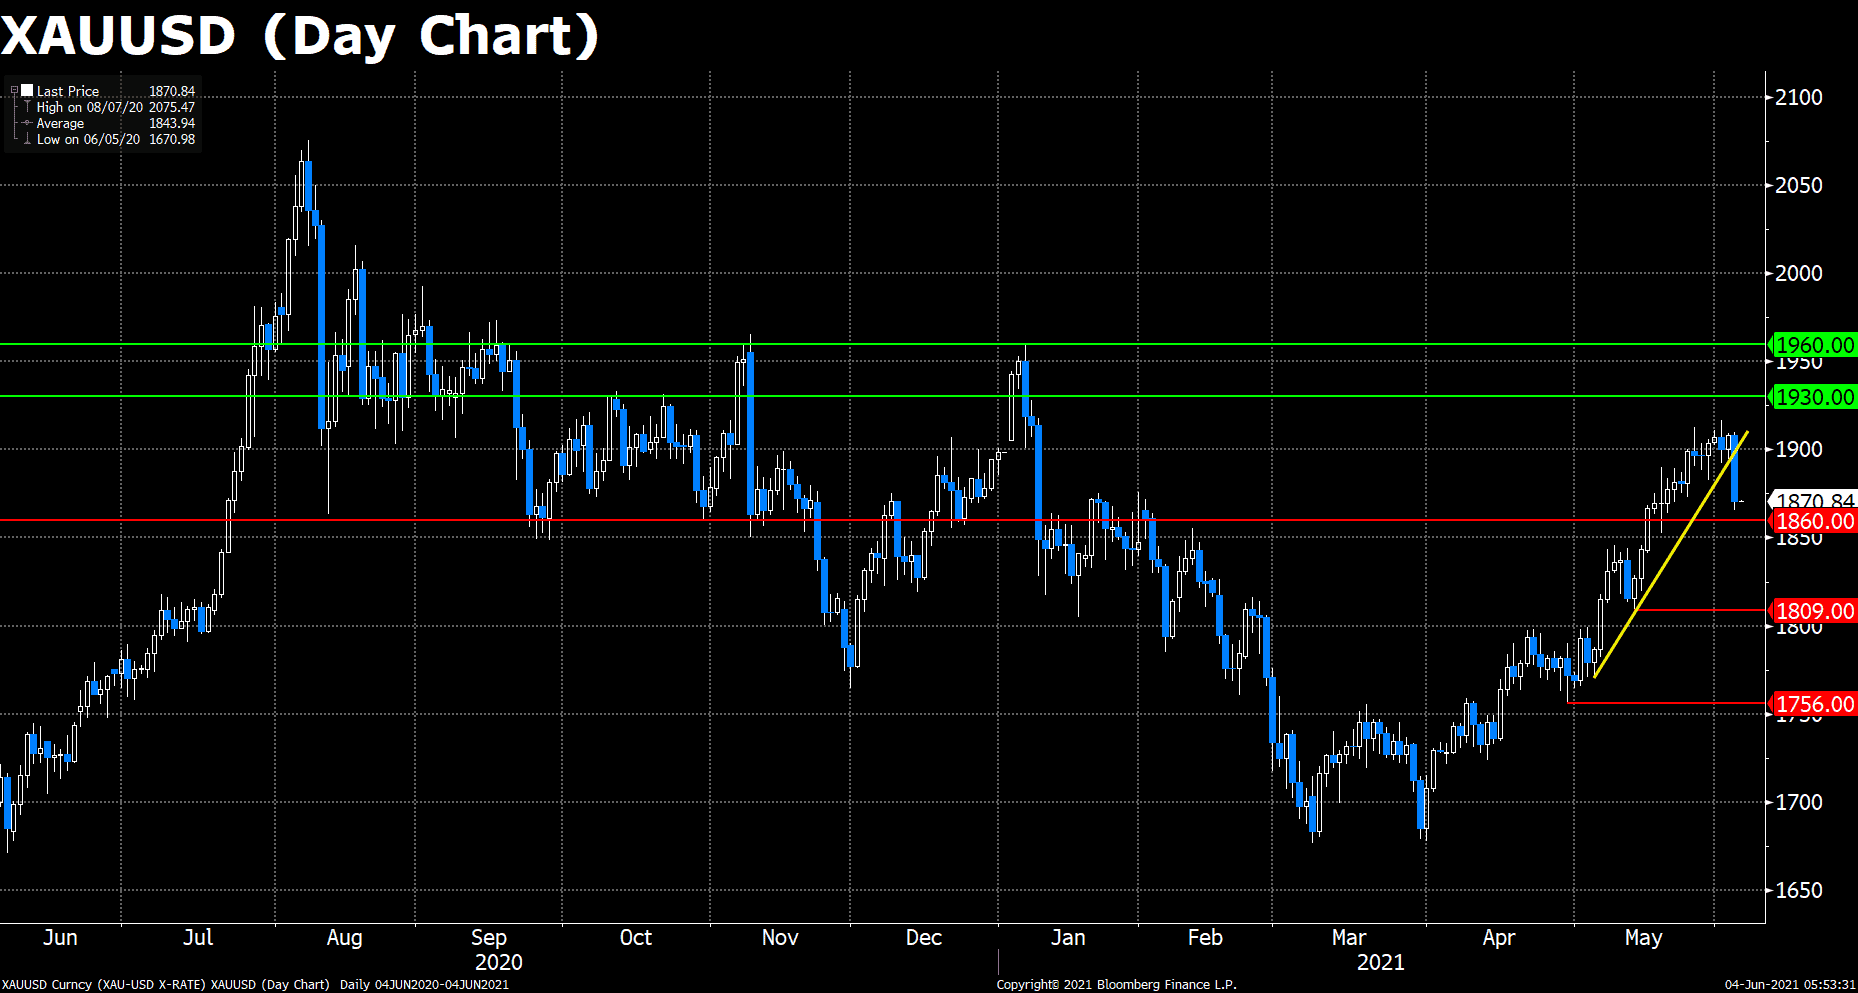
XAUUSD (Daily Chart)

XAUUSD has fully recovered from its steep decline last Thursday, traded at $1899.57 as of writing. Benefit from the lower Treasury yield and absence of U.S. tapering policies, gold may keep its bullish momentum in the short run. Also, the RSI indicator is holding above 60, suggesting that the buyers still have the upper hand. The first resistance for the pair may appear at $1930, followed by $1960, the yearly high; for the downside, the latest floor $1860 may be supportive, then $1809 if breached.
Resistance: 1930, 1960
Support: 1860, 1809, 1756
USDCHF (Daily Chart)

Just boosted by the upbeat ADP research report last Thursday, USDCHF then experienced a severe decline the next day after the released NFP data failed to catch up. As swissy was again unable to break the 38.2% Fibonacci resistance, bears are likely to prevail in the short run. The pair now trades below 0.9, as well as the RSI indicator fell below 50. The instant support for swissy may appear at 0.8926, where 23.6% Fibonacci lies, and for the worse cases, the yearly low 0.8758 was its last barricade against further depreciation.
Resistance: 0.9031, 0.9115, 0.92
Support: 0.8926, 0.8758
Economic Data
|
Currency |
Data |
Time (GMT + 8) |
Forecast |
||||
|
JPY |
GDP (QoQ) (Q1) |
07:50 |
-1.2% |
||||
|
EUR |
German ZEW Economic Sentiment (Jun) |
17:00 |
86.0 |
||||
|
USD |
JOLTs Job Openings (Apr) |
22:00 |
8.300M |
||||
Dear Client,
Warmly reminds you that the component stocks in the stock index spot generate dividends. When dividends are distributed, VT Markets will make dividends and deductions for the clients who hold the trading products after the close of the day before the ex-dividend date.
Indices dividends will not be paid/charged as an inclusion along with the swap component. It will be executed separately through a balance statement directly to your trading account, the comment for which will be in the following format “Div & Product Name & Net Volume ” .
Please note the specific adjustments as follows:
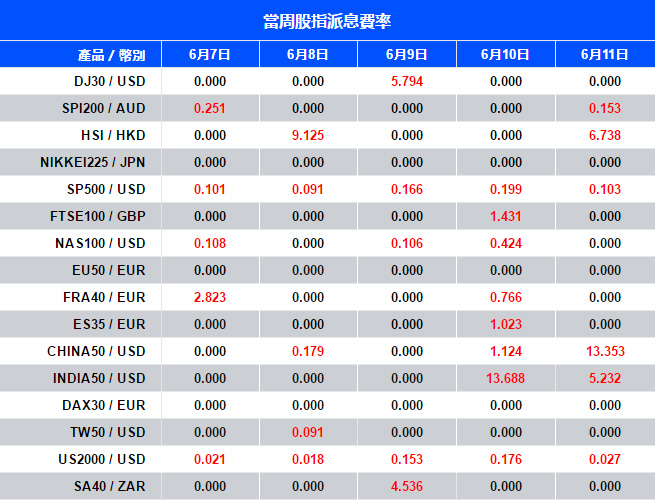
If you’d like more information, please don’t hesitate to contact [email protected].
Daily Market Analysis
Market Focus
US equities advanced albeit disappointing Non-Farm Payroll data. Technology shares led the gains on Friday with the Nasdaq 100 index up 1.8%. Meanwhile S&P 500 and Dow Jones Industrial Average climbed 0.9% and 0.5% respectively. Traders struggle to find clues on the Fed’s next moves amid soft jobs data. The 10-year US Treasury yields fell to 1.56%. 
The G-7 group is reaching a deal to implement a minimum corporate tax of 15% in international negotiations. Finance ministers are due to meet in London this weekend. The discussion includes topics like how to divide levies on multinational tech giants such as Facebook Inc. and Amazon.com Inc. French Finance Minister Bruno Le Maire said on Friday that “clearly 15% is only a starting point, and if it is higher, it is better to have a level of rate that is higher than 15%.”
Bitcoin slipped as much as 9% after Elon Musk’s tweet implied about ‘breaking up’ with Bitcoin. The decline dented the leading crypto’s recovery from $33,500, dragged down other coins as well. Speculators are puzzled to Musk’s motives for sending out these tweets, especially when his missives are contradicting to each other.

Main Pairs Movement:
The dollar index dropped 0.4% after Friday’s Non-farm Payroll came lower than expected. The world´s largest economy gained only 559,000 jobs in May, below 664,000 expected. Concerns of sooner than expected tapering have been eased given the underperformance in jobs market. However, it does not imply inflation is slowing down in the US. In fact, the month-on-month average weekly earnings grew at 0.5%, more than doubled from forecast. Given the shortage in labour, employers are left with no choice but to offer higher pay to attract workers. In the long term, growth in wage should push inflation higher, but when inflation is running hot by stimulus injection, we wonder where this number may land as more people are returning to the workforce.
USDCAD dipped 0.25% despite disappointing Net Change in Employment in Canada. Labour market weakened for a second month, lost 68,000 jobs in May amid a third wave of COVID-19 virus spread. However, drags in the macro figure were offset by rallying oil price, which is one of Canada’s major exports. WTI and Brent crude oil futures continue to make new highs, gained 0.83% and 0.45% respectively.
Technical Analysis:
XAUUSD (Daily Chart)

With the help of downbeat NFP data, Gold recovered more than half of yesterday’s slump. Early in the day, downward pressure managed to drive price to contest a rather steep ascending trendline, which could be interpreted as a validation to current bullish trend. Worth to note that daily RSI is cooled off by yesterday’s plunge, helping to alleviate some of the friction to move price further north, For now, gold buyers will keep the rein until it hits much tougher resistances like $1960 and $2000.
Resistance: 1960, 2000
Support: 1854, 1822, 1790
USDJPY (Daily Chart)

After two days of disruptive data releases from the US, USDJPY is back to its previous downward trajectory. Price is about to kiss the five-month ascending trendline, which survived multiple breakouts attempts since April, but will be under stressed as the 10-year US treasury yield failed to put a solid footing above 1.6%. A breakdown from this dynamic support line could open doors to further downside gain, and bearish reversal would be more convincing if we see USDJPY making a lower-low around 108.62. In the south, bears could revisit support at 107.9 in the near term, followed by distant 106.72.
Resistance: 109.7, 111, 112.1
Support: 107.9, 106.7
GBPUSD (Weekly Chart)

Cable is still trapped within a consolidation zone between 1.411 and 1.424, and it has gone absolutely nowhere in the past three weeks. In the weekly chart, GBPUSD looks to snap its four-consecutive win and marks a third rejection from 2018’s high of 1.424 in recent weeks. More importantly, the construction a Doji pattern could signal a potential correction in this pair. Looking to the downside, the immediate support sits around 1.41, followed by a big psychological level at 1.4.
Resistance: 1.42, 1.437, 1.464
Support: 1.41, 1.4, 1.382
Economic Data
|
Currency |
Data |
Time (GMT + 8) |
Forecast |
||||
|
CHF |
Unemployment Rate n.s.a. (May) |
13:45 |
|||||
|
EUR |
German Factory Orders (MoM) (Apr) |
14:00 |
1.0% |
||||
|
CNY |
Exports (YoY) (May) |
22:59 |
32.1% |
||||
Daily Market Analysis
Market Focus
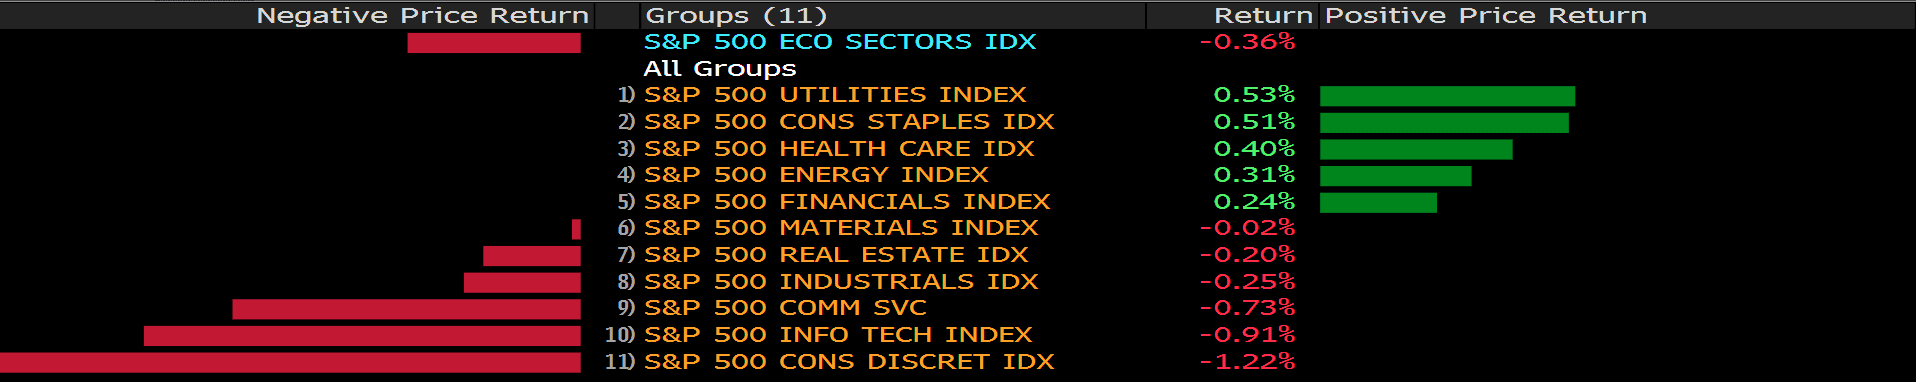
US equities fell amid upbeat economic data, and investors are growing concern that strong data may push the Federal Reserve to withdraw from the easy monetary policy sooner than expected. Tech shares led the decline with the Nasdaq 100 index dipped 1.07% on Thursday. In the S&P 500, Utilities and Consumer Staples stocks both gained around 0.5%, while Consumer Discretionary had even worse performance than Techs.
President Joe Biden proposed a 15% minimum tax on US corporations along with strengthen IRS enforcement efforts as a way to fund a bipartisan infrastructure package. The new proposal sets aside his previous plan to raise corporate income from 21% to 28%. The offer does not mean that Biden is ditching his larger ambitions to raise taxes on corporations, the proposal as simply a bid to find common ground in the Capito talks, according to a person familiar with the discussions.
Russia may move away from dollar dominated oil contracts if President Joe Biden’s administration continues to impose sanctions on the oil rich nation. Meanwhile, Russia is said to reduce its $186 billion National Wealth Fund to 0. Russian Finance Minister Anton Siluanov told reporters on Thursday that instead of investing in dollar assets, the NWF will seek alternatives like Euro, Yuan, and gold assets. These changes are expected to take place next month. Once completed, share of euro assets in the fund is expected to stand at 40%, the yuan at 30% and gold at 20%.

Main Pairs Movement:
Dollar soared 0.65% to 90.49 amid strong US economic data on Thursday. ADP research report showed there were 978,000 new jobs in the US, beating expectation of an increase of 650,000 jobs. The ADP figure finally came above economists’ forecasts, which have been downbeat for three-months in a row, therefore rising the prospect for upcoming official Non-farm Payroll on Friday. Jobless claims in the US were declining in the last week of May, the figure came slightly better than anticipated 390,000, printed 385,000. Lastly, the ISM Services PMI came out at 64, refreshed the highest number in decades, the reopening is bringing the crowd back from lockdowns and social restrictions as CDC announced on May 13th that fully vaccinated people don’t need to wear a face mask in most areas.
Multiple forex pairs are finally stepping outside of their consolidation zone, such as EURUSD, AUDUSD, and USDJPY. However, they are not completely out of the woods yet, we still need to see NFP numbers to get a clear picture on where the Fed might be heading. If US jobs market is improving in line with or exceed Fed’s expectation, then monetary officials will soon kick off their talks in tapering. If not, then we are back in the wait-and-see game, where the US government needs to find a fix for labour shortage caused by decreased incentive to work and lack of child-care resources.
Gold plummeted nearly 2%, the largest one-day loss since late February where the selloffs were brutal. Traders are exiting their positions in early indication of better jobs market in the US. Rumors suggest the Besel III update on June 28th may potentially remove non-allocated gold as tier-1 asset, which could cause a squeeze on bullion banks, and benefits large physical gold holders like central banks. If this event were to materialize, Gold should be in a upward trajectory in the long run.
Technical Analysis:
XAUUSD (Daily Chart)
Much to our surprise, XAUUSD stumbled and fell under its upward trajectory before the NFP release, as the U.S. ADP Employment Change data well beat Wall Street’s consensus. Gold fell around $30 earlier today, traded at $1871.75 as of writing. Despite the massive chaos caused by the previous data, the incoming Fed’s Chair Powell speech and NFP are still the main dishes, providing us about the Fed’s attitude toward tapering and the U.S.’s pace of recovery.
The pair now encounters a fork in the road. On the upside, gold may surge back to $1900, and challenge resistances like $1930 and $1960; on the downside, however, the instant defense will be at $1860, and once breached, gold may experience a severe adjustment, leading it back to mid-May’s level at $1810, even worse at $1756, the price level in late April.
Resistance: 1900, 1930, 1960
Support: 1860, 1809, 1756
USDCHF (Daily Chart)

Swissy broke its two-week silence right after the U.S. upbeat macros and solidly breached the 0.9 fences that the pair failed to take down in past attempts. The rebound may seem unexpected, but there have been several hints from the technicals. RSI suggests a rekindled buying power since May 7th, while MACD histogram just formed a golden cross last week.
Looking to the Fibonacci, the pair has just hit the 23.6% level and is challenging 38.2% as of writing. In cases of accelerating inflations and delayed Fed’s tapering or other serious macro incidents, Swissy may plunge to its 2-week low at 0.893, or worse, yearly low at 0.876.
Resistance: 0.903, 0.92, 0.947
Support: 0.893, 0.876
AUDUSD (Daily Chart)
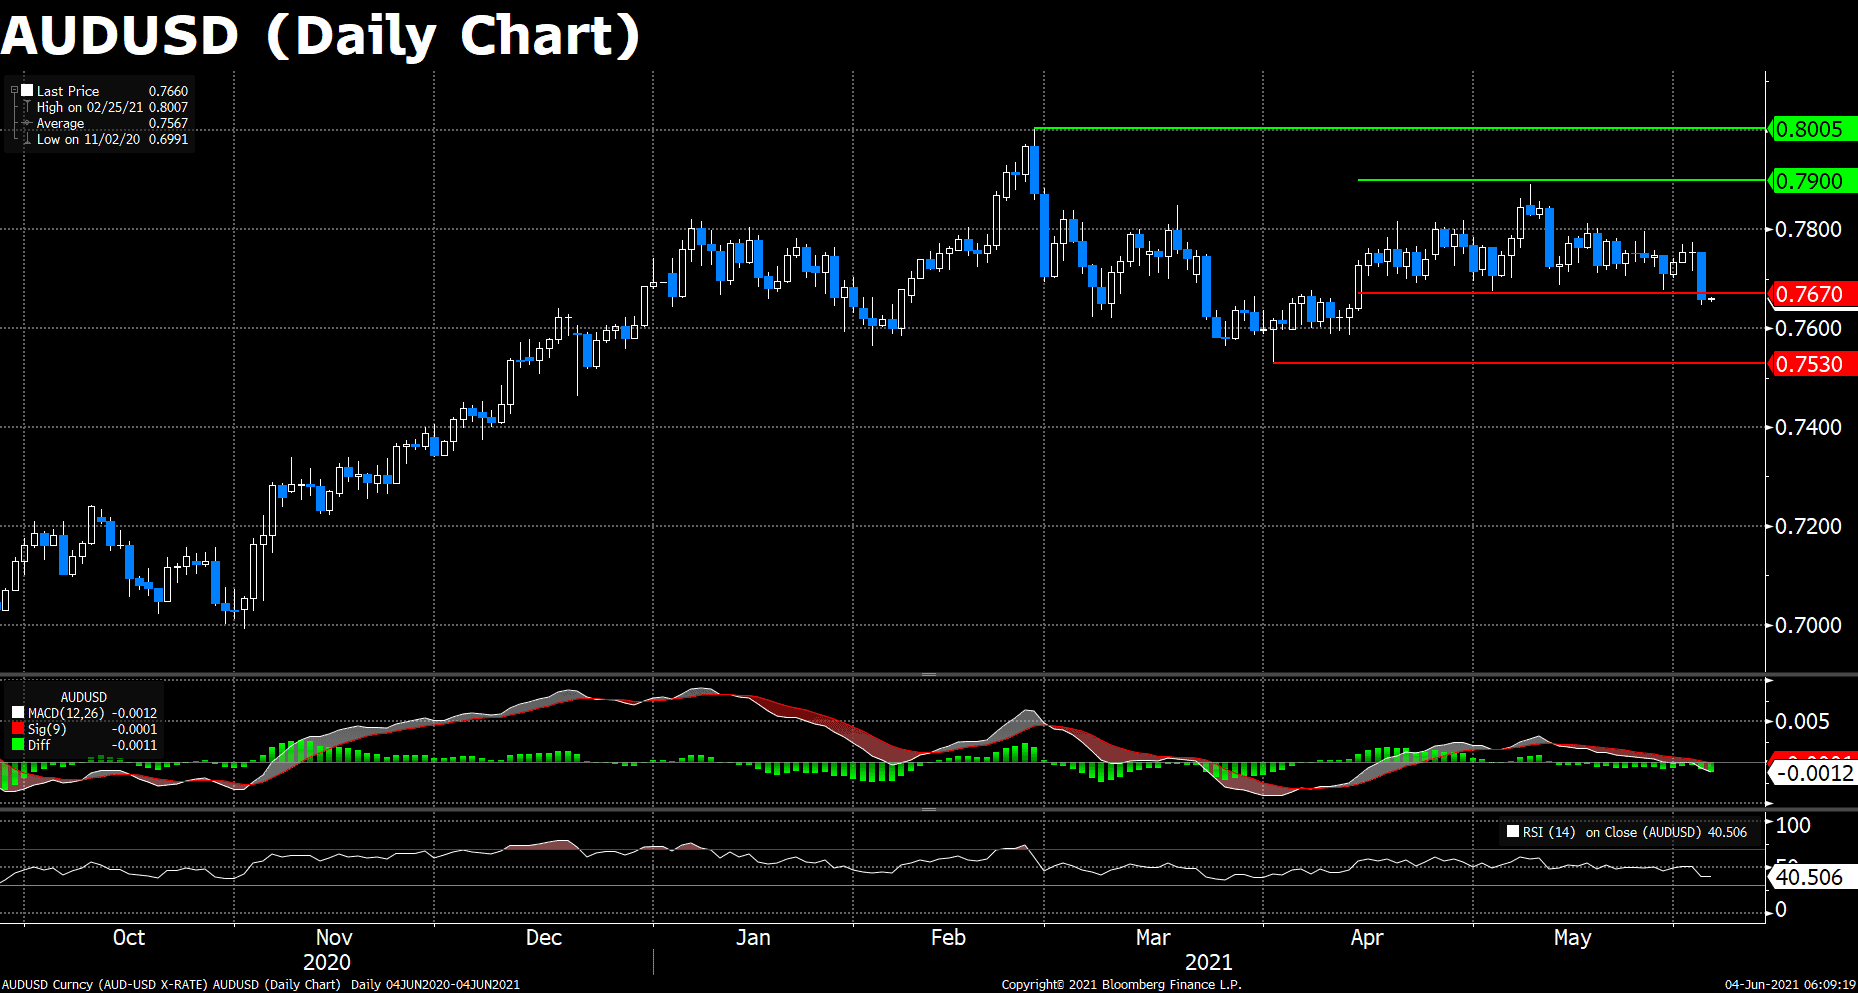
Aussie just plummeted over its lowest price since mid-April, traded 0.7654 as of writing. Before that, the pair have stocked in a relatively small interval, 0.767 to 0.79, for about one and a half months, with not much exciting news between the two countries. The main reason for this breakthrough still springs from the abovementioned cheering US data and the following speculation of about-to-come tighter monetary policy.
Compared to that, the dull economic performance of Australia seems to provide downside tractions as technical indicators appear bearish. RSI is at its monthly low of 40.84, while MACD is negative. The estimated support line for the pair may be its previous lower bound of 0.767 and the yearly low of 0.756, whilst the resistance awaits the unlikely rebound at the monthly high of 0.79, followed by the yearly high of 0.8005.
Resistance: 0.79, 0.8005
Support: 0.767, 0.756
Economic Data
|
Currency |
Data |
Time (GMT + 8) |
Forecast |
||||
|
NZD |
RBNZ Gov Orr Speaks |
15:00 |
|||||
|
GBP |
Construction PMI (May) |
16:30 |
62.3 |
||||
|
USD |
Fed Chair Powell Speaks |
19:00 |
|||||
|
EUR |
ECB President Lagarde Speaks |
19:00 |
|||||
|
USD |
Nonfarm Payrolls (May) |
20:30 |
650K |
||||
|
USD |
Unemployment Rate (May) |
20:30 |
5.9% |
||||
|
CAD |
Employment Change (May) |
20:30 |
-20.0K |
||||
|
CAD |
Ivey PMI (May) |
22:00 |
|||||
Daily Market Analysis
Market Focus
US equities rose on Wednesday amid mixed investment sentiment. The three big indices closed in the positve territory. The S&P 500 edged 0.14% higher with Energy stocks continue to outperform, and Materials shares lagged. Meme stocks are making a comeback. AMC Entertainment Holding Inc. soared as much as 125% to 40.23 and marked a disturbing 3520% price appreciation since January.

President Joe Biden plans to amend Trump’s China blacklist this week. Under the amended order, Treasury department will add a number of companies to the existing list that could face financial penalties for their connection to China’s defense and surveillance technology sectors, people familiar with the matter said.
BlackRock CEO Fink said investors may be underestimating the potential for a spike in inflation. He further commented that “most people haven’t had a forty-plus year career, and they’ve only seen declining inflation over the last 30-over years.” Fink along with other well-known economists criticized President Joe Biden’s infrastructure plan could risk the US economy running into hyperinflation.

Main Pairs Movement:
USDJPY climbed little 0.08% on Wednesday. Seiji Adachi, a board member from Bank of Japan, signaled the bank’s readiness to act if Fed’s tapering could trigger unexpected spikes in Yen. In normal circumstances, US greenback should strengthen when the Fed winds down asset purchases. It is somewhat odd to see BoJ officials prepared to defend the Yen this early when the Fed is still talking about talking about tapering, or perhaps Japenese policy makers already spotted something peculiar in the market.
GBPUSD was playing tug-of-war as virus narrative diverged between Indian variant spreading concern and record low death numbers. Britain recorded a day without deaths, for the first time since the pandemic. It is interesting to see how scientists are assigning Greek alphabet to various virus variant. The B.1.617.2 COVID-19 strain, aka Indian variant, was given a new name of Delta variant. The UK variant is labelled as Alpha, whereas South African variant is named Beta.
Gold rallied 0.42% to the highest close in almost five months. Investors are waiting for the big non-farm payroll report on Friday while assessing the Federal Reserve’s views on growth and inflation. The Fed highlighted in its Beige book report on Wednesday that US recovery picked up somewhat in April and May, though price pressures mounted. The report also cited companies struggled with higher input prices, supply chain disruptions and a shortage of workers.
Technical Analysis:
USDJPY (Daily Chart)

USDJPY lost traction during late EU sessions, giving back all daily gains. Upside was rejected by 109.85 resistance, and is moving toward a five-months ascending trendline. The dynamic upward support line survived multiple breakouts attempts since April, but will be under stress once again if US treasury yields move lower. Friday’s NFP will provide the catalyst that Forex market desperately needs to move forward, if we were to see another downside surprise to US labor market, USDJPY will collapse to 107.9, or possibly to 106.7 in the near term.
Resistance: 109.7, 111, 112.1
Support: 107.9, 106.7
USDCAD (Daily Chart)

USDCAD remains heavily depressed amid rising oil prices. OPEC+ group was quite optimistic on oil price outlook, and they will gradually bring back oil supply. Even Iran’ potential revival of its oil output could hurt oil price, it would just be a hiccup in a longer-term process. Overall, the bearish trend will still be dominant until we see a much lower price, like 1.162, but it must go through 1.1925 and 1.18. Weekly RSI of 23 is flagging an extreme oversold condition.
Resistance: 1.23, 1.24, 1.264
Support: 1.1925, 1.18, 1.162
EURUSD (Daily Chart)

Today’s move in EURUSD very much resembles the one from last Friday, where it plunged and recovered, creating a long tail wick. Demand for the euro remains relatively strong as bidders are showing dedication in defending the horizontal support at 1.217, which coincides with SMA20 on the daily chart. However, this pair is still in a limbo zone between 1.217 and 1.225 given the current uncertainties in Fed’s responses to mixed economic figures. As of current, we still hold a bullish view on EURUSD unless there is a something new coming out from the Federal Reserve.
Resistance: 1.225, 1.235, 1.246
Support: 1.217, 1.195, 1.17
Economic Data
|
Currency |
Data |
Time (GMT + 8) |
Forecast |
||||
|
AUD |
Retail Sales (MoM) (Apr) |
09:30 |
1.1% |
||||
|
GBP |
Composite PMI (May) |
16:30 |
62.0 |
||||
|
GBP |
Services PMI (May) |
16:30 |
61.8 |
||||
|
USD |
ADP Nonfarm Employment Change (May) |
20:15 |
650K |
||||
|
USD |
Initial Jobless Claims |
20:30 |
390K |
||||
|
USD |
ISM Non-Manufacturing PMI (May) |
22:00 |
63.0 |
||||
|
USD |
Crude Oil Inventories |
23:00 |
-2.443M |
||||
Daily Market Analysis
Market Focus
US equities edged lower despite upbeat US Manufacturing number came out on Tuesday. The S&P 500 index lost 0.05% with Energy shares led the gain, while Health Care stocks performed the worst. OPEC+ group agreed to gradually ease production cuts in June and July. In accordance with its April decision, the group will allow to supply 2.1 million barrels per day between May and July. The group is also seeking to balance pick up in demand with the possible increase in Iranian output. Iran is in negotiation with six world powers to bring back its oil output at a cost of suspending the nation’s nuclear program.

Financial institutions in Japan must accelerate efforts to prepare for the transition away from Libor as the expiry of the benchmark could affect financial contracts worth trillions of dollars. Akira Otani, the head of BoJ’s financial markets department, stated “we’re no longer at a stage to wonder whether it’s doable or not, we’re at the stage where we have to get it done.” The country will face big challenge at the end of this month with a local deadline for phasing out use of the benchmark in new transactions.
Reserve Bank of Australia kept cash rate unchanged at 0.1%, here are Bloomberg’s key takeaways from RBA’s monetary statement:

Main Pairs Movement:
Euro dollar climbed as much as 0.23% amid decent German employment data, but all gains was erased later in the day, leaving the pair essentially unfazed. German unemployment numbers declined 15,000 in May, beating forecast of 9,000. The economic activities in manufacturing sector continue to improve in German with Manufacturing PMI came marginally higher than expected, printed 64.4. A similar data came out on the other side of the pond, US ISM Manufacturing PMI ring to 61.2 from 60.7 in April, showing a steady recovery from the pandemic.
Cable tried to break above 1.42 hurdle, but failed to capitalize its earlier gains and closed 0.4% lower at the end of the day. Downbeat Manufacturing PMI in the UK just happened to be the factor weighing down on the Sterling, the figure came slightly under expectation of 66.1, printed 65.6. With concerns of the spreading India variant, UK authorities are speeding up their vaccination campaign, aiming to vaccinate 75% of the population by the end of the month.
Crude Oil look to close above two-year high, Brent and WTI crude futures settled around $71.17 and $68.65 respectively. It is somewhat surprising to see USDCAD is holding up quite well despite rising fuel prices, but still range bounded between 1.2133 and 1.2025.
Technical Analysis:
XAUUSD (Daily Chart)

After 2 mouth’s uprise, XAUUSD seems to be blocked by a cap price out of nowhere. In nearly a week’s consolidation, gold took 3 attenpts to break the $1910 resistence but failed, including the one yesterday, and it traded at $1902.79 as of writing. However, gold remains its uptrend and has backed by its 20-day SMA since mid-Apirl. The fundimentals are still in favor of gold: greanback is still weak, the reflation threat still haunt the whole market, and U.S. pace to recovery is still unclear. Gold may run up toward its upside tractions around $1930, further challenge the yearly top at $1960.
The instant support for gold may be the psycholocial $1900, under that we have 10-day SMA level which is around $1890, followed by 20-day SMA’s $1860.
Resistance: 1910, 1930, 1960
Support: 1900, 1894, 1867
USDCAD (Daily Chart)

Loonie has again broken its record yesterday, once traded at 1.2005, its lowest level in nearly six years. The renewed bearish pressure may derive from the rising oil prices that capitalized the commodity-sensitive CAD, and the contunued weakness of the greenback also add fuel to the bears. Meanwhile, investors is looking forward to the NFP and Canada Unemployment Rate data released on Friday to provide further instructions.
For a possible rebound, the instant resistence may be at 1.215 which has not been breached for two weeks, followed by 1.225, the past support level from February, 2018, and 1.237, the monthly low in March, 2021; however, if the downward trajectory continues, the last baricade for the loonie may be at 1.192, an ancient support from May, 2015.
Resistance: 1.215, 1.225, 1.237
Support: 1.20, 1.192
EURUSD (Daily Chart)

EURUSD has held a bullish tone since the beginning of April, coincided with the start of the greenback’s fall. Recently, the dollar index lingered around its four-month lows, as the Fed’s dovish reaction toward the emerging reflation. Last Thursday, despite Fed implies a tapering discussion at upcoming meetings, but with substantial progress unlikely to be achieved until late 2021, the US dollar continues to behave weaker even after President Joe Biden announced his fiscal 2022 budget, which should be a huge boost to bucks. Back to technical, EURUSD is traded at 1.2215 as of writing, with its upward trend challenged by the resistance level of 1.225. The MACD histogram shows a bull-bear fight, while RSI indicator has not reached the overbought territory, giving the pair more rooms to extend further north. An obvious support for the potential downturn may appear at 1.217, which has been tested several times last week, followed by 1.205, the period low after the Mother’s Day. (U.S.)
Resistance: 1.225, 1.235
Support: 1.217, 1.205
Economic Data
|
Currency |
Data |
Time (GMT + 8) |
Forecast |
||||
|
AUD |
GDP (QoQ) (Q1) |
09:30 |
1.5% |
||||
|
GBP |
BoE Gov Bailey Speaks |
23:00 |
|||||
Dear Client,
To provide our clients with a wealth of trading options, VT Markets will launch new products on June 7, 2021.
The details as shown in the table below.
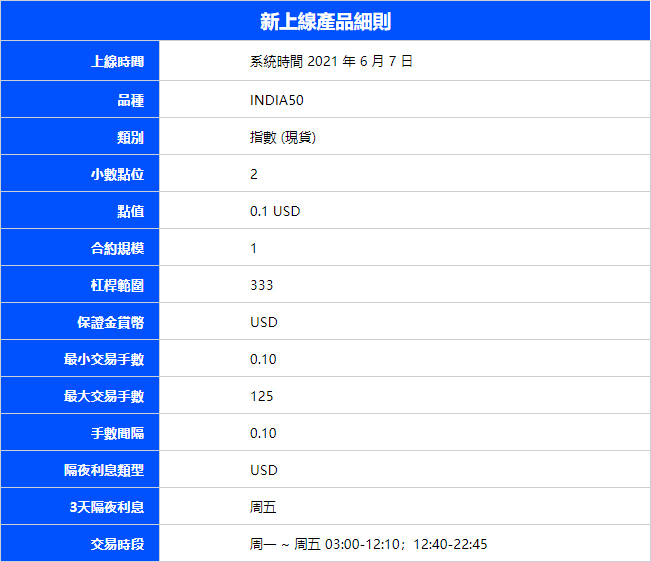
The above data is for reference only, please refer to the MT4 software for specific data.
If you’d like more information, please don’t hesitate to contact [email protected].
Hello there 👋
Hello there 👋
Scan the QR code with your smartphone to start a chat with us, or click here.
Don’t have the Telegram App or Desktop installed? Use Web Telegram instead.


