Daily Market Analysis
Market Focus
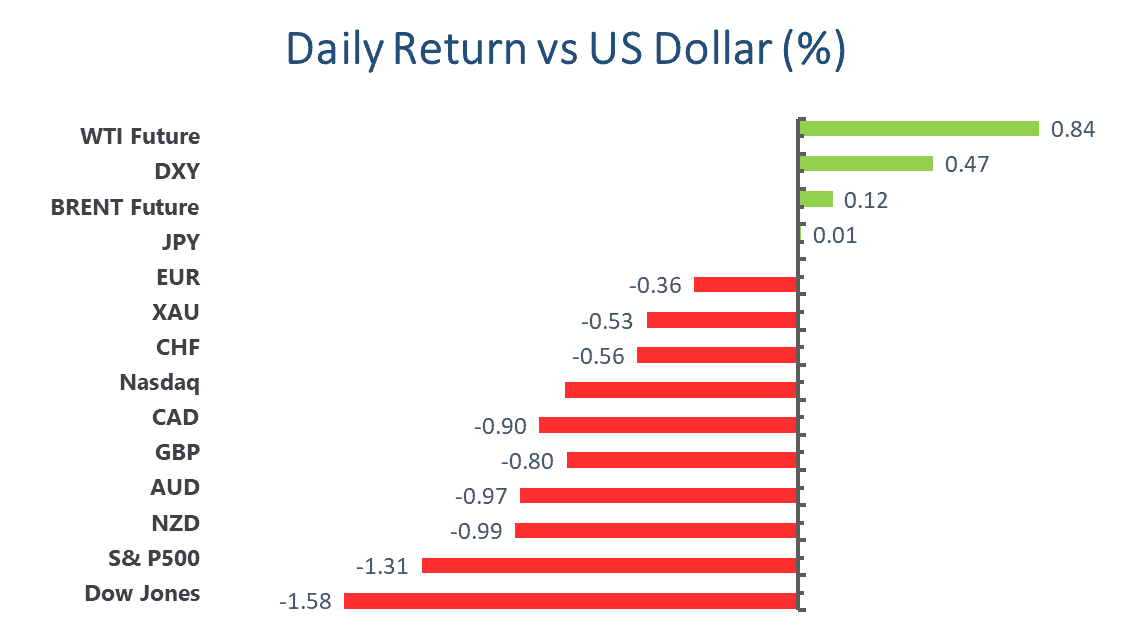
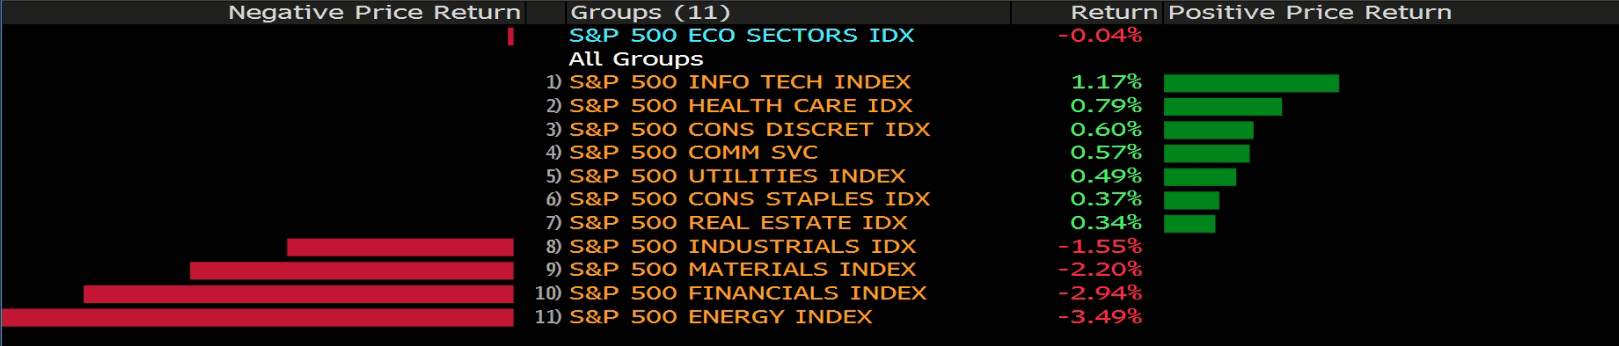
Reflation trades that have ruled the market for most of 2021 were in retreat Thursday. Stock market was mixed. Dow Jones slumped 0.62%, while Nasdaq rose 0.87%. Tech stocks are back in favor of the investors, the old world order in stock seems back as reopening trade takes lumps.
“The recent moves across the curve are interpreted by some as a sign of declining growth prospects,” said Adam Phillip, managing director of protfolio strategy at EP Wealth Advisors. “And when the outlook for growth dims, investors gravitate back to growth-oriented stocks.”
On the other hand, debates amid the newly signed federal holiday have taken place in the Wall Street. While most government workers will be granted paid time off Friday as the holiday falls on Saturday this year, the same won’t be true for financial markets. Before deciding whether to close , U.S. exchanges rely on input from several participants including banks, broker-dealers and regulators.
The Fed plans to operate normally Friday and Monday, but SEC decides a day-off. Any decision about whether to make Juneteenth a market holiday “will be part of our annual calendar review during which we consult with stakeholders,” Katrina Cavalli, a Sifma spokeswoman, said in an e-mailed statement. CMC Group Inc., the wrold’s largest futures exchange, will follow Sifma’s lead, according to its spokeswoman. The holiday also falls on a weekend in 2022.
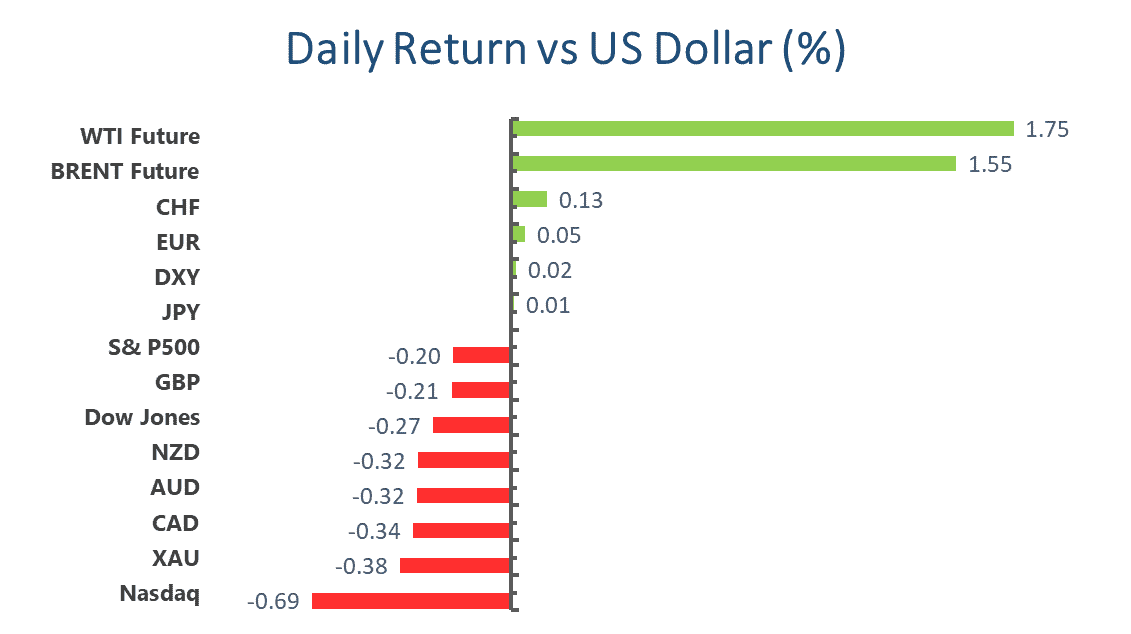
Main Pairs Movement:
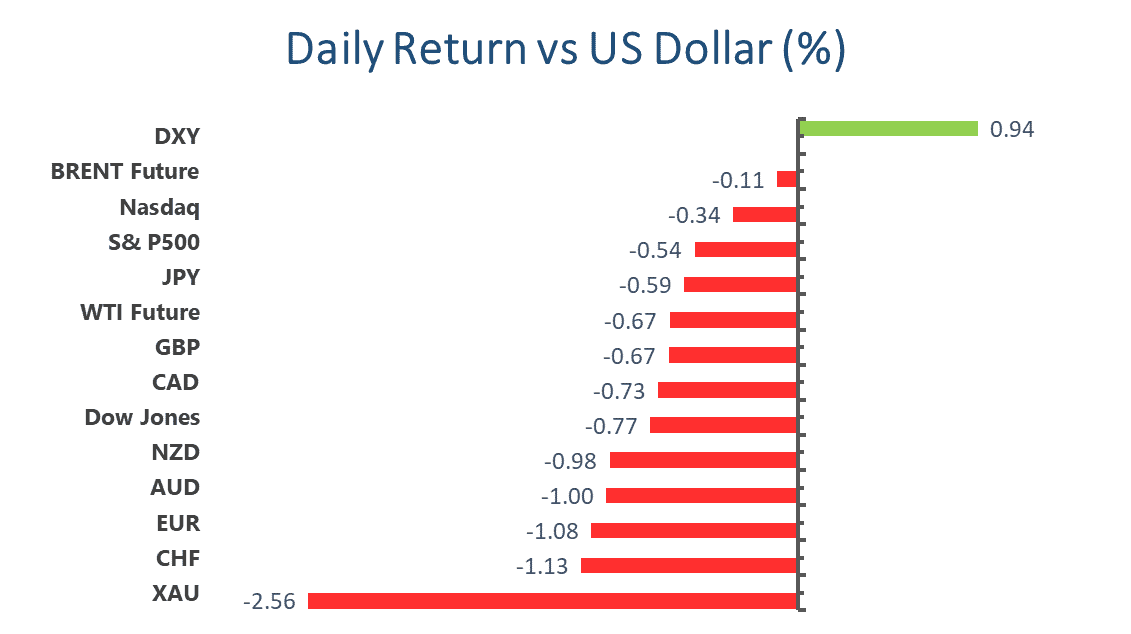
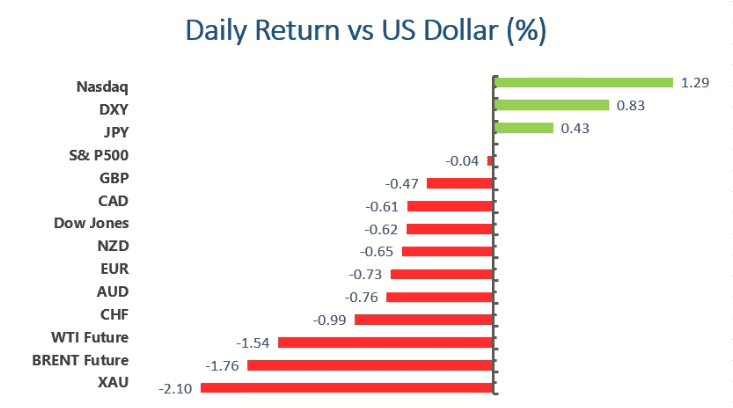
Greenback continued to win over most of its major rivals, except JPY, which was supported by falling government bond yields. However, traders keep pricing in the latest hawkish stance from the US Federal Reserve, which indicated two rate hikes in 2023 amid escalating growth and inflation forecast.
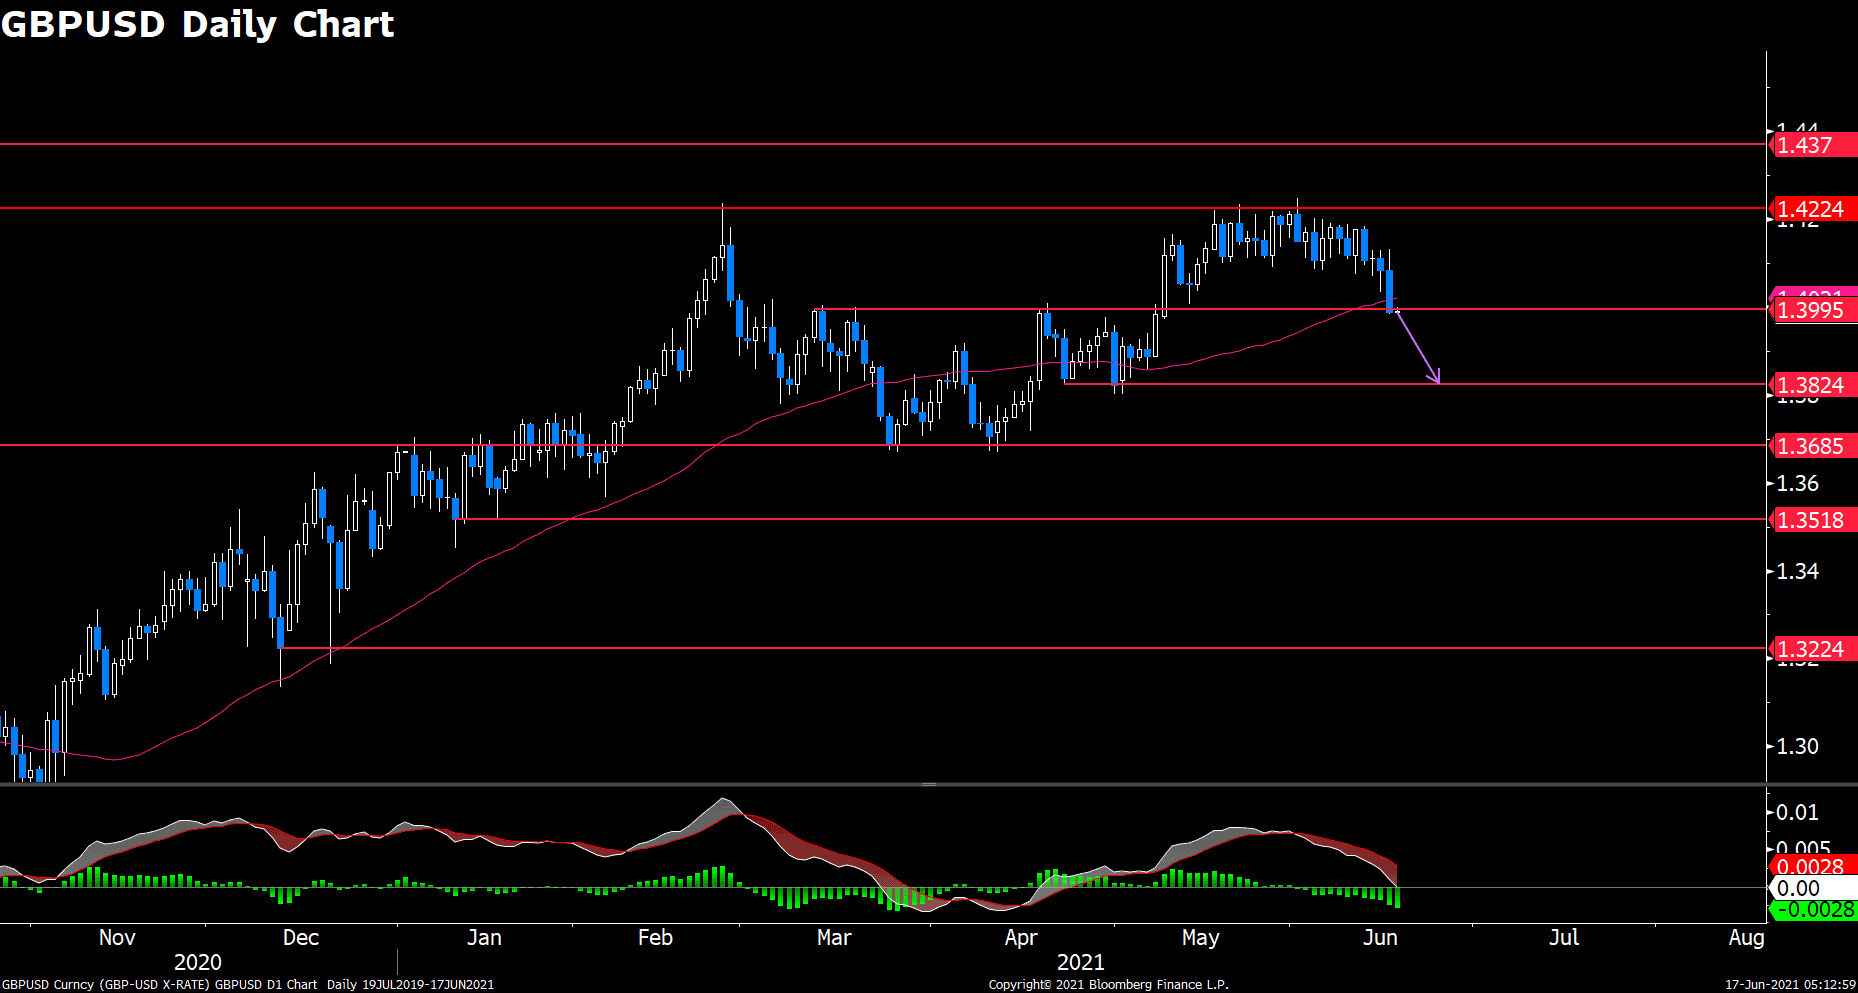
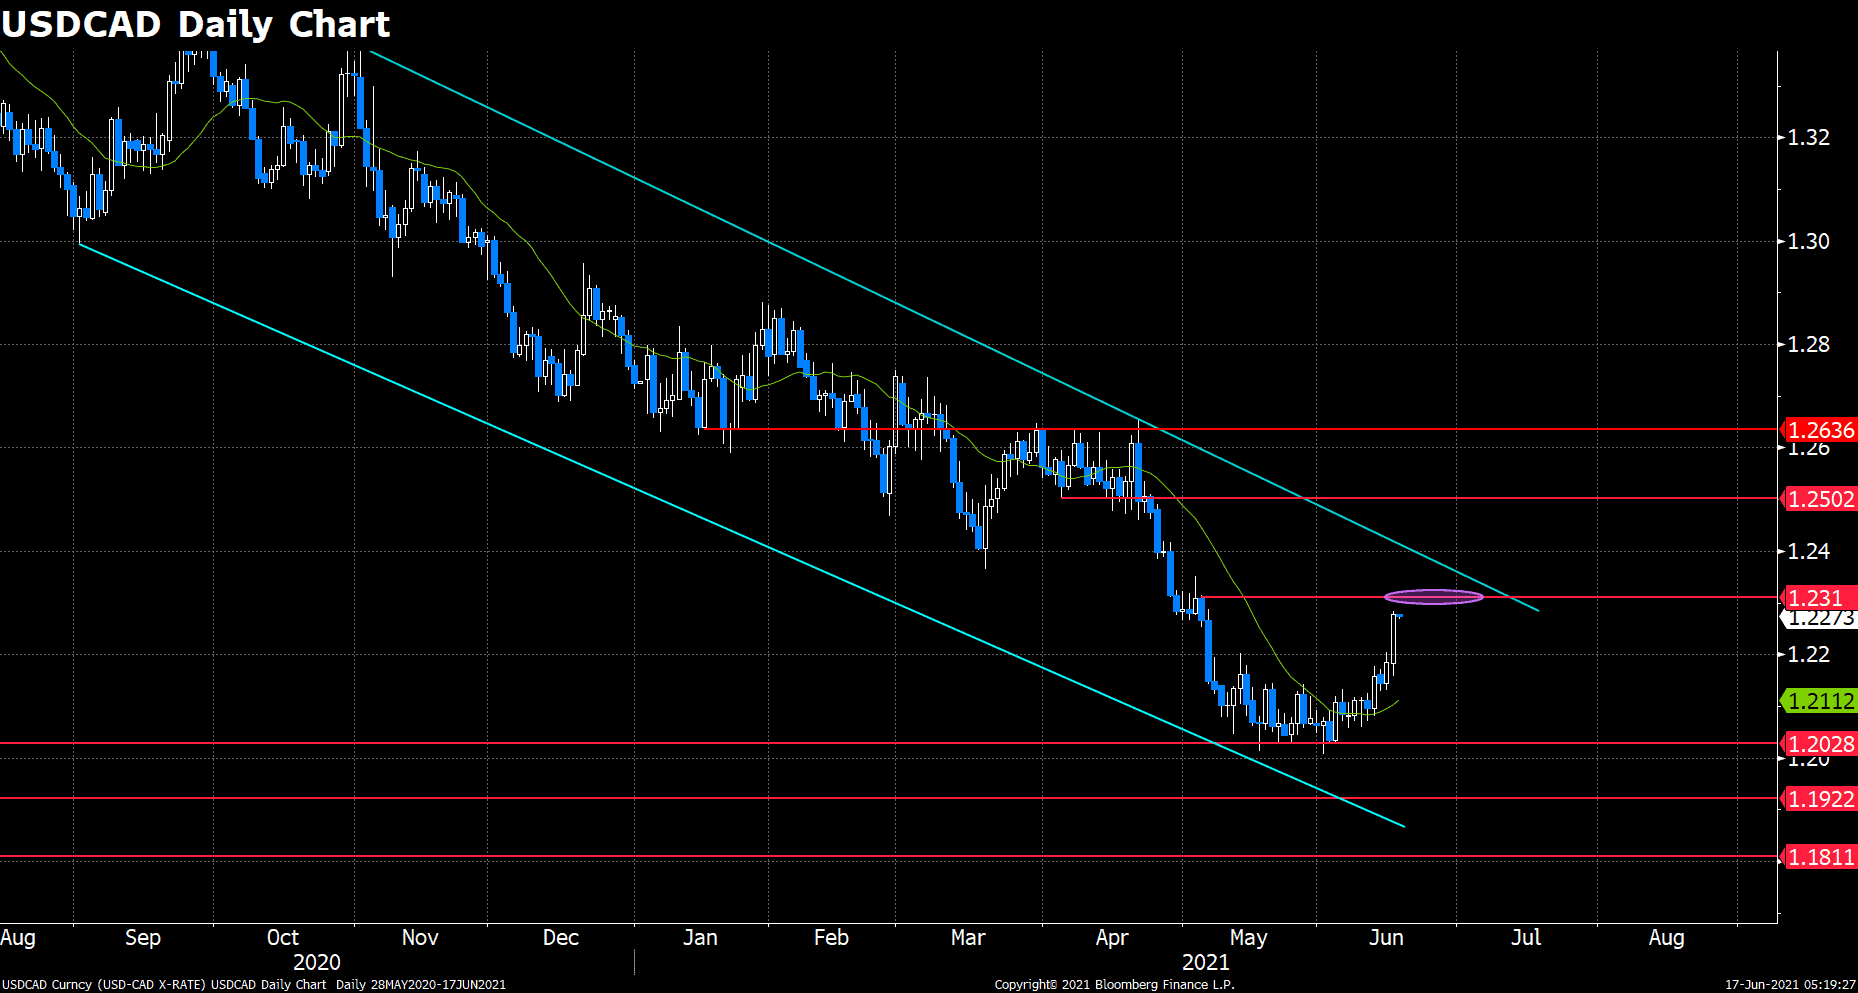
Fiber hovered around 1.19, while cable bounced up and down at 1.39, struggling to rebound. Antipodean currencies advanced at the beginning of the day due to upbeat New Zealand GDP and better-than-expected Australian employment figures, but soon the robust American dollar resumed its advance, pushing rivals to multi-month lows. Aussie bounced off it yearly low at 0.7532, one step ahead of a steeper slide. Loonie trades around 1.235, its highest since late-April.
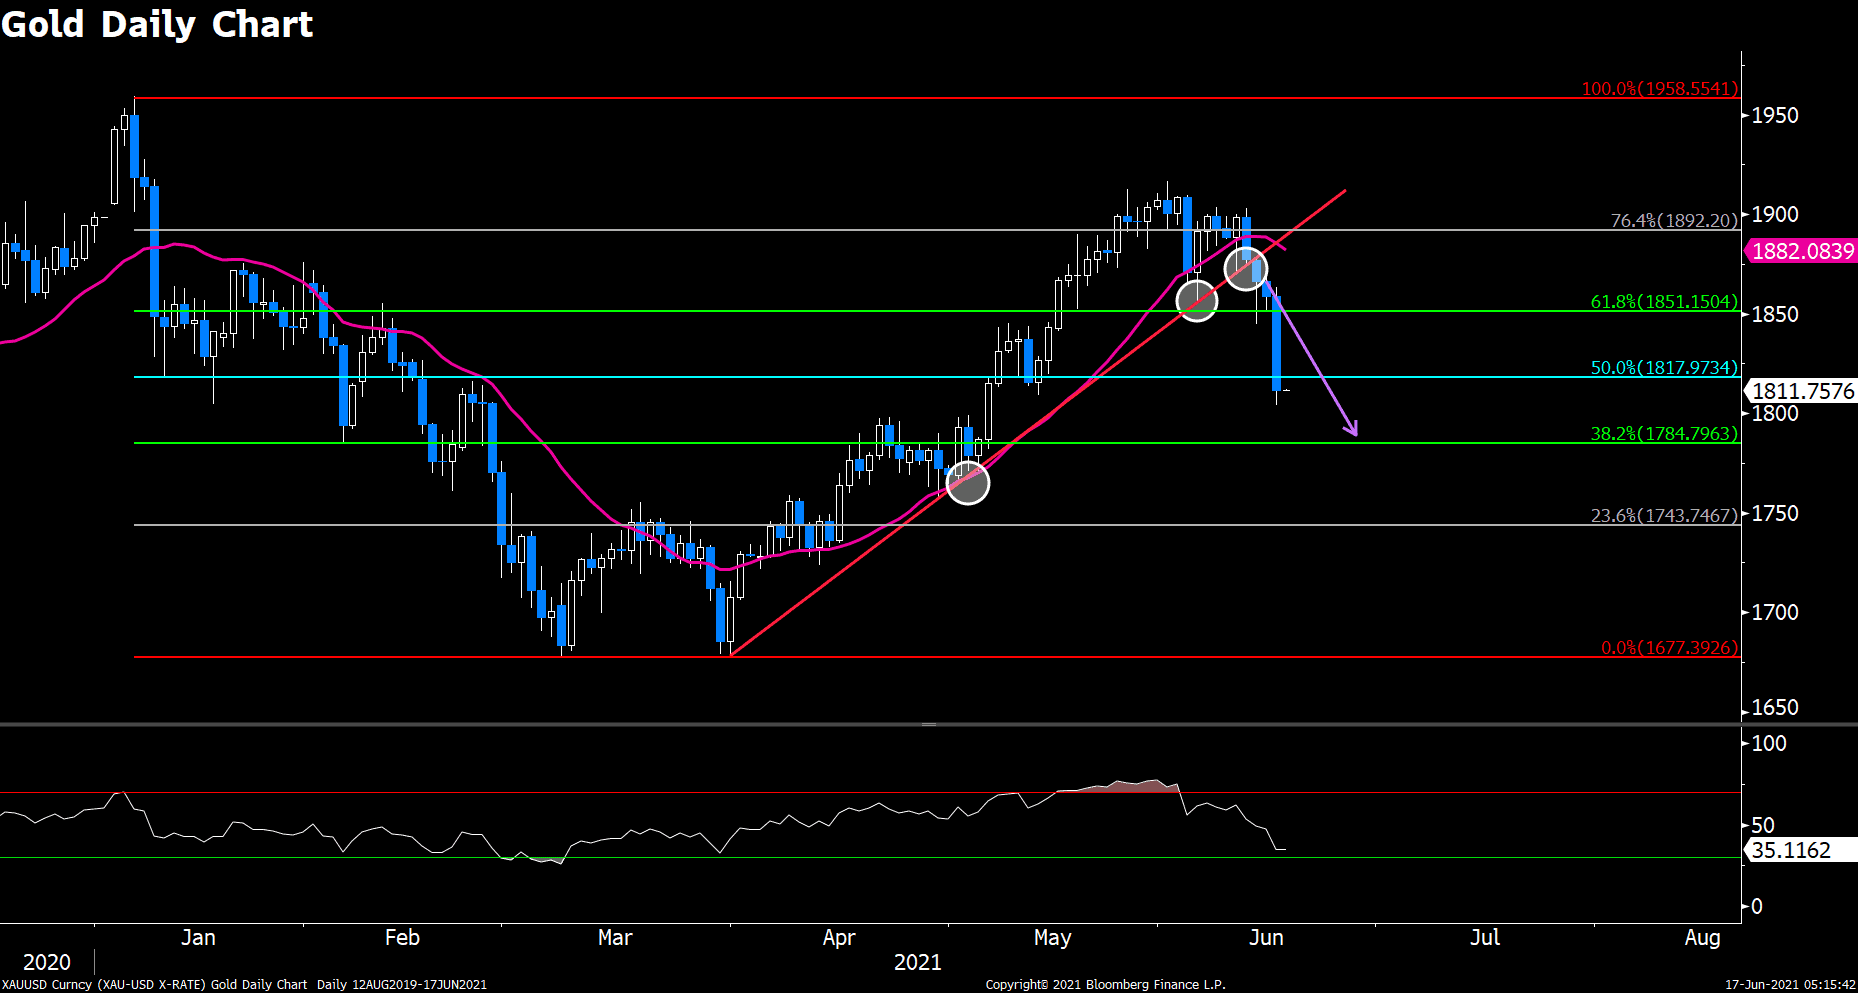
Commodities slumped hard during the day. Gold made its fifth decline to $1,767.29, while oil prices were also down, but managed to bounce a bit ahead of the close. WTI settled at $71.00 a barrel, and Brent $73.00.
US Treasury yields retreated from post-Fed peaks. The yield on the 10-year Treasury note currently stands around 1.506% after hitting 1.594%.
Cryptos continued their correction. Bitcoin climbed to $39559 earlier today, and hours later plummeted below $38000. Ethereum basically followed its big brother’s step, with a daily high at $2460.5, and once flirted with the $2300 support line.
Technical Analysis:
EURNOK (Daily Chart)
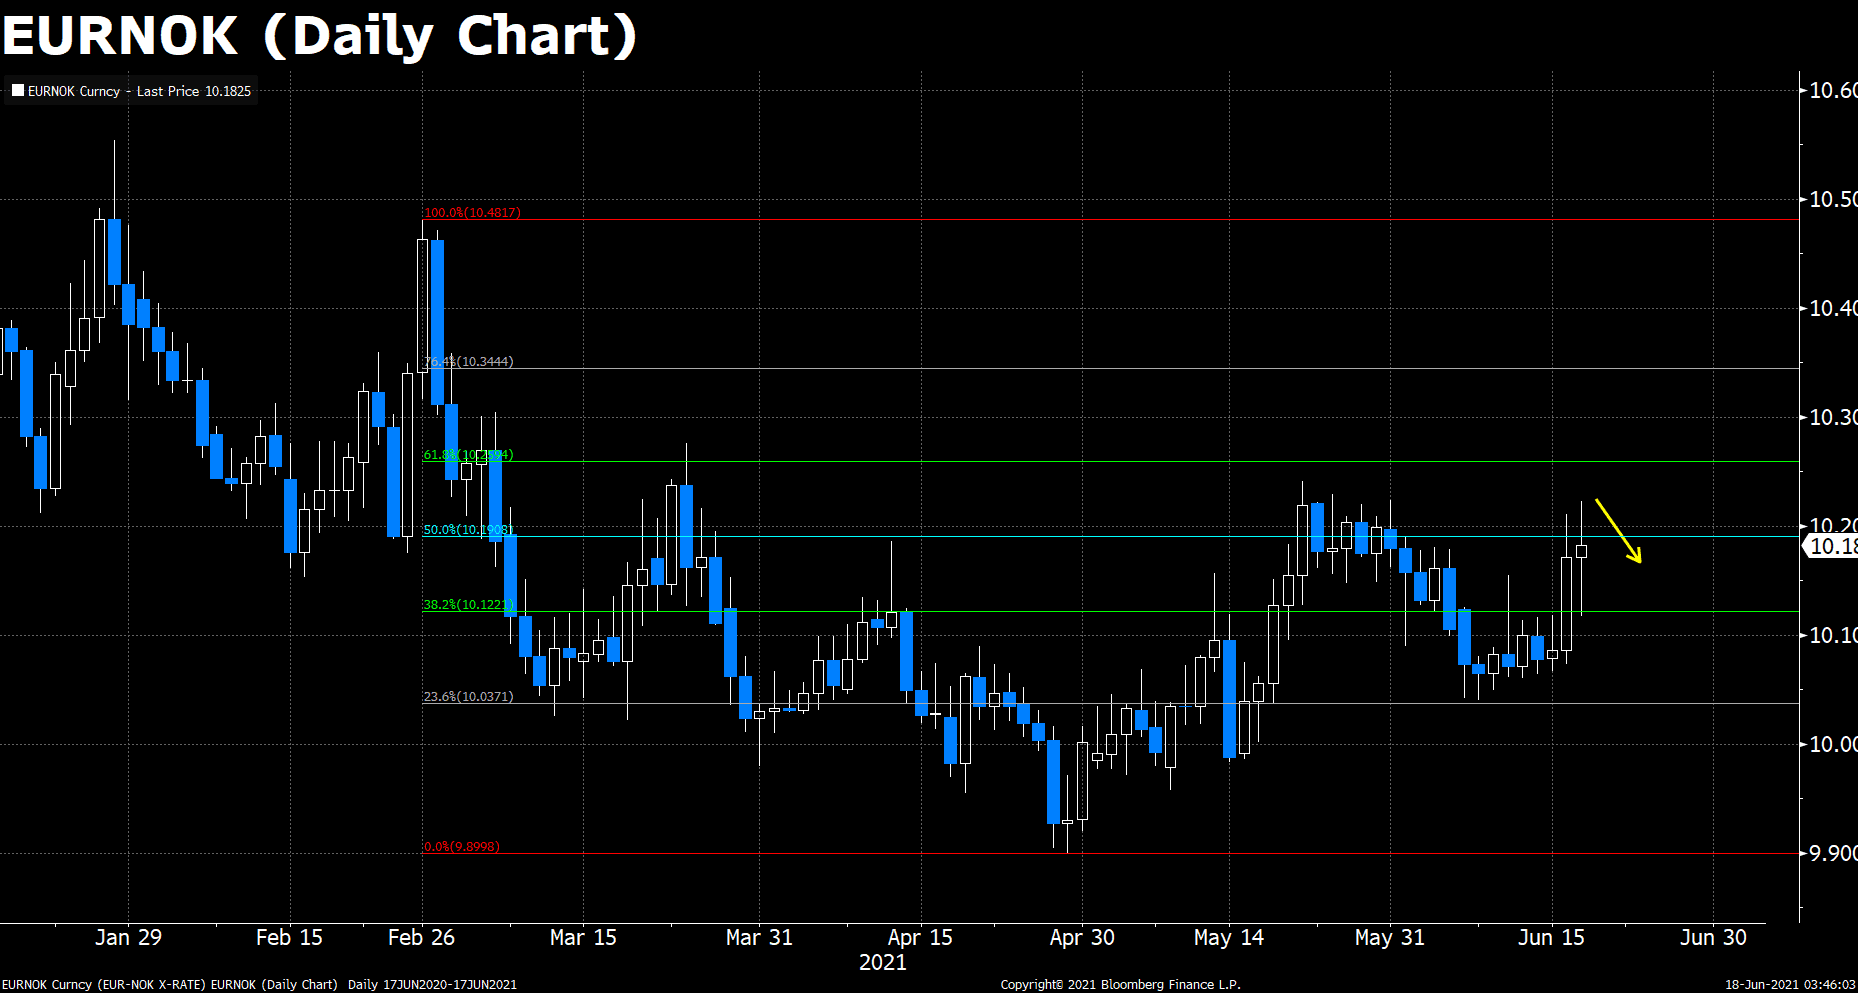
EURNOK has started its corrective trend since late-April. The 50% Fibonacci appears to be a strong resistance for its upward attempts, and there’s a greater headwind from the fundamantal side. The Norges Bank’s hewkish messege which depicted the whole rate-hiking blueprints was released this morning. The cross plunged to the 38.2% Fibonacci at the moment but soon rebounded to its previous level, failing its yet again attempt to break 50% Fibonacci, and now trades at 10.174, a price in between. In our opinion, the disappointing market reaction derived from the investors focusing more on the post-FOMC phenomena. However, rate differentials will provide a consistent downward traction for EURNOK, and we anticipated that the cross will move to fresh low below 9.90 at the end of the month.
Resistance: 10.191, 10.259, 10.344
Support: 10.122, 10.037, 9.900
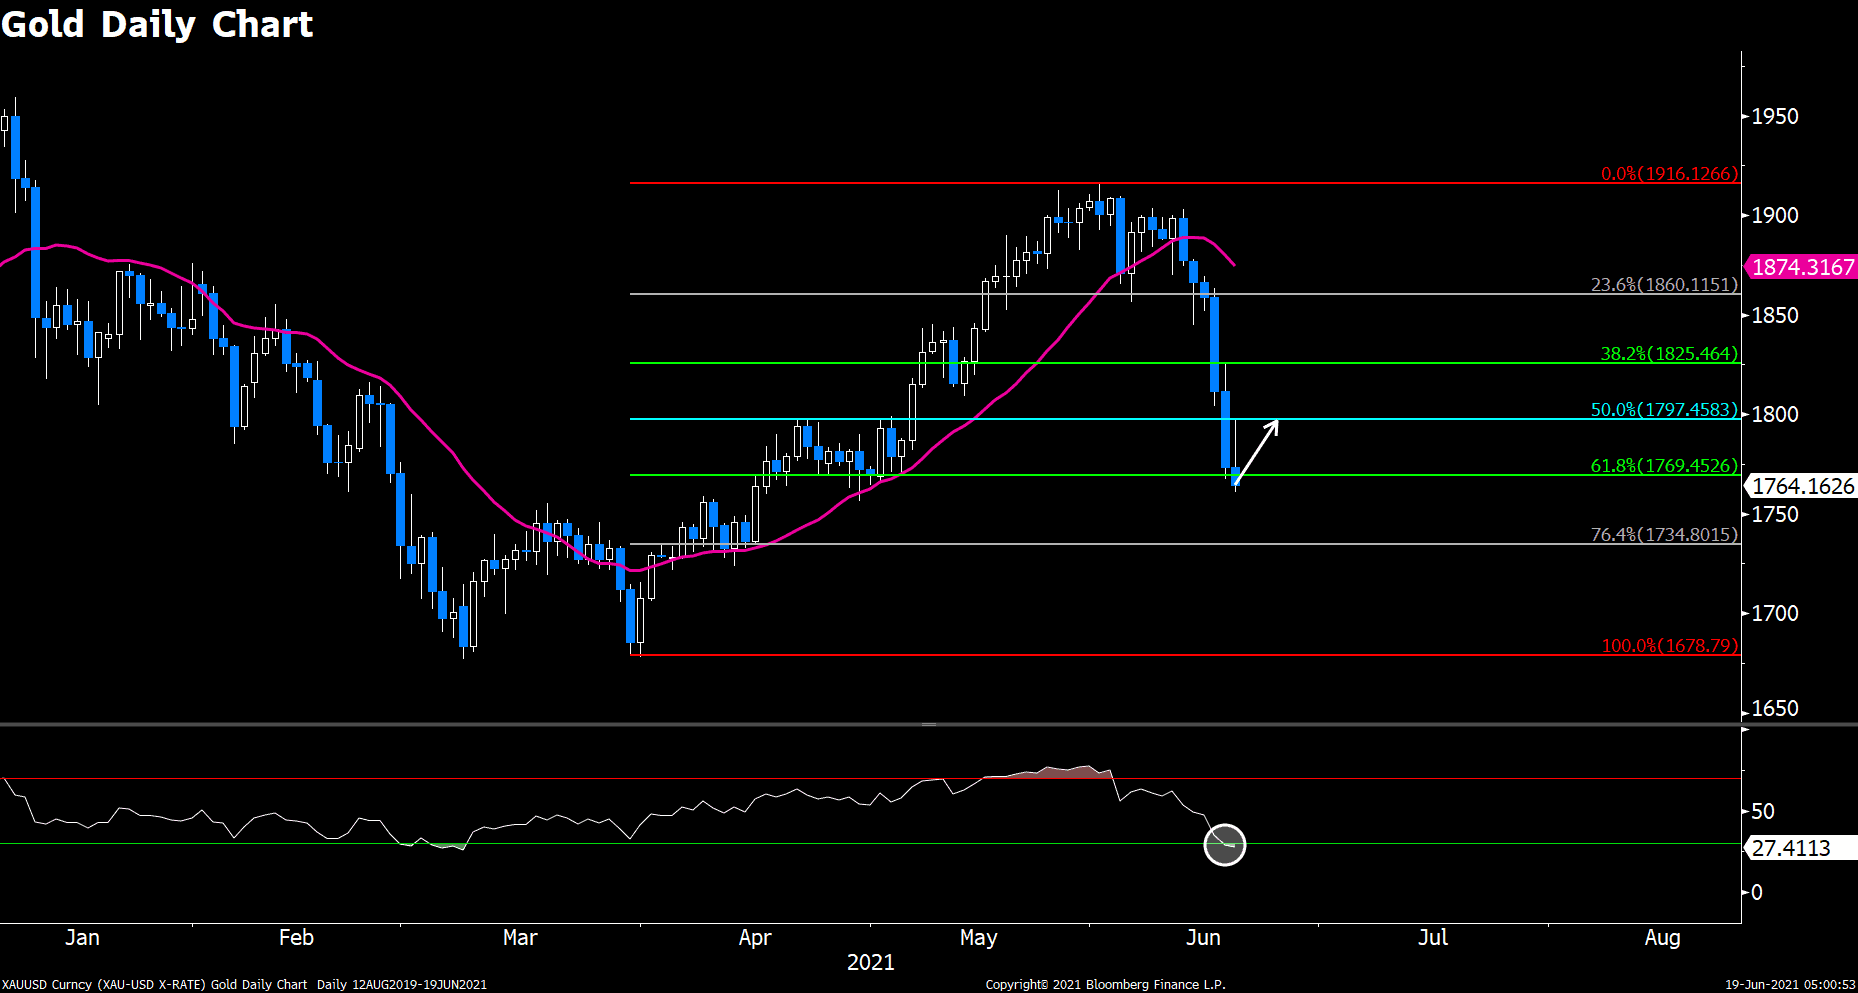
XAUUSD (Daily Chart)
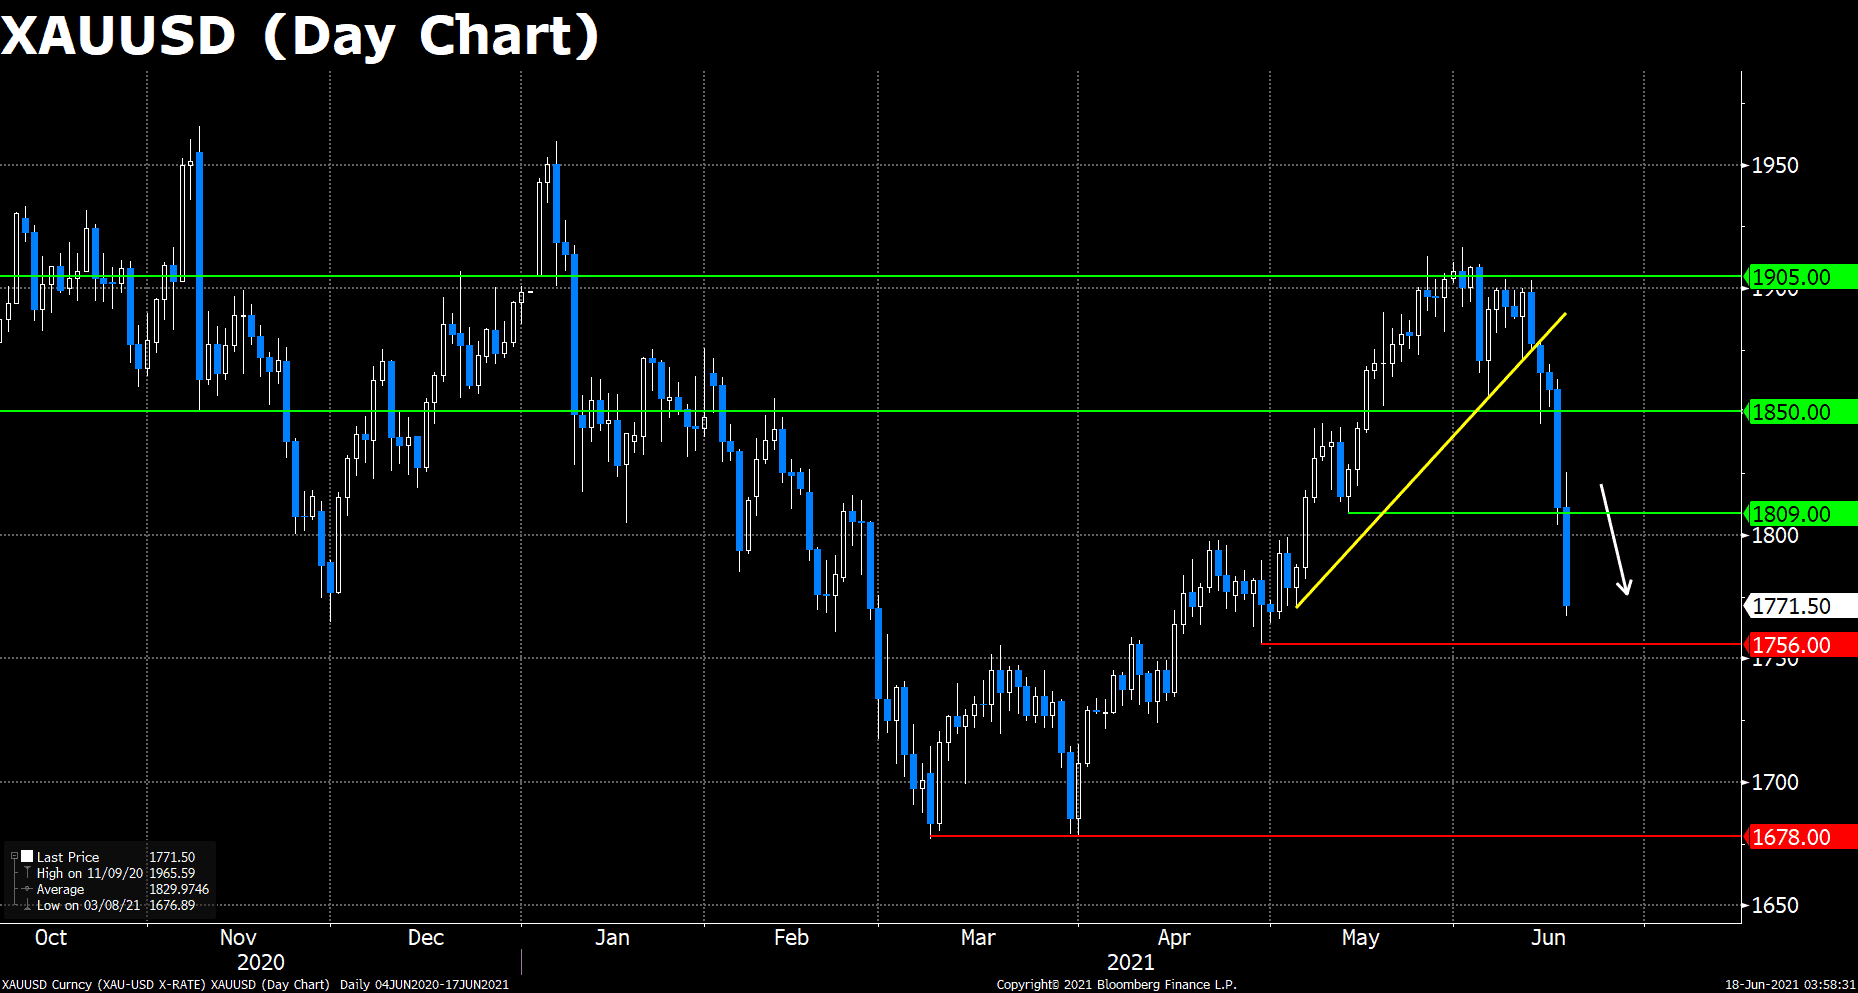
XAUUSD has sharply declined for two consecutive days and breached every DMA support due to FOMC’s hawkish signals. Gold breached below $1800, and traded at a price last seen in mid-Apirl. On the downside, the $1765 support line awaits violation, and since there’s no apparent support after that level, the yellow metal may go straight forward to the yearly low at $1680 and call for a rebound. On the technicals, the MACD histogram appears strongly bearish, and the RSI indicator has just landed at the oversold territory. Given the robust selling pressure and negative fundamentals, we speculates the pair to extend further south if it really breaks the $1765 support.
Resistance: 1809, 1850, 1905
Support: 1756, 1678
GBPJPY (Daily Chart)
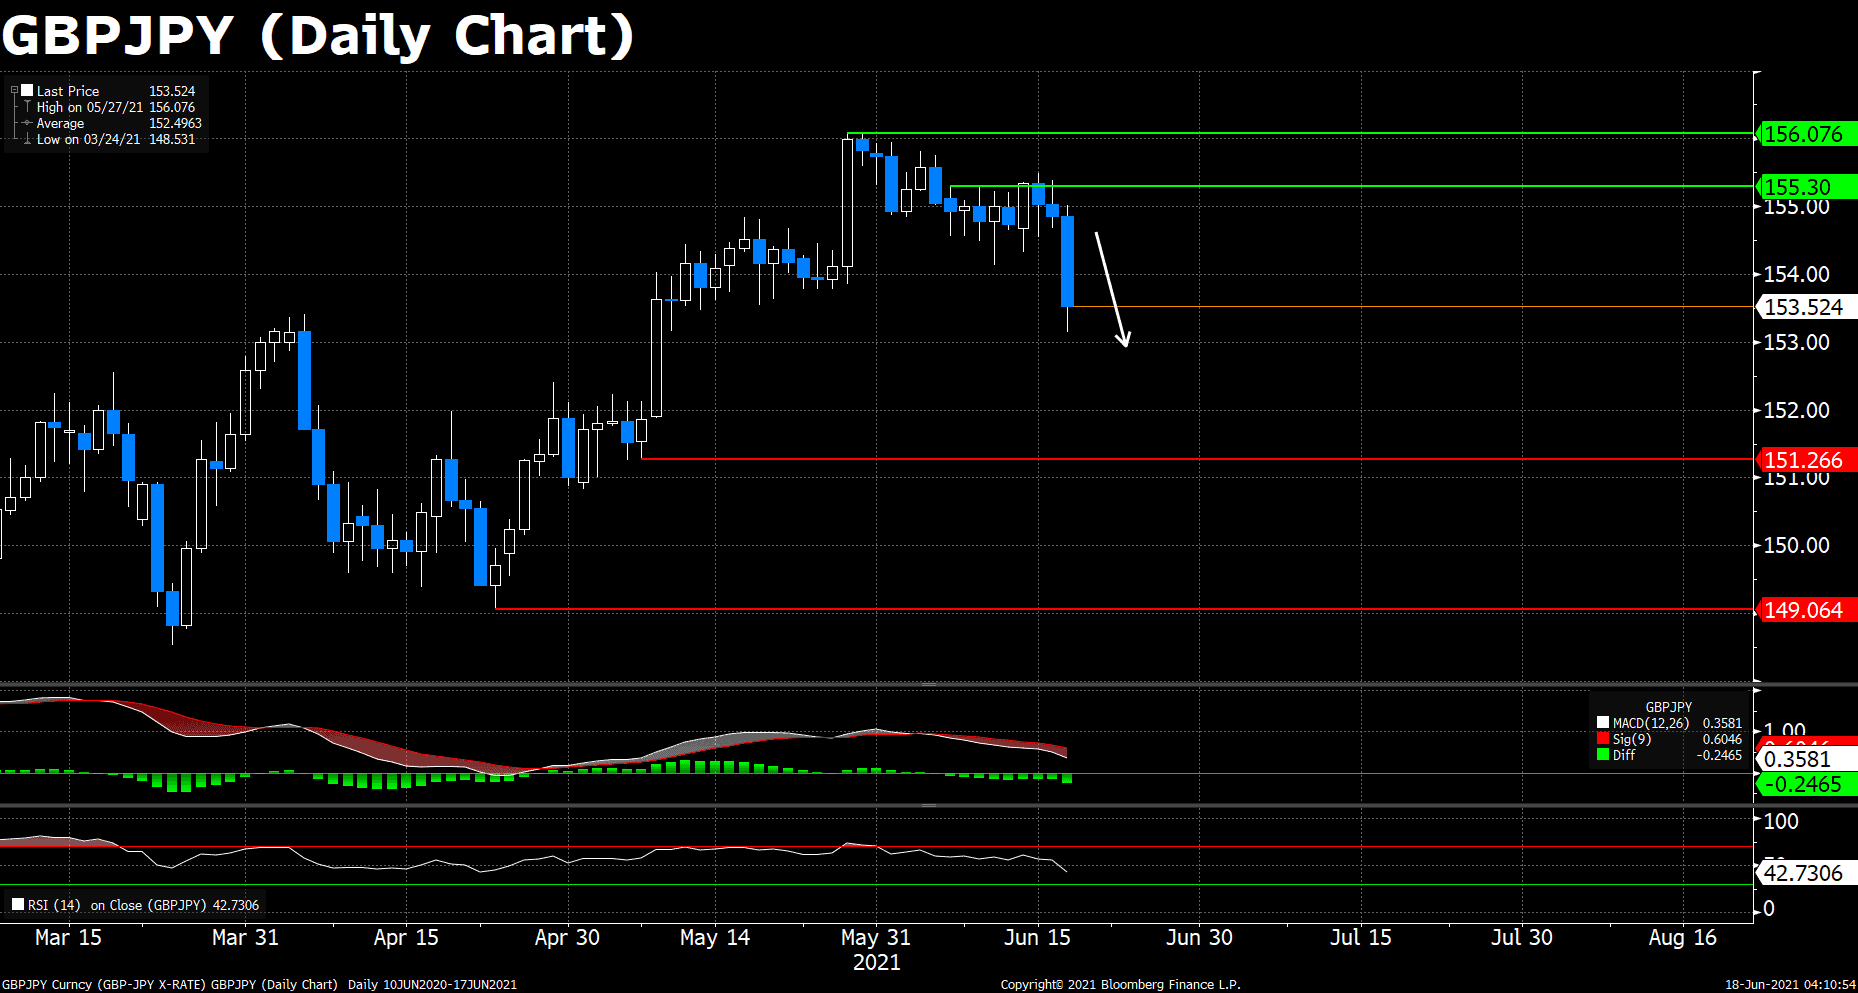
GBPJPY breached the symmetrical triangle and stretched lower to the south today as the safe-haven JPY took advantage of the risk-off market sentiments after the FOMC meeting, and concerns on the EU-UK conflict over Northern Ireland protocol as well as the delayed lockdown easing in England keeps acting as headwinds for the pound.
On the technicals, the MACD histogram remains bearish, while the RSI indicator dropped below 50, suggesting a negative market mood toward the cross. Given available information, we speculate that the downward adjustment may persist, unless the upcoming Japan inflation data and BOJ meeting surprise the market.
Resistance: 155.30, 156.076
Support: 151.266, 149.064
Economic Data
|
Currency
|
Data
|
Time (GMT + 8)
|
Forecast
|
|
JPY
|
BoJ Monetary Policy Statement
|
11:00
|
|
|
JPY
|
BoJ Interest Rate Decision
|
11:00
|
-0.1%
|
|
JPY
|
BoJ Press Conference
|
14:00
|
|
|
|
|
|
|
|
|
|
|
|
|
|
|
|
|
|
|
|
|
|
|
|
|
|
|
|
|
|
|
|
|
|
|
|
|
|
|
|
|
|