Daily Market Analysis
Market Focus
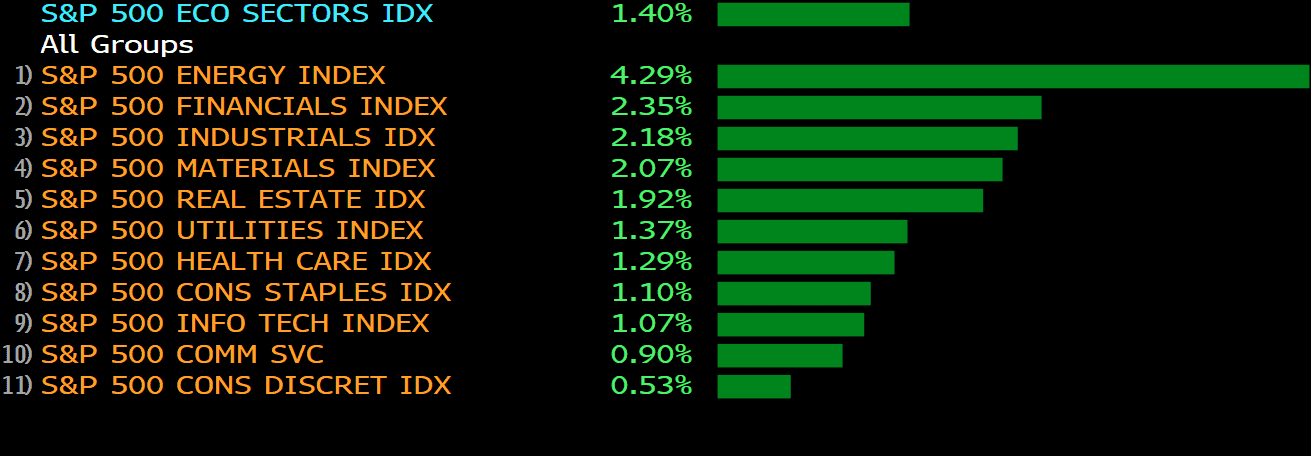
The three major indexes traded mixed Tuesday afternoon after gaining earlier in the day, with traders looking for fresh catalysts to rally beyond current record levels. The information technology and consumer discretionary sectors outperformed in the S&P 500. The tech-led session kept the Nasdaq in slightly positive territory (+0.19%). Dow Jones was little changed (+0.03%) as more than 1% drops in shares of Intel, Disney and Boeing offset gains in other components including Nike, Home Depot and Apple.

A divided U.S. Supreme Court refused to lift the federal moratorium on evictions during the Covid-19 outbreak, leaving the ban in place until the end of July.
Voting 5-4, the justices rejected calls by landlords and real-estate trade associations from Alabama and Georgia to block the moratorium while their challenge goes forward. They contend the Centers for Disease Control and Prevention exceeded its authority by imposing the spread of the coronavirus.
Chief Justice John Roberts and Justice Brett Kavanaugh joined the court’s three liberals in the majority. Kavanaugh said he was doing so because the moratorium is set to expire on July 31.
The ban applies to tenants who, if evicted, would have “no other available housing options.” The CDC and President Joe Biden’s administration say the moratorium is geared toward protecting tenants who would be forced to live in close quarters elsewhere or become homeless and dependent on shelters.

Main Pairs Movement:
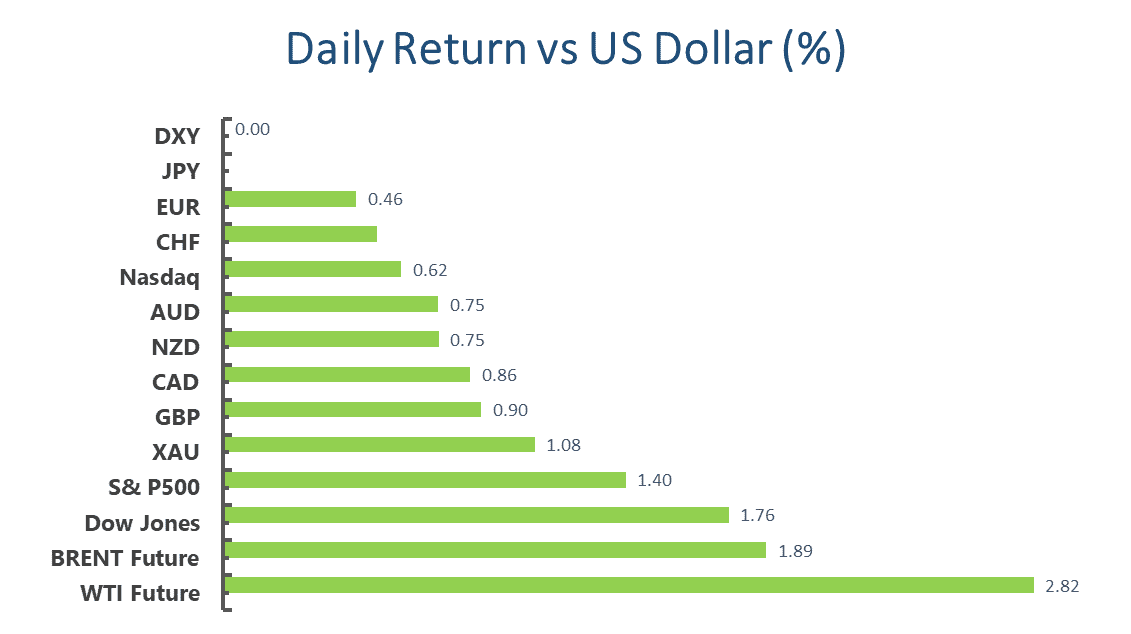
The greenback appreciated against most major rivals as the dollar index reached a five-day high above 92.00, especially against high-yielding currencies. There was no obvious catalyst for the gains as the greenback actually retreated in the final trading session of the day, despite better than anticipated US data.
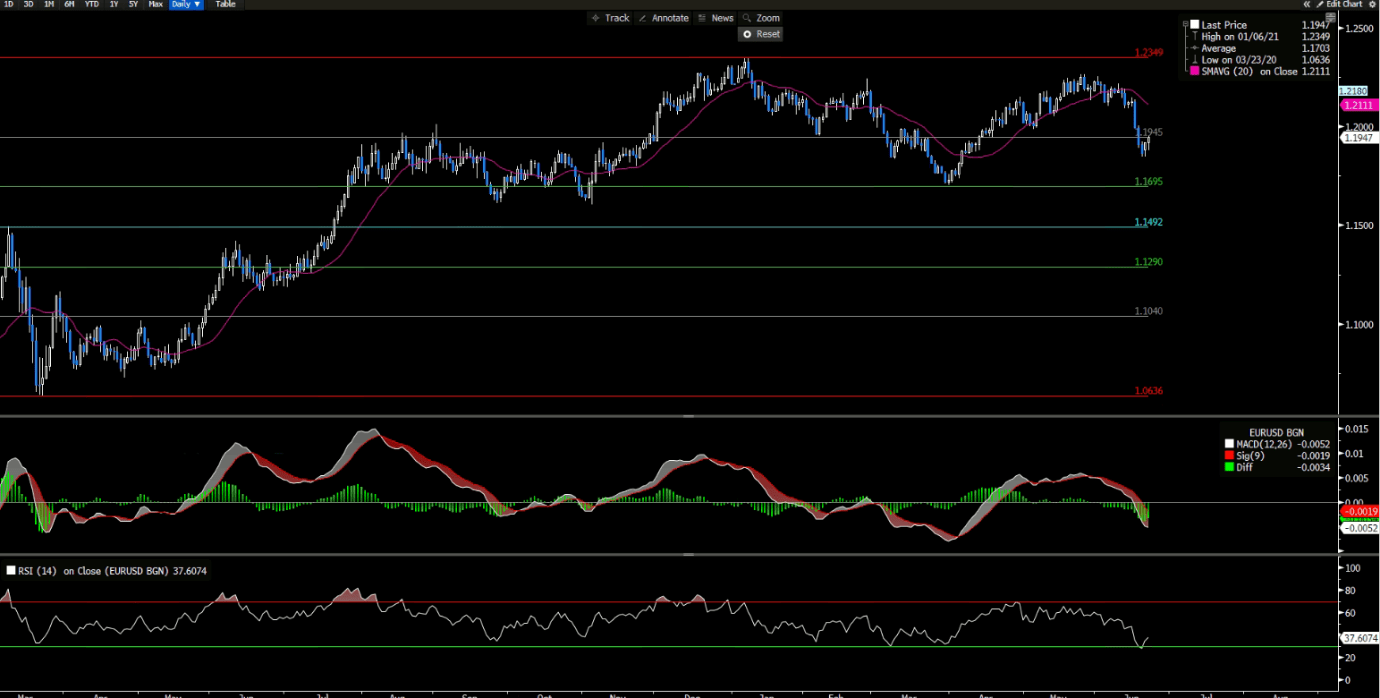
The euro pair hovered below 1.1900, awaiting the upcoming inflation figures; cable settled around 1.3840, undermined by Brexit jitters related to the Northern Ireland Protocol. Aussie fell toward the 0.7500 level, while the loonie pair flirts with 1.2400. The American currency strength and the modest performance of Wall Street weighed on commodity-linked currencies.
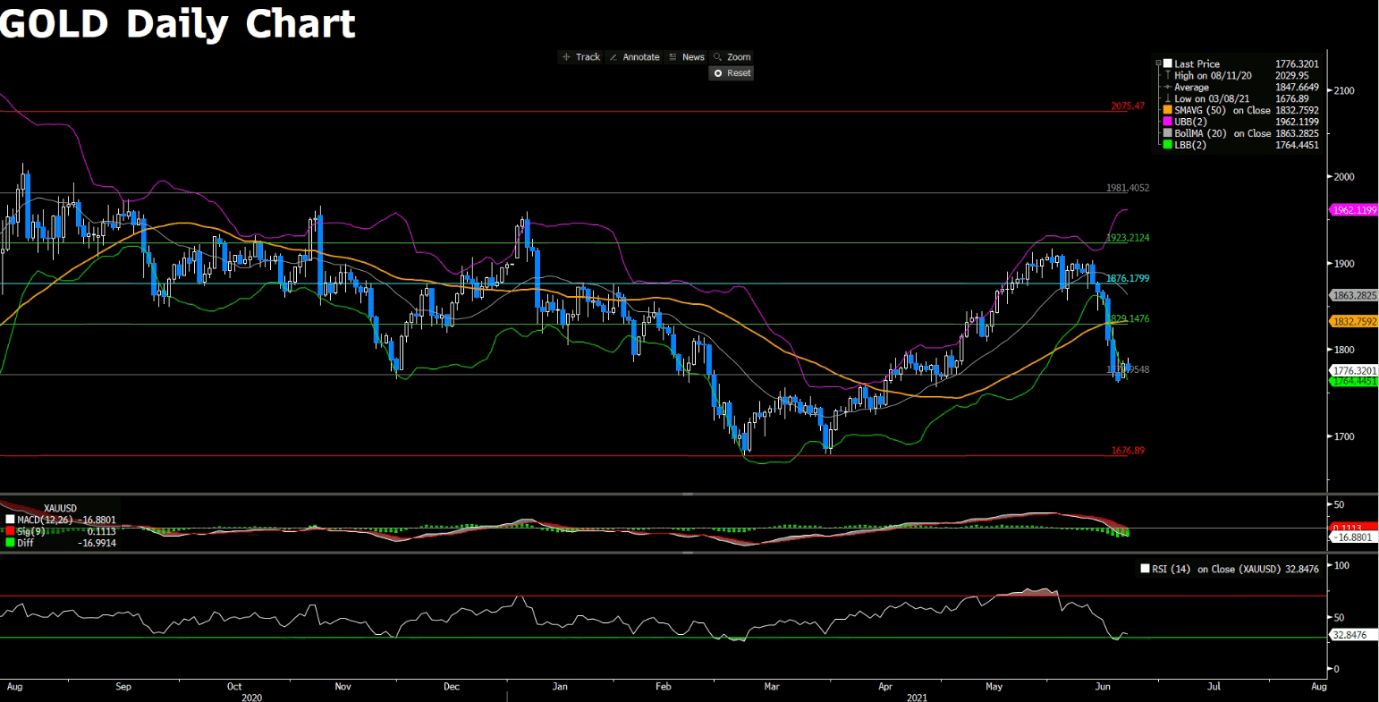
Gold plummeted to a fresh two-month low of $1,750.60 a troy ounce, bouncing ahead of the close to $1,761. Crude oil prices were mixed, as WTI surged around 1%, settling at $73.40 a barrel, and Brent almost declined for another day, closing with a tiny gain at $74.63.
“Unemployment rate would have to drop fairly substantially, or inflation would have to stay high, to have a 2022 rate hike,” Fed Governor Christopher Waller said on Tuesday’s Bloomberg TV Interview. “If you think you may need to raise rates by end-2022 or early 2023, you need to get tapering done before then.”
Though Fed’s Waller add to the market’s anxiety over inflation and rate-hike, major pairs still trade at familiar levels, seemingly unaffected by the press time. The reason could be traced from the cautious sentiment ahead of the day’s key data, namely China PMI and US ADP Employment Change.
Technical Analysis:
USDJPY (4- Hour Chart)

USDJPY loses its traction around 110.5 level during the American session. Even though the pair still trades within the overall ascending trend, it stages a technical correction. Similar to the previous day, USDJPY remains neutral for its intraday bias. Further rally will resume with its resistance of 111.12 intact. On the downside, break of 110.51 will turn the pair’s bias back to the downside for 110.14, turning the pair to bearish as it will breach the ascending trend line. From the technical indicator’s view of point, the pair is bearish in the near- term as the MACD is turning down, lending supports to bears; the RSI is neutral, lacking directional strength as of now.
Resistance: 111.12
Support: 110.51, 110.14, 109.84
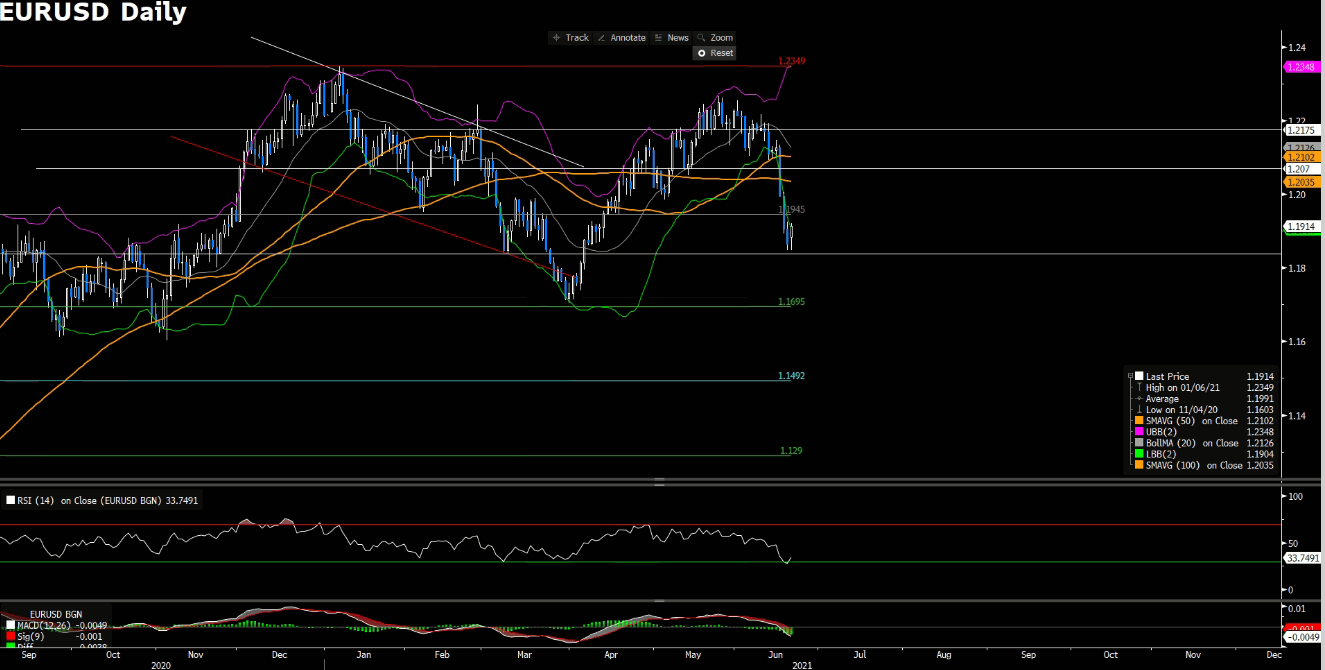
EURUSD (4- Hour Chart)

EURUSD remains pressured under 1.1900 level as the greenback gains strength. From the technical aspect, EURUSD is poised to extend its decline, heading toward its support of 1.1837. On the 4- hour chart, the outlook of the pair is bearish as it trades below the 20 simple moving average as well as the 50 SMA, stating that the pair is under pressured. At the same time, the downside pressure is also supported by the negative MACD. If the pair falls below the previous low on the 22nd of June, then it will accelerate its slide within negative level, favoring a chanllege against 1.1837.
Resistance: 1.1919, 1.1985, 1.2052
Support: 1.1837, 1.1704
GBPUSD (4- Hour Chart)

GBPUSD slips below 1.3850, reaching the weekly low as the greenback gains ground across the board. On the 4- hour chart, GBPUSD remains bearish as it has been unable to recapture the 20 and the 50 SMAs, experiencing the downside momentum. Additionally, the RSI is currently above the 30 readings, thus far from oversold conditions, allowing the pair for more declines; the MACD sustains its negative mode, lending supports to bears. As the time of writing, GBPUSD is expected to extend its fall toward its next support of 1.3787 in the near- term.
Resistance: 1.3896, 1.3963, 1.4017, 1.4072
Support: 1.3787
Economic Data
|
Currency |
Data |
Time (GMT + 8) |
Forecast |
||||
|
CNY |
Manufacturing PMI (Jun) |
09:00 |
50.8 |
||||
|
GBP |
GDP (QoQ) (Q1) |
14:00 |
-1.5% |
||||
|
GBP |
GDP (YoY) (Q1) |
14:00 |
-6.1% |
||||
|
EUR |
German Unemployment Change (Jun) |
15:55 |
-20k |
||||
|
EUR |
CPI (YoY) (Jun) |
17:00 |
1.9% |
||||
|
USD |
ADP Nonfarm Employment Change (Jun) |
20:15 |
600k |
||||
|
CAD |
GDP (MoM) (Apr) |
20:30 |
-0.8% |
||||
|
USD |
Pending Home Sales (MoM) (May) |
22:00 |
-0.8% |
||||
|
USD |
Crude Oil Inventories |
22:30 |
-4.686m |
||||