Daily Market Analysis
Market Focus
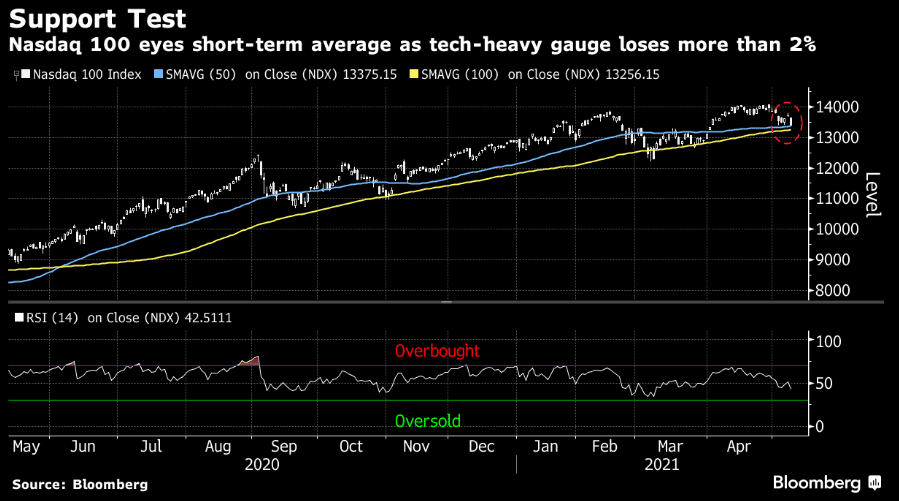
U.S. stocks declined for a second day with losses steepening in the final 15 minutes of trading as investors weighed the rush to reopen the economy against inflationary pressure from a rise in commodity prices.
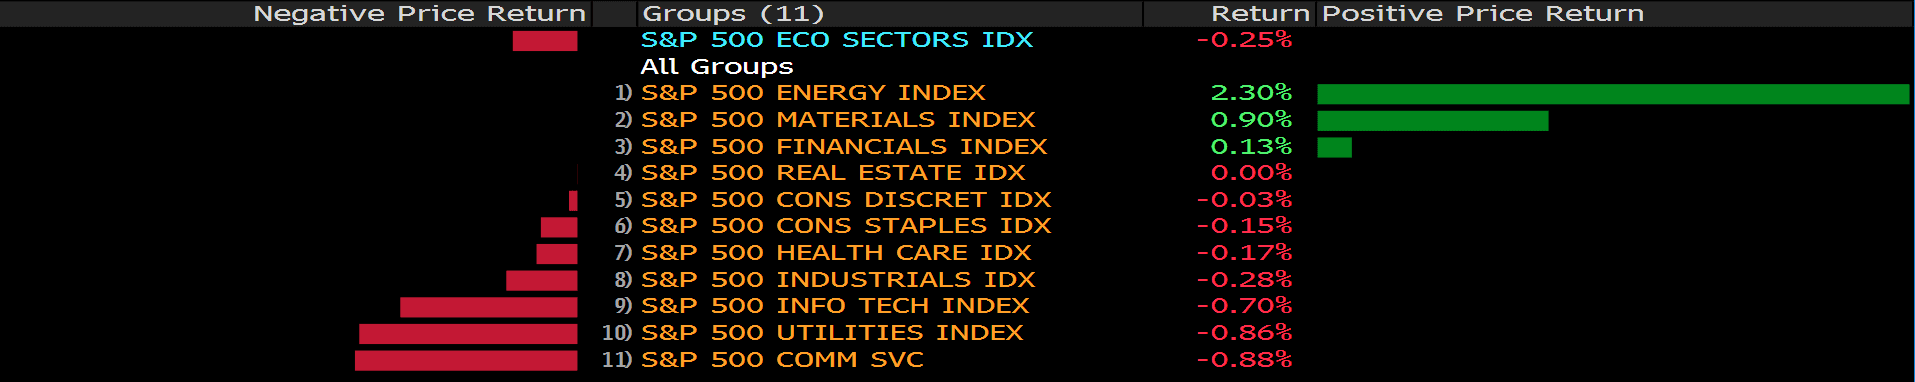
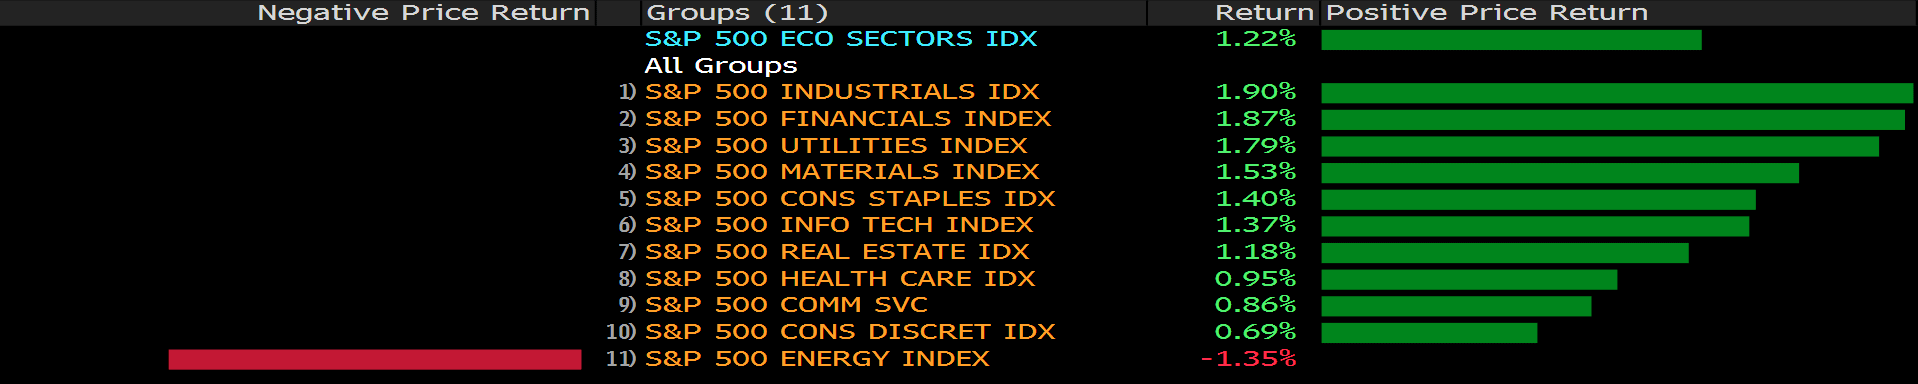
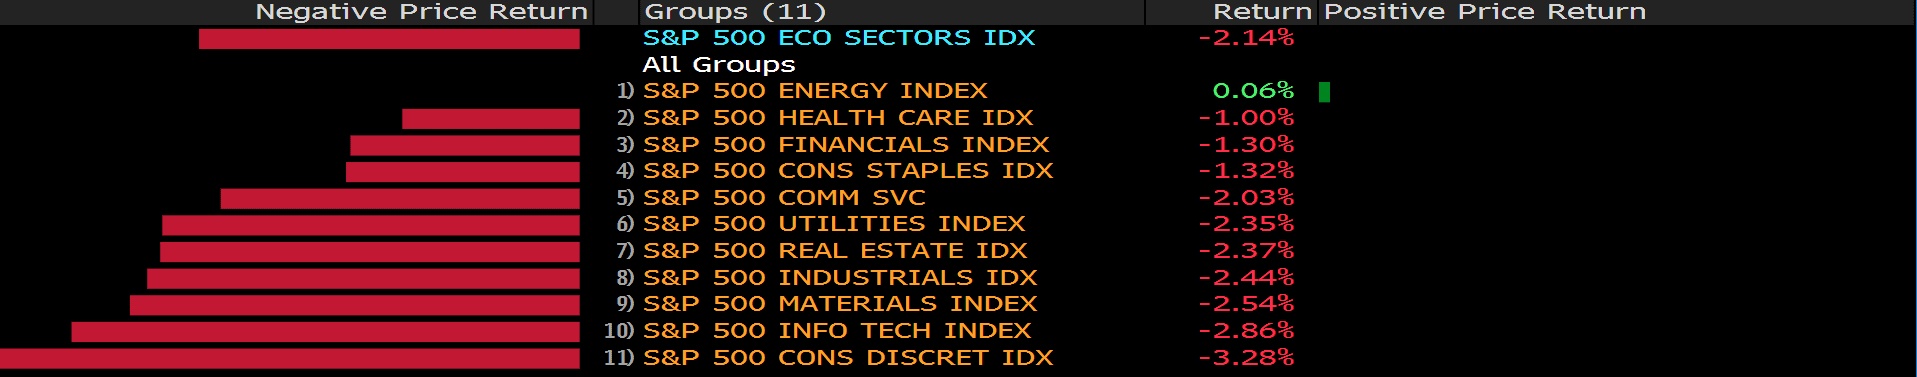
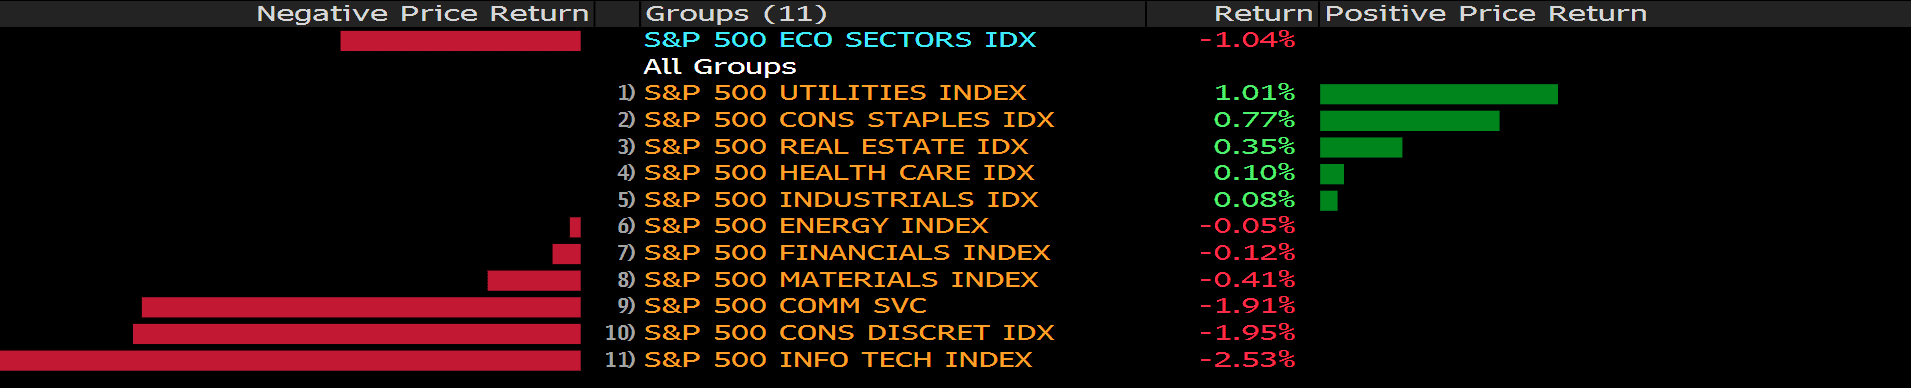
All three of the main U.S. equity benchmarks closed lower after mega-cap technology stocks including Amazon.com Inc., Microsoft Corp. and Alphabet Inc. erased earlier gains. Nine of the main 11 S&P 500 industry groups declined, with energy stocks leading losses as oil prices dropped amid a report that significant progress has been made to revive the U.S.-Iran nuclear deal. AT&T Inc. plunged the most in the benchmark gauge after the company said it plans to spin off its media operations. Walmart Inc. rallied the most in six weeks after boosting its profit outlook.
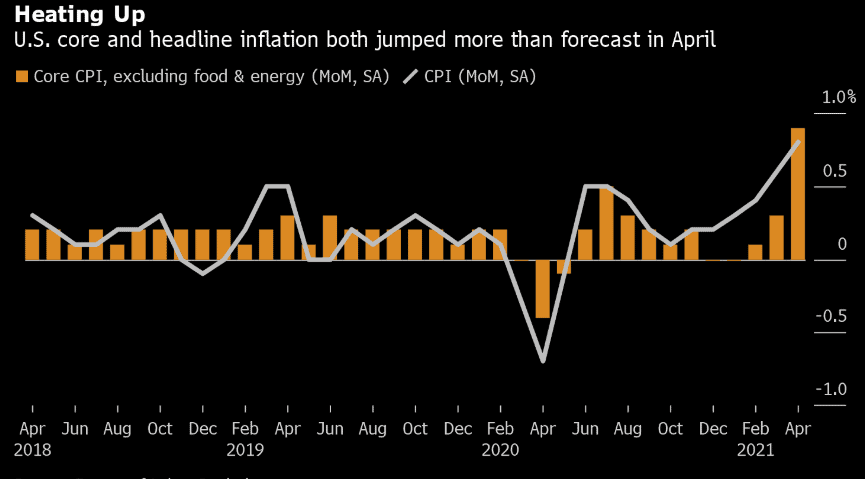
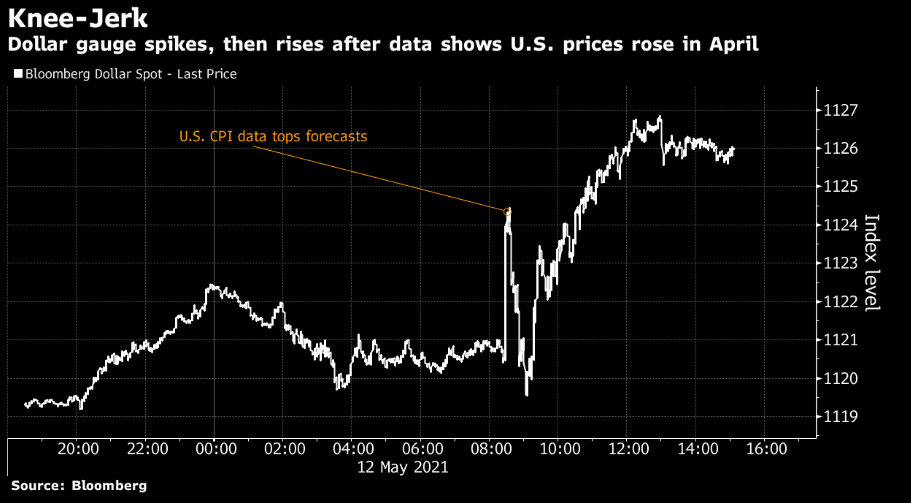
Stocks have been volatile after touching a record in early May as investors assessed economic growth prospects against a Covid-19 resurgence in countries including India. Minutes from the latest Federal Reserve meeting, due Wednesday, may offer clues on inflation pressure and hints of a timeline for tapering stimulus. Fed Vice Chair Richard Clarida said Monday that the weak U.S. jobs report showed the economy had not yet reached the threshold to warrant scaling back asset purchases. Inflation concerns intensified last week when the government reported the fastest increase in consumer prices since 2008 and commodities from iron ore to Brent crude rose to multiyear highs.


Main Pairs Movement:
A gauge of the greenback’s strength declined to near its lowest level in four months as risk sentiment was buoyed by comments from a Federal Reserve official that played down the risk of policy tightening. New Zealand’s dollar outperformed the Group-of-10 currencies.
The kiwi was driven by corporate demand that lifted it past option-related offers near 72.25 U.S. cents, according to Asia-based FX traders. The Aussie and pound gained after buy stops were triggered, the traders said.
West Texas Intermediate crude extended declines after the BBC Persian news channel, citing Russian diplomat Mikhail Ulyanov, reported that a major announcement may be made on Wednesday regarding talks to broker an agreement between Iran and the U.S. and revive the 2015 nuclear deal. A return to the accord could allow for the removal of U.S. sanctions on Iran’s crude exports and bring more supply to the market.
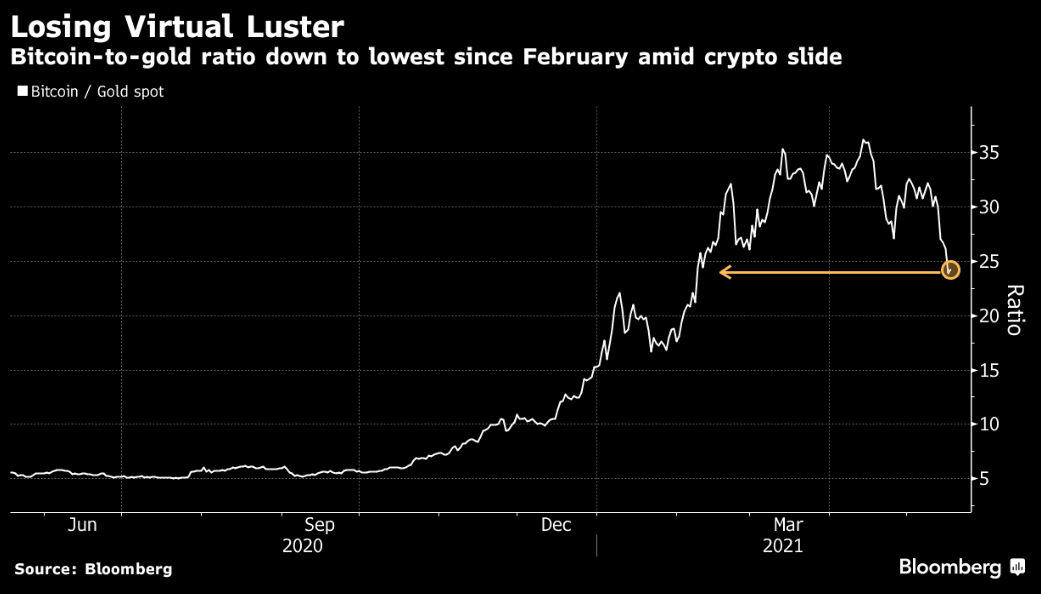
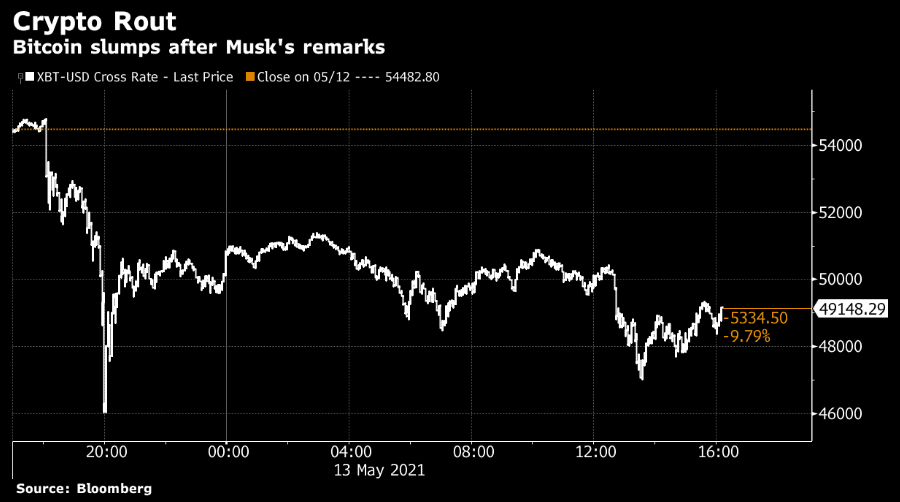
Elsewhere, Bitcoin fell to the lowest since February after the People’s Bank of China reiterated that the digital tokens cannot be used as a form of payment. Coinbase Global Inc. fell after Monday’s drop below the reference price used in its April direct listing.

Technical Analysis:
EURUSD (4 hour Chart)

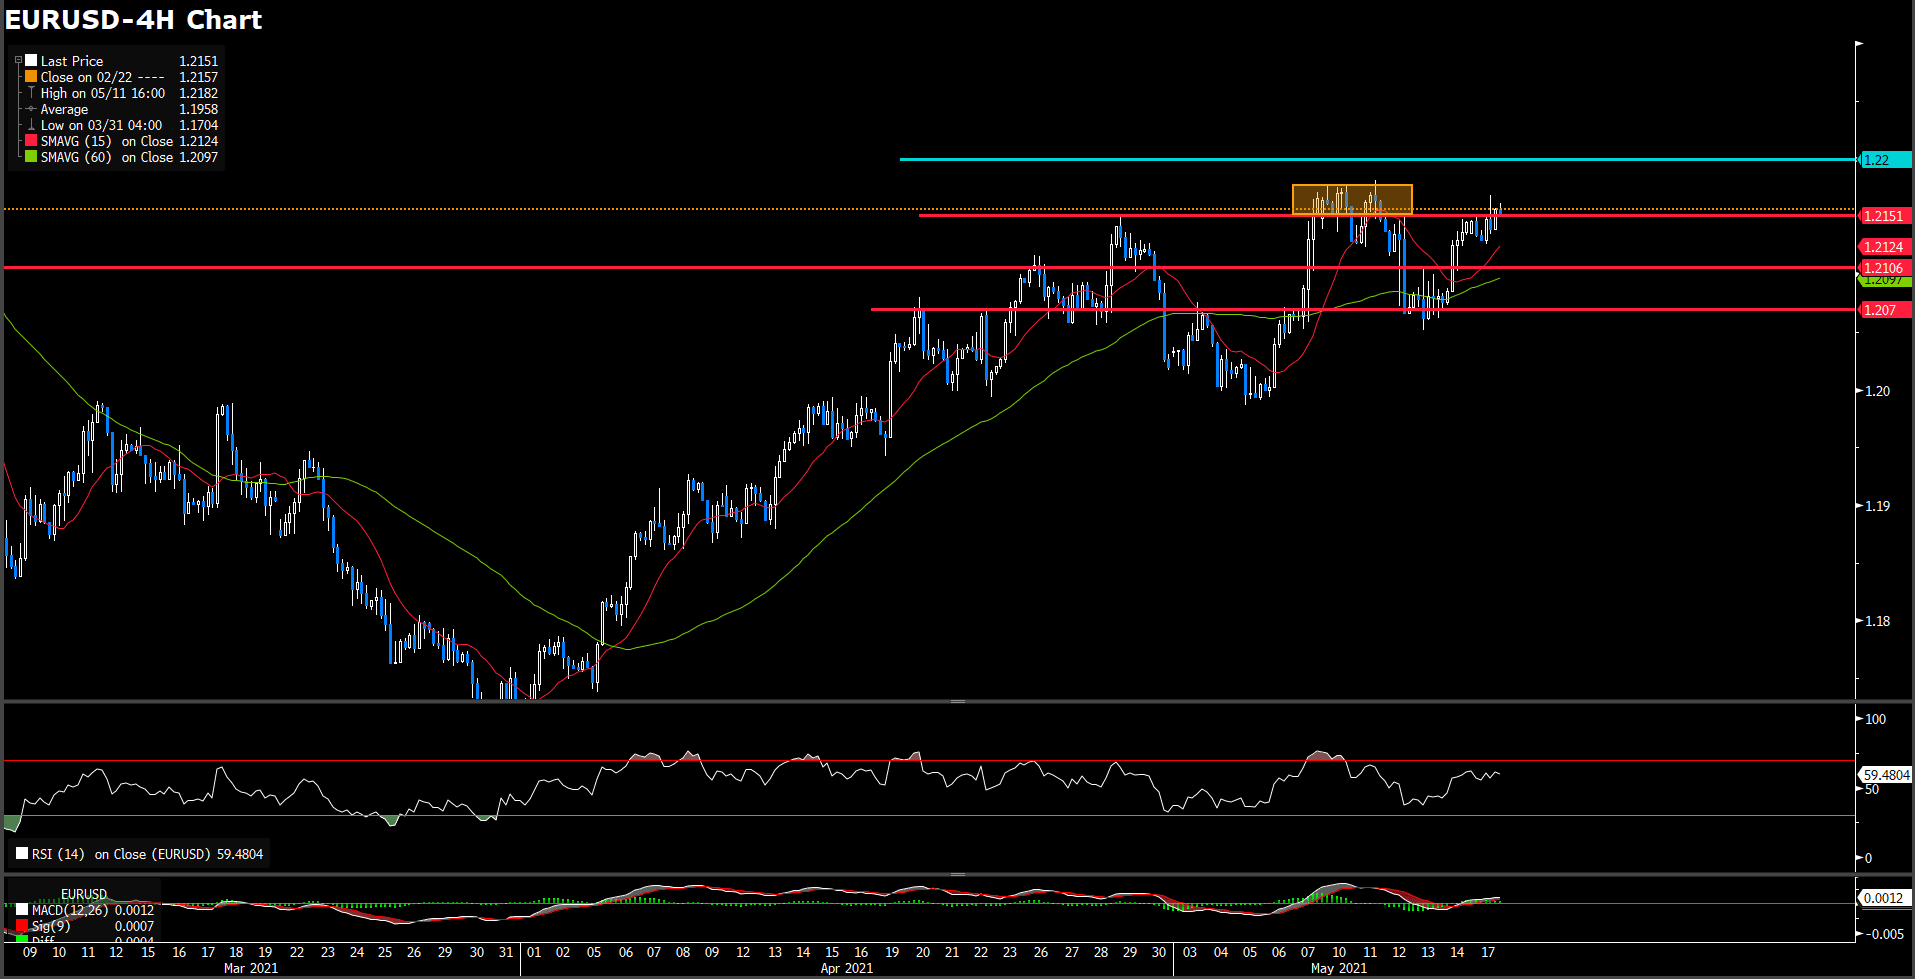
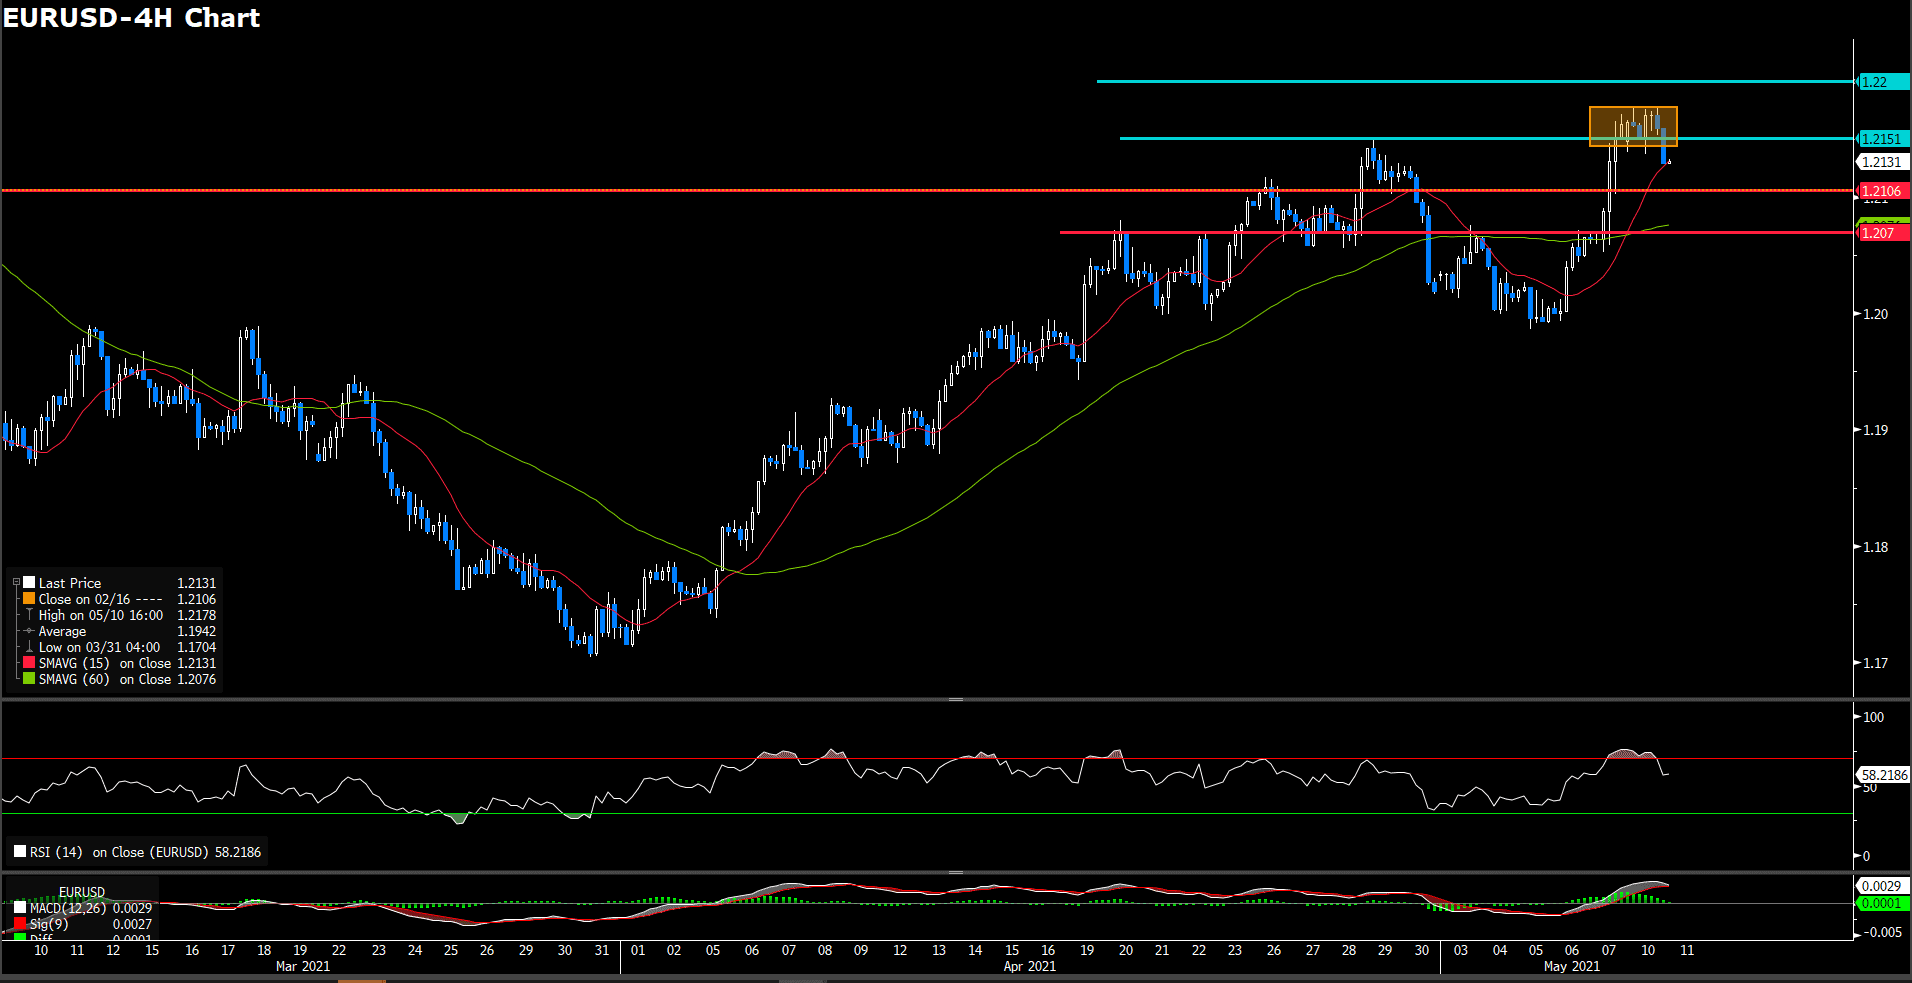
Euro fiber soar up to two-month high at 1.2225 level on Tuesday and set a flat move during the U.S. session, as of writing, pair went up 0.6% in the day at 1.2225 and awaiting to EU inflation data tommorrow. Euro vast gains amid greenback struggle to find the upside momentum while it free fall to 89.69 level which the lowest point since Feb. Moreover, U.S. shares market went down that without safe-parking demand to dollar, U.S. 10 years Treasuries yield slightly changed. For technical aspect, RSI indicator shows 72 figures, which suggest a overbought sentiment in short term. On average price view, 15-long SMA indicator is ongoing ascending trend in day market after it euro aimed to higher stack and 60-long SMA retained upside slope.
As price action at current stage, we think market is ongoing track the bull side as it stand above 1.22 level. However, we need to see what ECB will do after inflation data released.
Resistance:
Support: 1.22, 1.2151, 1.2106, 1.207
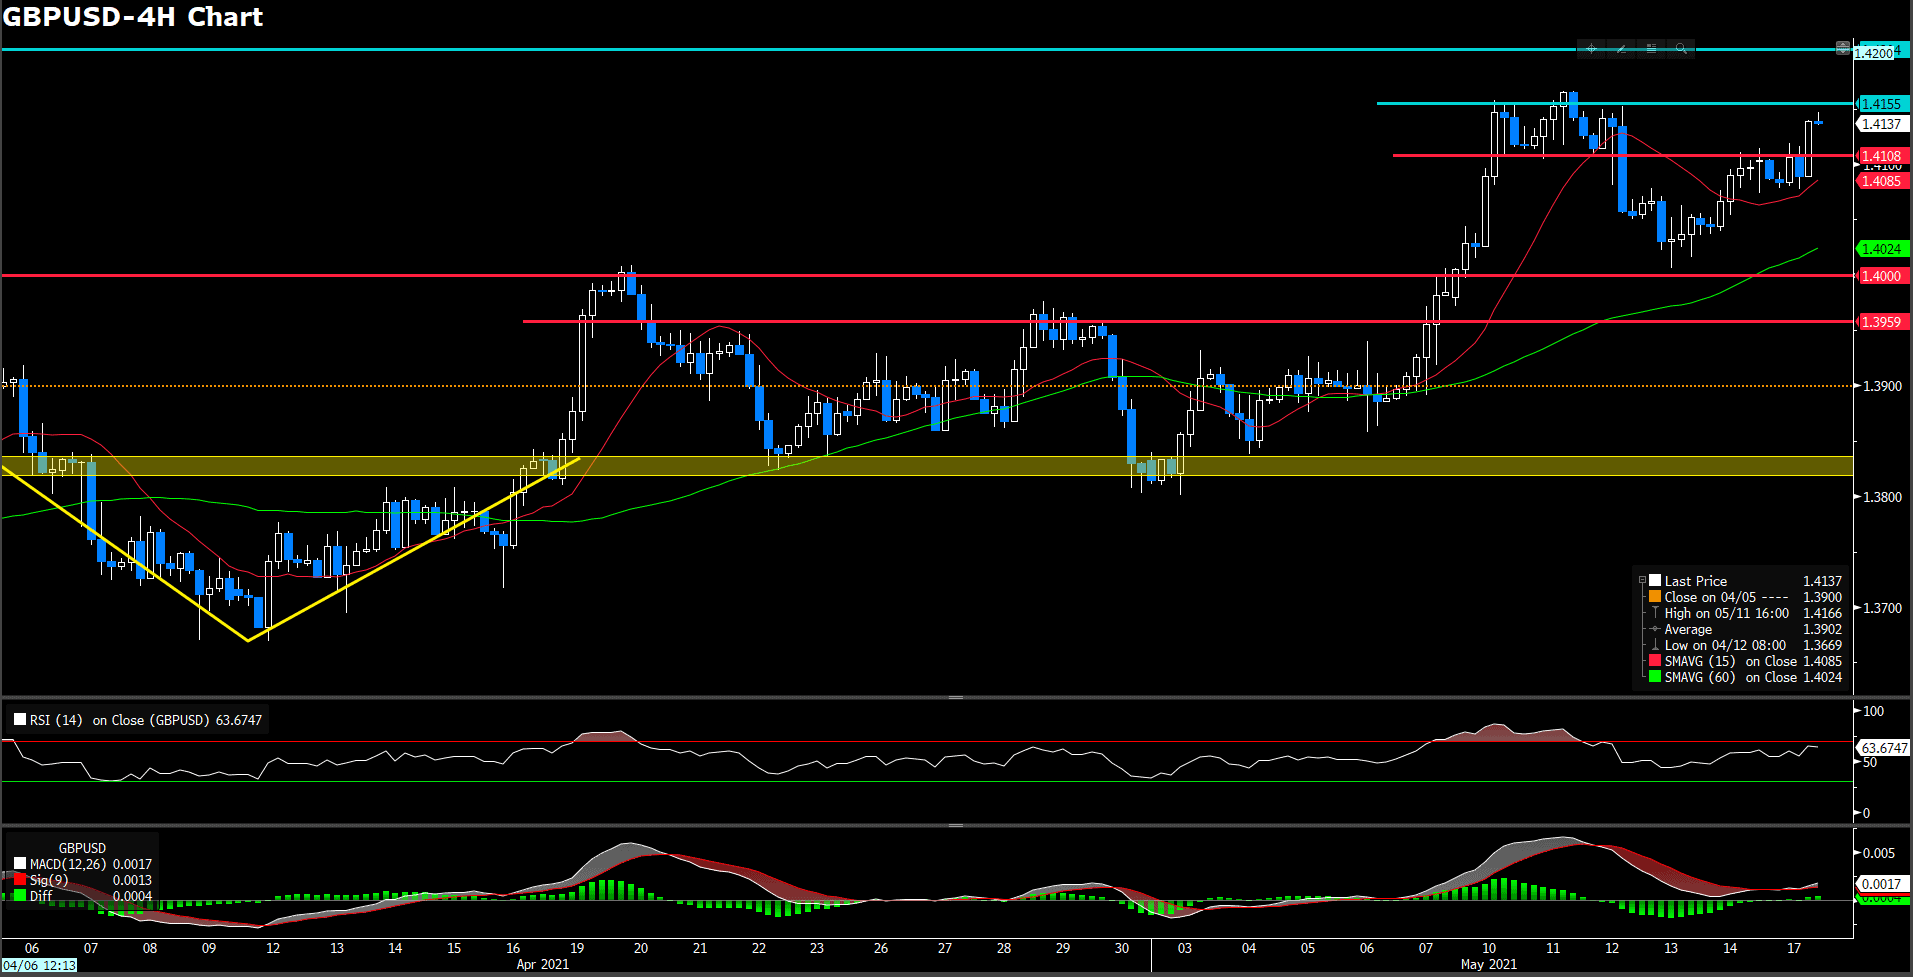
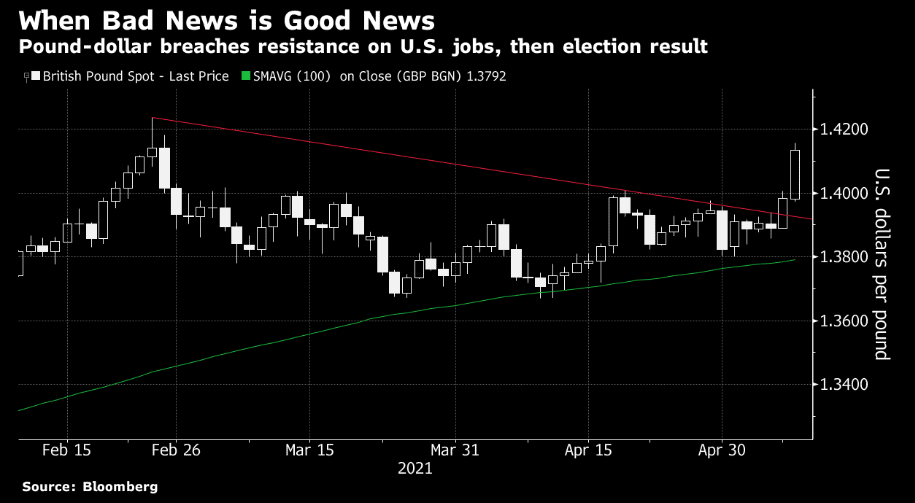
GBPUSD (4 Hour Chart)

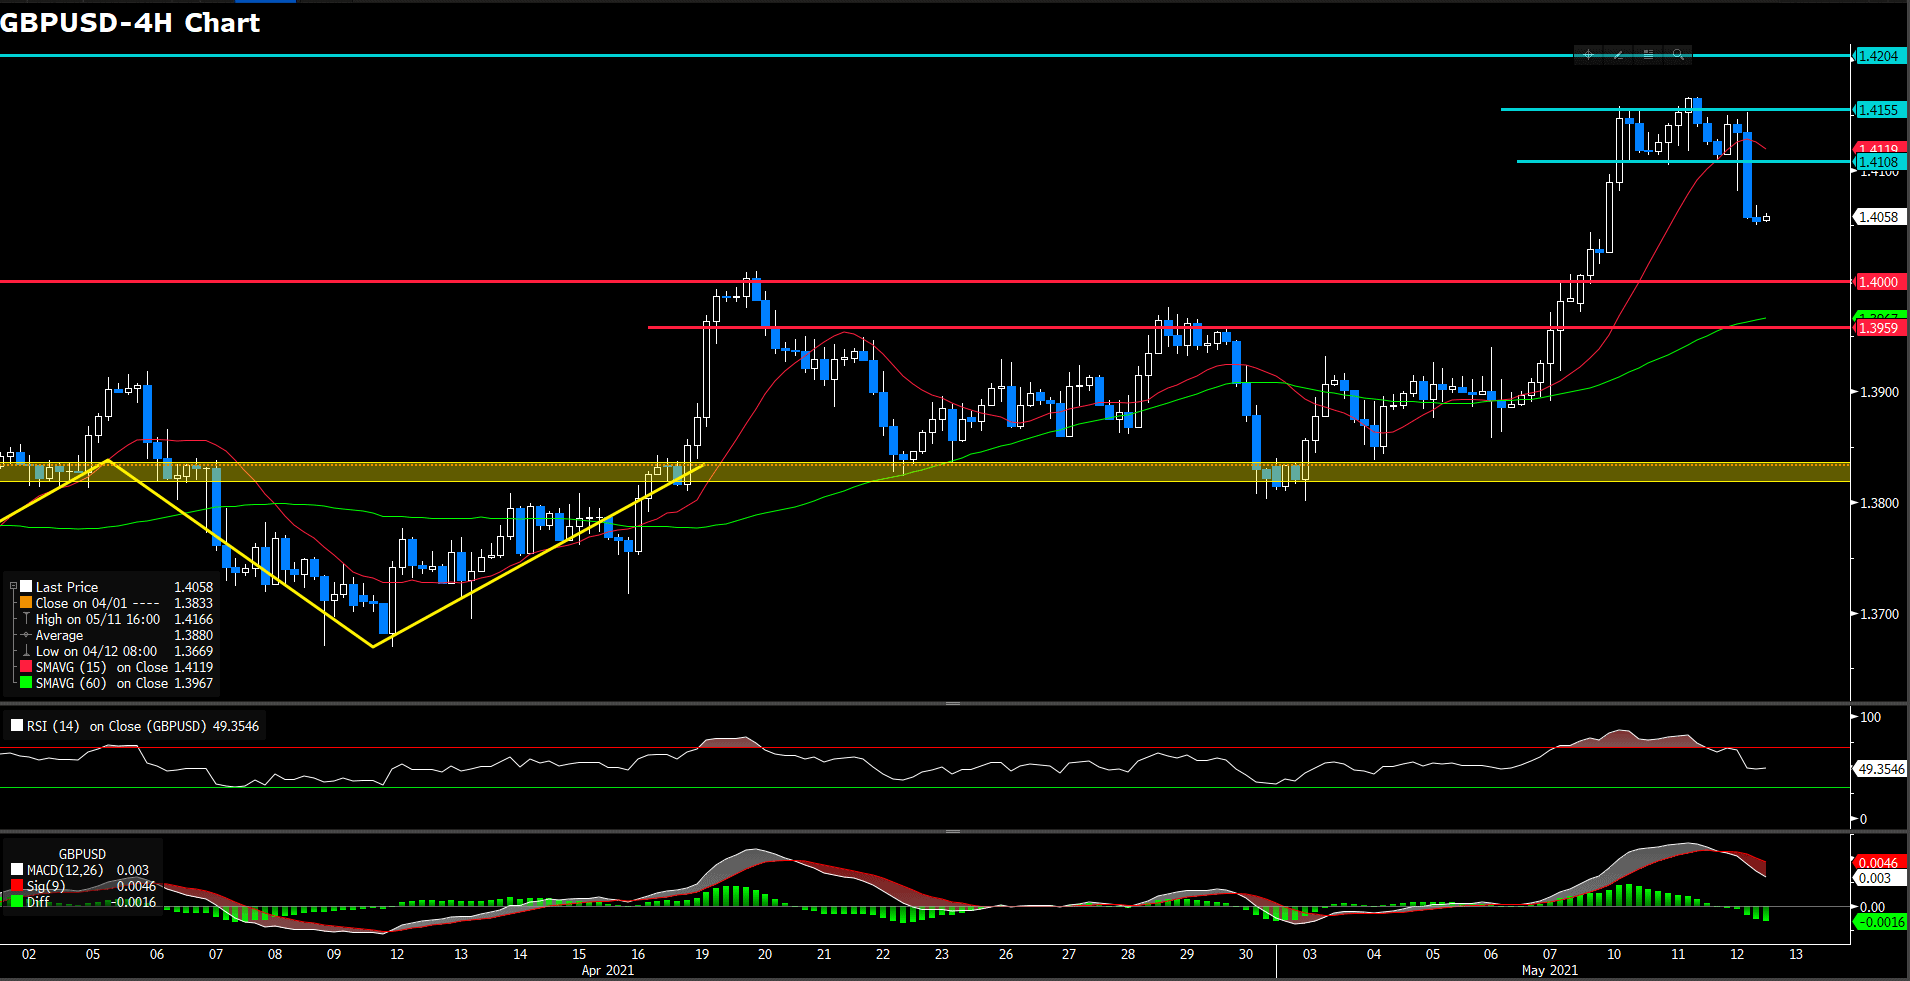
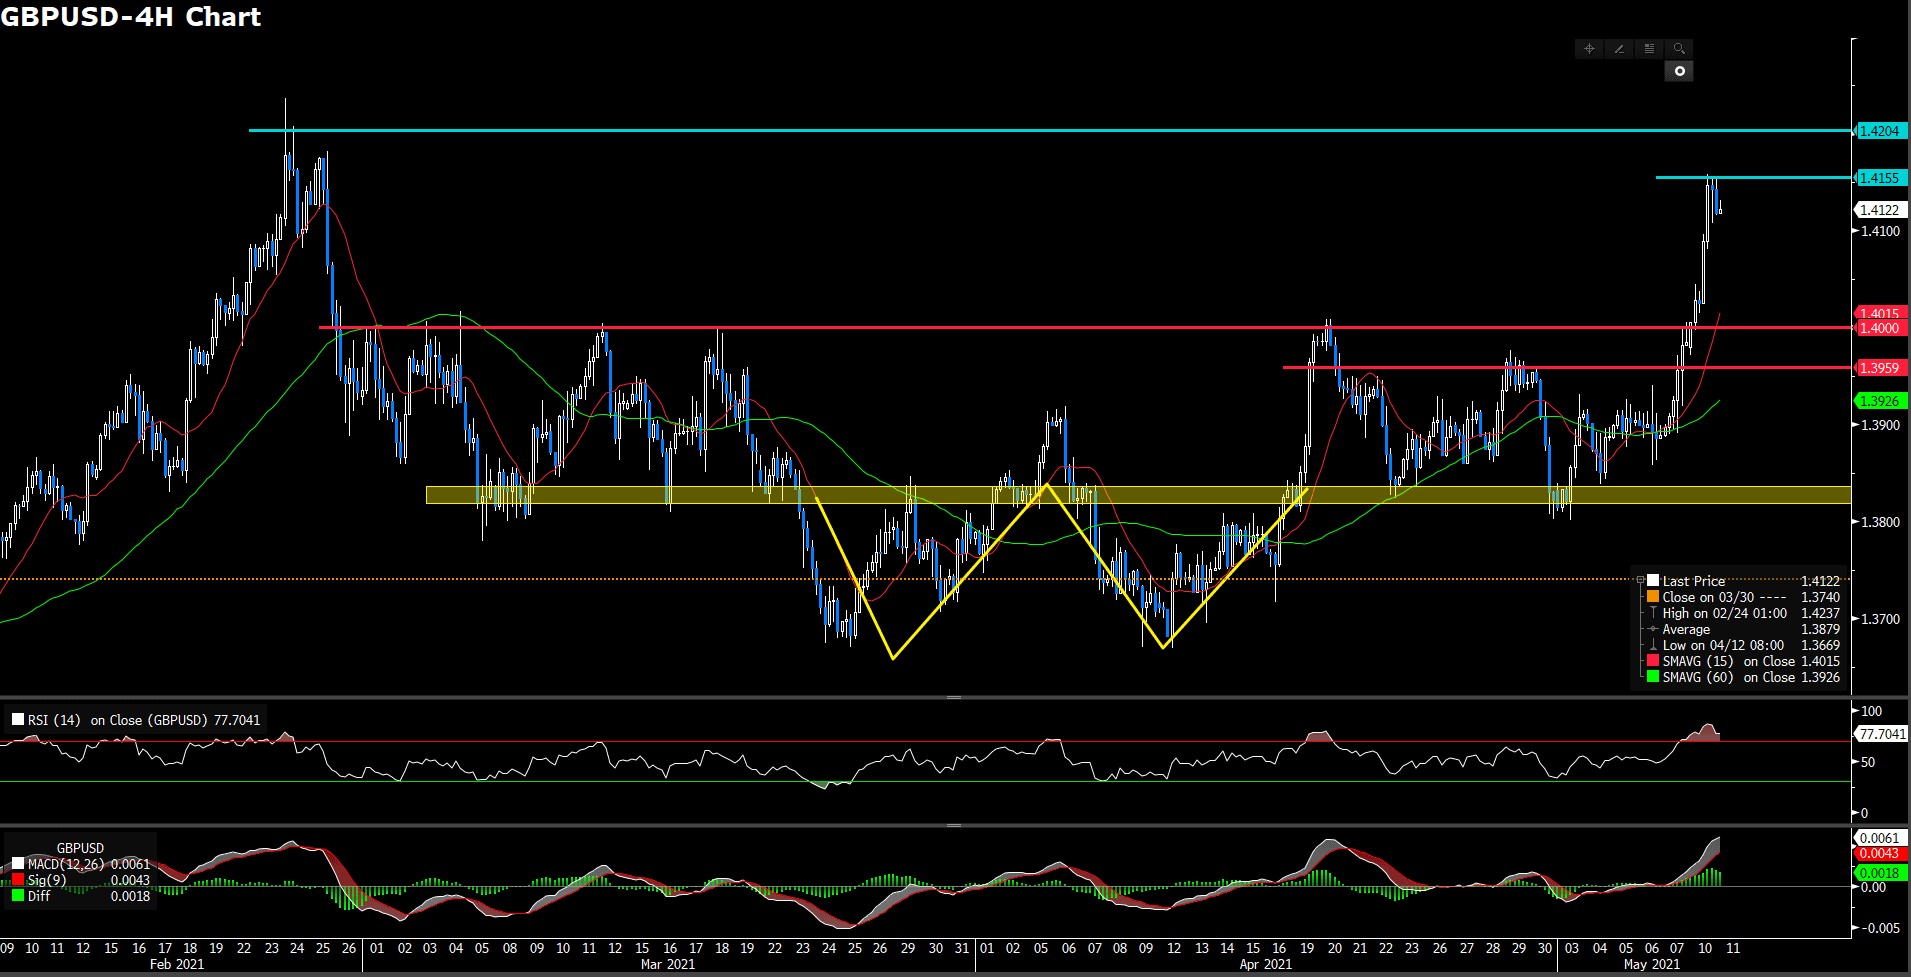
Sterling retreated from 1.42 level after once advanced to multi-month highs at 1.422. Nevertheless, Sterling surged up to higher stack that breakthrough where we thought is a critical level at 1.4155 in short run, trading at 1.419 with 0.4% gains in the day market. At the meantime, the Kingdom unveiled the ILO unemployment rate for the three months to March, which shrank to 4.8% beat 4.9% expected. For RSI side, indicator shows 66.2 figure after it exceeded over bought area in Asian session, suggesting a bullish momentum at current stage. On the other hands, 15-long SMA indicator remaining north side and 60-long SMA indicator remaining a ascending movement.
Overall, we expect sterling will test 1.42 level again that long-holder to see if strong enough for the bull momentum. Therefore, we see it first immediately support level would be 1.4 around for long-favour.
Resistance: 1.42
Support: 1.3959, 1.4, 1.4108
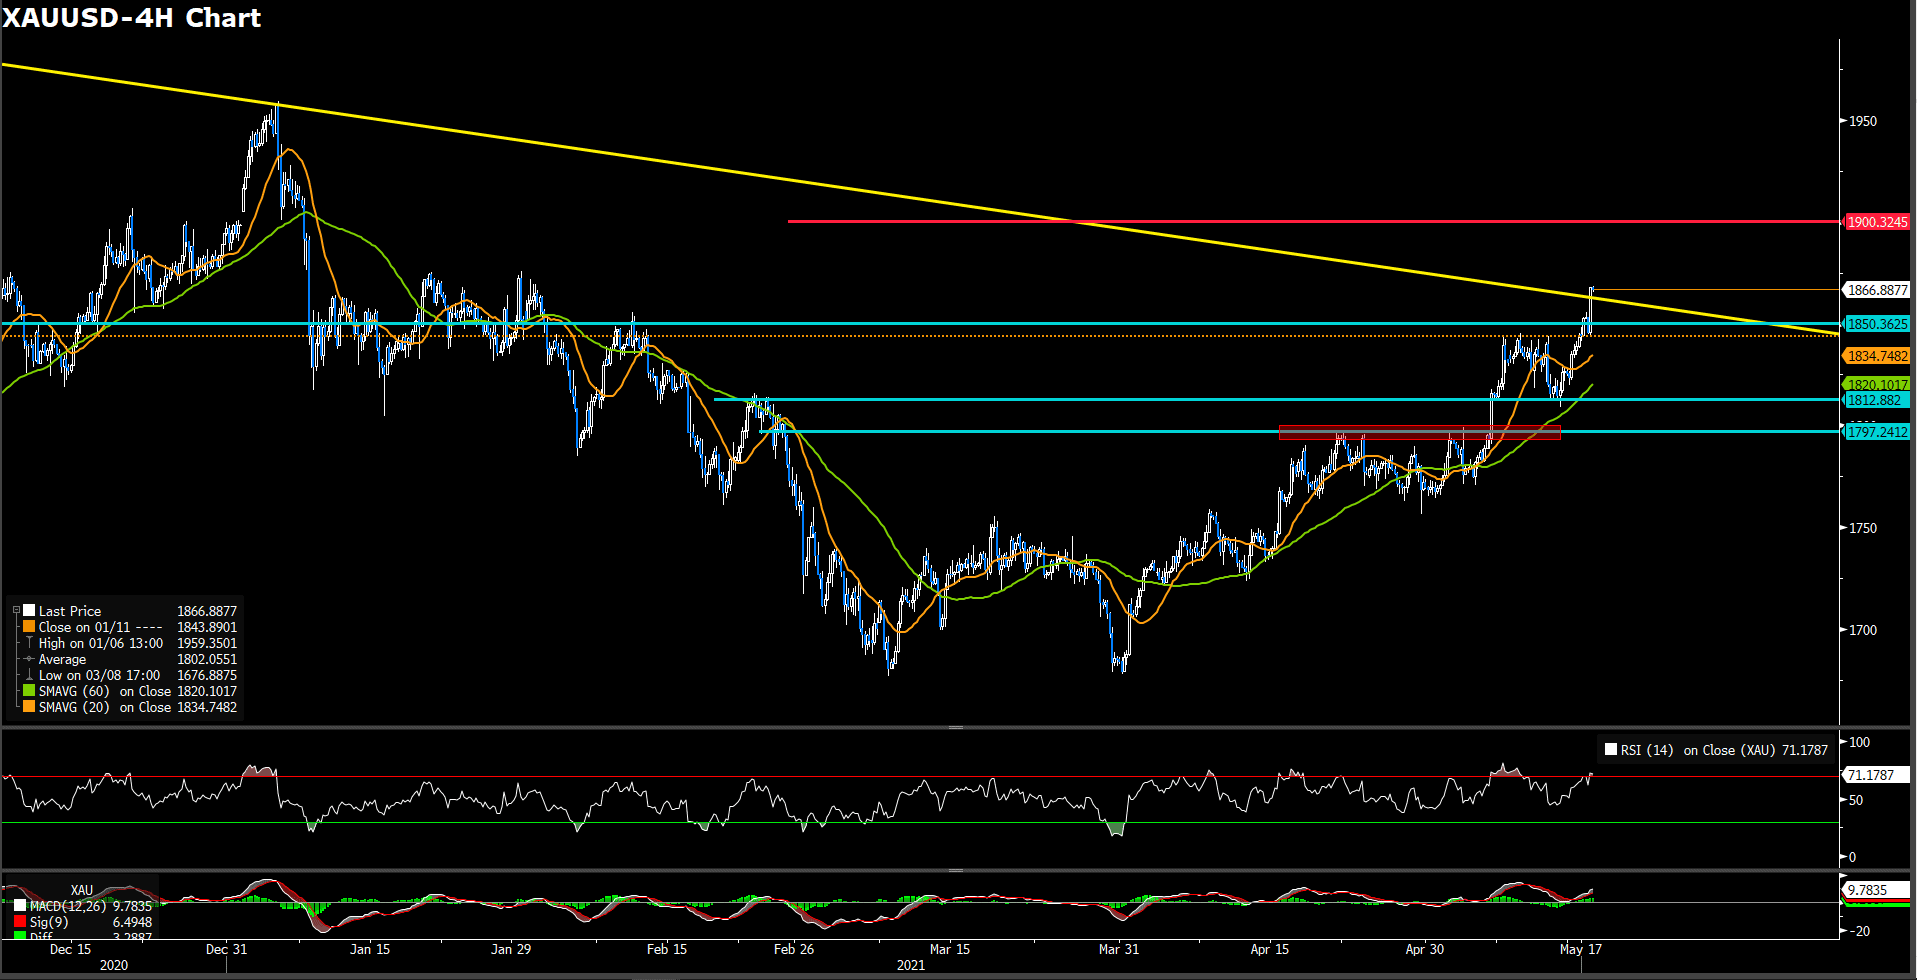
XAUUSD (4 Hour Chart)

Gold retreated from months perch level at 1875 level, it still extended the days victory to higher stage amid risk-on mood while it remain balance above downside trend, trading at 1870 as of writing. Meanwhile, greenback slipped to nearly year-long nadir after some Fed official reiterated that they will maintain the current ultra-eaing monetary policy regardless of the pickup inflation. For moving average side, 15-long SMA indicator retained it slope to upside trend and 60-long SMAs indicator retaining it north side momentum. For RSI side, inidcator shows 68 figures after it landing in over bought territory, suggesting bull market move at current stage.
As we mention yesterday, we still need to be patient to affirm whether it could stand firmly above the multi-month-long downside trend as yellow line. Morever, market has bought-in the expectation of substantial and widespread inflation but gold seems just creep up to sod far. Therefore, we still need the upside risk and further long-side moementum.
Resistance: 1900
Support: 1850, 1812.88, 1800, 1763.837
Economic Data
|
Currency |
Data |
Time (GMT + 8) |
Forecast |
||||
|
GBP |
CPI (YoY)(Apr) |
14:00 |
1.1% |
||||
|
EUR |
CPI (YoY)(Apr) |
17:00 |
1.6% |
||||
|
CAD |
Core CPI (MoM)(Apr) |
20:30 |
– |
||||
|
Oil |
Crude Oil Inventories |
22:30 |
1.623 M |
||||
|
USD |
FOMC Meeting Minute |
02:00 5/20 |
– |
||||