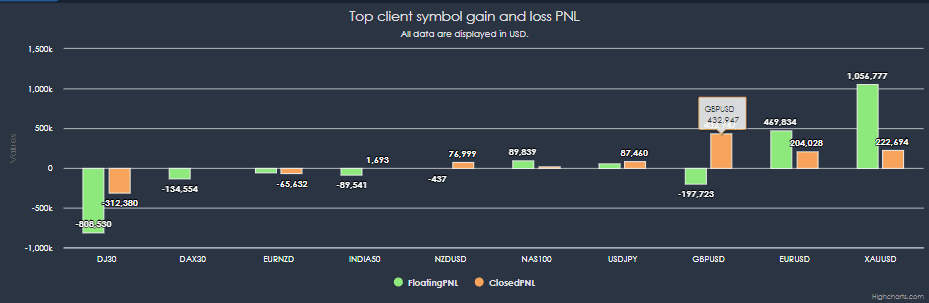
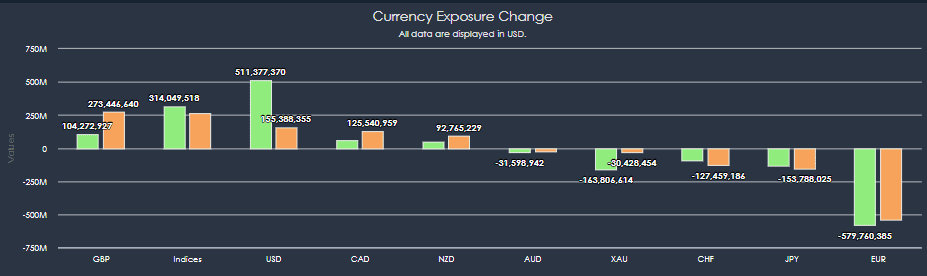
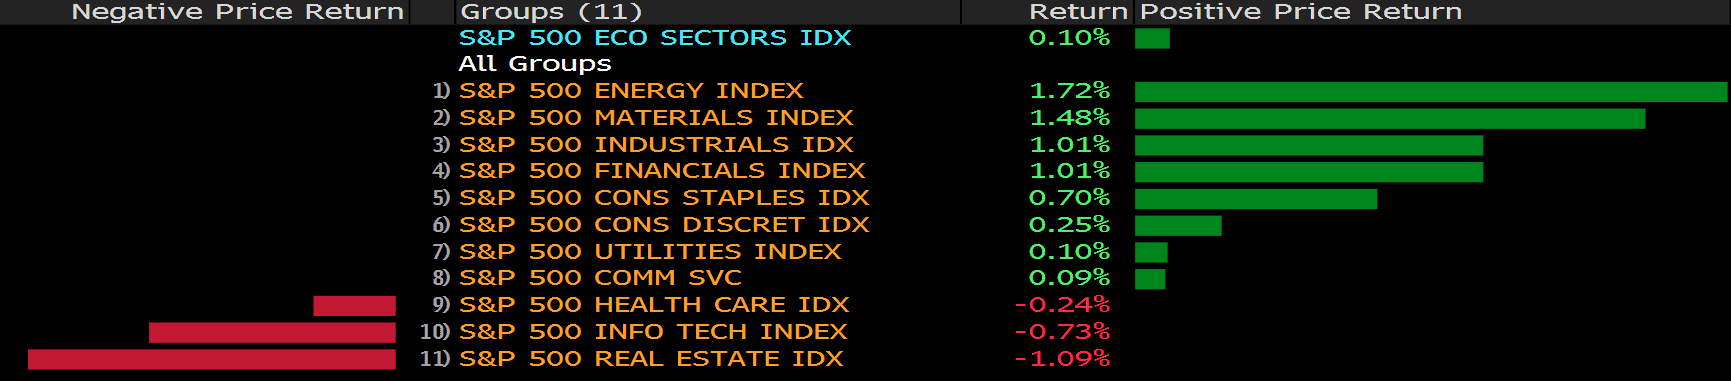
Daily Position Report
Market Focus
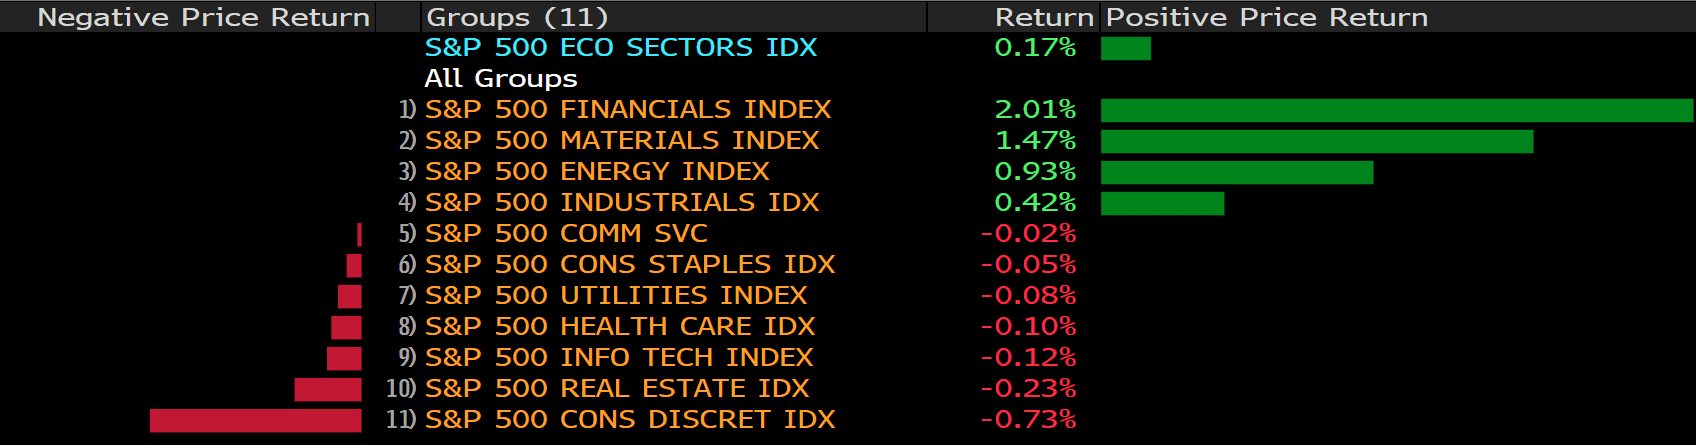
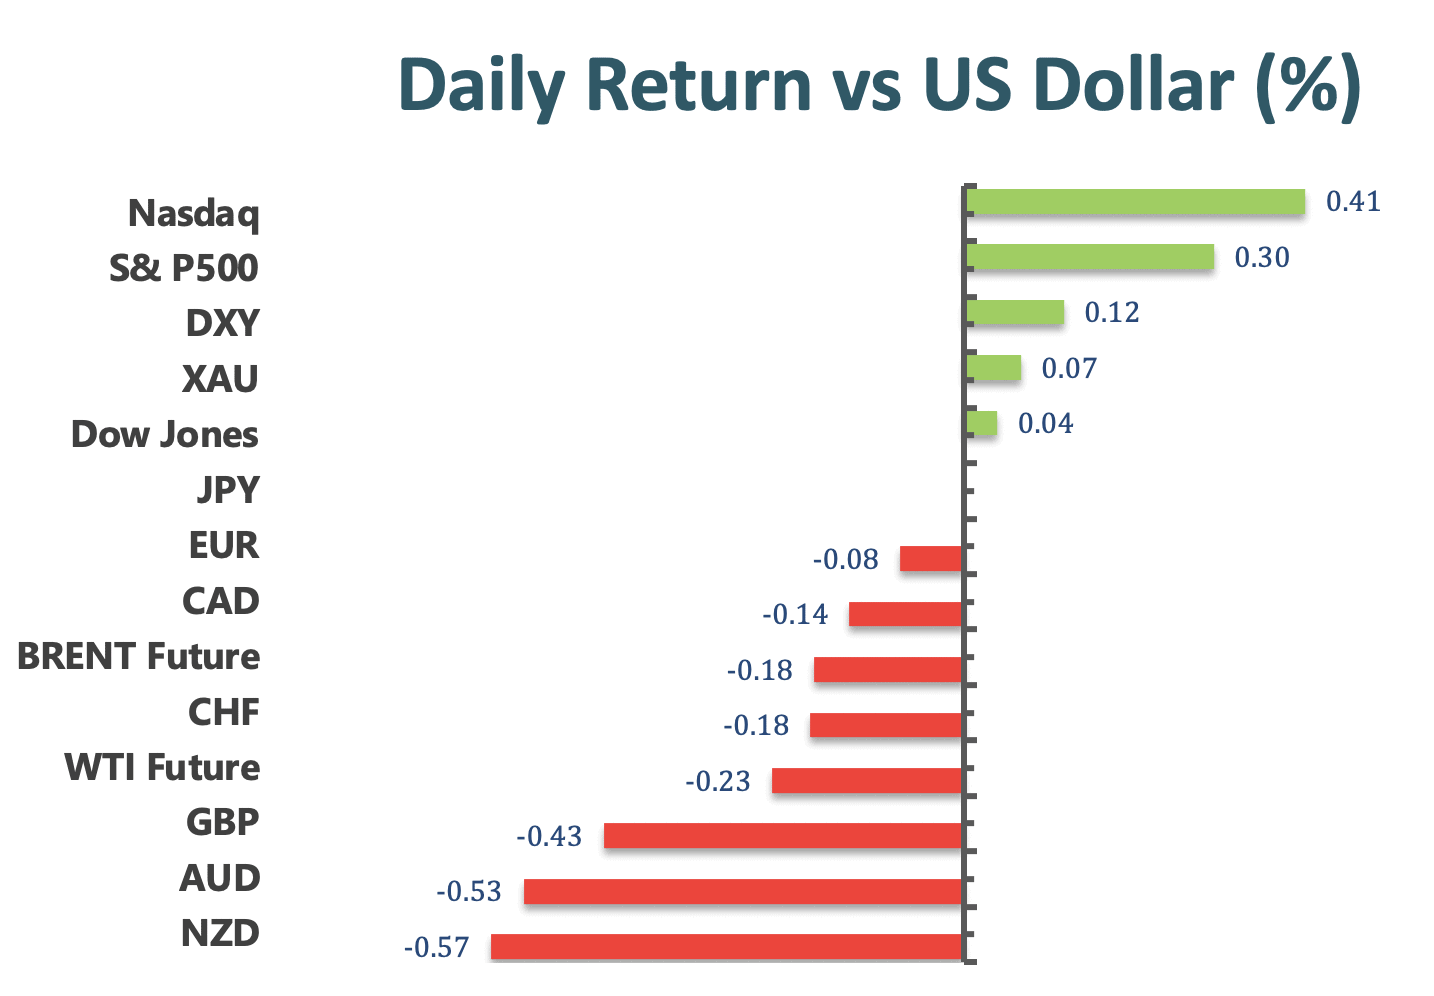
U.S. stocks set another record high even as the S&P 500 Index settles into the narrowest trading range since before the Covid pandemic roiled global financial markets. Health care and technology shares helped push the S&P to a closing high for a third consecutive session and for the 47th time this year. Micron Technology led chipmakers lower amid concern over the market for memory chips. Amid cautious sentiments, Nasdaq rose 0.35%, and Dow Jones gained just 0.04%.
The head of the Federal Trade Commission said antitrust enforcers should more frequently move to block mergers that threaten competition rather than relying on traditional remedies to fix deals and then approve them, a view that may weigh on a major acquisition by defense giant Lockheed Martin Corp.
FTC Chair Lina Khan outlined her concerns about common measures used by the Justice Department and the FTC to settle merger investigations in a letter to Senator Elizabeth Warren of Massachusetts, who had written to the agency about deals in the defense industry.
The comments come as the FTC is investigating Lockheed’s $4.4 billion deal to purchase Aerojet Rocketdyne Holdings Inc., a takeover seen as an early litmus test of whether President Joe Biden will keep mergers among defense contractors in check.
Khan said she’s skeptical of the practice of imposing conditions on how companies operate, known as behavioral remedies, but also said asset divestitures, the most common way that companies win approval for mergers, can be problematic.
Main Pairs Movement:
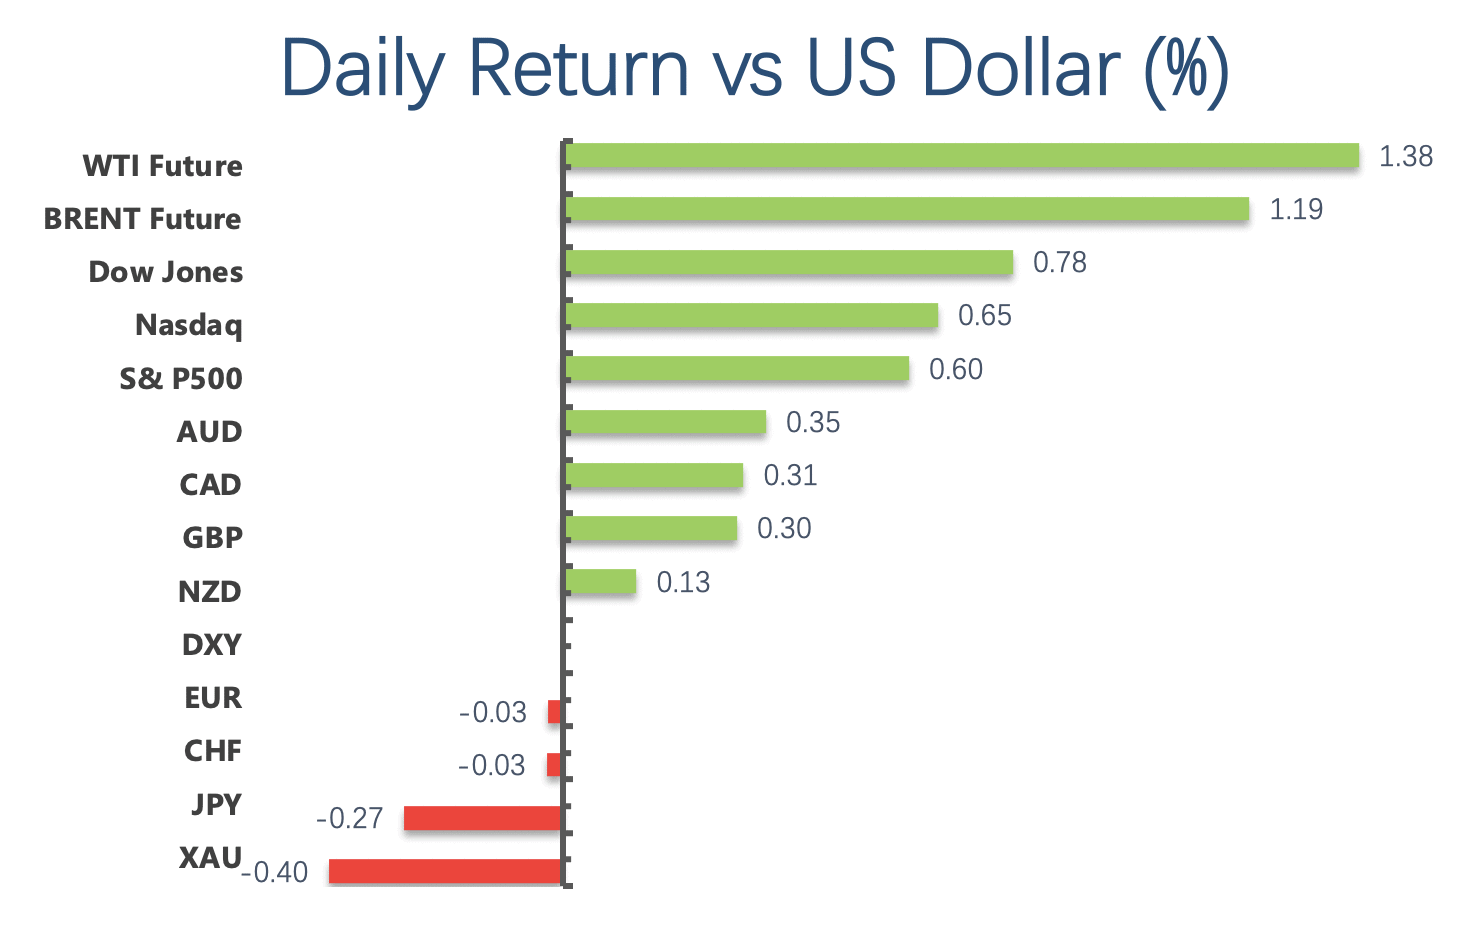
The dollar advanced against most of its mayor rivals as the market’s mood soured. Higher than expected US PPI revived concerns about heating inflation and a possible Federal Reserve’s response. Still, the greenback gains were tepid and uneven.
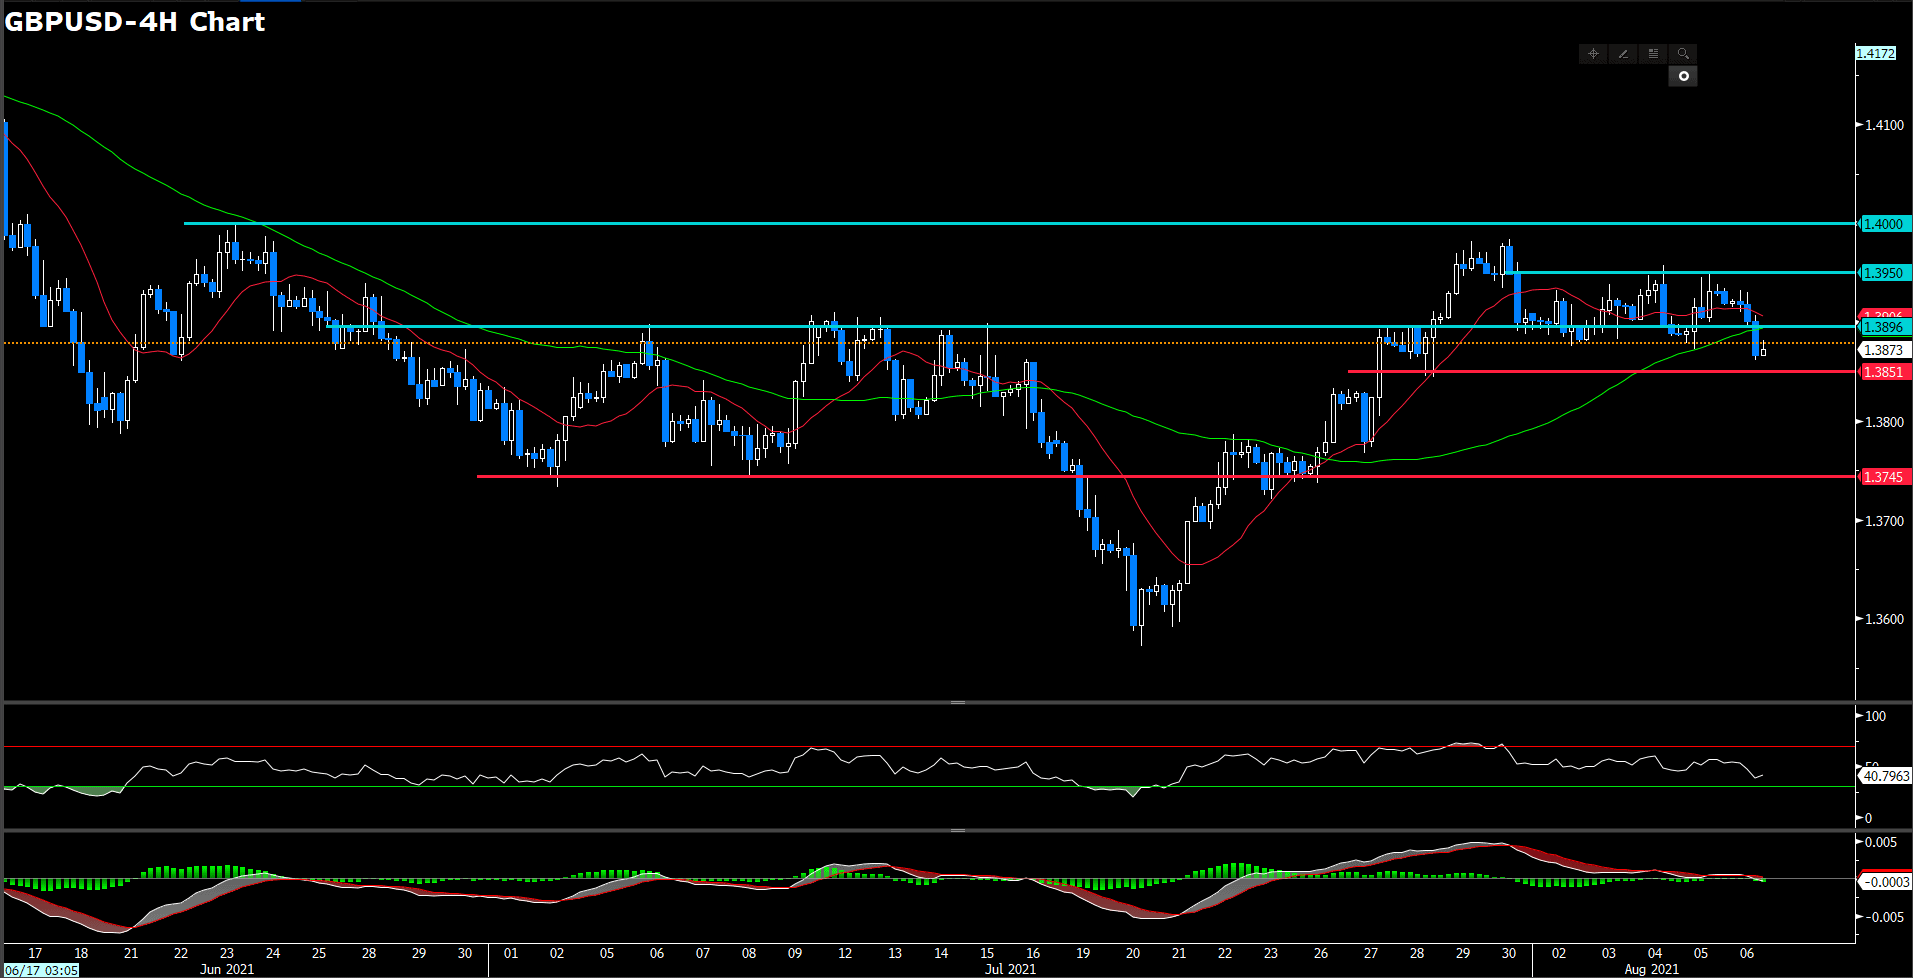
The euro pair and USDJPY lingering around the familiar levels, while cable bounced off 1.3800 and settle slightly above that level as of writing. Commodity-linked currencies lost ground against their American peer, as Loonie extended north, and both antipodean pairs edged lower. Overall, currencies followed the lead of Wall Street, which seesawed between gains and losses to end the day mostly in the red.
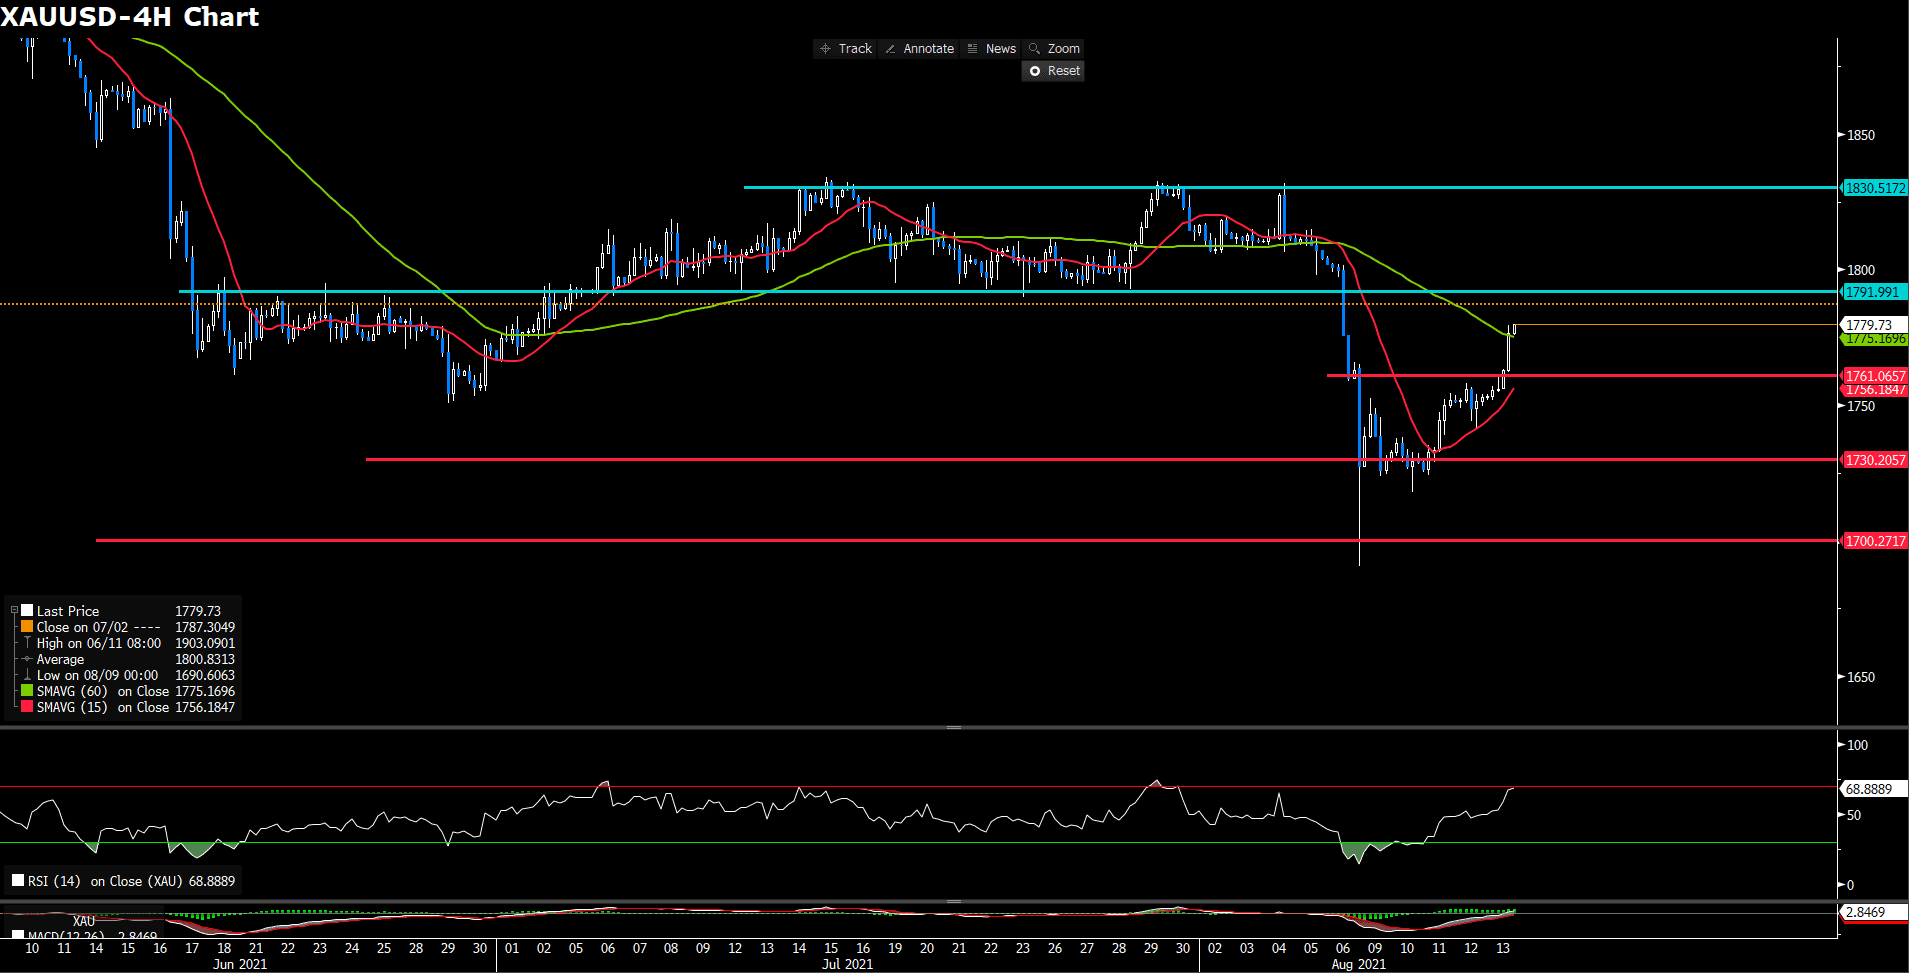
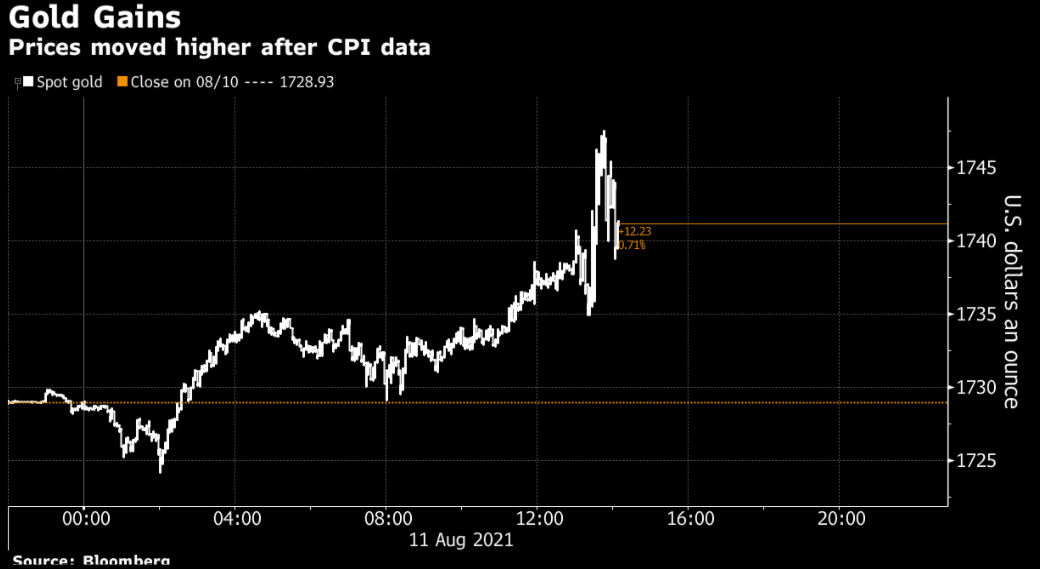
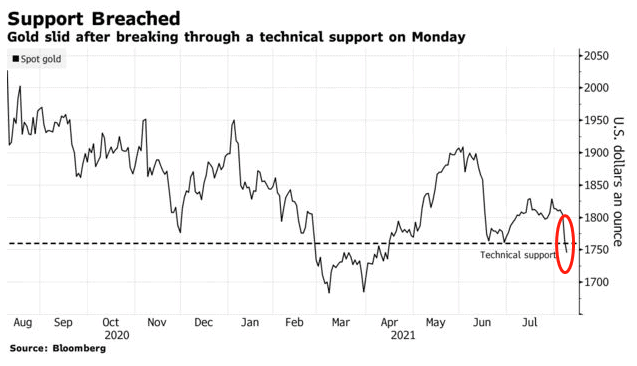
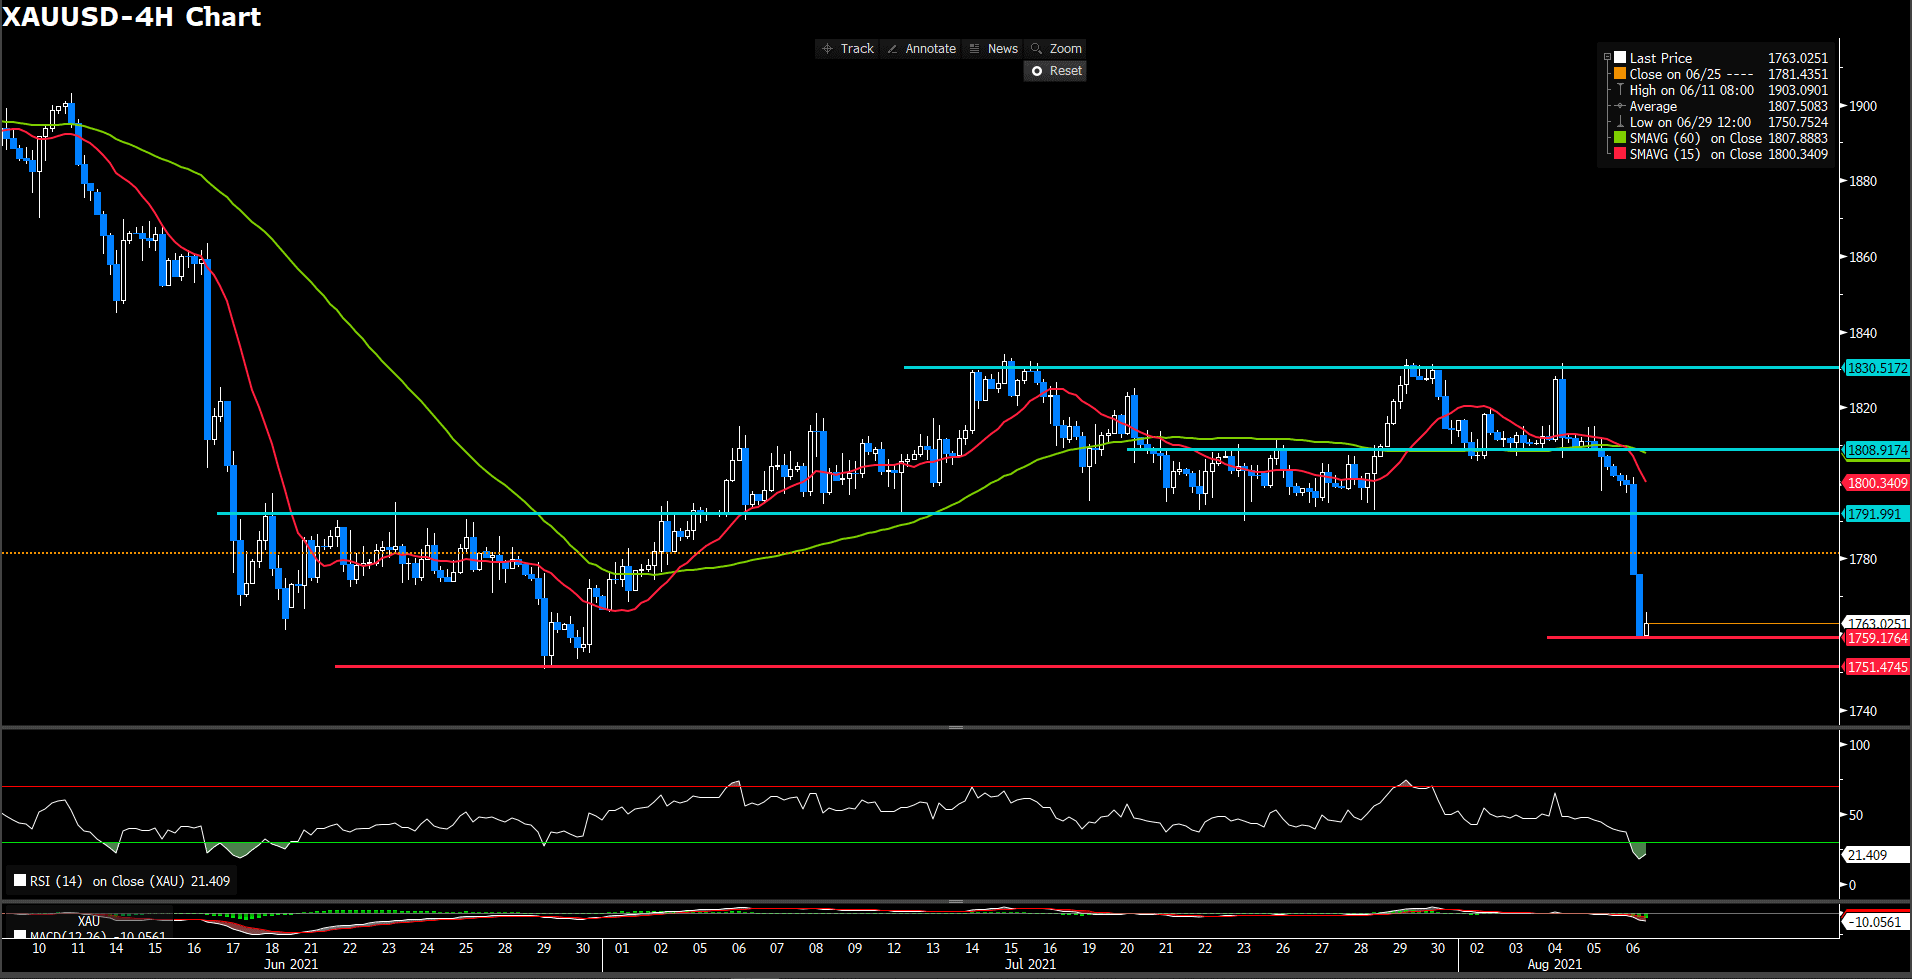
Gold is unchanged on a daily basis, trading around $1,750 a troy ounce heading into the Friday opening. Crude oil prices slightly dropped, with WTI failing to breach $70.00 resistance and closing the day at $68.90, and Brent at $71.15. US bond yields closed mixed. The 10-year US Treasury note settled at 1.36%.
Technical Analysis:
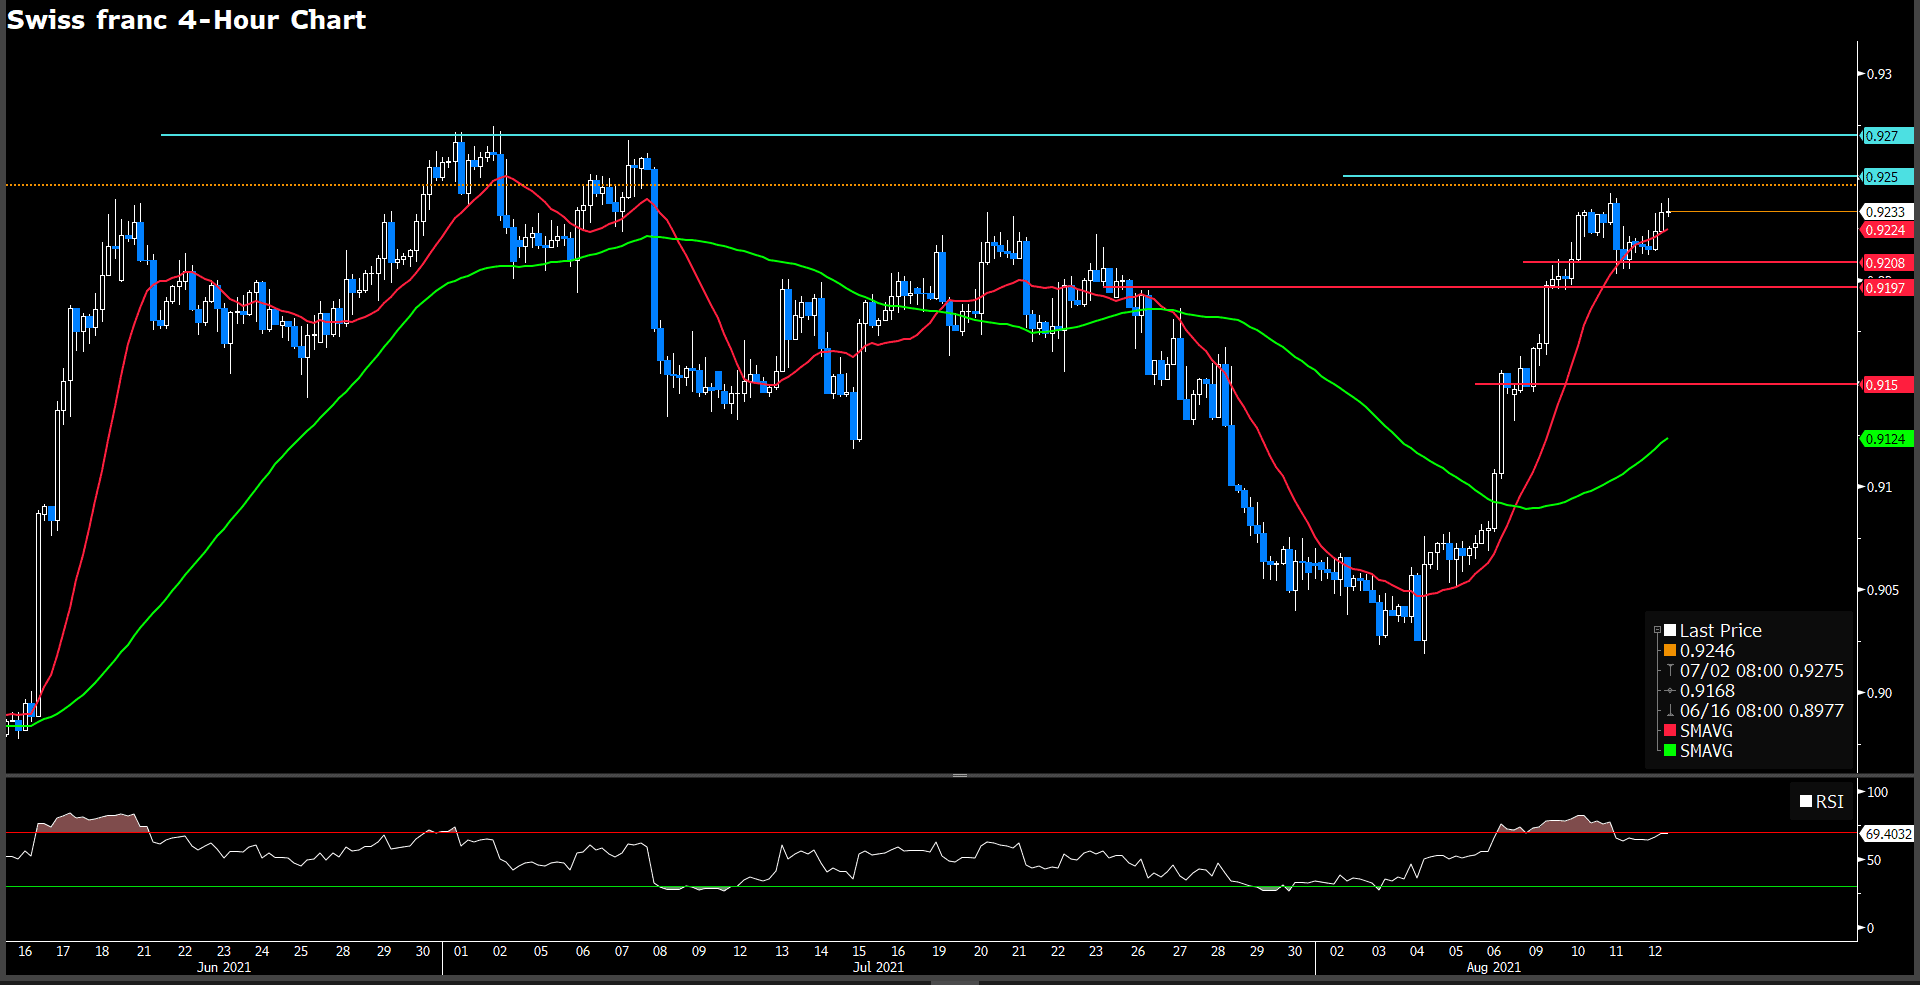
USDCHF (4-hour Chart)

The USD/CHF extend the upside traction above 0.92 and ahead of month-long peak as investor ignore Producer Price Index(PPI) rose to 7.8% in July from 7.3% in June in came in higher than estimation, pair printed 0.9235 with 0.16% gains as of writing. In the meantime, the benchmark 10 years U.S. Treasury bond yields is up more than 2% hover on Thursday, additional propel the pair stay afloat in the positive territory. For market data, the Michigan’s Consumer sentiment index for August will be featured in the U.S. economic docket.
For technical aspect, RSI indicator drag down from over bought area to 69 as of writing, suggesting torrid bullish sentiment ahead. For moving average side, 15 and 60 long SMAs indicator are both toward to north way.
In lights of aforementional, we expect market is facing a powerful resistance on 0.925 which base on price action. On the other hands, RSI indicator also shows a nearly over bought sentiment if market succesive rally up, then hold momentum back. Therefore, we foresee market will choppy in range between 0.9208 and 0.925 if price could continue hold above first support level. On contrast, it really hard to find a price cluster for downside support. Since, if price failed to defend first short term support, then price will forward to lower stage.
Resistance: 0.925, 0.927
Support: 0.9208, 0.9197, 0.915
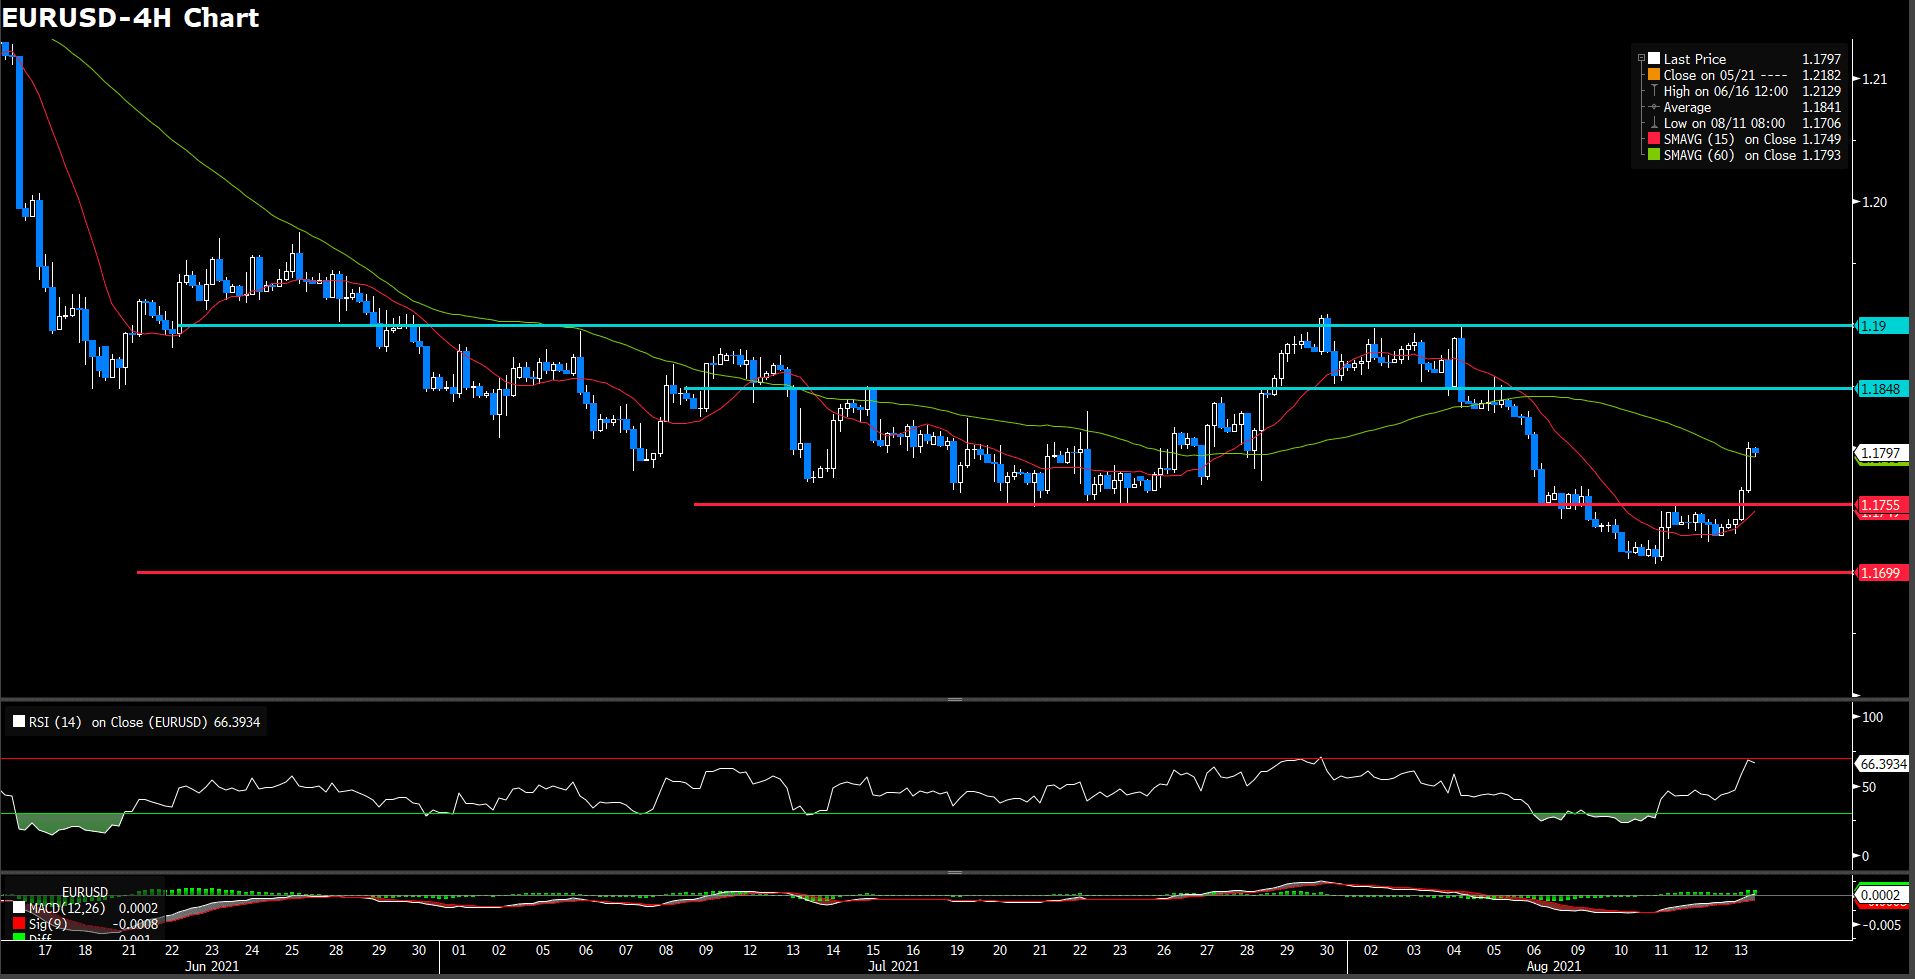
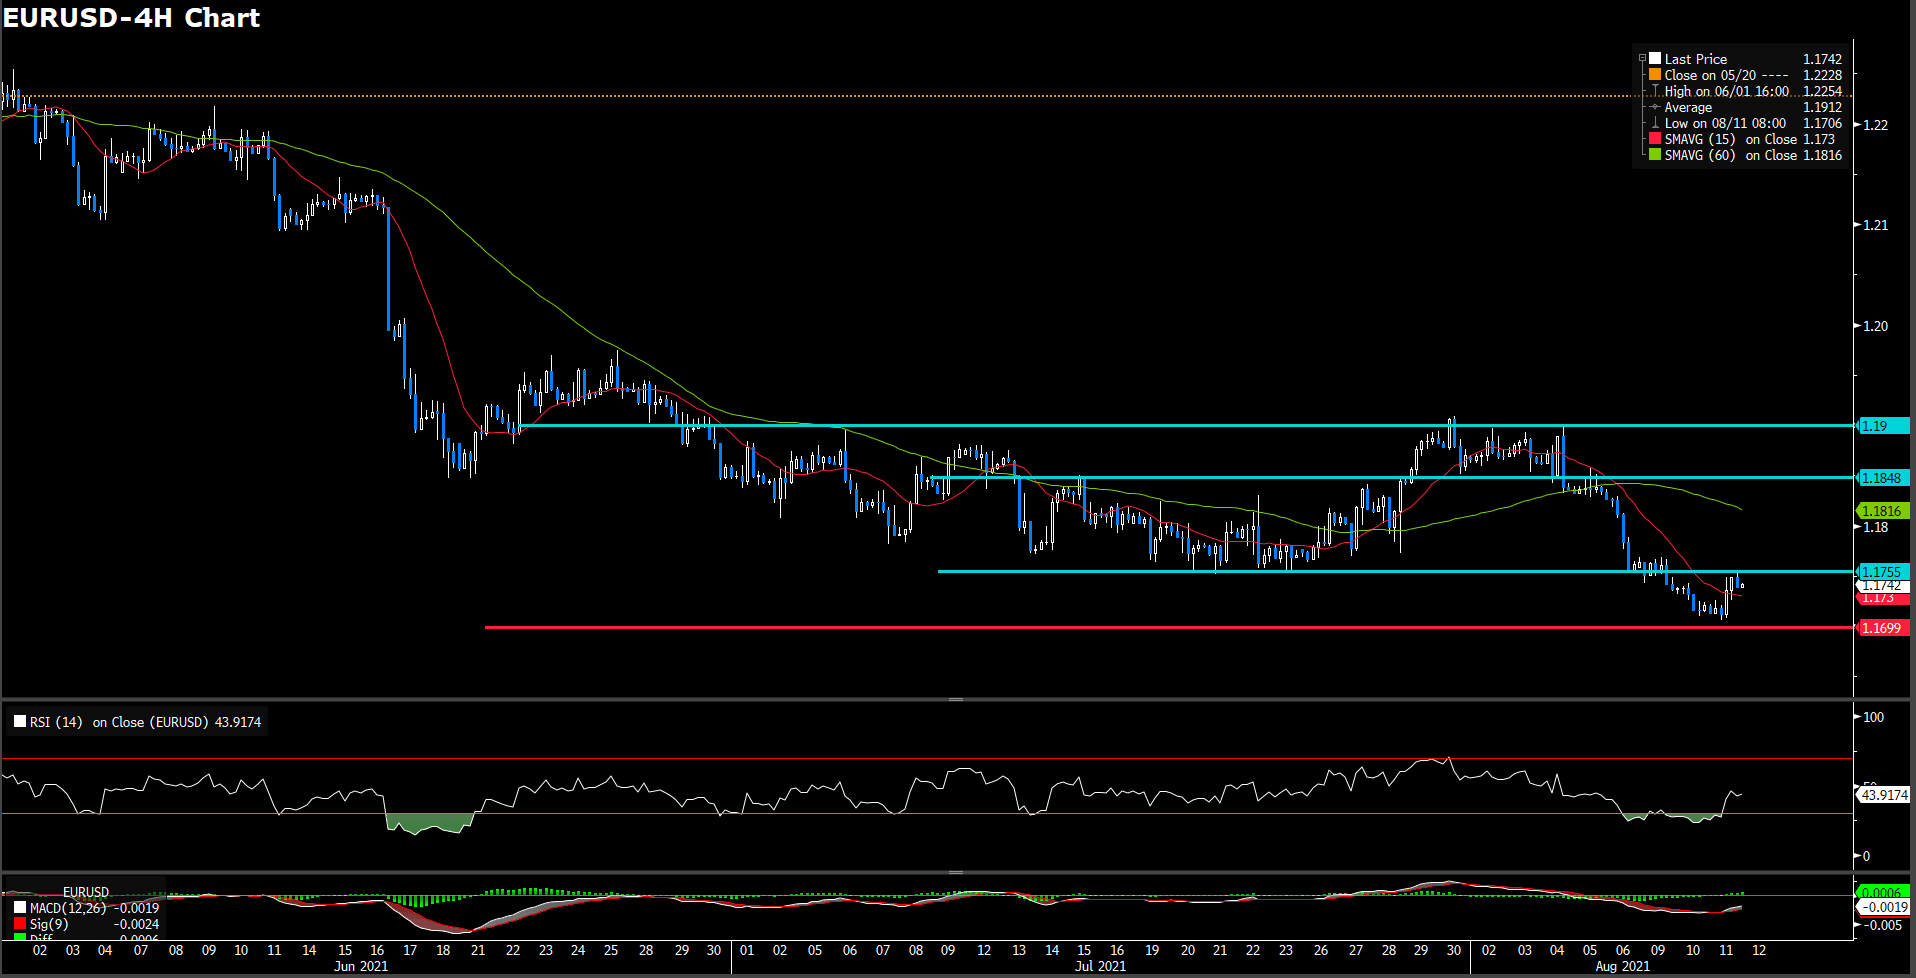
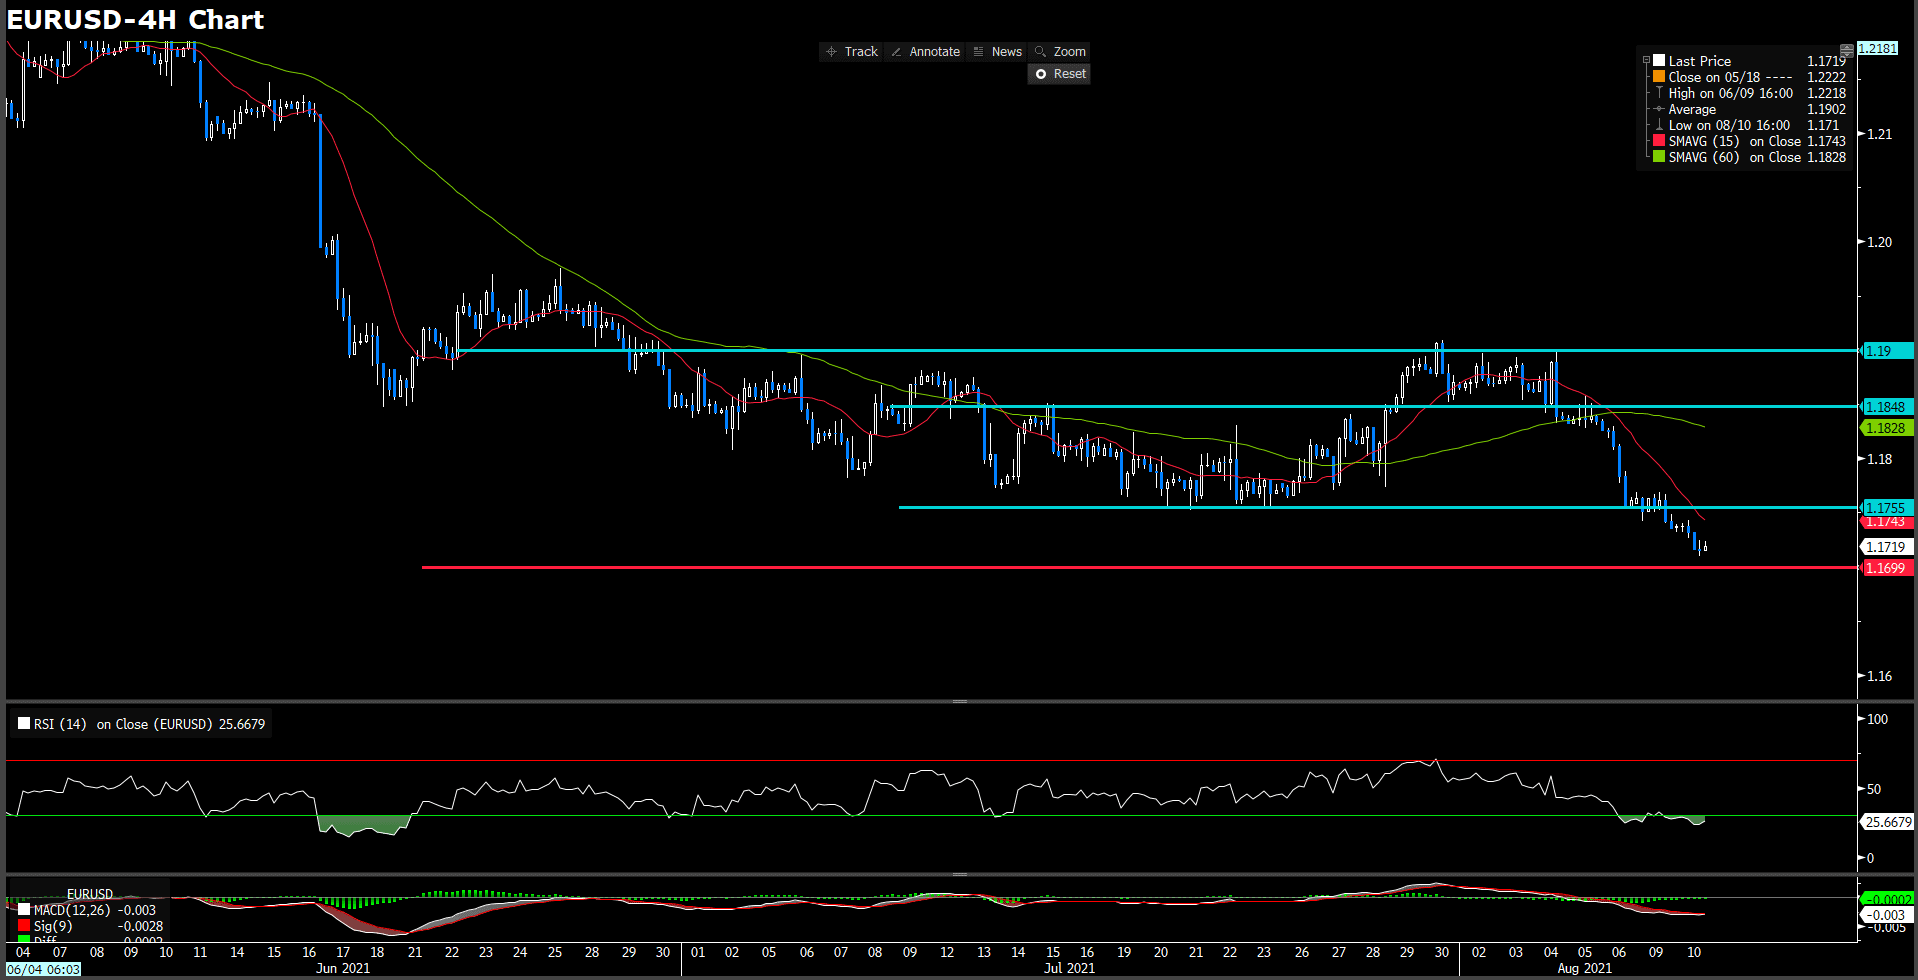
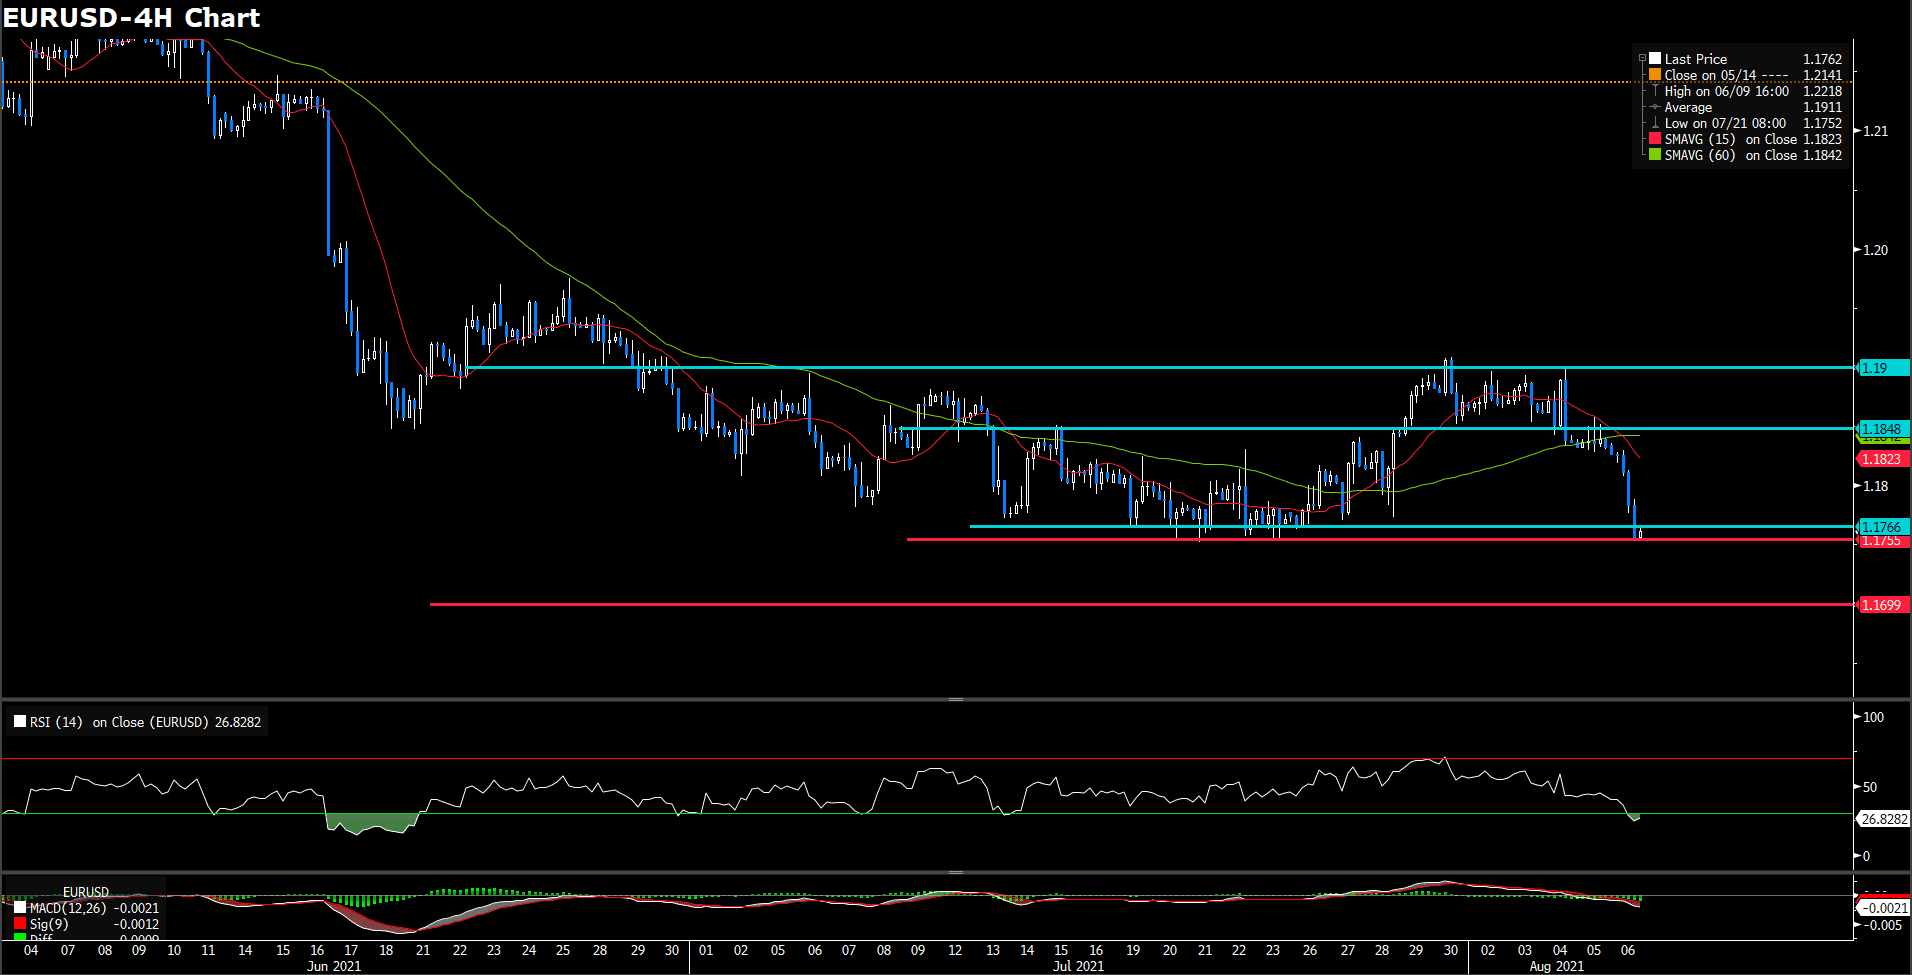
EURUSD (4- Hour Chart)
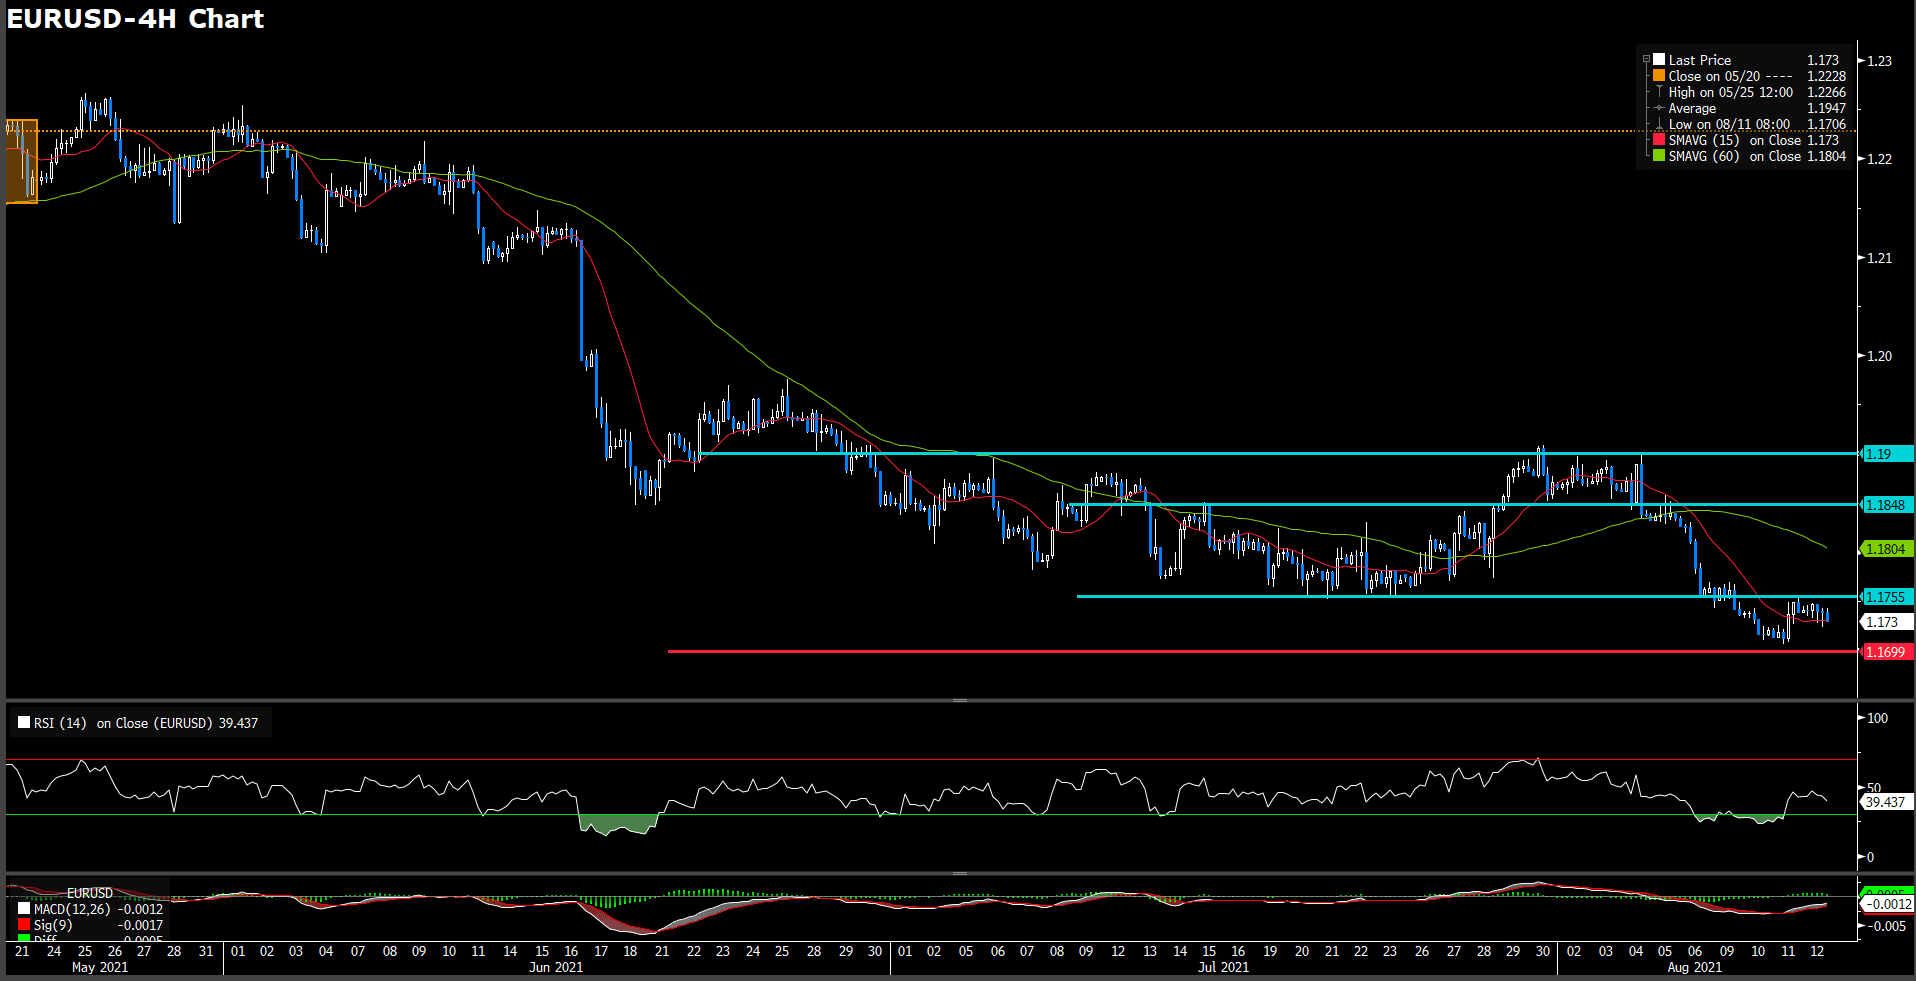
EUR/USD pair shows bottomed at 1.721 then bounced to the upside trimming losses. It rose back above 1.173 on a quite session. It still remains in negative territory but off lows dollar’s momentum evaporates. The DXY index is still up for the day, but it printed slow movement at 93 threshold as greenback peaked after the release of U.S. initial jobless claims dropped as expected to 375K while fell under 3 million for the first time since the pandemic.
From the technical perspective, RSI indicator recovered from over sought territory and printed 39 figures, suggesting s bearish momentum ahead. For moving average side, 15 and 60 long SMA indicator are both heading to negative side.
As our mention previously, we expected if price drop below 1.1755, market momentum would drag it to lower lows that eyes on 1.17. In the day market, we see euro fiber was blocked by critical upper resistance at 1.1755 then turn it head back down slightly. All in all, we expect 1.17 will be the final support level for bid buyer. If break through the 1.17 level, then price will ahead to lower stage.
Resistance: 1.1755, 1.18, 1.185
Support: 1.17
USDCAD (4- Hour Chart)
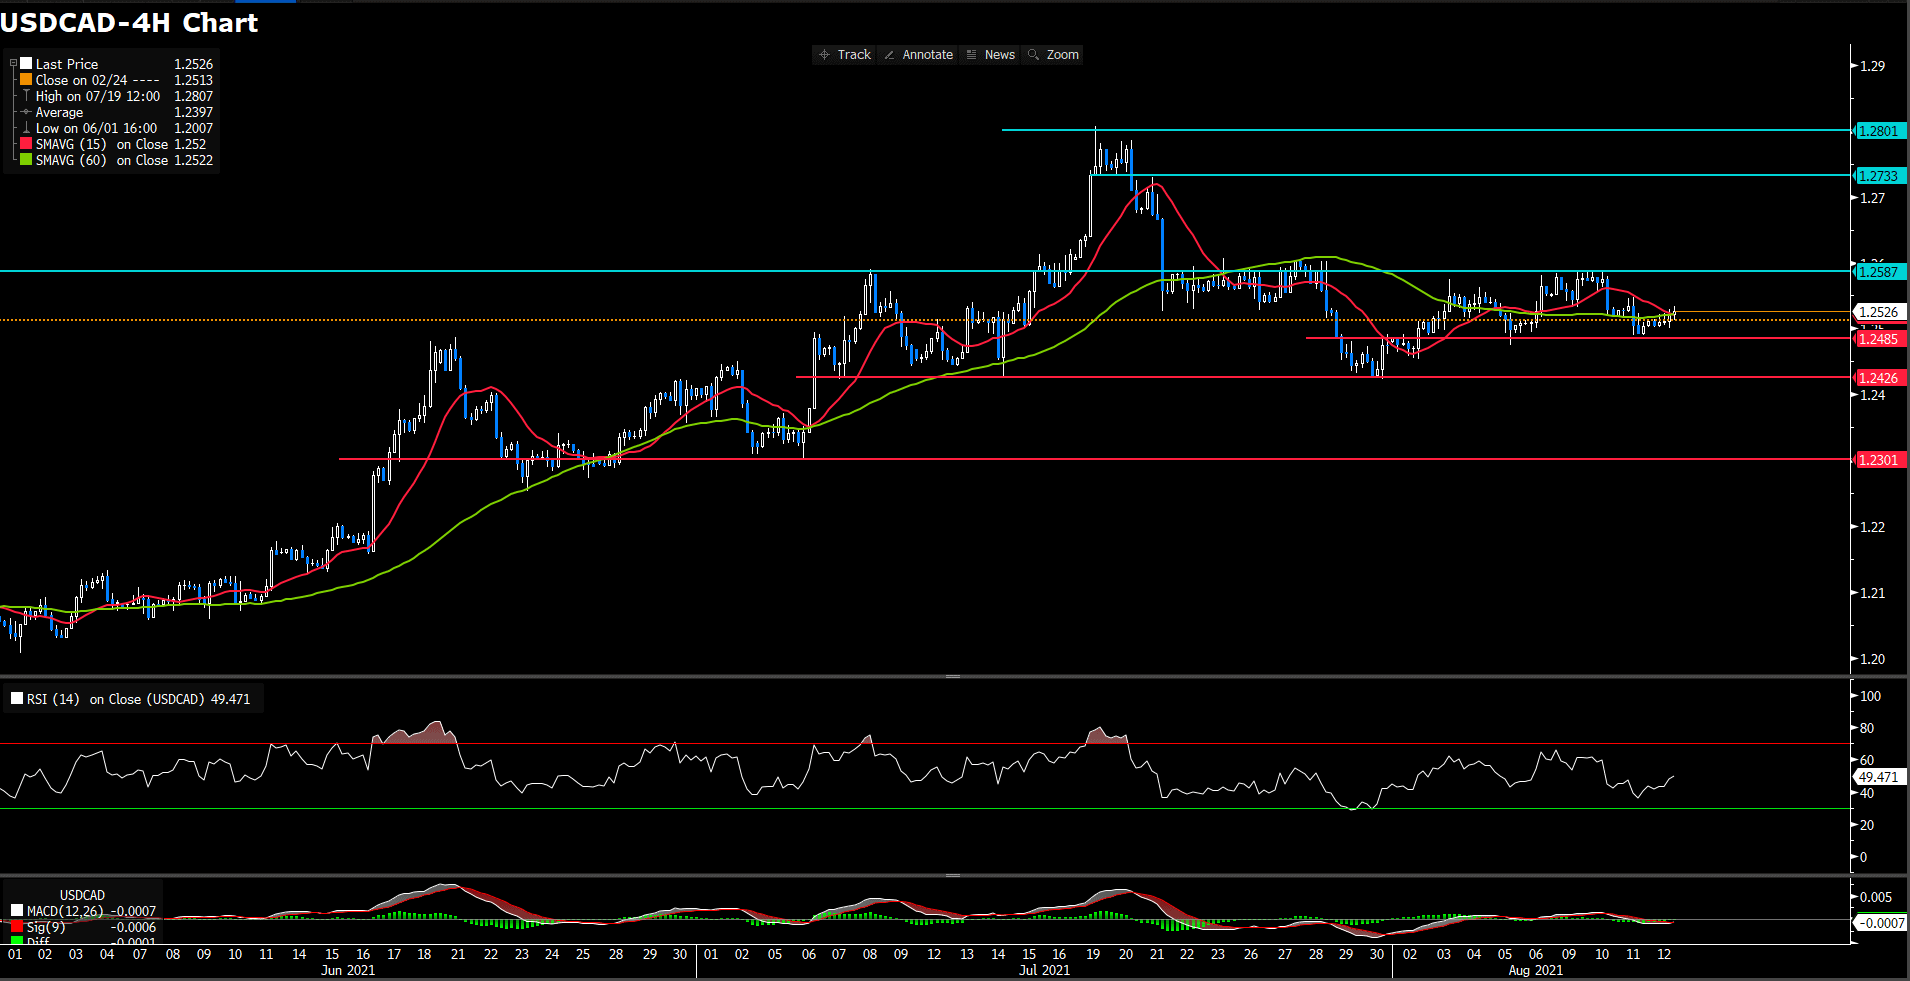
The USD/CAD pair edged higher during the U.S. trading session and was last seen rising 0.22% on the day at 1.2526 level as of writing. Despite the recorvery witnessed following a two-day decline, pairs movement was restricted by a lack of high-tier macroeconomic data release. On the other hands, crude oil price trading to negative side under $69 per barrel and fail to provide directional clue to commodities-linked loonie.
For technical side, RSI indicator record 49 figures as of writing, suggesting slightly bearish movement but lack of direction. For moving average perspective, 15 long SMA indicator toward it slope to upwind momentum and 60 long SMA indicator shows north way momentum.
All in all, we think market is stucking in a modest range between 1.2485 and 1.2587. On upside, we see 1.2587 as critical resistance as neckline of a slightly pattern. On downside, a weakness and short term is eye on 1.2485, following a pivotal support level on 1.2425
Resistance: 1.2587, 1.2733, 1.28
Support: 1.2485, 1.2425, 1.23
Economic Data
|
Currency
|
Data
|
Time (GMT + 8)
|
Forecast
|
|
USD
|
Michigan Consumer Expectation (Aug)
|
22:00
|
85
|
|
USD
|
Michigan Consumer Sentiment (Aug)
|
22:00
|
81.2
|
|
|
|
|
|
|
|
|
|
|
|
|
|
|
|
|
|
|
|
|
|
|
|
|
|
|
|
|
|
|
|
|
|
|
|
|
|
|
|
|
|
|
|
|