Daily Market Analysis
Market Focus
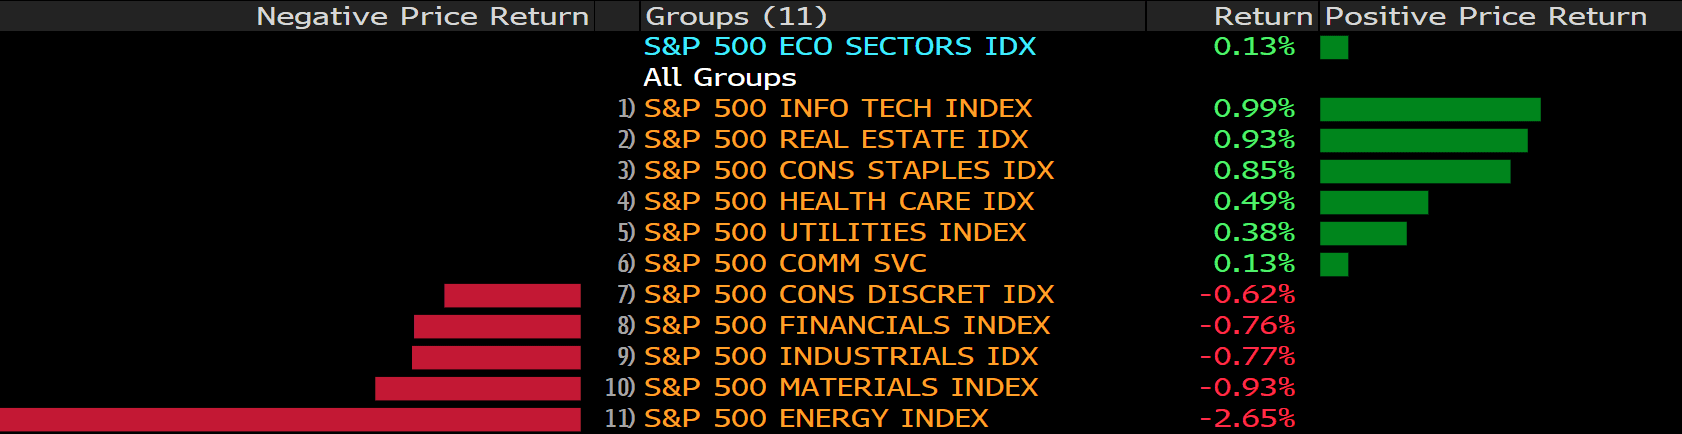
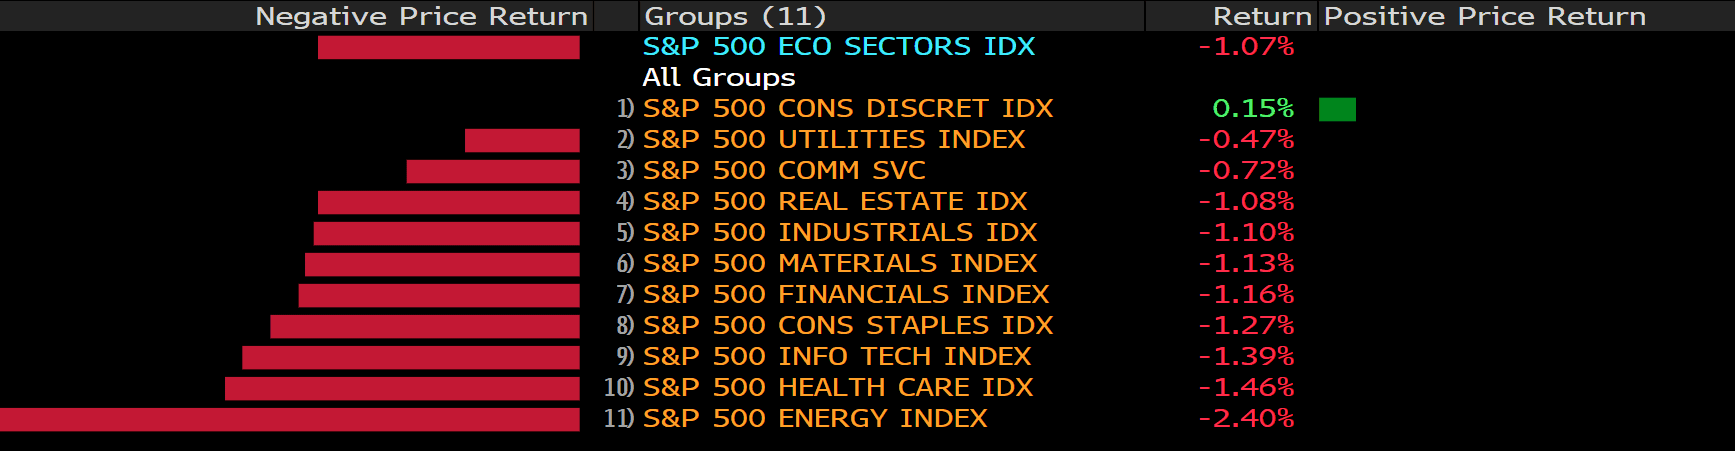
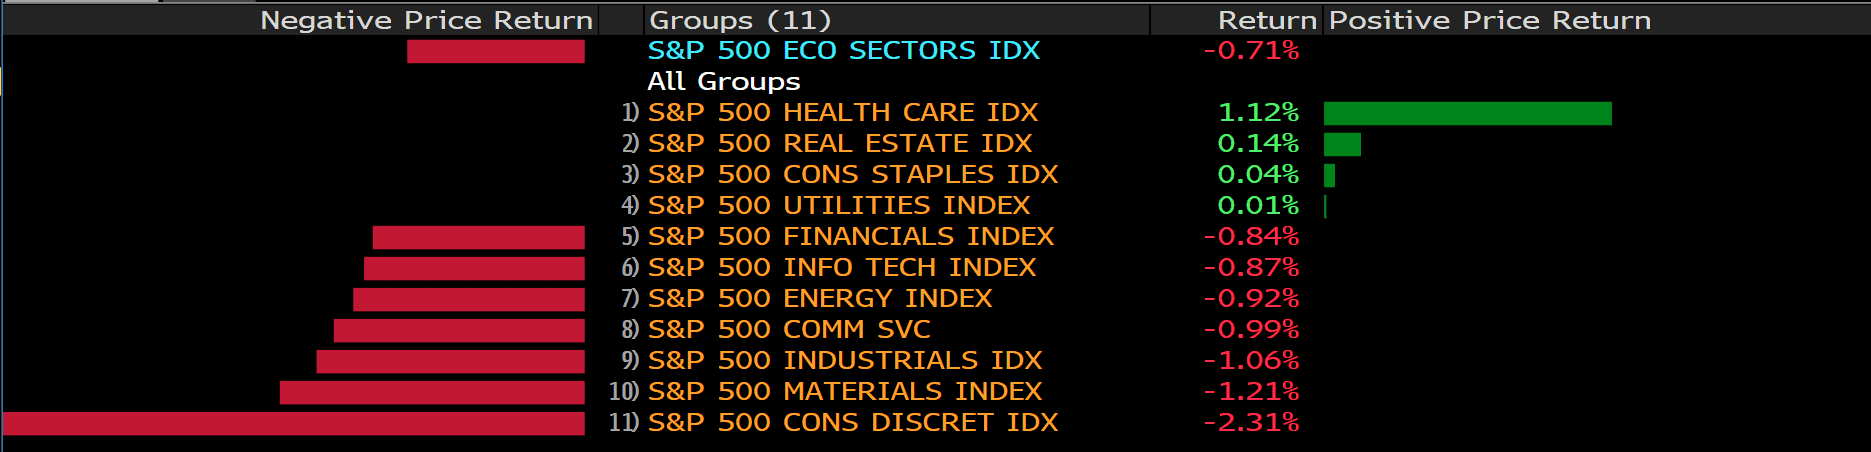
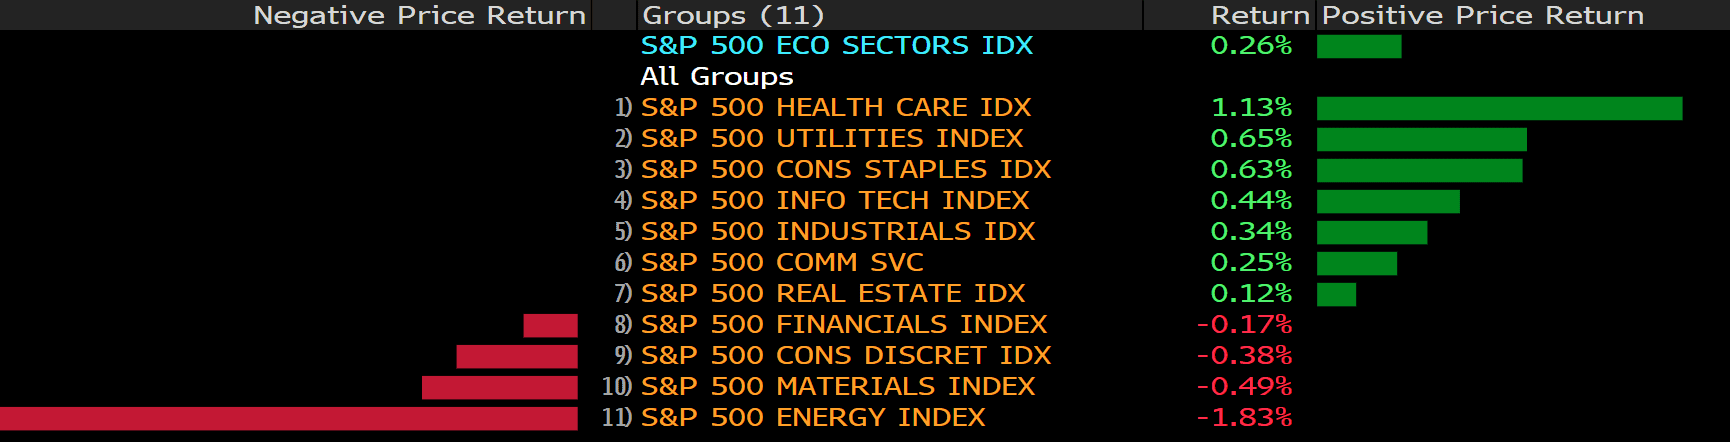
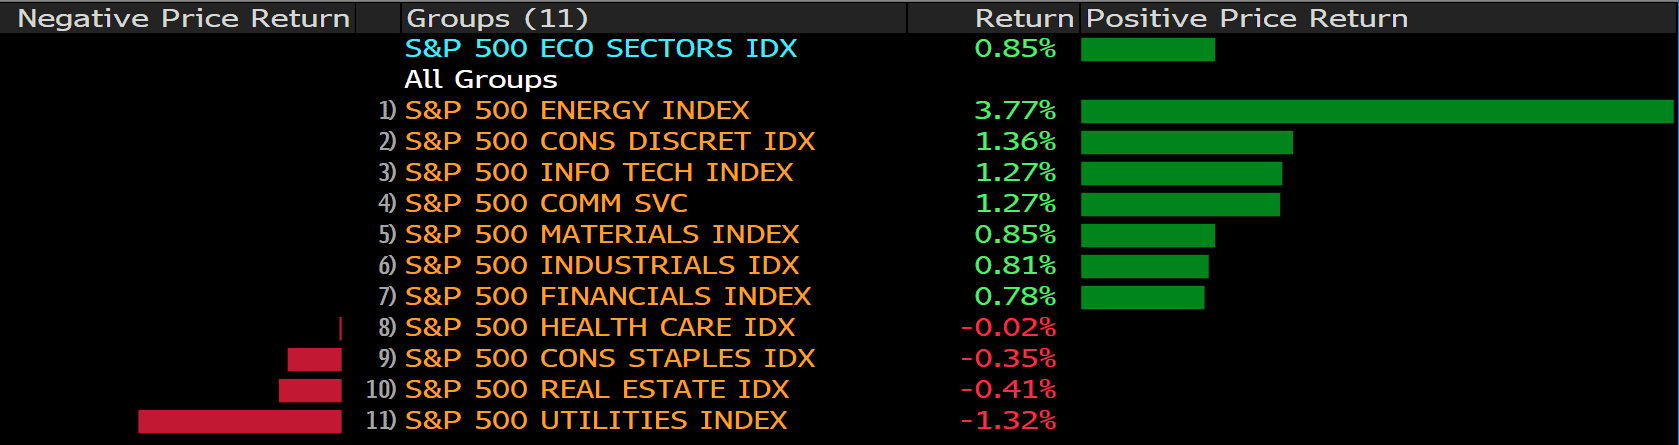
U.S. equities were higher on a quiet day of trading ahead of the Federal Reserve’s Jackson Hole symposium later this week. The S&P 500 and Nasdaq gained on Wednesday, with both indexes topping record highs. The financial and energy sectors led the gains as Treasury yields and crude oil advanced. Dow Jones gained as shares of American Express, JPMorgan Chase and Goldman Sachs outperformed.

A bout of frenzied buying from dip-hunting retail traders over the last couple of days has helped spur a rally in Chinese stocks listed in the U.S. after a prolonged selloff. Net purchases of Chinese technology shares in New York by retail investors in the past five trading sessions topped the $400 million mark, according to Vanda Research.
The bargain-hunting helped push the Nasdaq Golden Dragon China Index up more than 13% in the past four days, for its best run since late June when Beijing’s increased regulations on technology and education companies added pressure on the shares.
“Since the regulatory crackdown started, retail investors increased their buying on dips, providing liquidity to institutional investors who were exiting long positions,” Ben Onatibia, senior strategist at Vanda said in a note.
While retail traders have chased momentum in more speculative names, demand has generally faded for Chinese ADRs as soon as their prices begin rising, according to Vanda, which tracks retail flows in the U.S.
“Retail attitudes towards stocks or ETFs can change over time, but we think demand is more likely to dry up in the coming days,” Onatibia said.
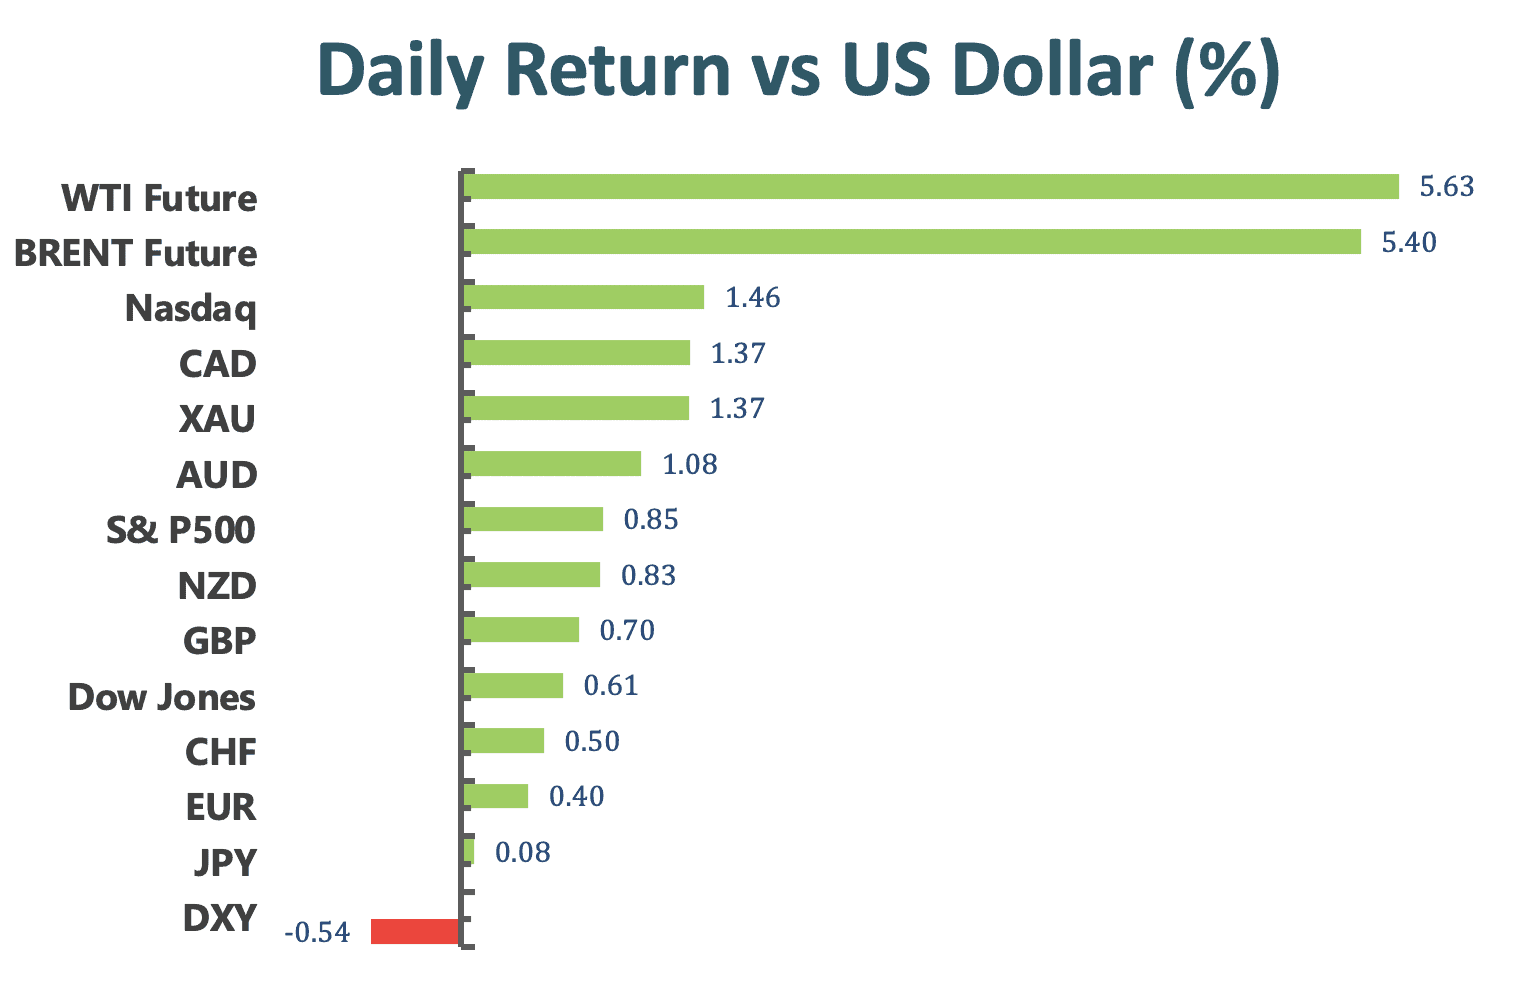
Main Pairs Movement:
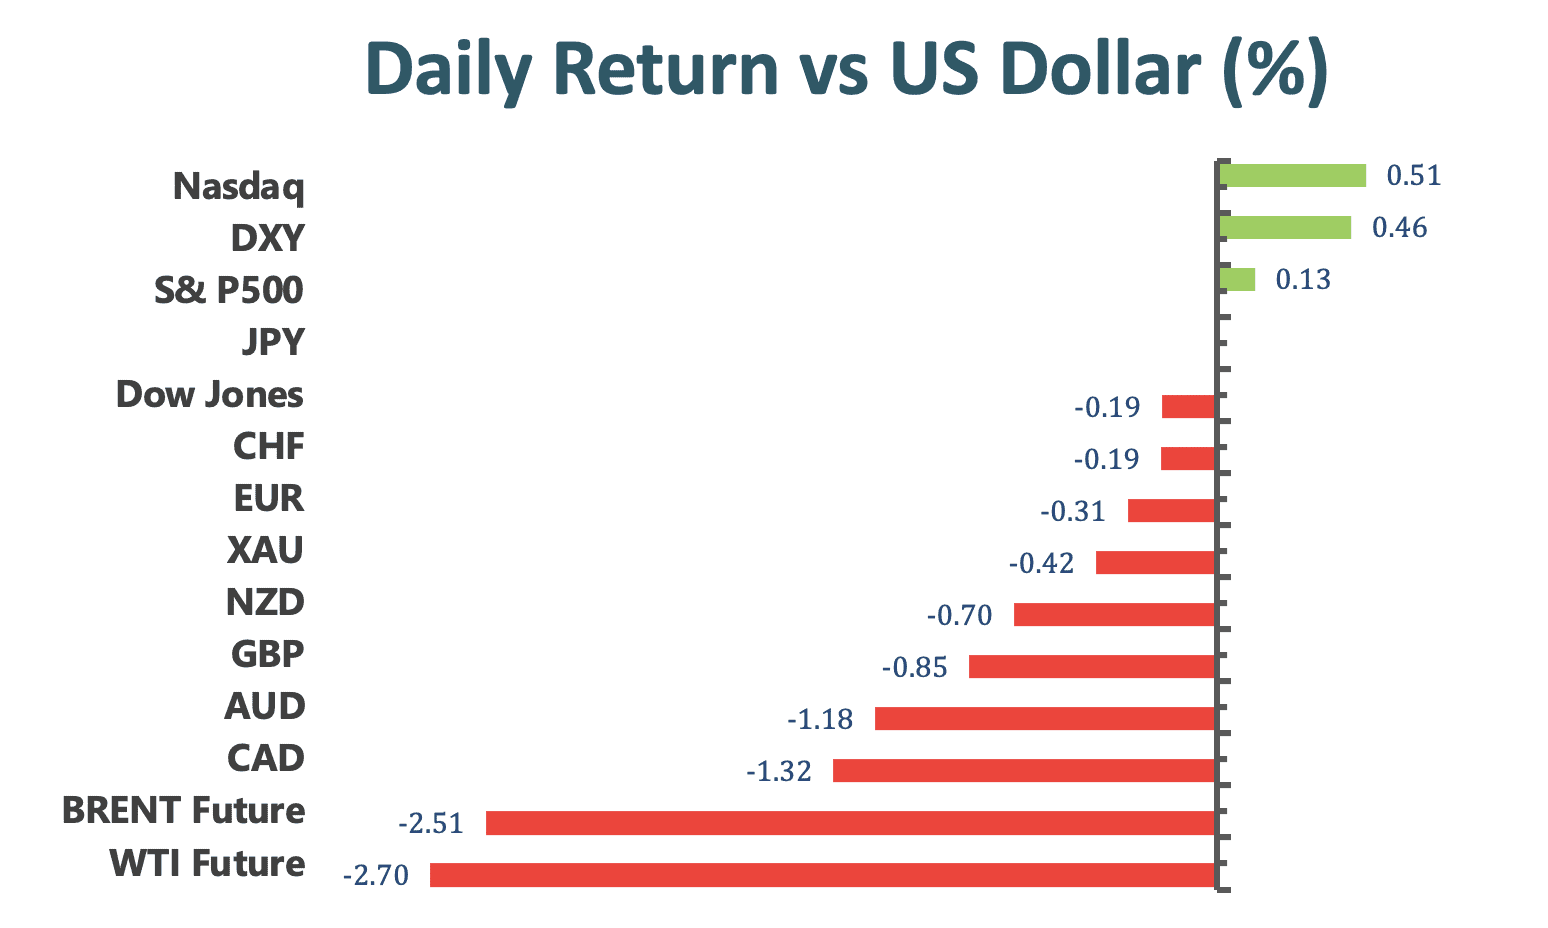
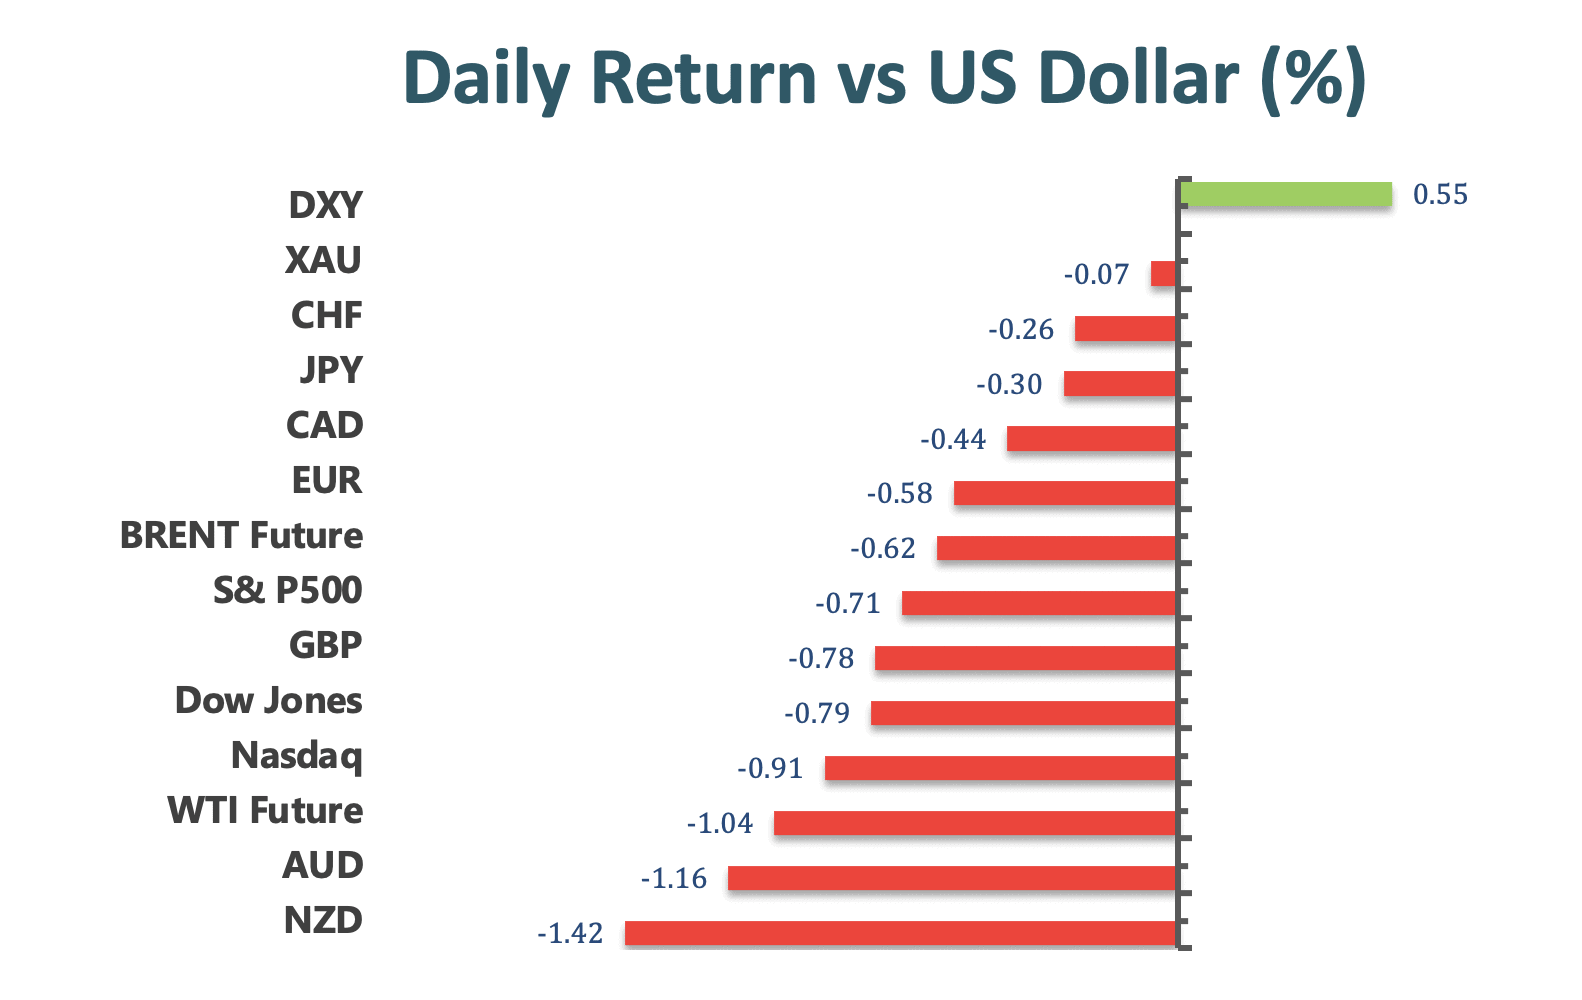
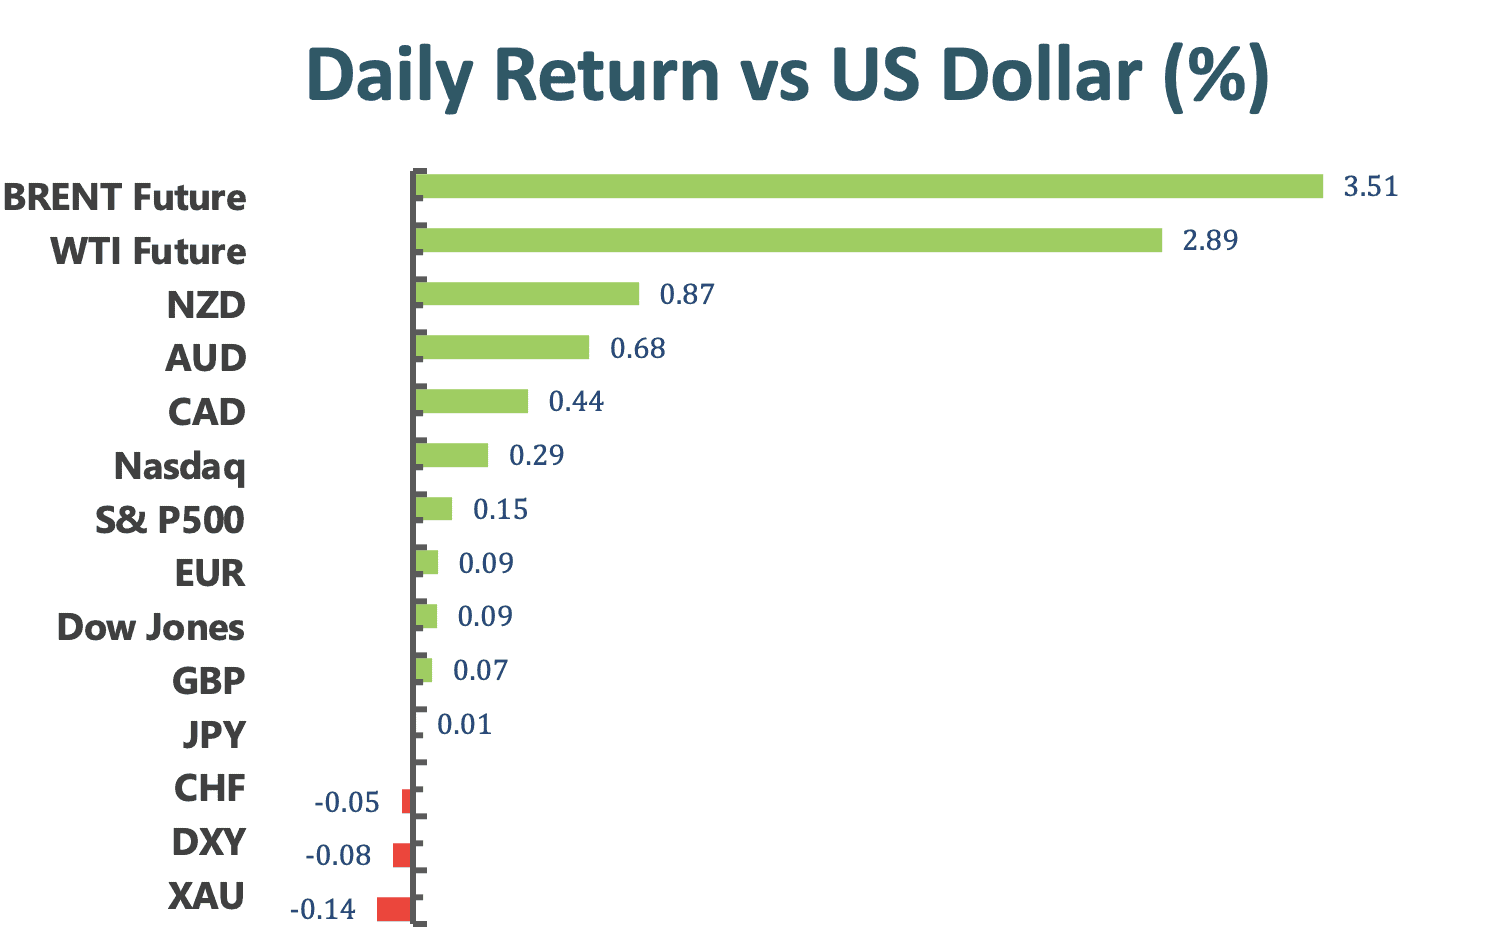
The US dollar was trading higher in early trade on Wednesday and reached a two-day high in the beginning of American session, given the fact that the US Durable Goods Orders delivered a better-than-expected reading. However, the greenback then lost its bullish momentum and dropped to its fresh daily low, losing 0.03% on the day as of writing. The dollar has fallen for the fourth consecutive day, including last Friday. As markets are now doubting that whether Fed Chairman Jerome Powell will mention about taper plan during his speech at the upcoming Jackson Hole Symposium.
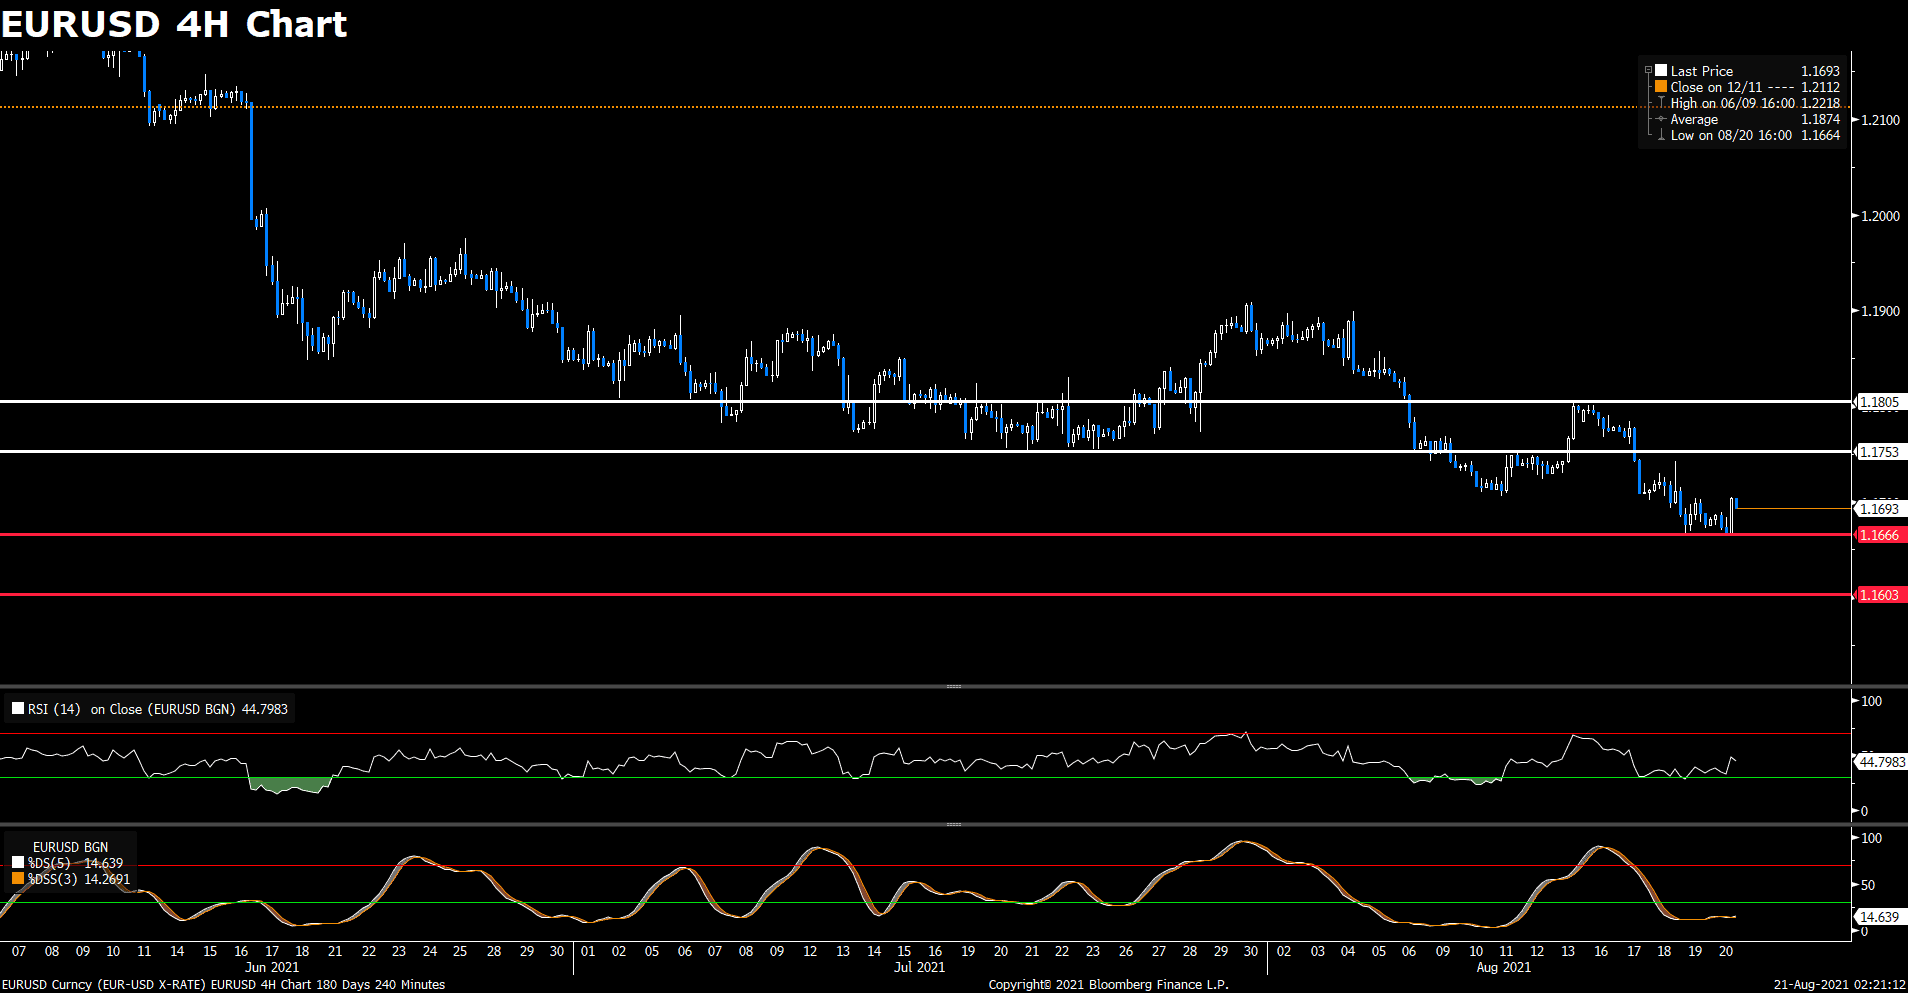
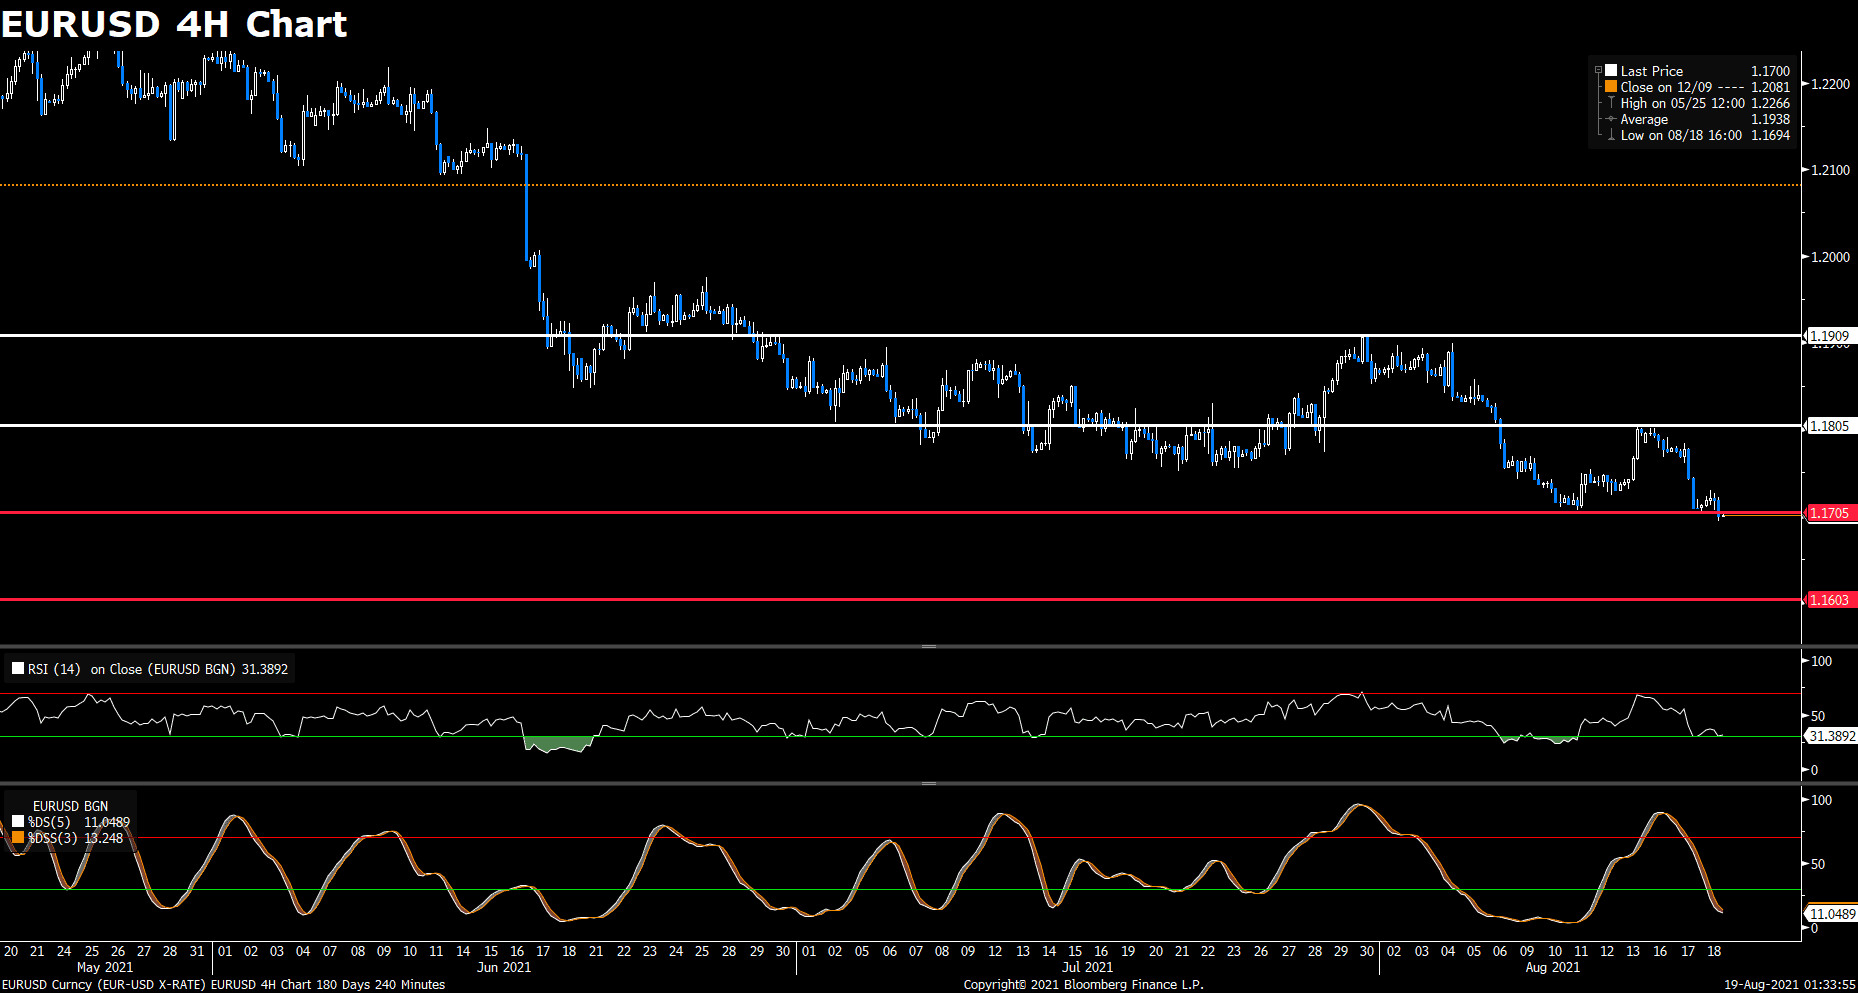
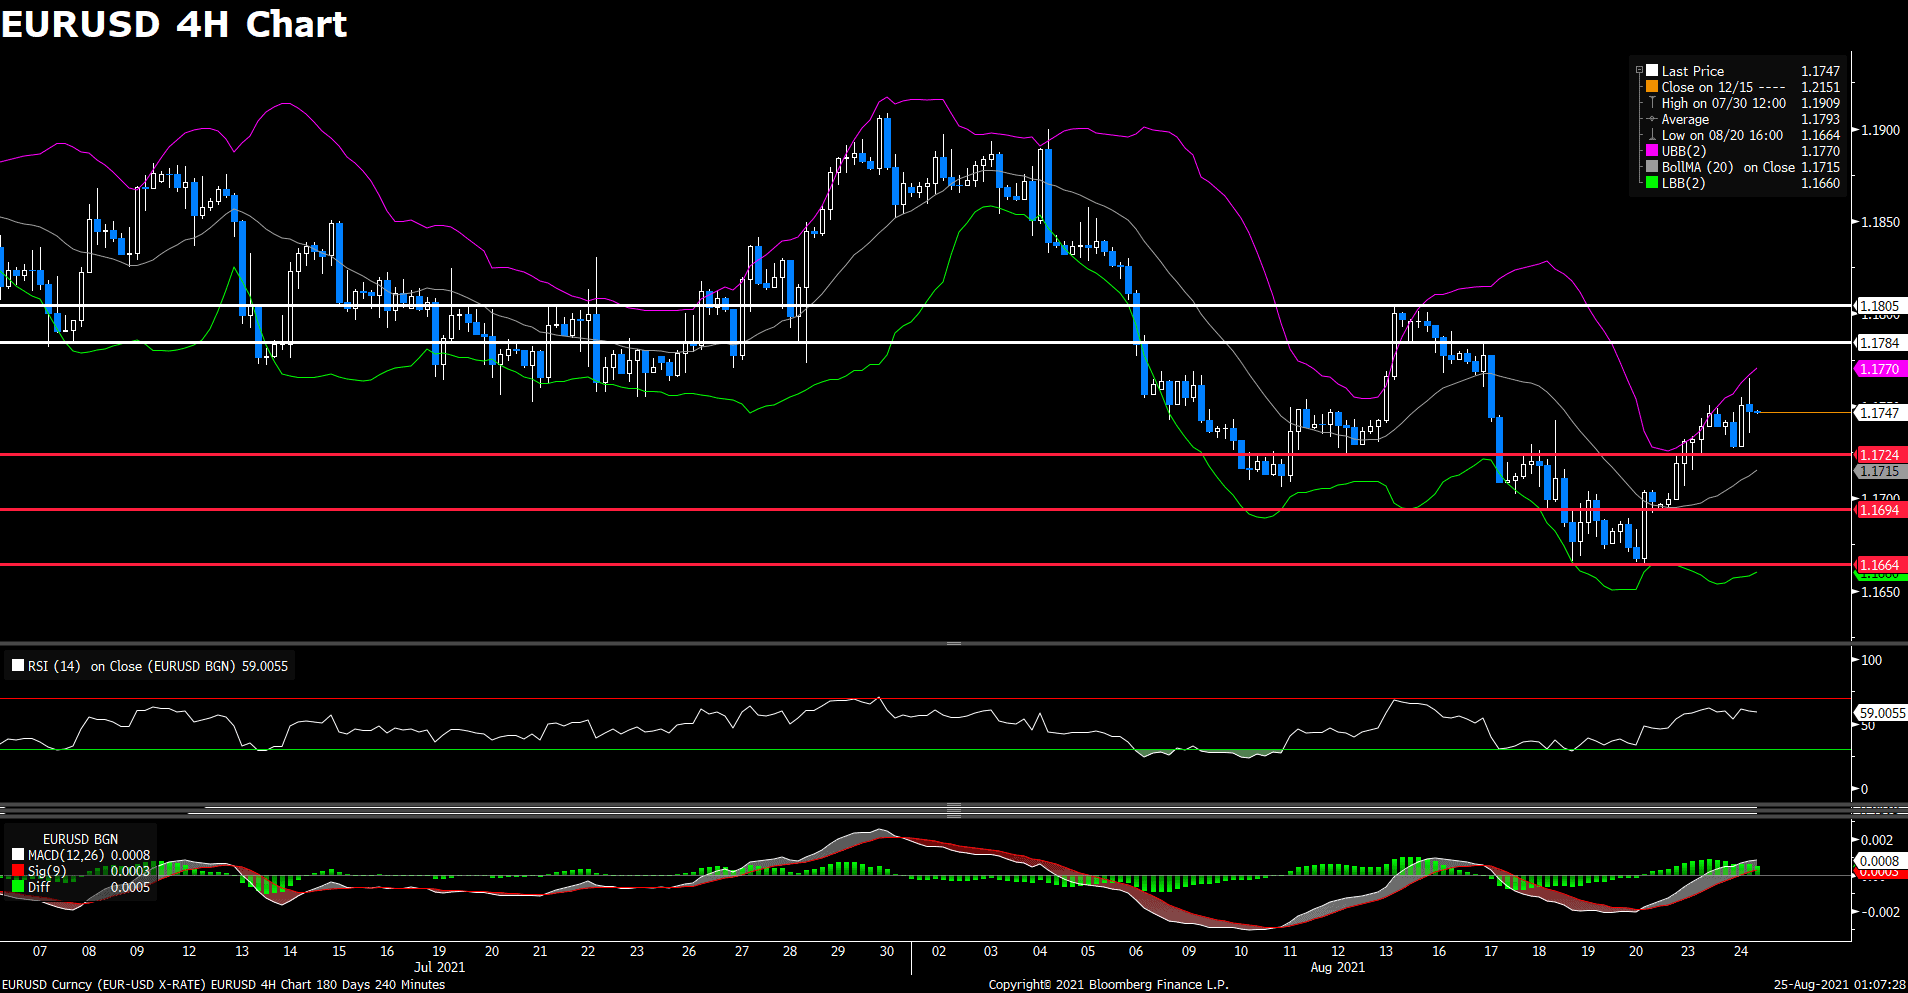
GBP/USD and EUR/USD both posted a gain on Wednesday, trading at 1.3759 and 1.1768, respectively. GBP/USD recorded a fresh weekly high then retreated modestly back towards 1.3760 level during American session. EUR/USD rebounded back after dropping to a two-day low, rising 0.14% on a daily basis. In addition, the European Central Bank (ECB) will release the Monetary Policy Meeting Accounts on Thursday.
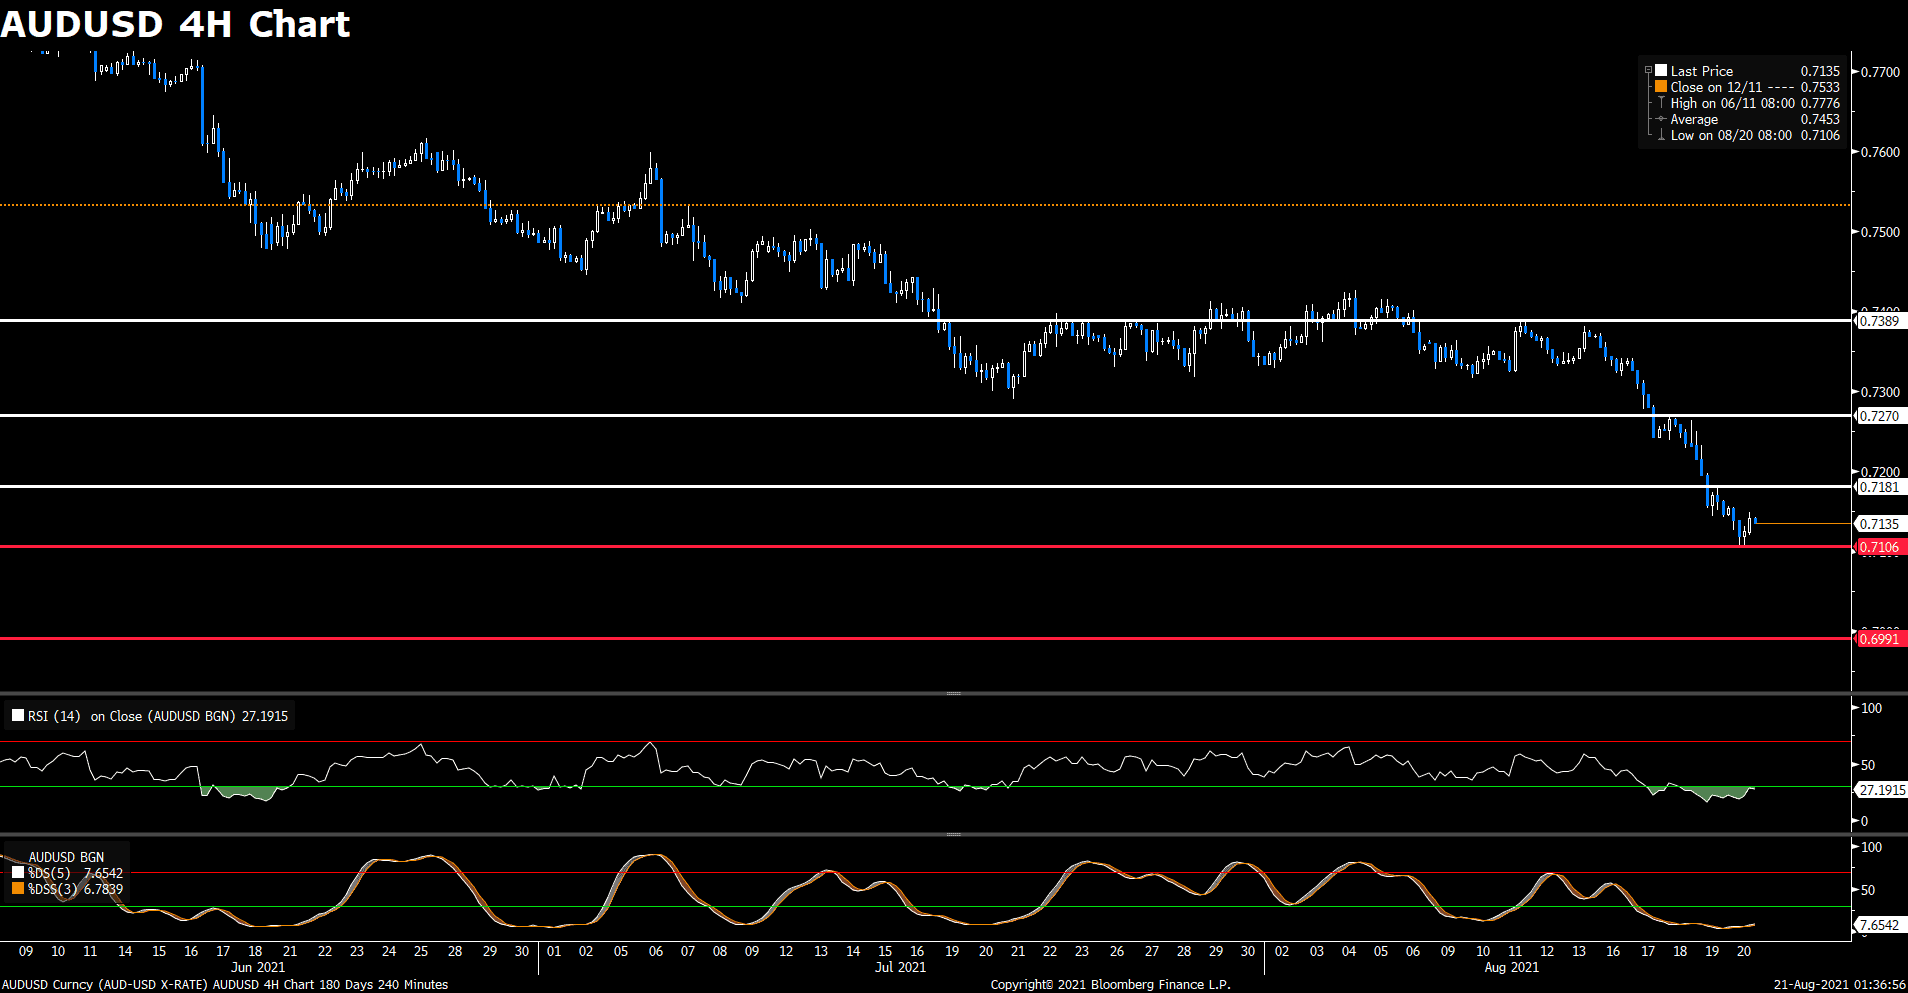
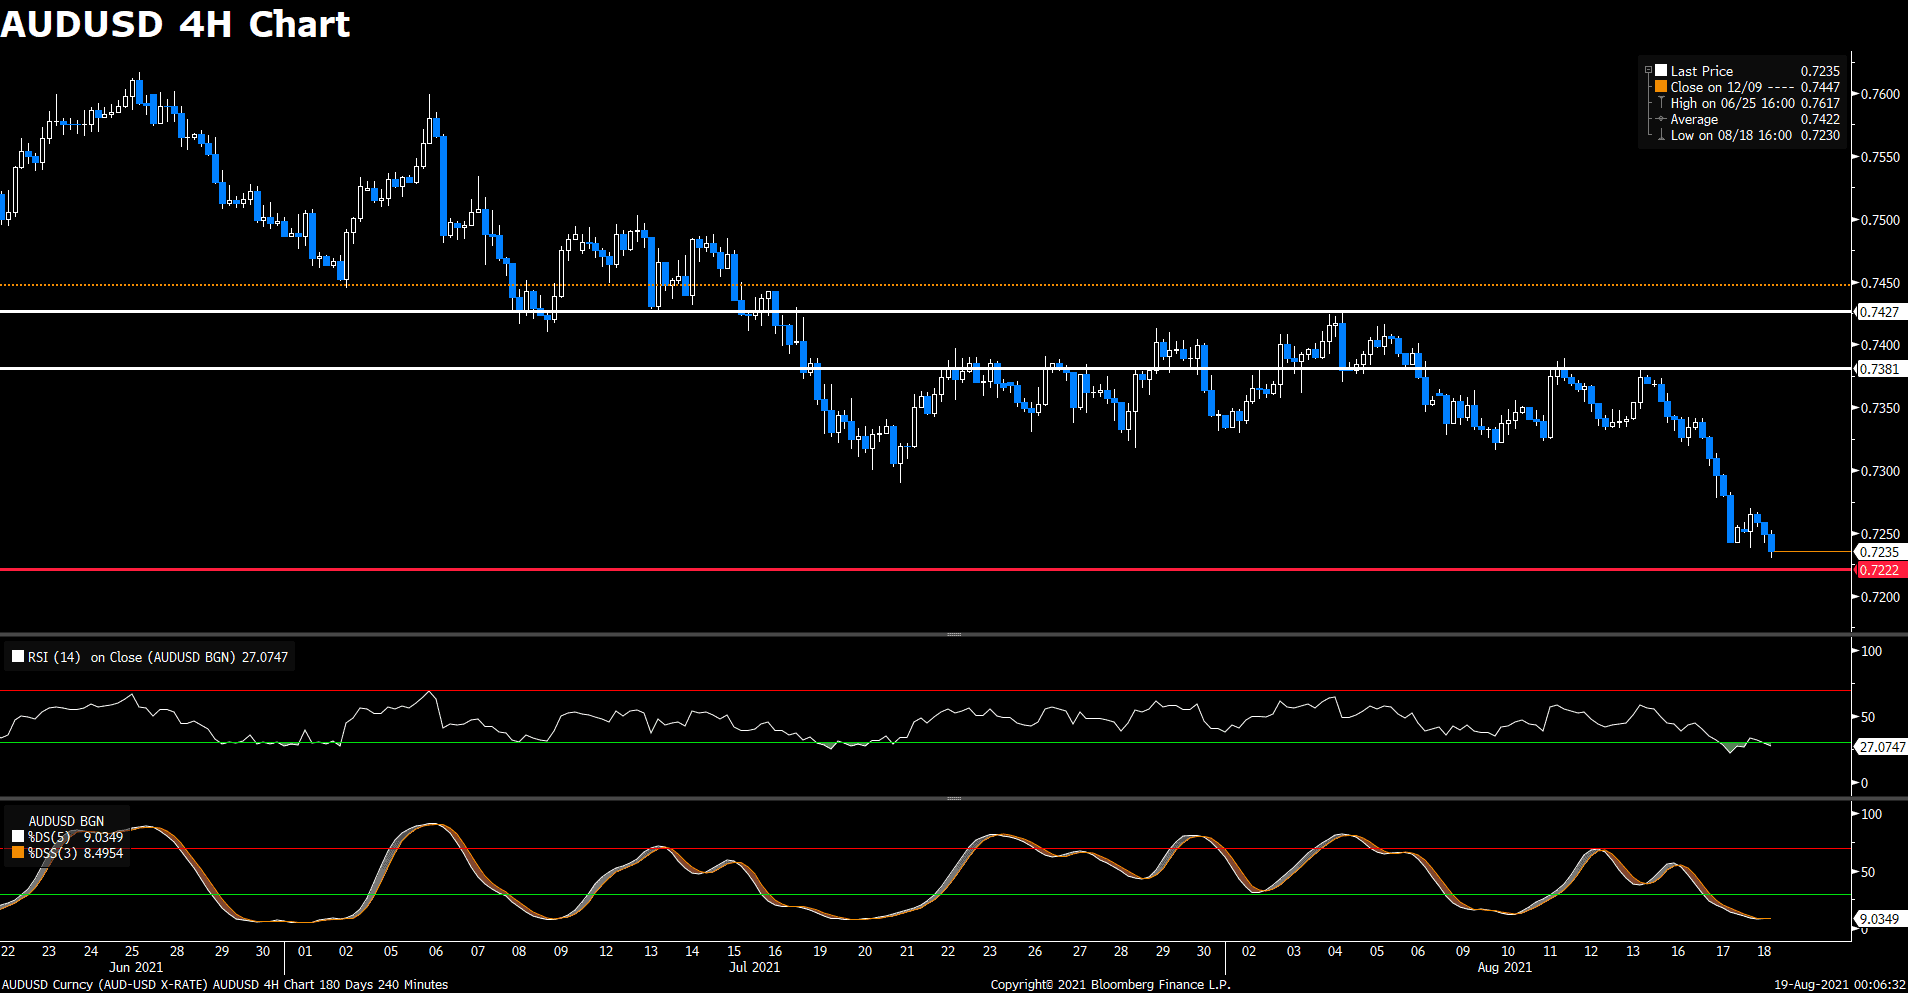
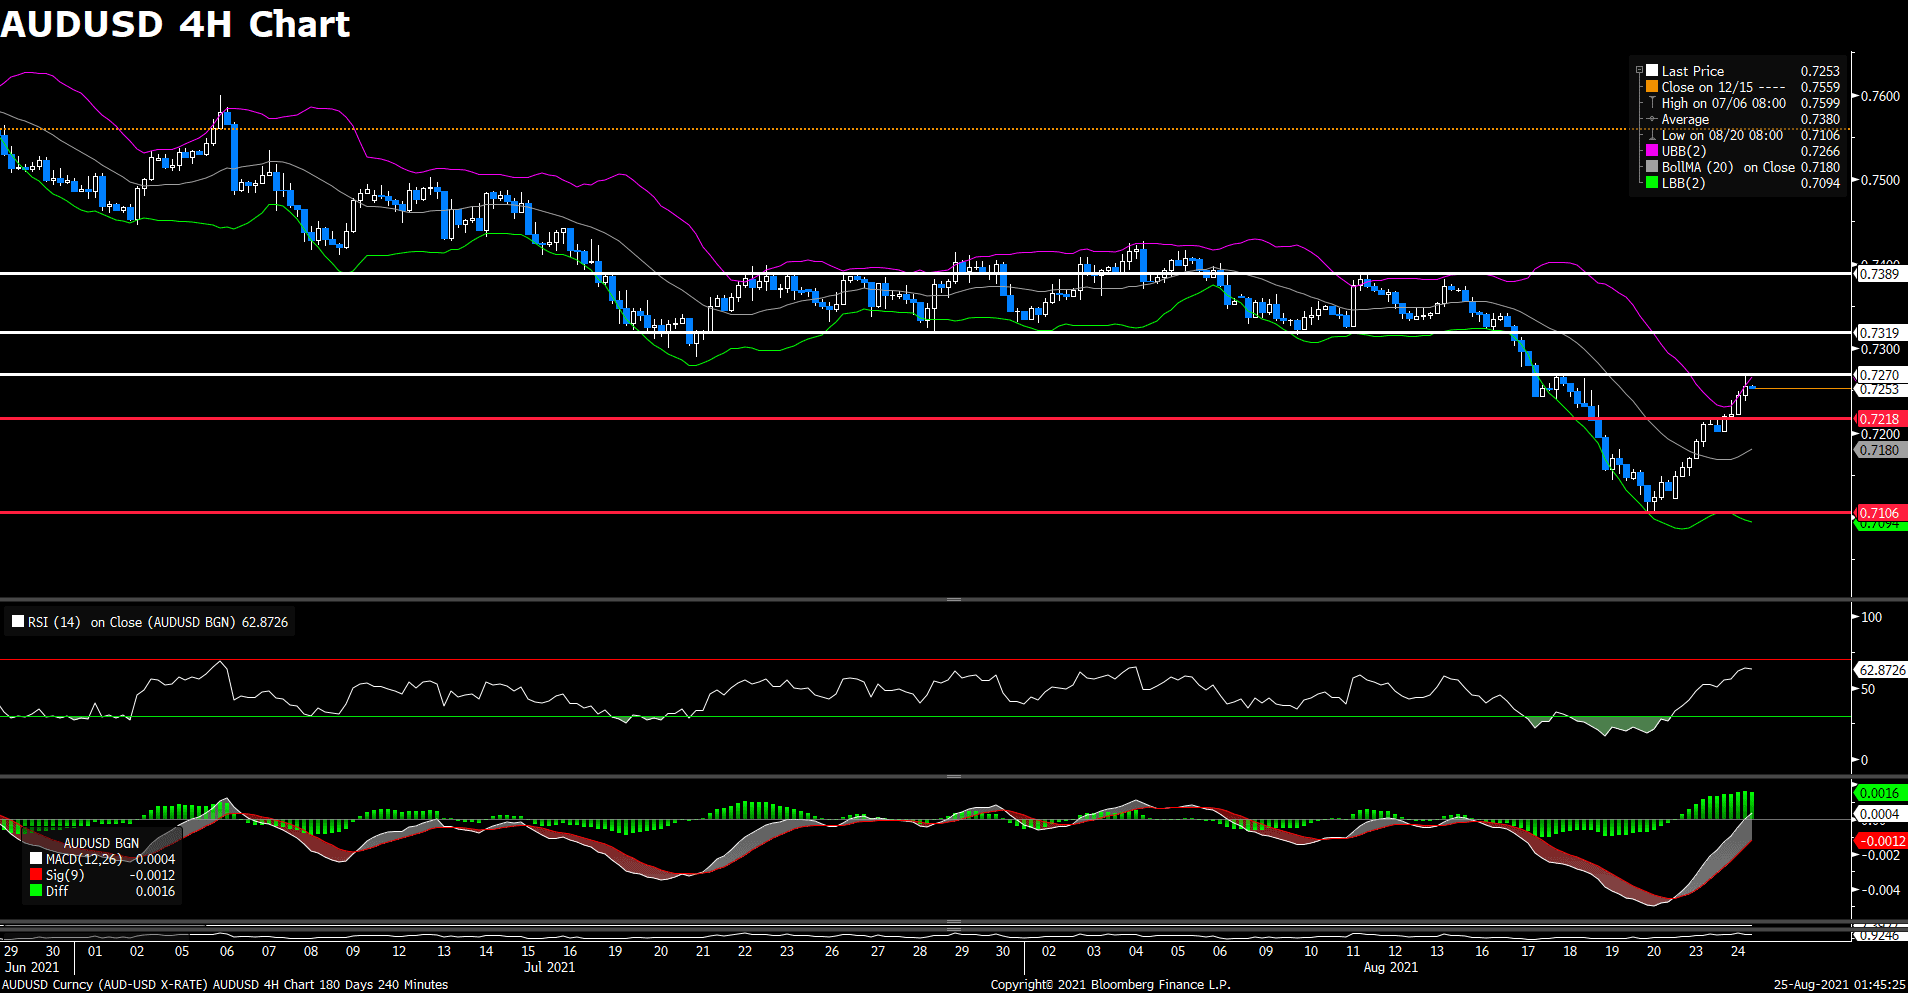
USD/JPY touched a two-day high in the middle of the American session, then pulled back to 110.00 at the time of writing. The pair is rising 0.35% on the day. AUD/USD also advanced on Wednesday, posting a 0.26% gain.
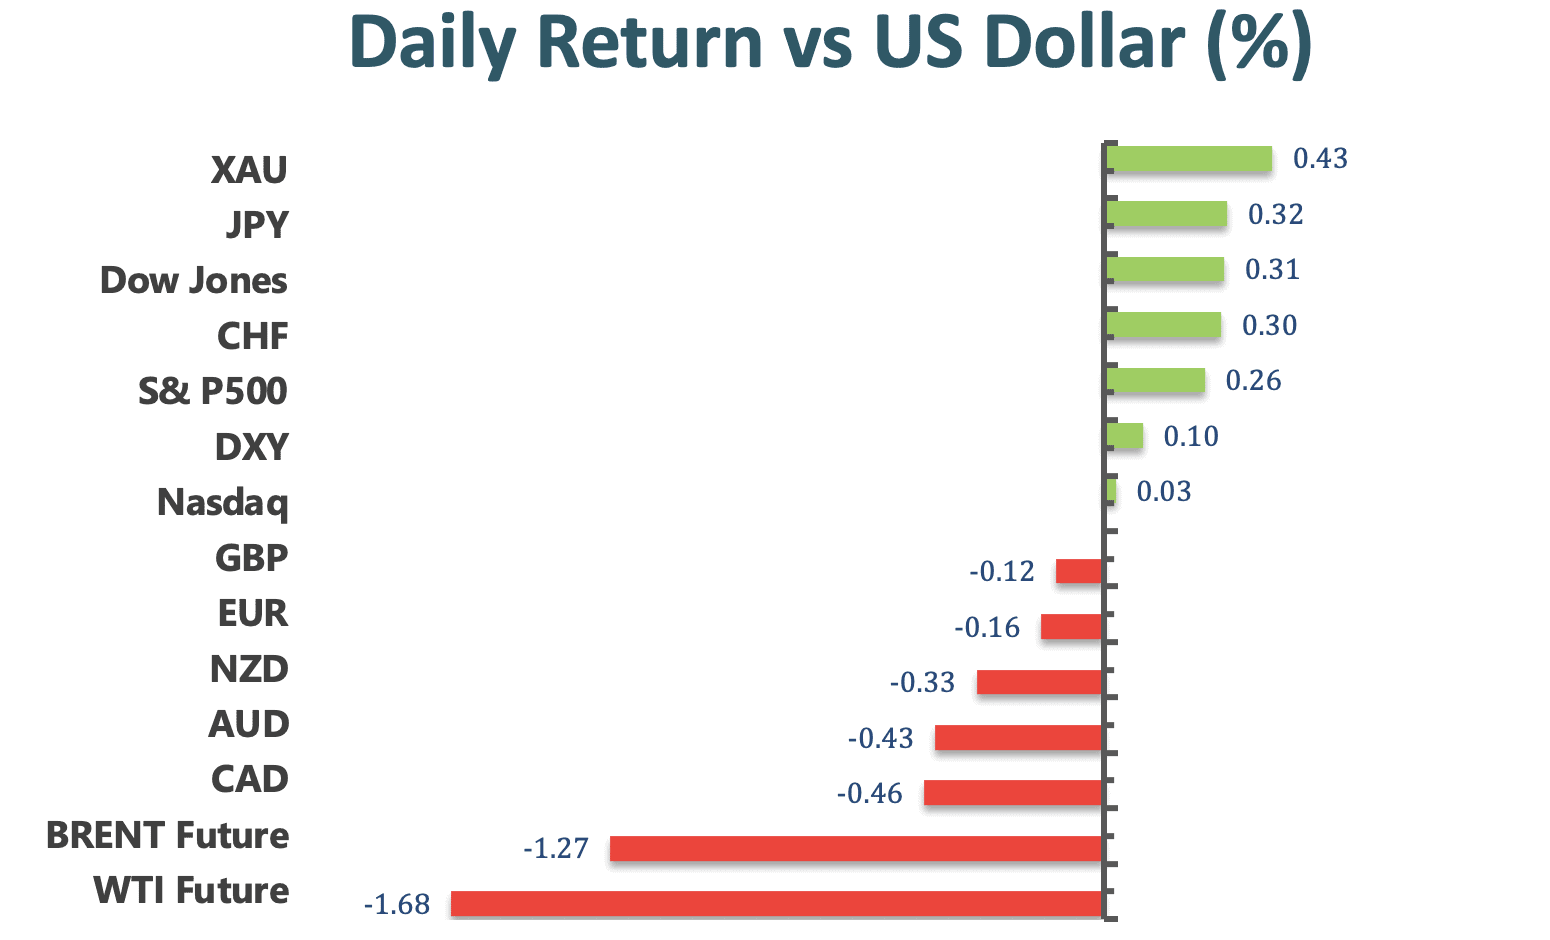
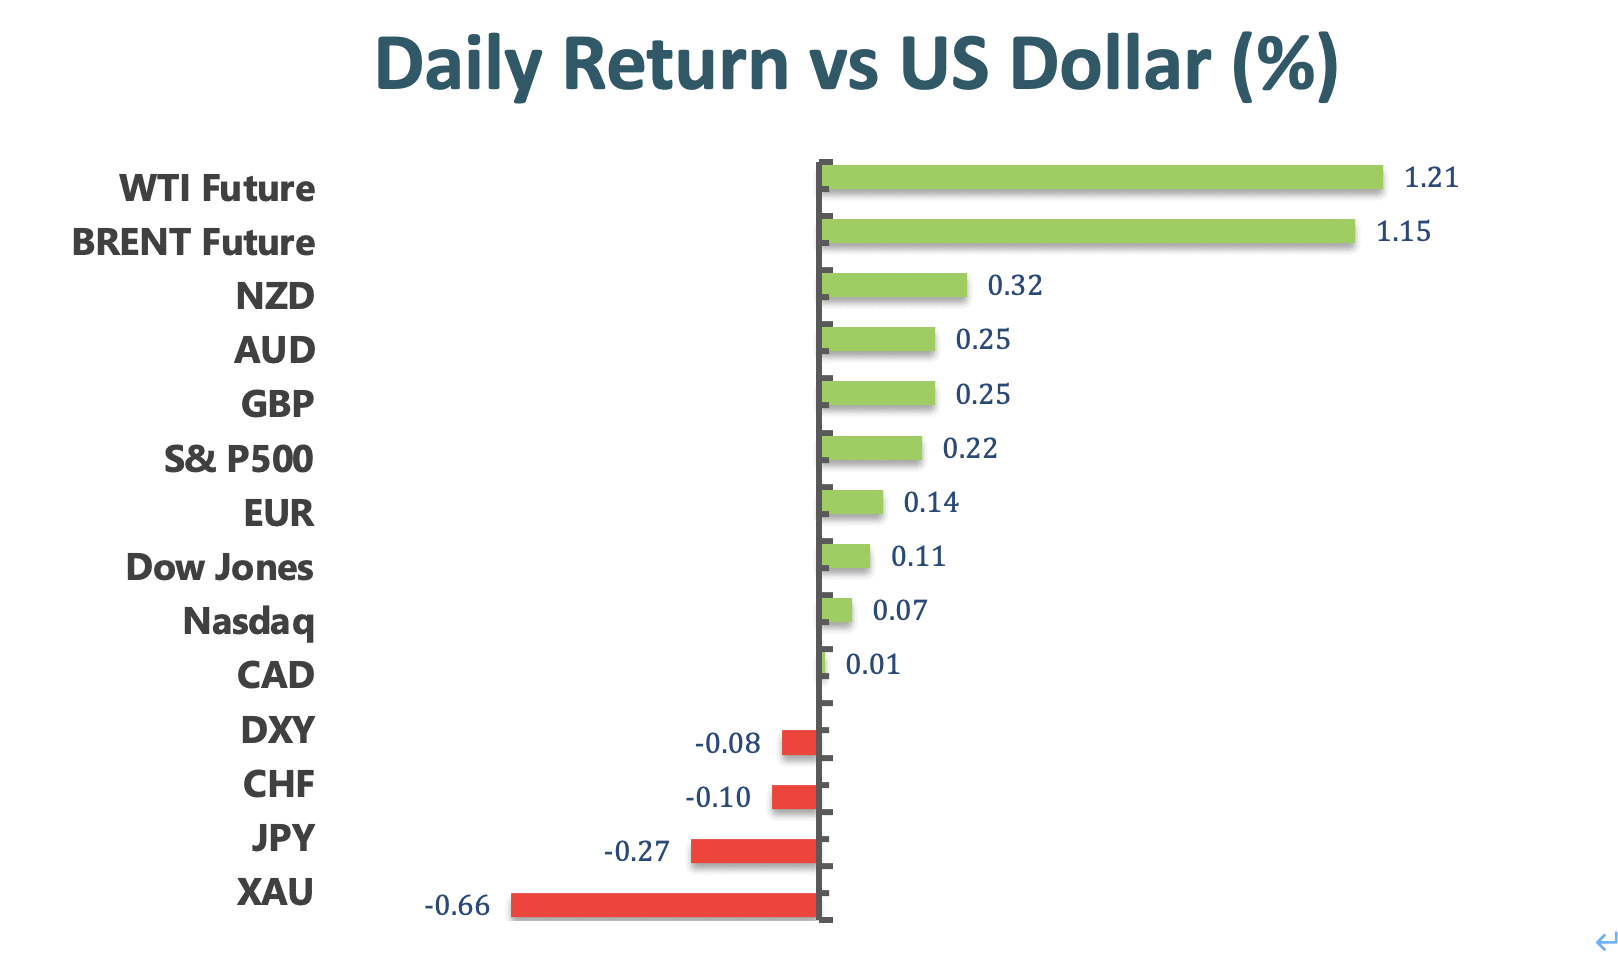
Gold declined on Wednesday, keeping its bearish momentum that started from yesterday. Gold prices dipped lower during American session, trading at 1790.25 with a total 0.66% losses on a daily basis. WTI Crude Oil, on the contrary, continued its rally from Monday and posted a 3.32% gain on the day.
Technical Analysis:
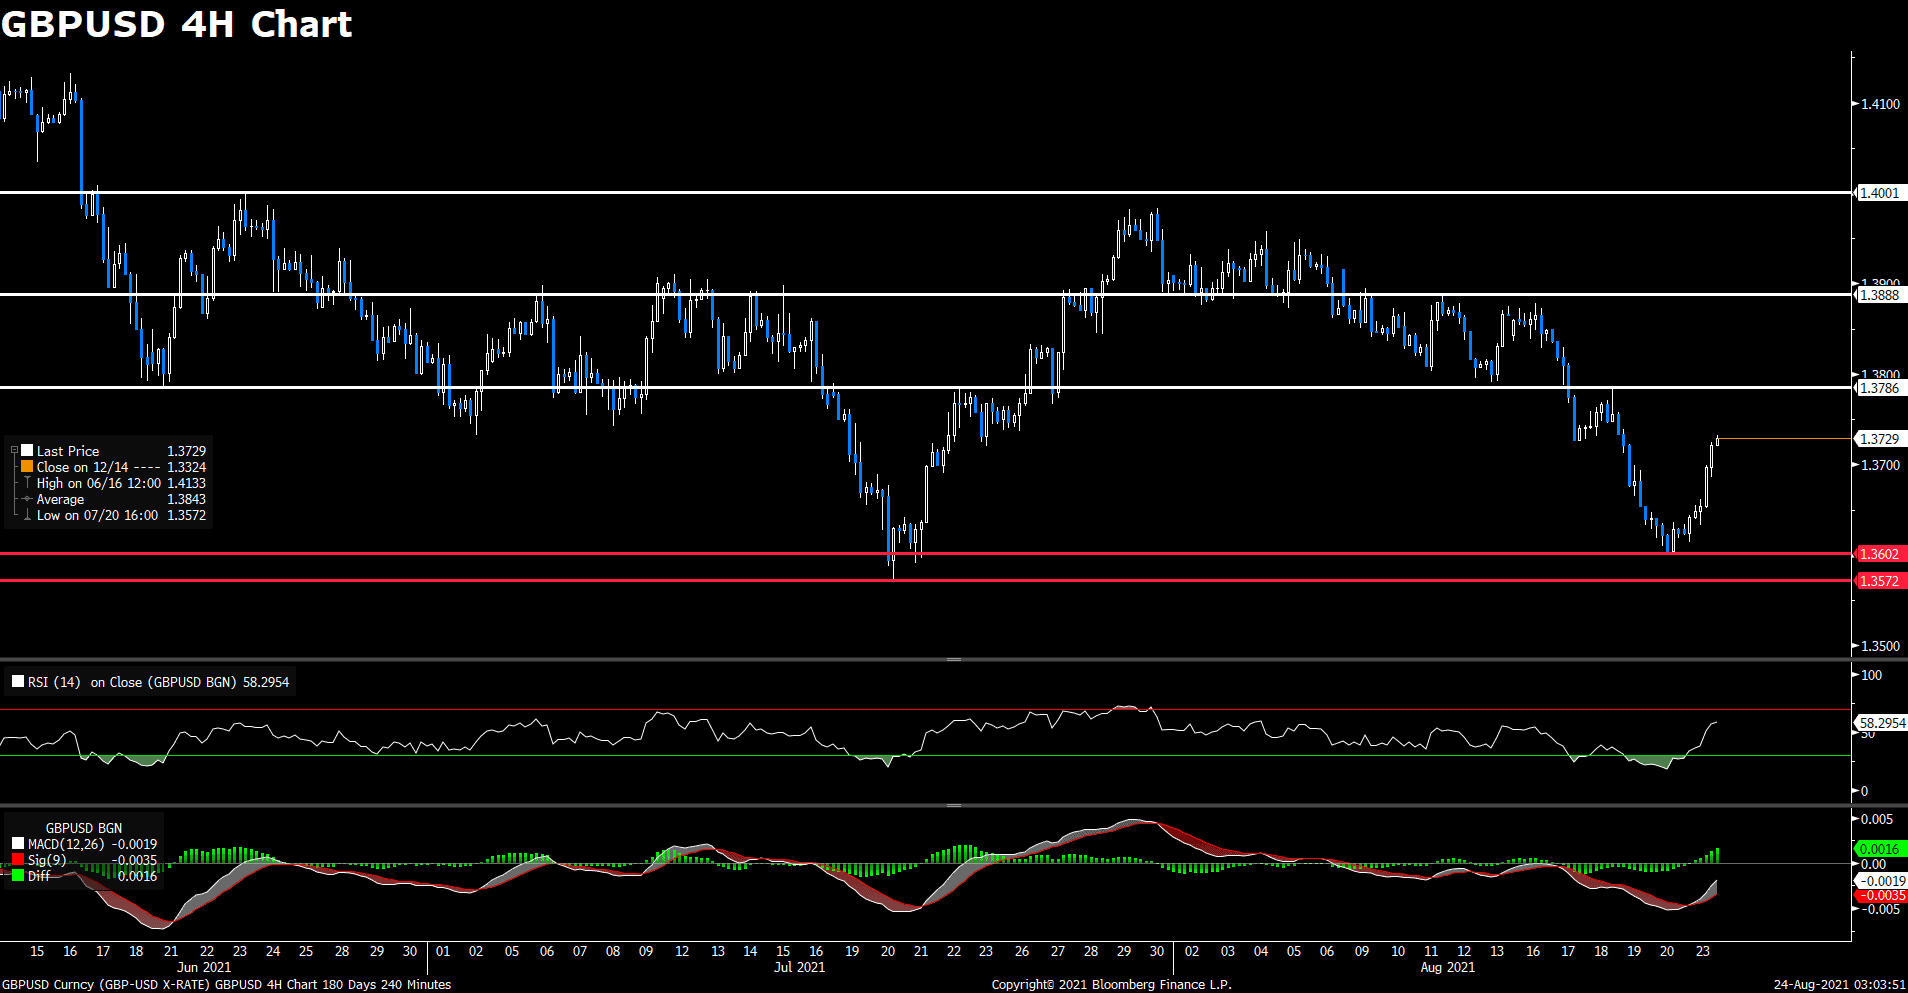
GBPUSD (4-hour Chart)

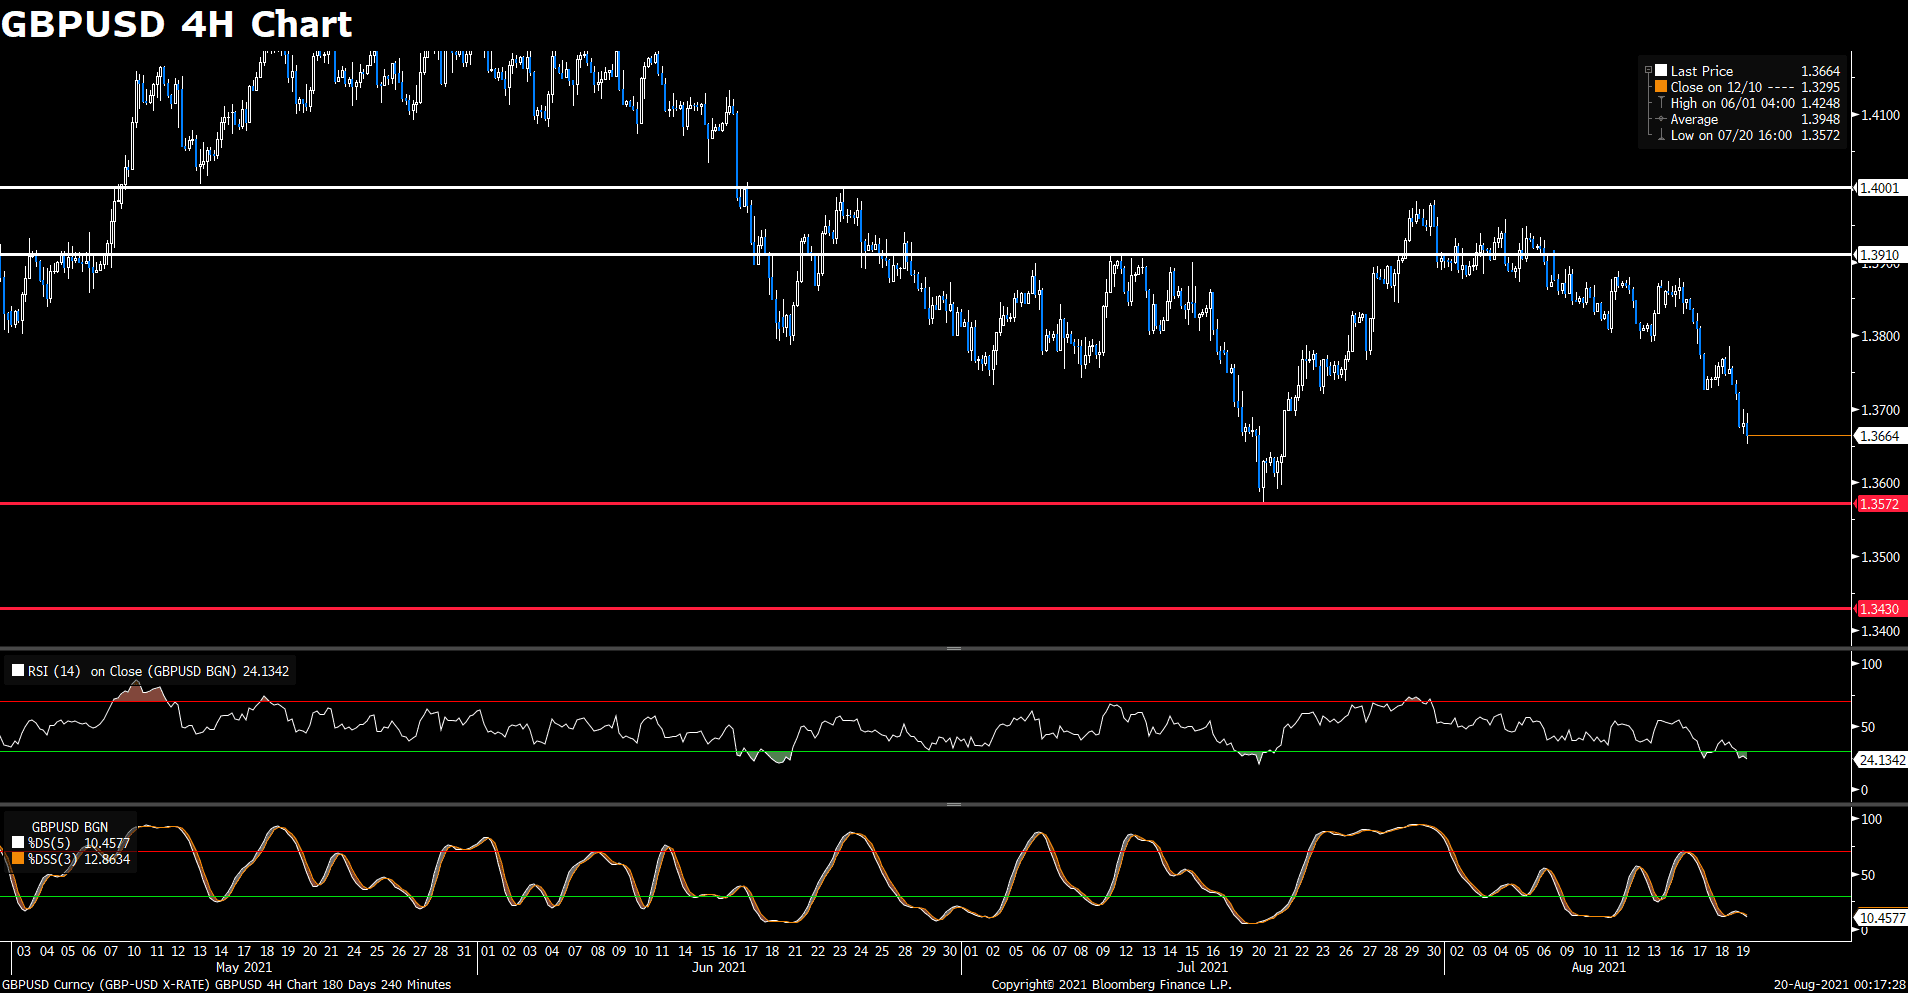
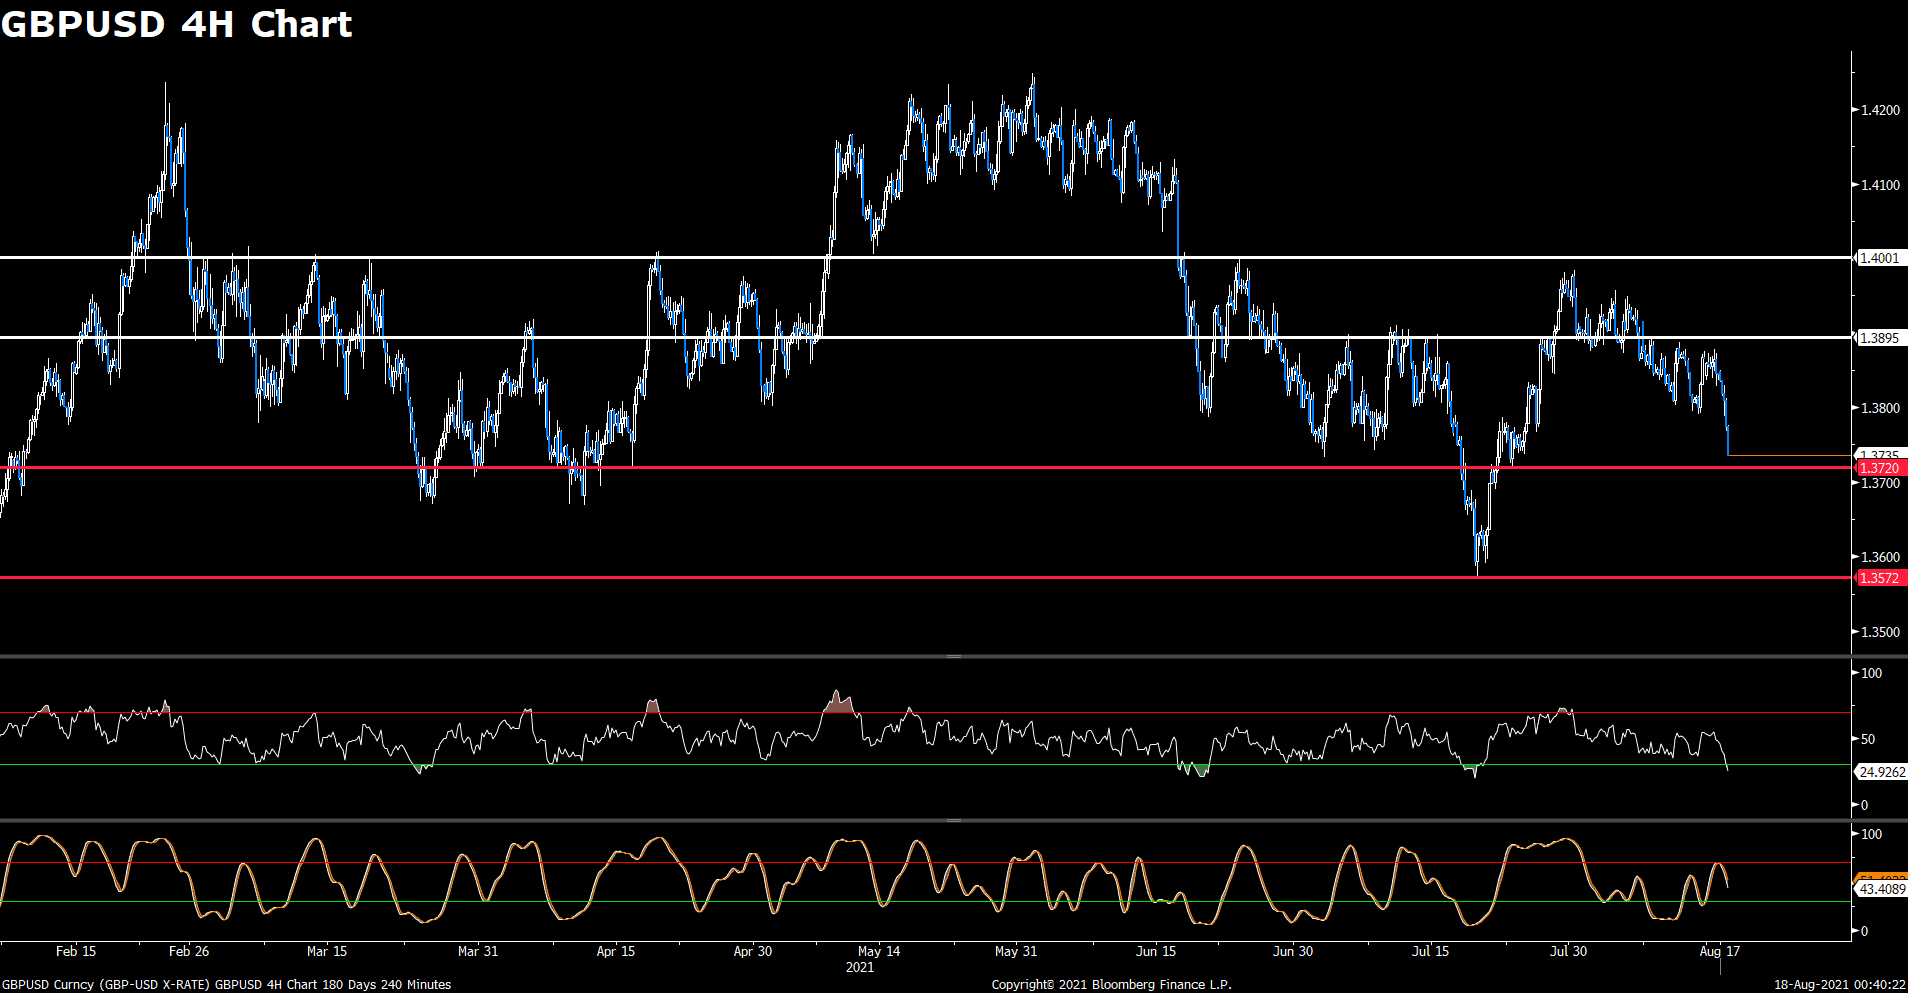
The GBP/USD pair dropped to daily low at the beginning of American session, for a time trading under 1.3700 level. The pair then rebounded back strongly towards 1.3750, now trading at 1.3759 at the time of writing with a total 0.22% gain on the day. The cable looks for extending its bullish momentum as US dollar starting to slip in the second half of the day. For technical aspect, RSI indicator 62 figures as of writing, suggesting bull-movement ahead. If we take a look at MACD indicator, a positive MACD histogram shows that the market is bullish. For Bollinger Bands, the price is now trading near the upper band, which also indicates a bull market.
In conclusion, we think market will be bullish as the pair heading to test the 1.3769 resistance line. If the price breaks above that level, it will open the door for additional near-term profits. And the next resistance is at 1.3867. With no important UK economic data scheduled to be released this week, investors now wait for Fed Chairman Jerome Powell’s speech at the Jackson Hole Symposium.
Resistance: 1.3769, 1.3867
Support: 1.3681, 1.3604
USDJPY (4- Hour Chart)

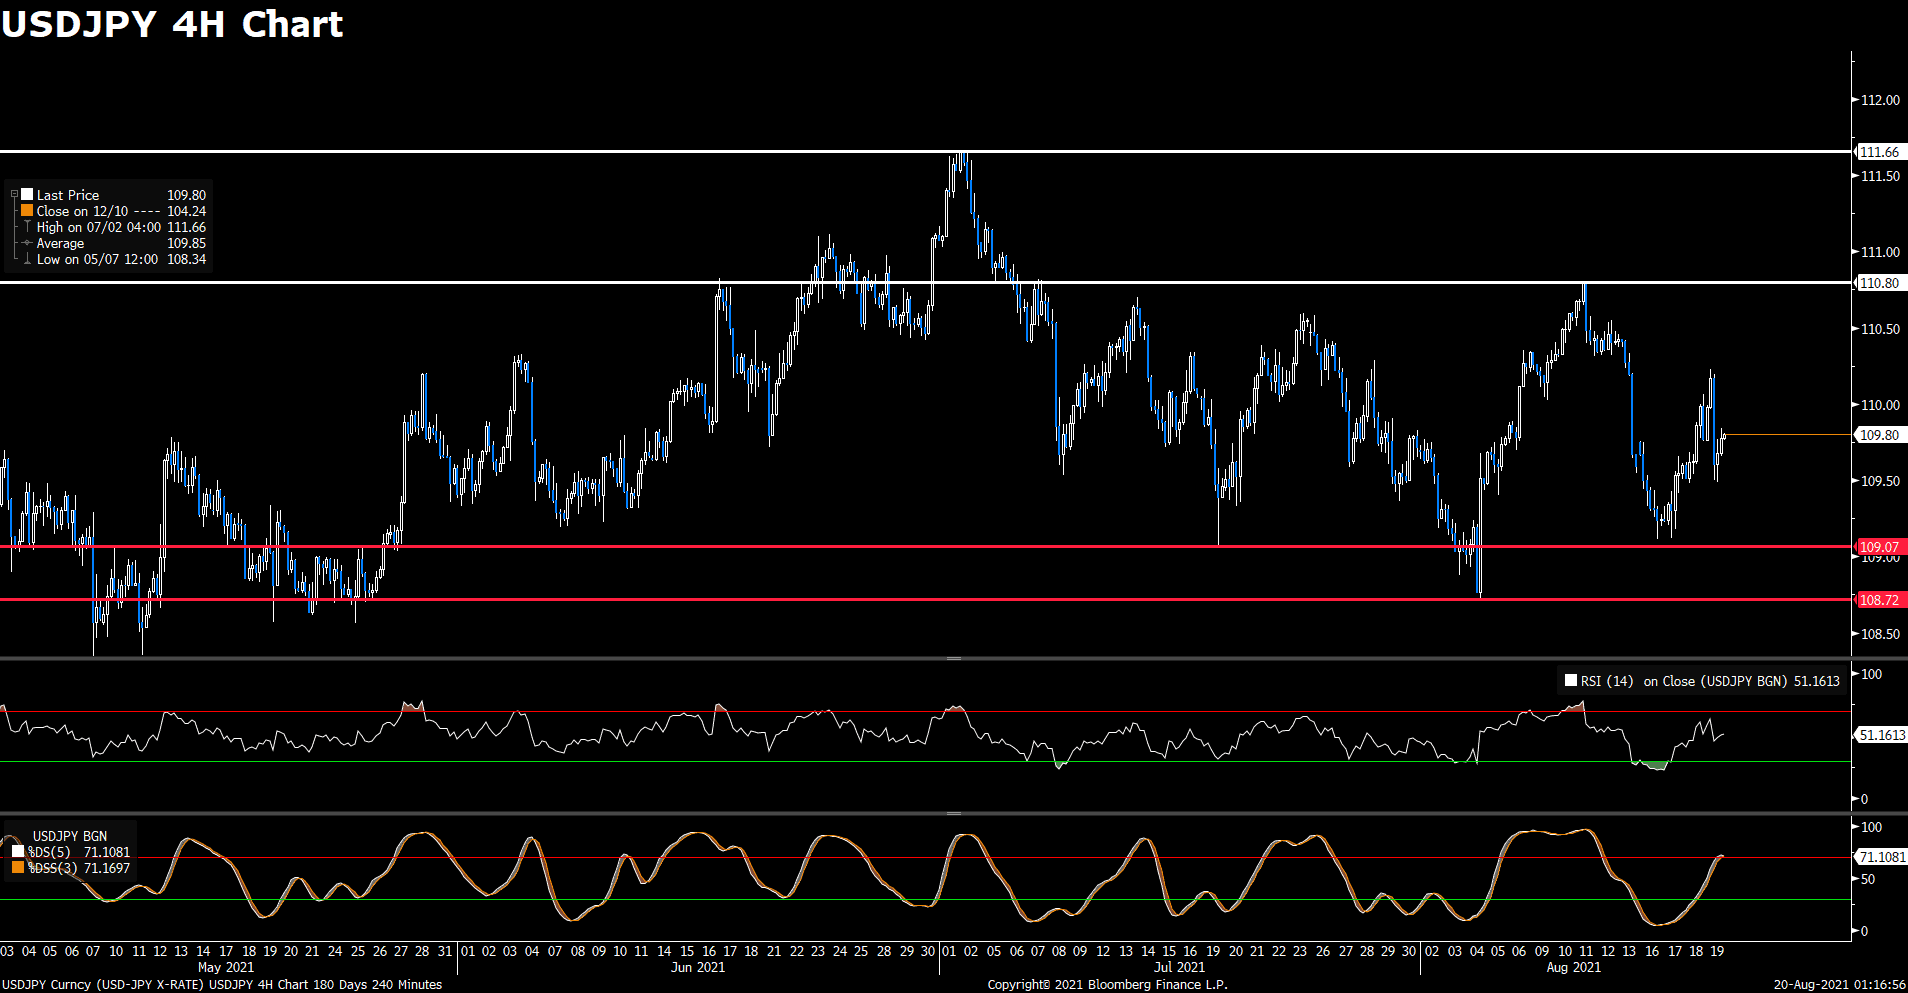
The USD/JPY pair surged on Wednesday, climbing to fresh daily high during American session and aiming to break above the 110.12 level. The pair is now trading at 110.10 as of writing, rising 0.44% on a daily basis at the time of writing. USD/JPY seems to be benefited greatly from the rising US Treasury bond yields as the pair continues to edge higher. For technical aspect, RSI indicator 61 figures as of writing, which means the market is near the overbought zone, and the buying pressure is relatively stronger. If we take a look at MACD indicator, a positive MACD histogram indicates that the market is bullish.
In conclusion, we think market will be bullish as the Bollinger Bands shows that the price moves out of the upper band, which means a strong upward trend continuation can be expected. The next resistance is at 110.23. In addition to that, the US Initial Jobless Claims will be released on Thursday, a lower-than-expected reading should be taken as positive for the US dollar.
Resistance: 110.23, 110.55
Support: 109.51, 109.09, 108.72
XAUUSD (4- Hour Chart)

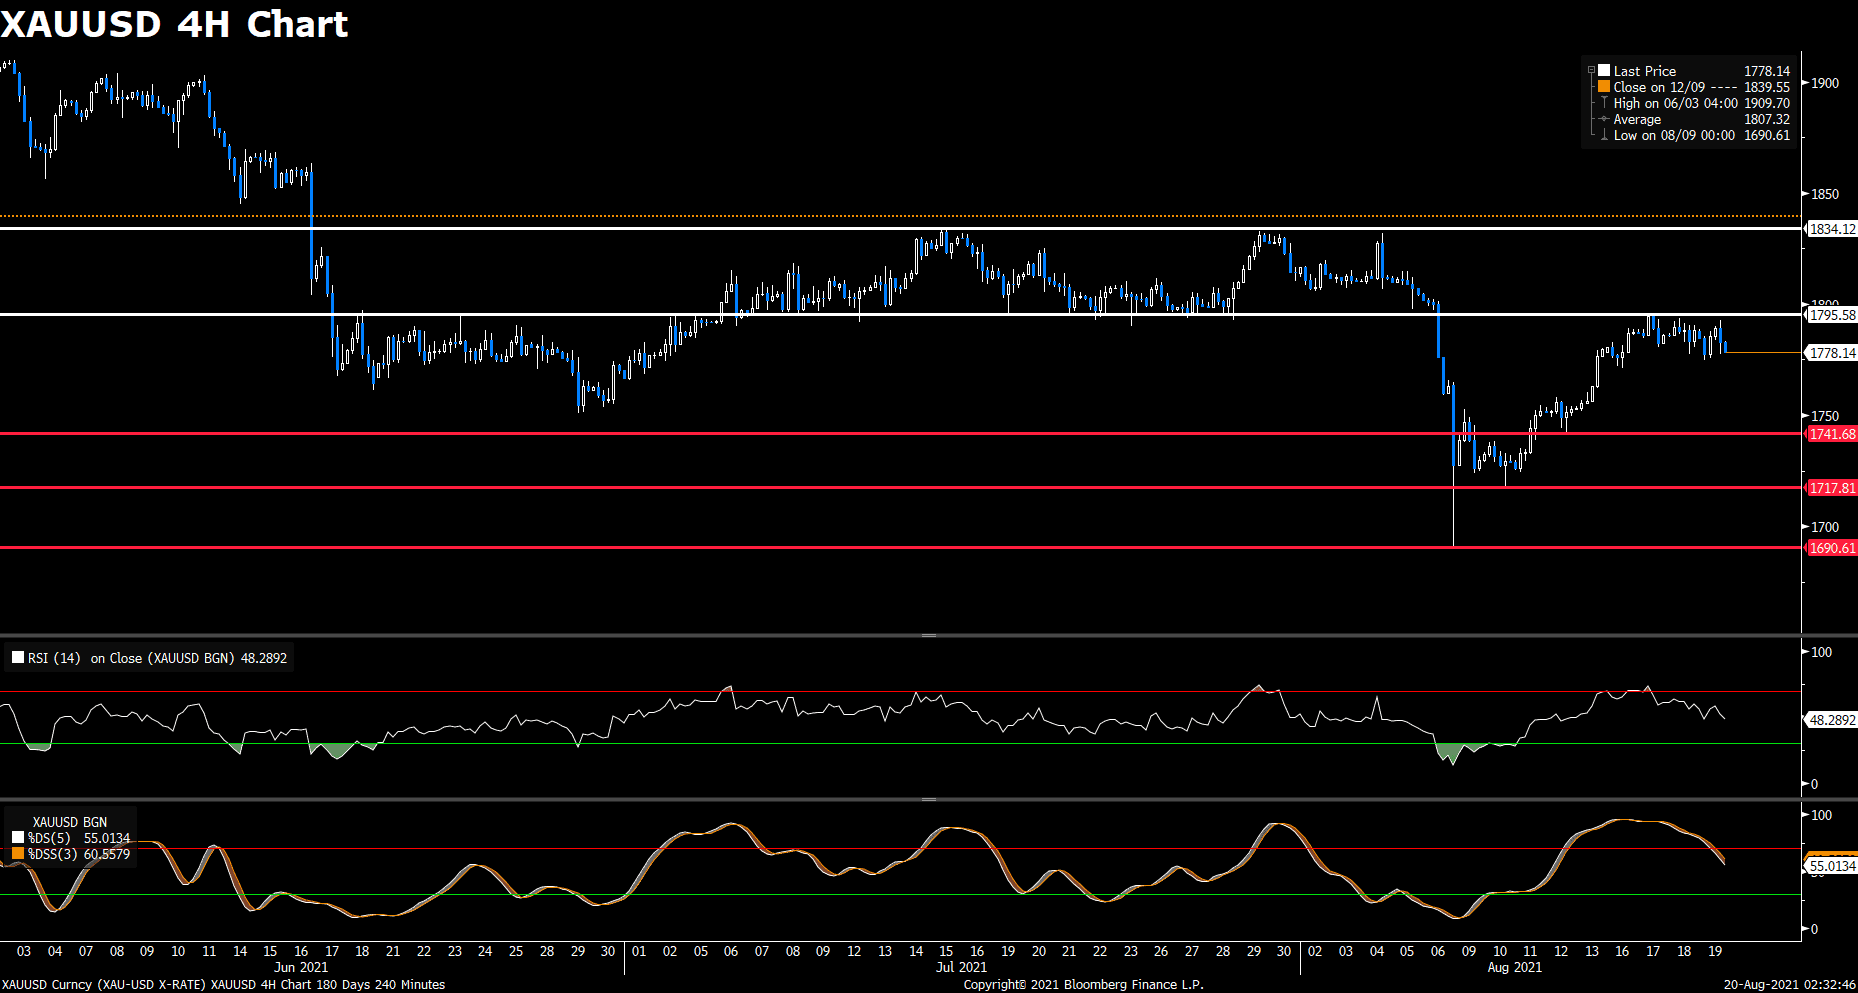
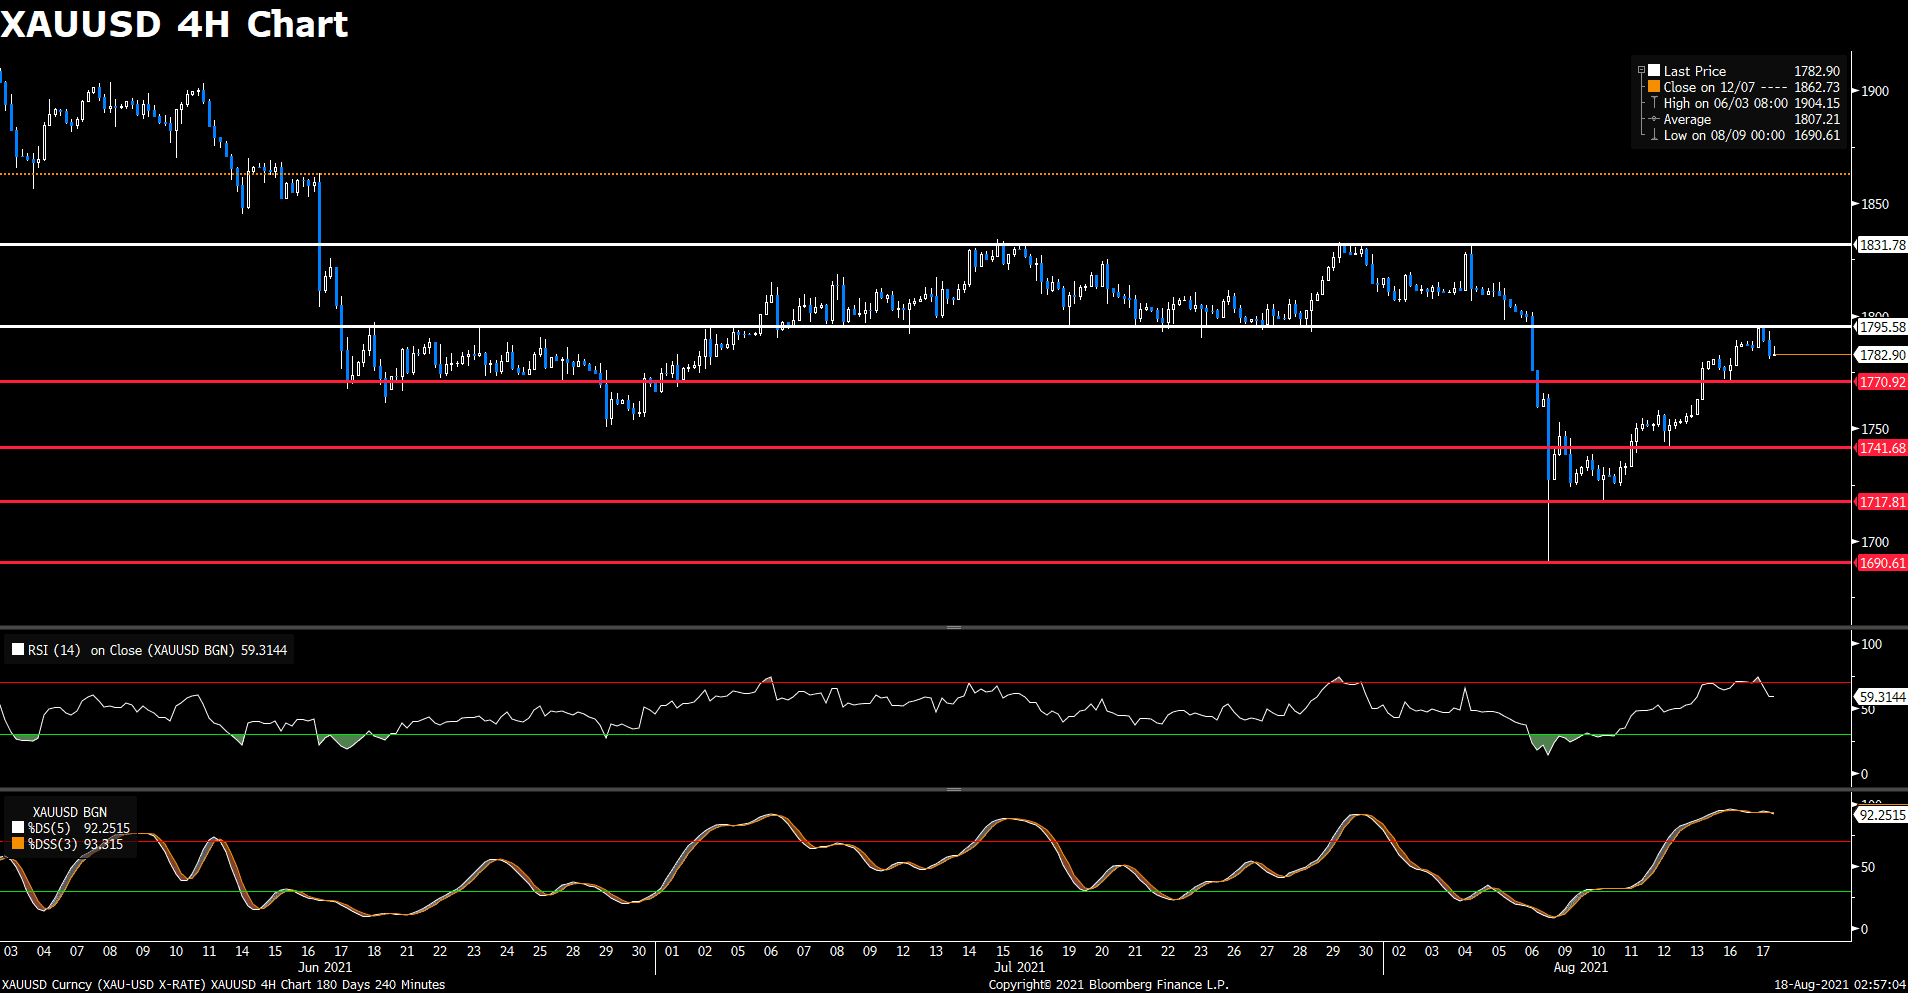
The XAU/USD pair was trading lower in early trade on Wednesday, then continued its downward traction during American session. The pair is now trading at 1792.48 at the time of writing, losing 0.59% on the day. Rising US Treasury bond yields are putting downward pressure on gold price. For technical aspect, RSI indicator 50 figures as of writing, suggesting that there is no obvious trend in the market now. If we take a look at MACD indicator, a negative MACD histogram shows that the market is bearish. For Bollinger Bands, the price is now trading below the 20 SMA line, which also indicates a bear market.
In conclusion, we think market will be bearish as the pair failed to break above the 1797.79 level. It’s heading down to test the 1776.55 support line. The metal is likely to maintain its downward correction.
Resistance: 1797.79, 1809.63, 1832.71
Support: 1776.55, 1741.68, 1725.21
Economic Data
|
Currency |
Data |
Time (GMT + 8) |
Forecast |
||||
|
EUR |
ECB Publishes Account of Monetary Policy Meeting |
19:30 |
|||||
|
USD |
GDP (QoQ) (Q2) |
20:30 |
6.7% |
||||
|
USD |
Initial Jobless Claims |
20:30 |
350K |
||||
 The Covid-19 vaccine made by Pfizer Inc. and BioNTech SE was granted a full approval by U.S. regulators, a milestone expected to help bolster the immunization drive amid a renewed surge in infections.