Daily Market Analysis
Market Focus
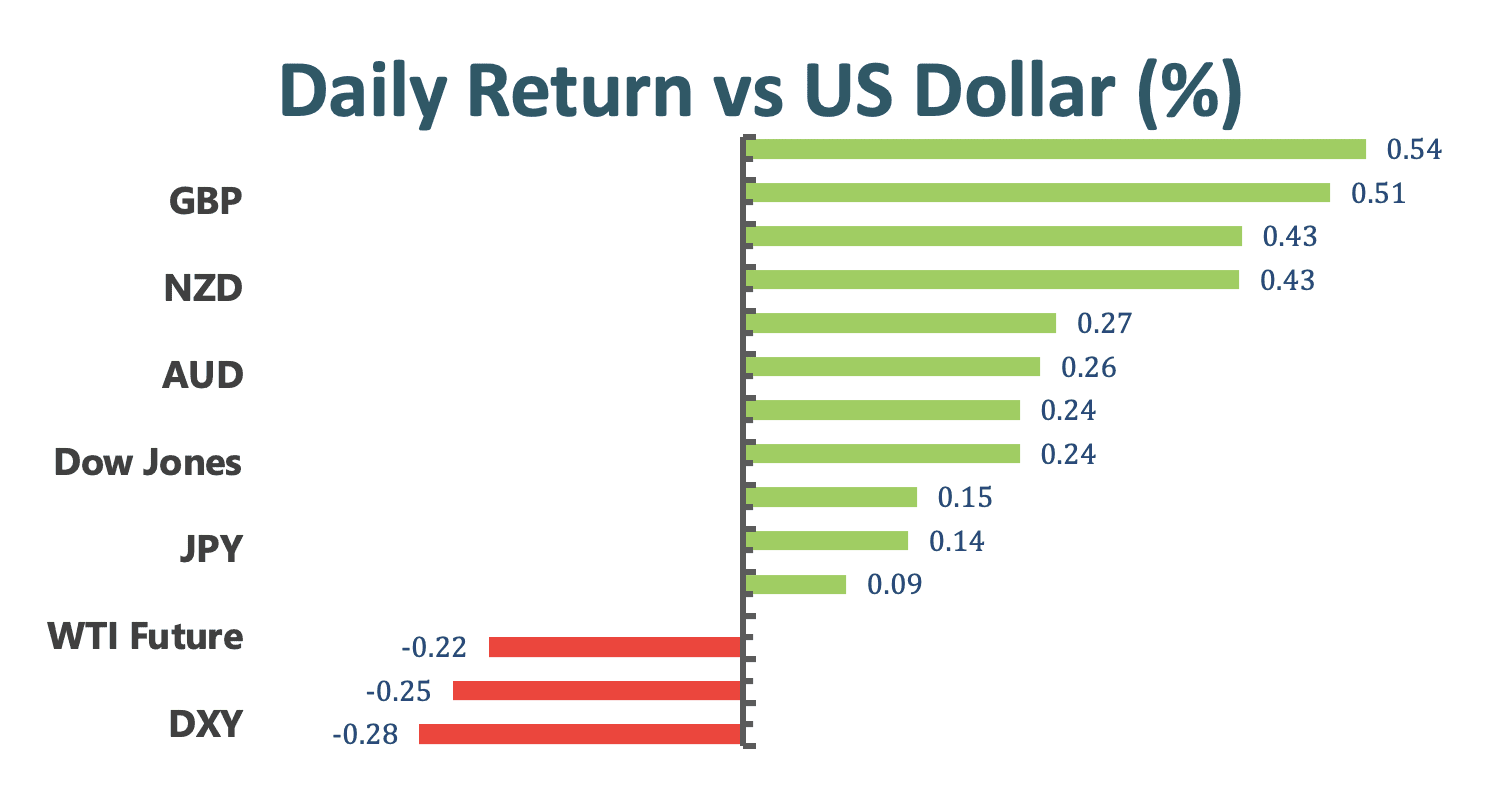
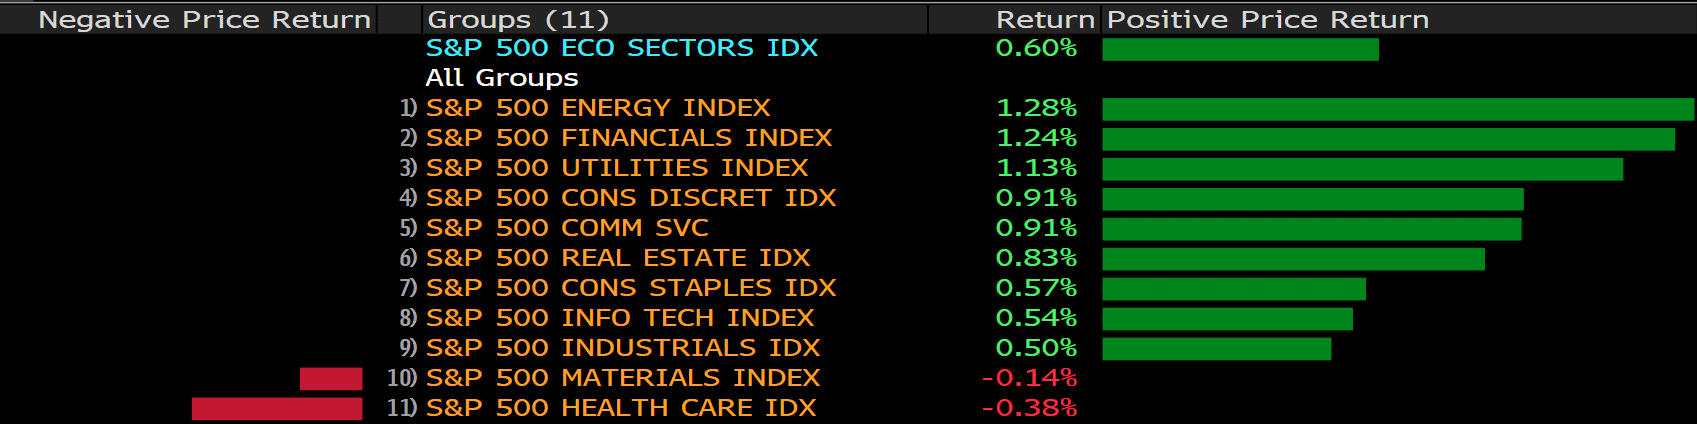
Major US Indices edged higher on Thursday ahead of a key labor market report on Friday. The Dow Jones Industrial Average rose 271.58 points; the S&P 500 added 0.6% while the Nasdaq climbed 0.8%. Major indices were led by travel stocks, including airlines, rallying on Thursday after struggling over the past week.
Futures rose in Hong Kong and Japan after the S&P 500 and the Nasdaq 100 reached new peaks. Investors viewed the ADP report this Friday that stocked optimism, which might spark market swings.
In the latest Federal Reserve’s comments, Governor Walker is positive about the economic outlook, and he thinks that accommodative policy could possibly sooner than expected. In the meantime, Senator Joe Manchin has urged the Fed Chairman Jerome Powell to start tapering the bond purchases.
Ethereum, the second- largest cryptocurrency, went through a major upgrade, known as EIP- 1559 London, which is expected to reduce the supply of the token and stabilize transaction fee. As a result, the Ethereum was close to a two- month high.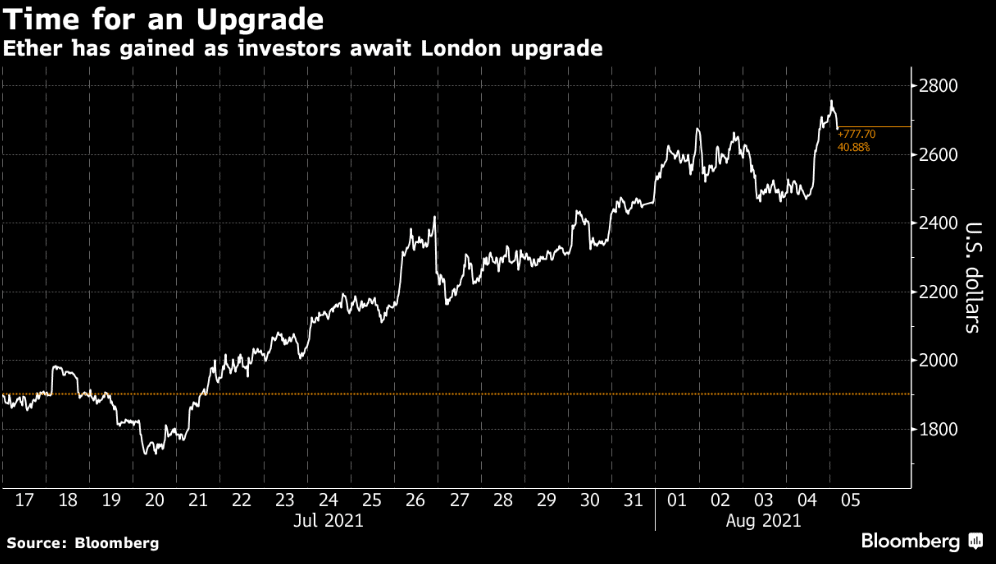
Main Pairs Movement:
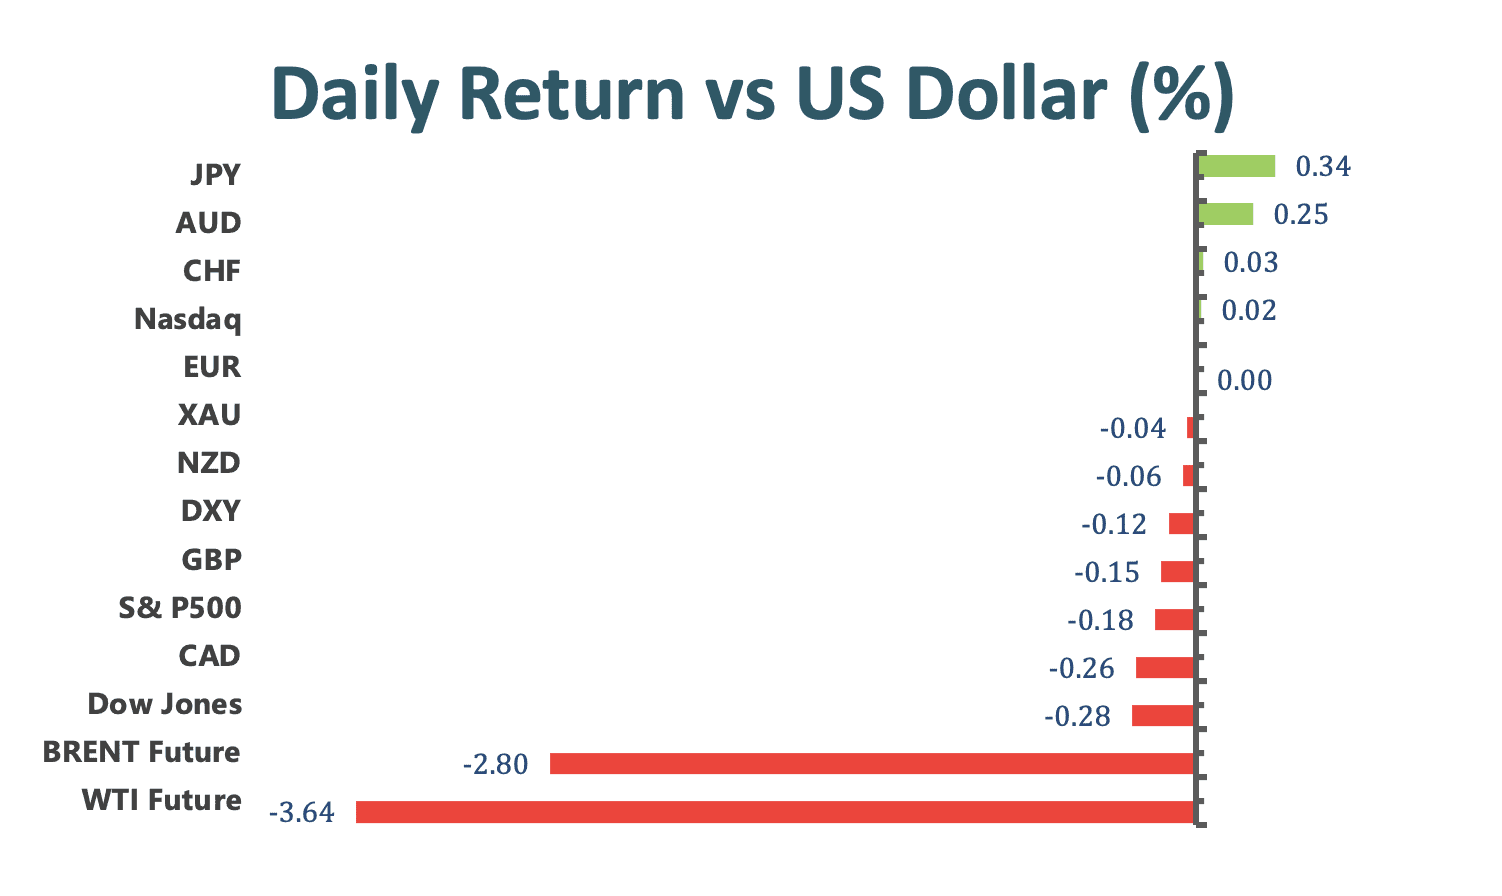
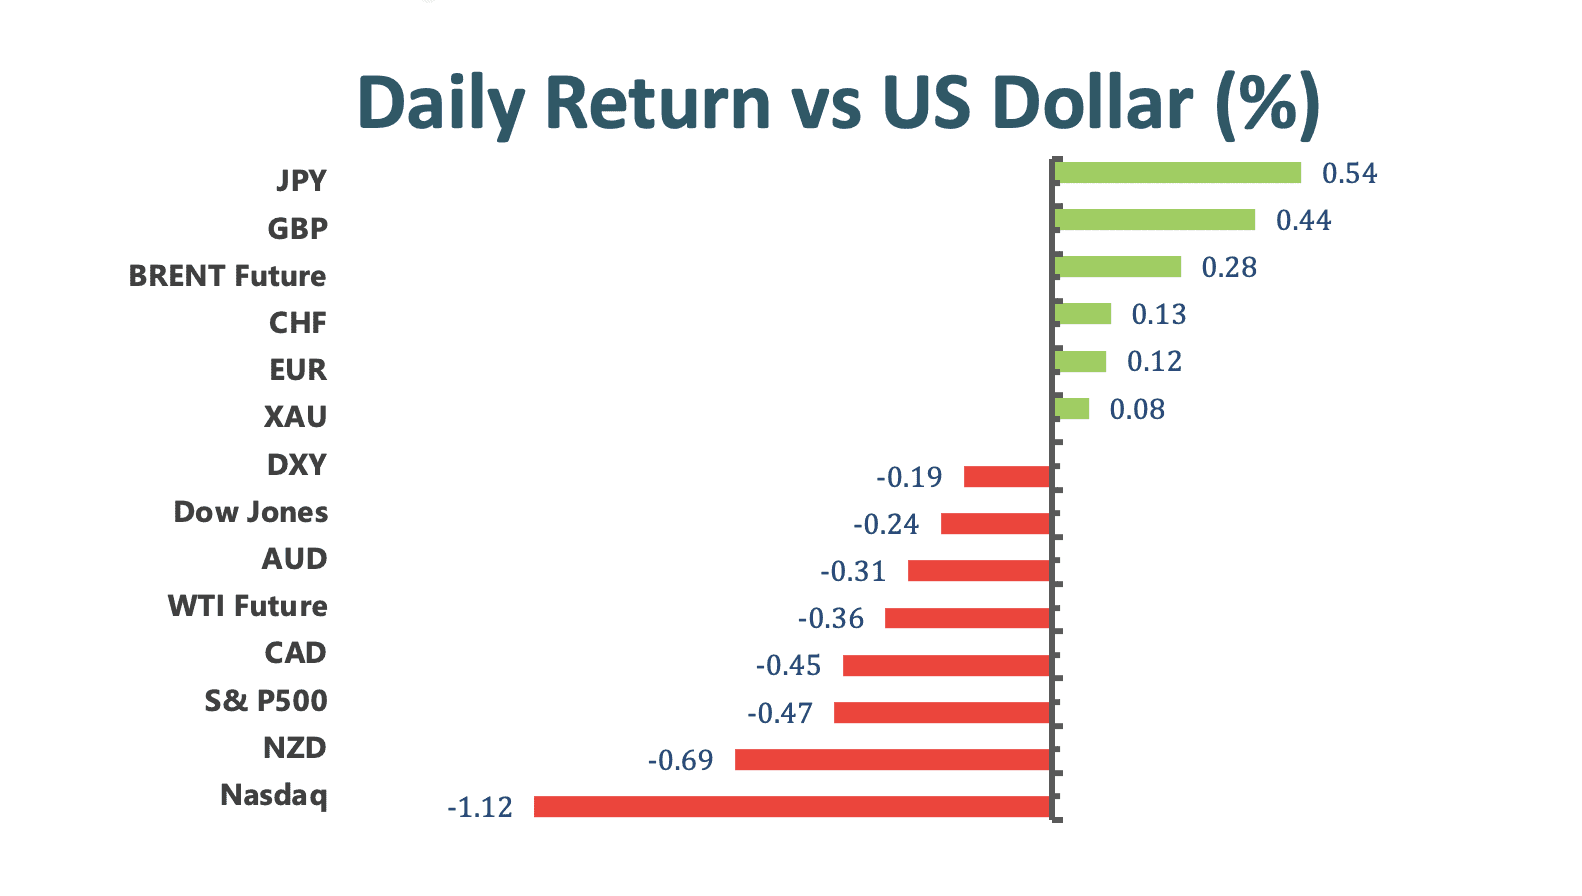
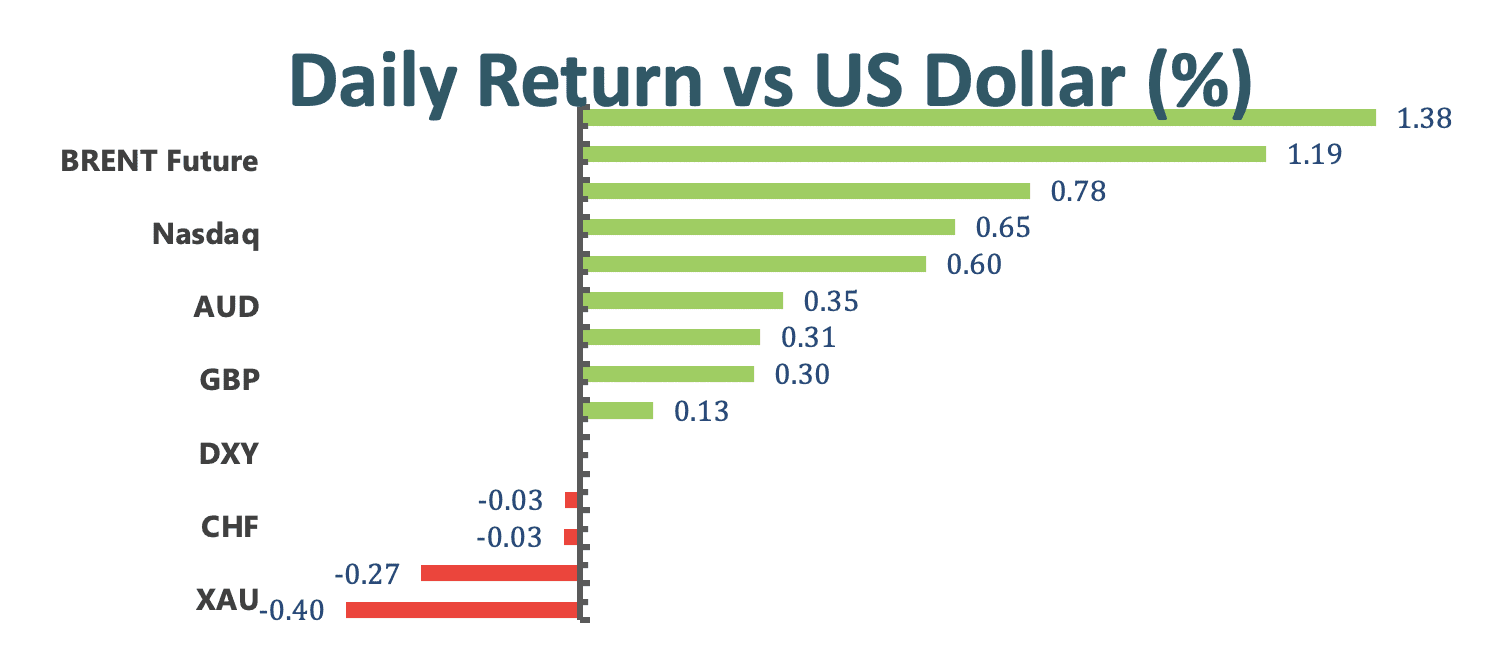
GBPUSD rose as high as 1.3949 after the Bank of England’s decision, signaling some modest tightening of its monetary policy in order to keep inflation under control. As the British central bank starts leaning to a hawkish tone, it allows the members from the committee to begin discussing raising interest rates. The GBPUSD currency pair ended up closing at 1.3926.
AUDUSD climbed steadily, closing at 0.7399 as the Australian government bonds edged lower before the release of a quarterly statement on the monetary policy.
Platinum plunged to a seven- month low as the spread of the Covid hurt the outlook for industrial commodities while the Fed signaled the tapering plan. 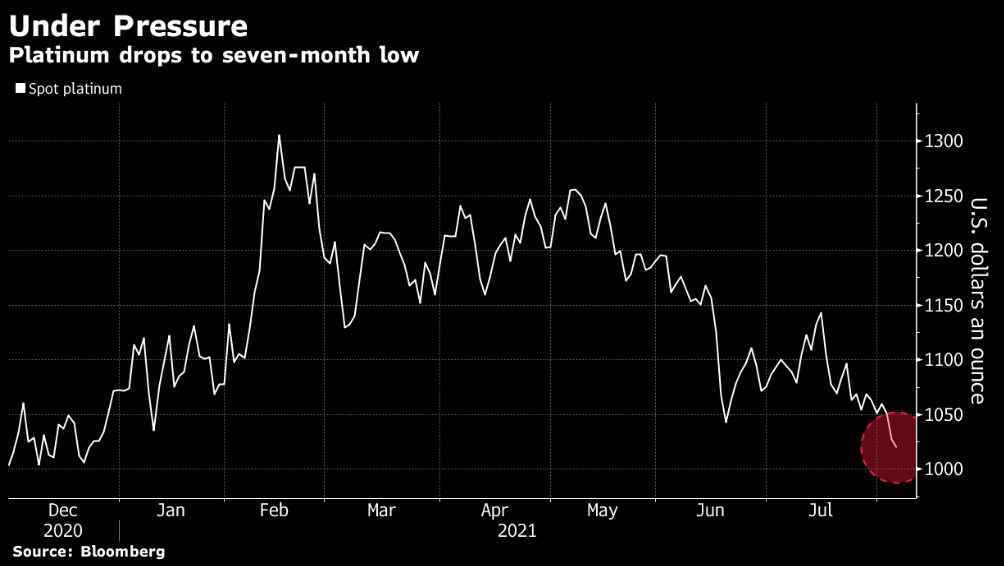
The precious metal, gold, dropped to near one- week lows, closing at $1,804. The downside was mainly caused by the overnight hawkish comments from the Fed’s Clarida, who remarked on the non- yielding metal.
Technical Analysis:
GBPUSD (4-hour Chart)
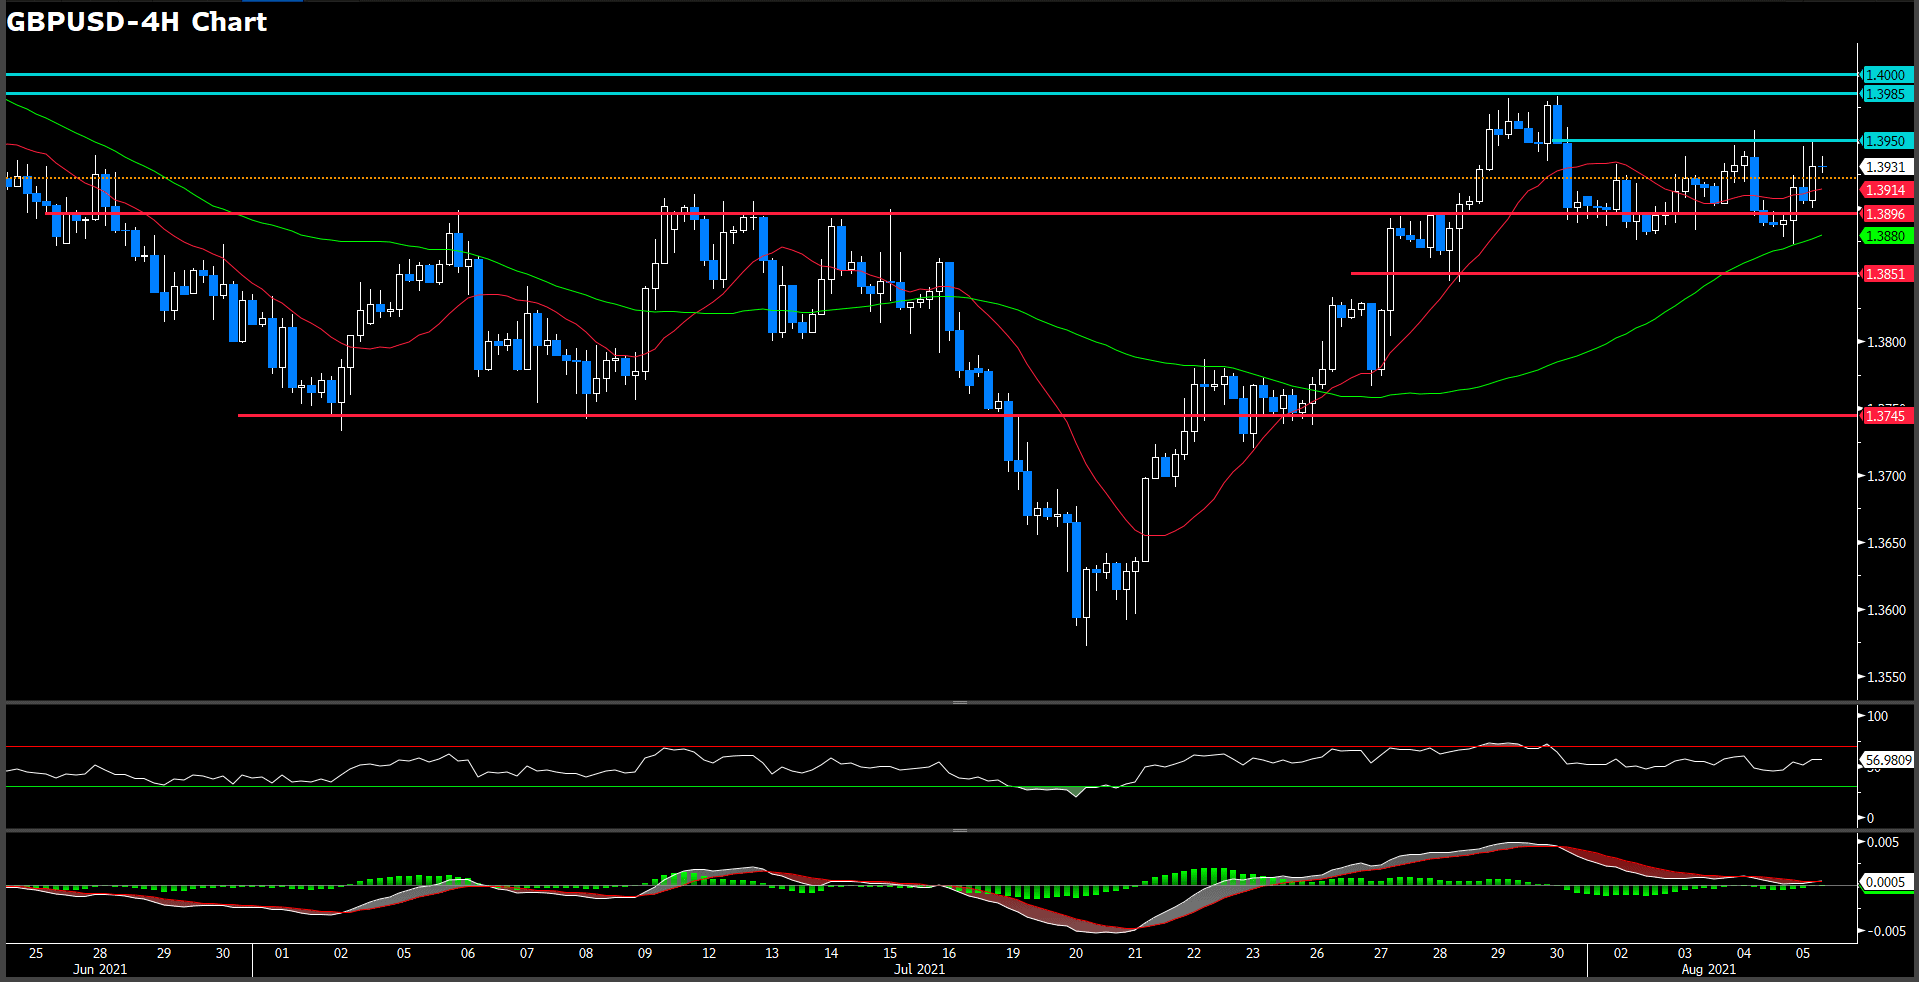
Cable rose as high as 1.3949 after the BoE decision but was unable to break the resistance needed for an upside traction in the the daily market which awaiting NFP data tomorrow, holding 1.3929 with 0.29% gains. BoE officials siad they will kick off unwind their alomost 900 billion-pound quantitative easing program when the interest rate reaches 0.5%, much earlier than previously thought. For technical aspect, RSI indicator pull up from slightly-bearish condition to set at 57 figures, suggesting slightly bull movement ahead. For moving average side, 15 long SMA indicator holding a flat side movement and 60 long SMA indicator remaining upway traction.
All in all, we believe this pair still lacking of a direction as it miring in a tiny horizontal channel which choppy nearly a week. If price fall ahead, market will eye on 1.385 level in short term and 1.38 level follow. On upway, if price could go over the last highs spot which around 1.395, it will heading to over 1.4 level.
Resistance: 1.3896, 1.3985, 1.4
Support: 1.3665, 1.3745, 1.38, 1.385
EURUSD (4- Hour Chart)
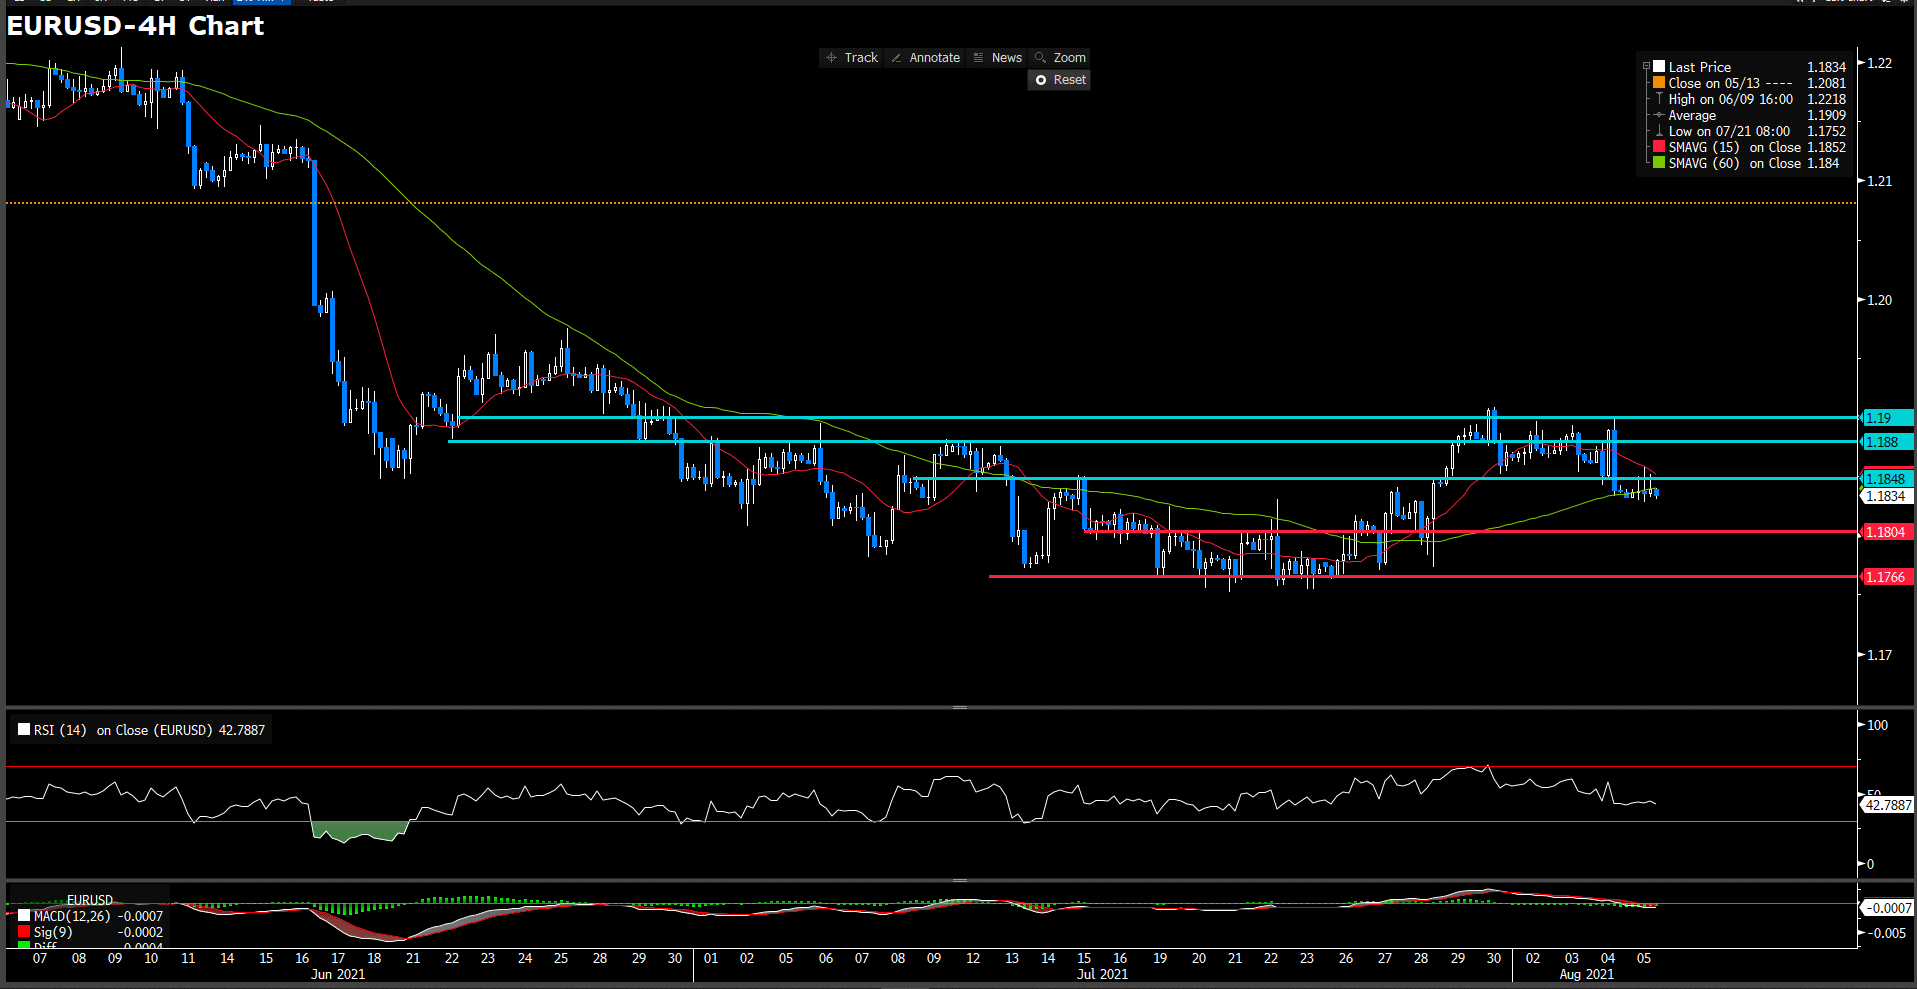
Earlier in the day, the modest greenback weakness helped euro dollar pair push higher, yet, failed to gather bullish momentum. As of writing, the pair was virtually unchanged on the day at 1.18351. Meanwhile, market eyes turn to the U.S. NFP report as ADP figures miss the expectation. From the technical perspective, RSI indicator close 43 figures as of writing, suggesting slightly-bearish movement for a short term. For moving average side, 15 long SMA indicator retaining downward slope and 60 long SMA remaining flat.
For price action, If price could breach 1.188 firmly again, it could heading to higher level. On downside, we deem the most strong support level will be 1.1766 level. Moreover, it seems like building a double head price action and neckline will be on 1.1848. For now, we think price will consolidate in tiny range between first immediately resistance and support.
Resistance: 1.1848, 1.188, 1.19
Support: 1.18, 1.1766
XAUUSD (4- Hour Chart)
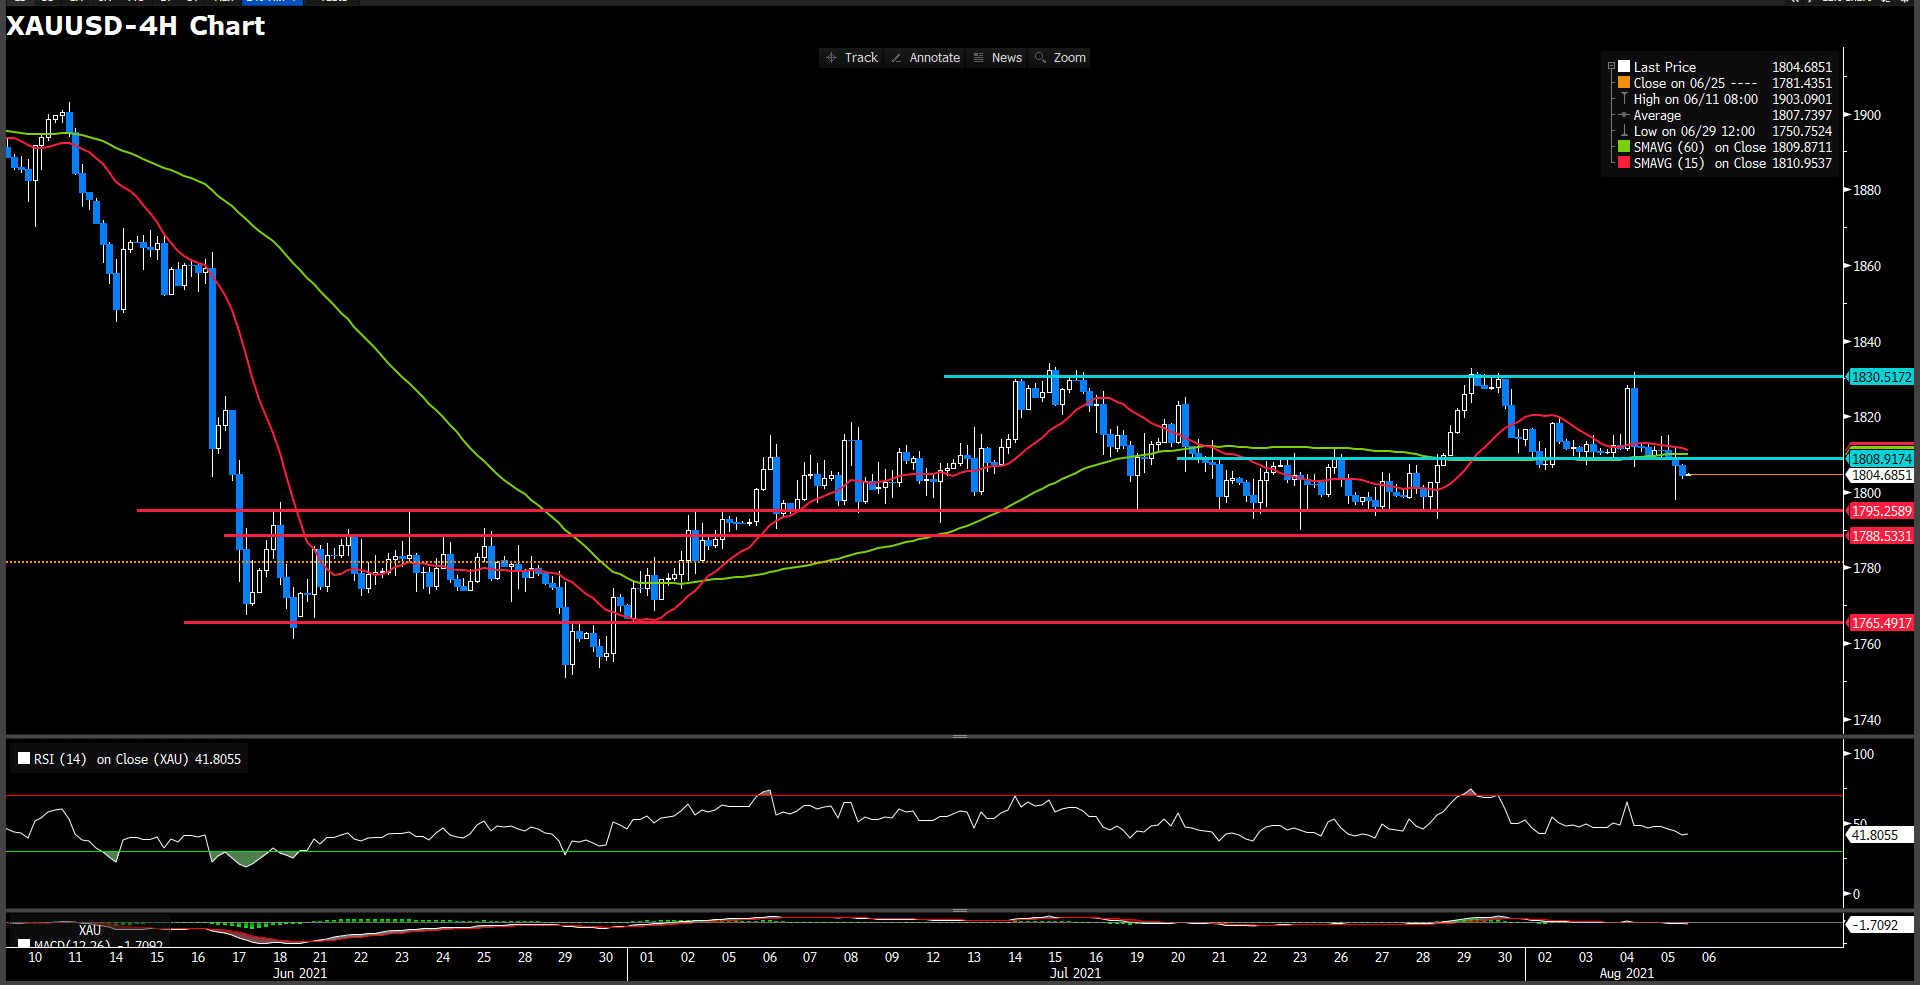
As of writing, the price of gold is back above the psychological 1800 level, hit recently lowest spot, at 1804.6. In the absence of high-tier macroeconomic data released, the 3% rallied witnessed in the 10 years U.S. treasuries yields seems to helping the greenback stay resilient then pressure on yellow metal market. At the meantime, the risk-on mode it on the fire for market speculator hence save haven demand become scarcely. For technical side, RSI indicator slightly decline to 42 figure as of writing, suggesting a bearish movement ahead. For moving average perspective, both 15 and 60 long SMAs indicator are moving in flat momentun at the same time, two indicator seem about to intersect .
For price action, we forecast the 1795 level is a pivotal support for buy side investor. If price go down below it, the immediately but fragile support will be 1788.5 and next support will eyes on 1780. On upside, we believe 10 year U.S. treasuries yields still a barometer. If yield could continue decline, it will fuel yellow metal to edge up.
For price action, if price slip under 0.9047, we expect the momentum will lead it to further way on 0.9 level. On upside, price seem building a comfort resistance cluster area at 0.90756, 0.91 following.
Resistance: 1808.92, 1830.5
Support: 1795.25, 1788.5, 1765.5
Economic Data
|
Currency |
Data |
Time (GMT + 8) |
Forecast |
||||
|
USD |
Nonfarm Payroll (Jul) |
20:30 |
870 K |
||||
|
USD |
Unemployment Rate (Jul) |
20:30 |
5.7% |
||||
|
CAD |
Employment Change (Jul) |
20:30 |
177.5 K |
||||
|
CAD |
Ivey PMI (Jul) |
22:00 |
N/A- |
||||