VT Markets crowned Best Customer Service award

8 November 2021, Sydney, Australia – VT Markets, a leading technology-oriented CFD broker, is delighted to announce that it was named the winner of the “Best Customer Service” by Forex Expo Dubai 2021. The award highlights the excellence of customer services provided to VT Markets’ clients throughout the year, and the commitment to deliver the core value of the brand to the industry.

Alla Talji, VT Markets Cyprus Office, receiving the award on behalf of VT Markets

A historical year continues for VT Markets. Celebrating its 6th year in the financial services industry, the company has been recognised for multiple awards in the customer support area this year, including the “Best Customer Service – Europe” award from the Global Brands Magazine, and “Best Customer Support – Europe” award from the International Business Magazine.

Chris Nelson-Smith, the Director of VT Markets, was clearly delighted. Mr. Nelson-Smith said:

“We are constantly striving to provide our clients with an exceptional trading experience. One of the most satisfying aspects of the award is that it comes after being judged against our competitors across all key aspects of our industry.”

Chris added that one of the most pleasing parts of this award is that VT Markets is starting to get acknowledged by highly reputable global events: “Being recognised as the best customer support broker on such a high level, competitive and crowded playing field highlights the quality of our services and products”.

VT Markets offers a range of trading platforms including MetaTrader 4, MetaTrader 5, and a self-developed mobile trading app. With several different account types and a range of 230+ popular instruments across Forex, precious metals, indices, and Share CFDs. Those who are still looking for a broker to invest, should open a Live Account VT Markets – the Best Customer Service broker 2021.

About VT Markets

VT Markets, based in Sydney, Australia, is a subsidiary of VT Markets LLC (VIG), and leverages more than 10 years of experience and expertise in global financial markets to offer easy and transparent market access and help our clients pursue their financial goals. Founded in 2016, VT markets has applied advanced technical support in the retail FX market to provide clients with superior trading experience.

For inquiries, please contact [email protected] or visit www.vtmarkets.com

Market Focus

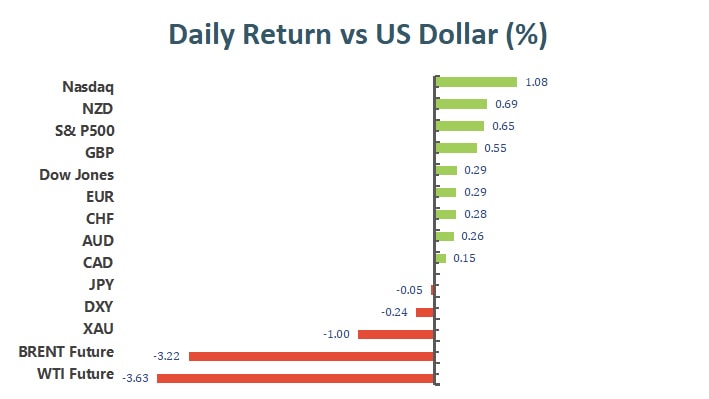
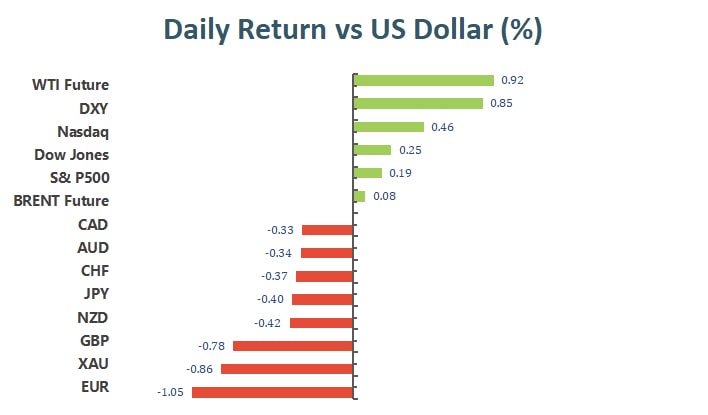
Another day, the S&P 500 index and the Nasdaq 100 index once again set a record closing. This marked the close of six records of the two indexes in the past six trading days. The S&P 500 index rose 0.42% to close at 4680 points, while the Nasdaq 100 index rose 1.25% to close at 16346. The Dow Jones Index fell slightly by 0.1%, but it was still above the 36000 level. The CBOE Volatility Index (VIX), often referred to as the fear indicator on Wall Street, stabilized above 15.00, not far from the post-pandemic low of around 14.00 set in June.

一張含有 文字 的圖片

自動產生的描述

The Philadelphia Semiconductor Index surged 3.5% with strong gains from Qualcomm, which

Qualcomm rose strongly by 12.7%, causing the Philadelphia Semiconductor Index to soar 3.5%. Despite severe disruptions in the global supply chain, its business is still booming. Moreover, technology stocks benefited from the sharp drop in U.S. Treasury yields, the main catalyst for the decline was the dovish attitude of the Bank of England, this triggered a historic decline in UK yields, which has spread to international markets.

The Wall Street Journal reported that the automaker and Hertz are negotiating how quickly the car rental company can receive deliveries from a large order for 100,000 Tesla vehicles. Hence, Tesla shares rose slightly by 16.05 US dollars, or 1.3%, to $1,229.91. After the British health regulator approved the Covid-19 drug developed by it and its partner Ridgeback Biotherapeutics, Merck’s stock price rose 1.86 US dollars, or 2.1%, to 90.54 US dollars. After lowering its forecast for the delivery of the Covid-19 vaccine for the full year of 2021, Moderna’s stock price plummeted by US$61.90, or 18%, to US$284.02, citing the longer delivery cycle of international transportation.
 

Main Pairs Movement:

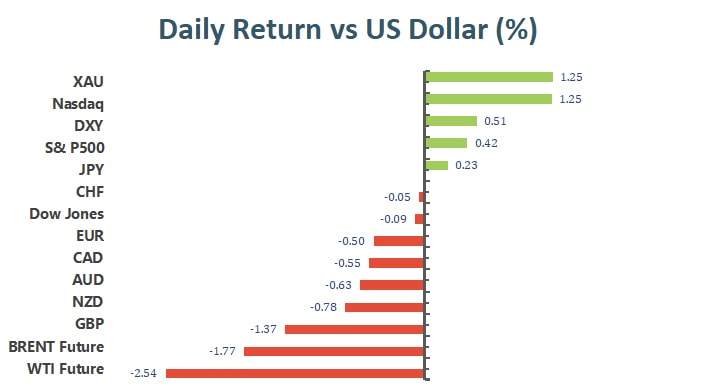
On Thursday, the US dollar was the overall winner, regaining its gains, setting new weekly highs against high-yield opponents. On the other hand, safe-haven assets rose slightly against the U.S. dollar but did not break through any key levels.

After the BOE held a monetary policy meeting and decided to keep the interest rate unchanged at 0.1%, disappointing the market expected to raise interest rates and further boosting demand for the dollar. The GBP/USD exchange rate plummeted to 1.3470 and closed around 1.3500.

After the announcement of the PMI on Thursday, the data was lower than expected and could not provide any momentum for the euro against the dollar. Therefore, the EUR/USD faced pressure near 1.1615 for the third consecutive day, and the bulls gave up and tested the previous support at 1.1527.


Technical Analysis:

GBPUSD (4- Hour Chart)
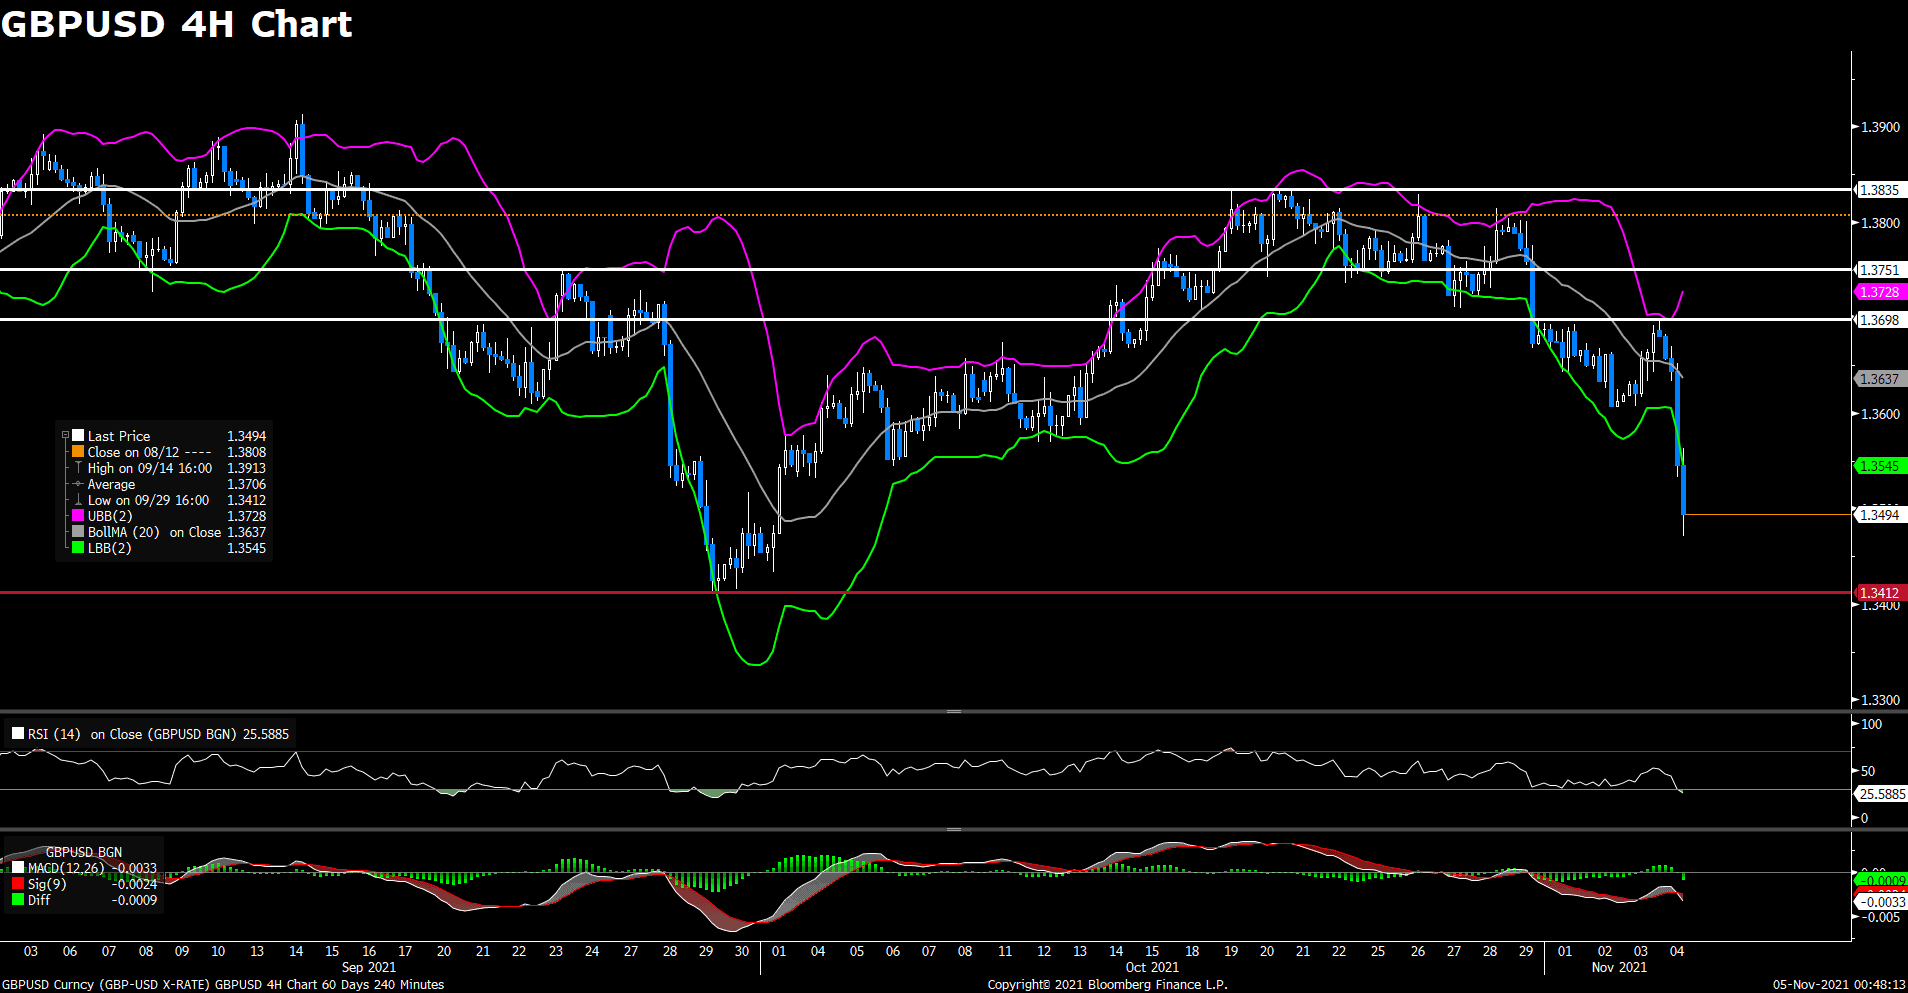
The pair GBP/USD tumbled on Thursday amid dovish Bank of England, dropping to the lowest level since October 1. The pair was trading lower in early Asian session and then declined sharply right after BoE announcement. GBP/USD is currently sitting just above 1.350, hoping to rebound back from today’s slide. The Bank of England released their latest rate decision and monetary policy statement today as the bank decided to keep UK’s interest rate unchanged at 0.10%. The dovish decision not to hike rates surprised the market and meanwhile dampened investor’s expectations of the coming BoE rate hiking cycle. On top of that, the stronger US dollar also weighed on the cable, as the DXY index preserve its upside momentum and climb further above 94.00 level.

For technical aspect, RSI indicator 25 figures as of writing, suggesting that the pair is in oversold zone, investors should be aware of a trend reversal. The MACD indicator showed a death cross on the histogram, which means the pair is likely to experience downward momentum. If we take a look at the Bollinger Bands, the price price is moving out of the bands so a strong trend continuation can be expected. In conclusion, we think market will be bearish as the pair is now heading to test the 1.3412 support.

Resistance: 1.3698, 1.3751, 1.3535

Support: 1.3412


USDJPY (4- Hour Chart)

After rising above 114.20 level on Thursday, the pair USD/JPY failed to preserve its bullish momentum and started to see fresh selling during European session. After American session began, the pair declined further and touched a daily low under 113.55. USD/JPY was last seen trading at 113.69, posting a 0.26% loss for the day. Despite the renewed US dollar strength, USD/JPY are still dragged down by the top performer Japanese Yen. The lower US 10-year yields also weighed on the pair. Market focus now shifts to the Nonfarm Payrolls report, as a strong report may sends USD/JPY higher.

For technical aspect, RSI indicator 42 figures as of writing, suggesting tepid bear movement ahead. As for the MACD indicator, a death cross just formed on the histogram, therefore bearish momentum is likely to persist. Looking at the Bollinger Bands, price dropped below the moving average and now moving toward the lower band, which indicate a bear market. In conclusion, we think market will be bearish as long as the 114.44 resistance line holds. If the pair dropped below the 113.26 support, some additional near-term losses can be expected.

Resistance: 114.44, 114.70

Support: 113.26, 111.53, 110.82


USDCAD (4- Hour Chart)

The pair USD/CAD advanced on Thursday, extending its recovery for the second day as WTI oil pulls back from a daily top around 83.50. The oil prices has dropped sharply due to an output hike plan from OPEC+, who agreed to increase output by 400K barrels per day/month in December. The bearish momentum witnessed in oil keep weighing on the commodity-linked Canadian dollar. On top of that, stronger US dollar across the board also lift the pair further.

For technical aspect, RSI indicator 70 figures as of writing, suggesting that the pair is in overbought zone, investors should be aware of a trend reversal. The MACD is now sitting above the signal line, which indicates a bull market. As for the Bollinger Bands, price is moving out of the bands so a strong trend continuation can be expected. In conclusion, we think market will be bullish as the pair is trying to test the 1.2499 resistance.

Resistance: 1.2499, 1.2648, 1.2775

Support: 1.2378, 1.2288


Economic Data

Currency

Data

Time (GMT + 8)

Forecast

USD

Nonfarm Payrolls (Oct)

20:30

450K

USD

Unemployment Rate (Oct)

20:30

4.7%

CAD

Employment Change (Oct)

20:30

50K

CAD

Ivey PMI (Oct)

20:30

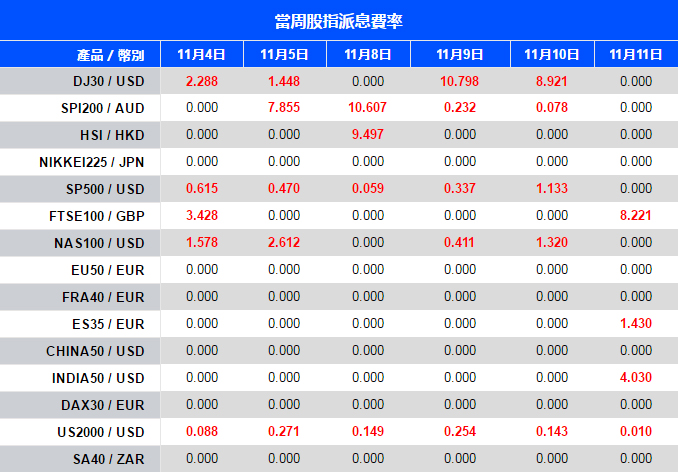
VT Markets The Adjustment Of Weekly Dividend Notification

Dear Client,

Warmly reminds you that the component stocks in the stock index spot generate dividends. When dividends are distributed, VT Markets will make dividends and deductions for the clients who hold the trading products after the close of the day before the ex-dividend date.

Indices dividends will not be paid/charged as an inclusion along with the swap component. It will be executed separately through a balance statement directly to your trading account, the comment for which will be in the following format “Div & Product Name & Net Volume ” .

Please note the specific adjustments as follows:

Note: The above data is for reference only, the actual execution data may be changed, please refer to the MT4/MT5 software for details.

If you’d like more information, please don’t hesitate to contact [email protected].

Market Focus

The Fed currently buys $120 billion in bonds every month to inject liquidity into the financial system. The Fed is expected to scale back its bond purchase program starting this month and develop a plan to stop buying bonds in the middle of the next calendar year.

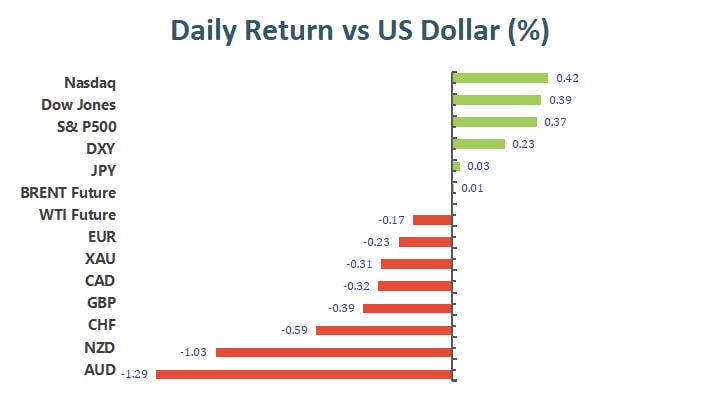
In view of the strong performance announced by companies, all three benchmark US indexes closed at historical highs. The Dow Jones Index rose 0.39%, the S&P 500 Index rose 0.37%, and the Nasdaq Composite Index rose 0.34%. 83% of S&P 500 companies that have announced results have exceeded analysts’ continued optimistic earnings expectations.

一張含有 文字 的圖片

自動產生的描述

Bed Bath & Beyond Inc. surged in the late trading after announcing accelerated stock repurchase and launching a new digital market for third-party producer goods. Lyft Inc. reported third-quarter revenue 73% higher than last year, and the shares went up 8% on the result. Avis Budget Group Inc. has soared in a series of retail frenzy as the car rental company said it will play an important role in the adoption of electric vehicles in the United States. Tesla’s stock price fell by 0.72% because Elon Musk expressed doubts about Hertz Global Holdings’ plan to purchase 100,000 electric vehicles and downplayed the potential of the deal.


Main Pairs Movement:

After the Federal Reserve announced its monetary policy, the U.S. dollar fell slightly against most of its major competitors at the close of trading on Wednesday. As expected, the U.S. central bank kept interest rates unchanged and announced a monthly reduction of $15 billion in asset purchases. The Federal Reserve will begin to reduce the size of U.S. Treasury bond purchases by US$10 billion and reduce mortgage-backed securities by US$5 billion later this month. In addition, policymakers still believe that inflation will be “temporary,” although Powell pointed out that supply chain problems may continue into next year, which means that inflation will also remain high.

The EUR/USD currently still stayed in the continuation pattern, and the currency pair still cannot break through 1.1615. Later in the day, the Manufacturing PMIs will be released, which might provide some clear direction for pairs following step.

The US dollar index reversed Monday’s decline and rose 0.22% in trading yesterday. The US dollar index was flat and rose 2 basis points in early trading today. The U.S. 10-year Treasury bond yield is 1.55%.


Technical Analysis:

EURUSD (4- Hour Chart)

The pair EUR/USD edged higher on Wednesday, ending the slide that started yesterday. The pair was trading higher in early Asian session and then bears started to take over during European session. But EUR/USD is currently rebounding back toward 1.158 area, paring most of its intraday loss. The pair stays in positive territory amid weaker US dollar across the board, despite the US ADP report showed the US economy added 571K jobs during October. This report will influence expectations from Friday’s official Nonfarm Payrolls. On top of that, investors are waiting for ECB’s action with their expectations of a probable lift-off sooner than anticipated.

For technical aspect, RSI indicator 46 figures as of writing, suggesting tepid bear movement ahead. The MACD also falls below the signal line, which means the pair is likely to experience downward momentum. If we take a look at the Bollinger Bands, the price is falling from the moving average after touch it, which also means that the bearish momentum is likely to persist. In conclusion, we think market will be bearish as long as the 1.1613 resistance line holds.

Resistance: 1.1613, 1.1692, 1.1755

Support: 1.1535, 1.1425


AUDUSD (4- Hour Chart)

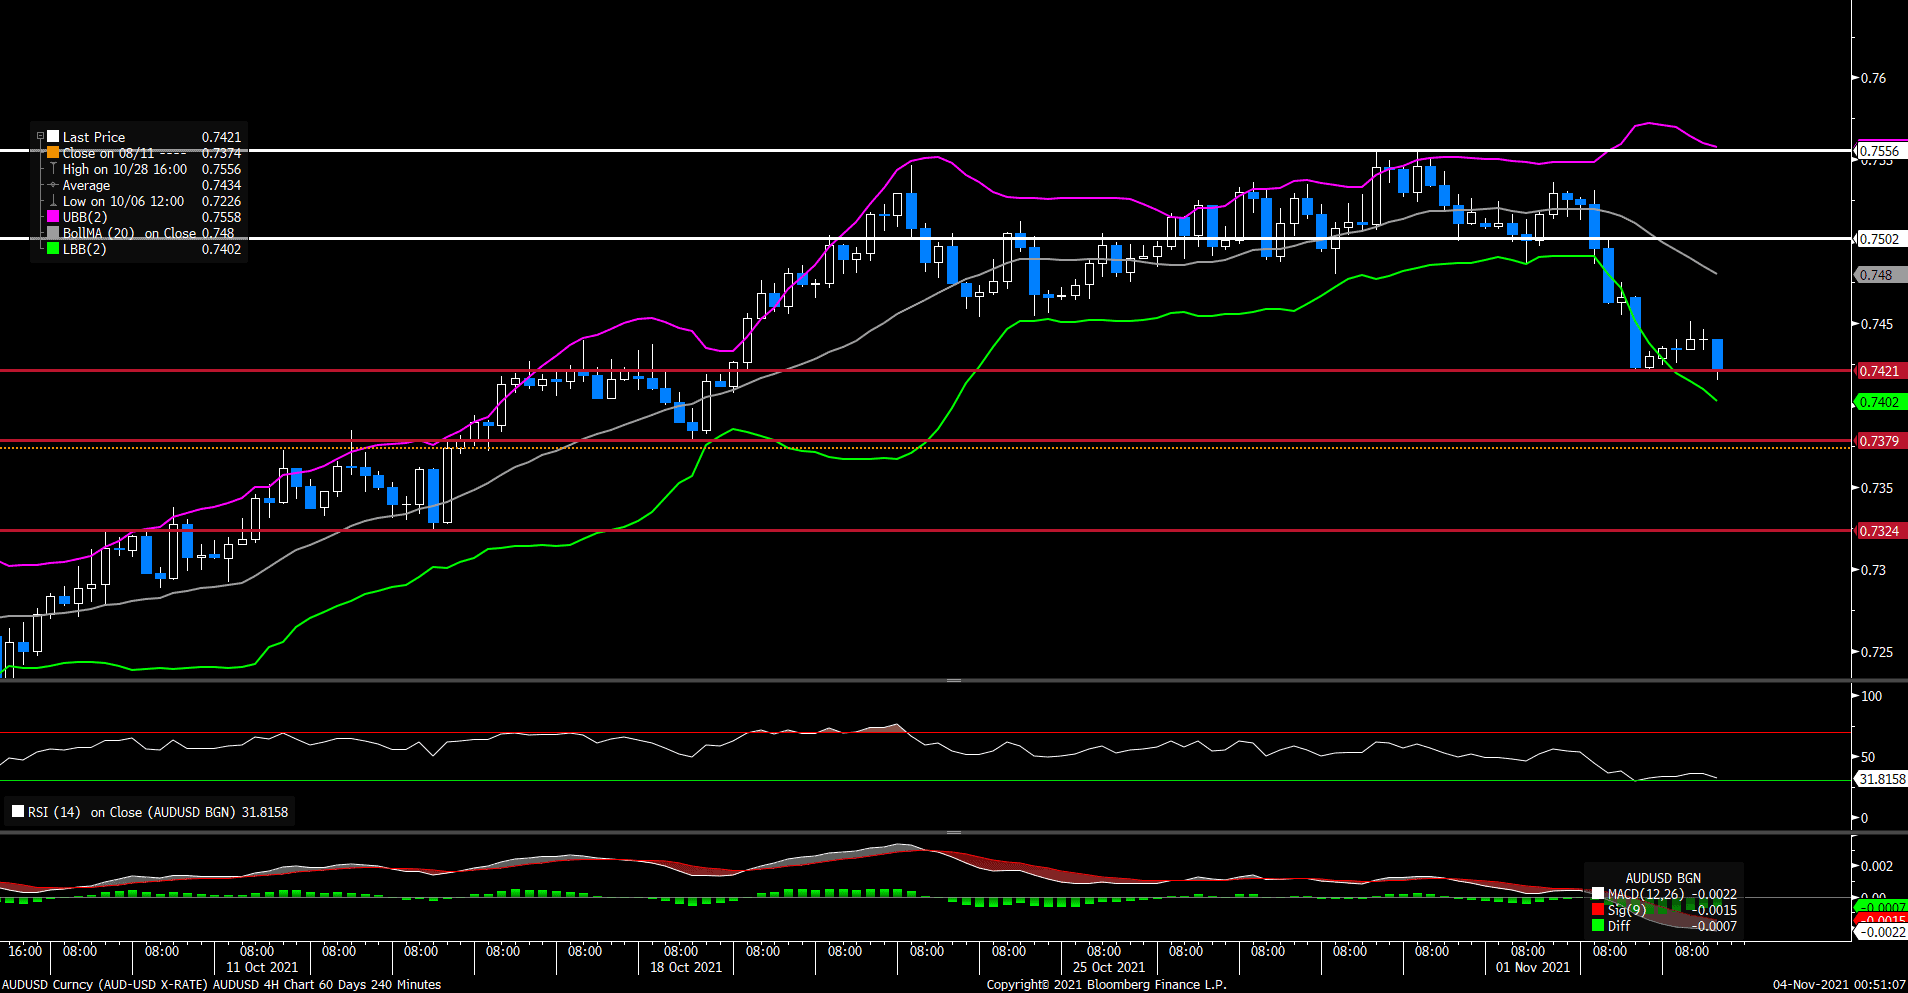
After plummeting to two-week low yesterday, The pair AUD/USD rebounded moderately in early trades on Wednesday, but failed to preserve its bullish traction and now flirting around 0.7425 area at the time of writing. A less hawkish Reserve Bank of Australia and upbeat Chinese’s macro data assisted AUD/USD to gain some traction earlier today. On top of that, the Fed is scheduled to announce its monetary policy decision later during the American session as well as Fed Chair Jerome Powell’s comments at the press conference. If they are hawkish, AUD/USD could declined further. AUD/USD was last seen trading at 0.7419, posting a 0.12% loss for the day.

For technical aspect, RSI indicator 32 figures as of writing, suggesting that the pair is surrounding by heavy selling now. As for the MACD indicator, the negative histogram also indicates a possible downward trend for the pair. Looking at the Bollinger Bands, price is sitting between the moving average and the lower band, therefore the pair is likely to experience downward momentum. In conclusion, we think market will be bearish as the pair is now testing the 0.7421 support and chances are high that it could break it, which will open the door for additional near-term losses.

Resistance: 0.7502, 0.7556

Support: 0.7421, 0.7379, 0.7324


XAUUSD (4- Hour Chart)

The pair XAU/USD tumbled on Wednesday amid strong US jobs data, sitting in negative territory for a second day. The pair dropped to a three-week low and now flirting just under 1764 level. The better-than-expected ADP report acted as a tailwind for the greenback and weighed heavily on the XAU/USD pair. A upbeat ADP estimate usually increases the chance the NFP report is going to be strong, which may trigger a more hawkish Fed. Market focus now shifts to the Fed announcement later in the session, as investors expect the Fed to announce its bond tapering plans.

For technical aspect, RSI indicator 28 figures as of writing, suggesting that the pair is in oversold zone, investors should be aware of a trend reversal. The MACD also falls below the signal line, which indicates a bear market. As for the Bollinger Bands, price is moving out of the bands so a strong trend continuation can be expected. In conclusion, we think market will be bearish as the pair is trying to test the 1750.24 support..

Resistance: 1796.40, 1813.83, 1834.04

Support: 1750.24, 1721.74


Economic Data

Currency

Data

Time (GMT + 8)

Forecast

GBP

Construction PMI (Oct)

17:30

52.0

GBP

BoE Inflation Report

20:00

GBP

BoE Interest Rate Decision (Nov)

20:00

0.10%

USD

Initial Jobless Claims

20:30

275K

EUR

ECB President Lagarde Speaks

21:00

GBP

BoE Gov Bailey Speaks

22:15

Market Focus

The relentless climb in stocks pushed major U.S. benchmarks to their historical highs just a day ahead of the Fed’s policy meetings. The rally of the stock was underpinned by the better-than-expected corporate earnings results. S&P 500 rallied 0.37% to 4630.65, Dow Jones went up 0.39% to 36052.63, while the Nasdaq rose more modestly, only 0.34% weighed by a drop in Tesla (TSLA) after CEO Elon Musk downplayed the expected impact of a deal with car rental giant Hertz. Investors watched with optimism as more corporate earnings results exceeded expectations and defied concerns over ongoing supply chain constraints, shortages and cost pressures.

一張含有 文字 的圖片

自動產生的描述

Younger children across the U.S. are now eligible to receive Pfizer Inc.’s Covid-19 vaccine, after the head of the Centers for Disease Control and Prevention granted the final clearance needed for shots to begin.

CDC Director Rochelle Walensky recommended the vaccine for children from 5 to 11 years old. The decision ushers in a new phase in the U.S. pandemic response, widening access to vaccines to some 28 million more people at the same time that Americans who received shots earlier in the pandemic are lining up for booster doses.

Boosting by the good news, Pfizer Inc. (PFE) surged 4.15% during the Wall Street trading, closing the day at 45.45.


Main Pairs Movement:

The greenback strengthened against most of its major rivals, only stable against the Japanese Yen, which has depreciated too much in the past several weeks. The AUD and the GBP were the worst performers, the first hit by a dovish RBA statement, the second hit by Brexit jitters and uncertainty related to the Bank of England, scheduled to meet this week. AUD/USD trades around 0.7420 while GBP/USD hovers near 1.3600.

The EUR/USD pair is trading around 1.1580, with demand for the shared currency undermined by Markit´s final readings of its October Manufacturing PMIs. The German index was downwardly revised to 57.8 from 58.2, while that for the Union was confirmed at 58.3, below the preliminary estimate of 58.5.

Commodities shed some ground but held within familiar levels. Spot gold settled at $1,788 a troy ounce while WTI and Brent trade around $83.00 and $83.60 a barrel respectively.


Technical Analysis:

GBPUSD (4- Hour Chart)

The pair GBP/USD declined on Tuesday, preserving its bearish momentum and falls for the third straight day. The pair was trading lower in early Asian session and started to see heavy selling after American session began. GBP/USD stays in negative territory amid stronger US dollar across the board, as the risk-off market sentiment underpinned the safe-haven US dollar. Investors now await the critical monetary policy decisions from the Fed and the BOE meeting. On top of that, concerns about the UK and France spar over the fishing rights in the post-Brexit transition rules keep weighing on the cable.

For technical aspect, RSI indicator 35 figures as of writing, suggesting bear movement ahead. For the MACD indicator, the negative histogram also indicates a possible downward trend for the pair. If we take a look at the Bollinger Bands, the price is sitting between the moving average and the lower band, which means that the bearish momentum is likely to persist. In conclusion, we think market will be bearish as the pair is heading to test the 1.3570 support.

Resistance: 1.3751, 1.3835, 1.3913

Support: 1.3570, 1.3412


AUDUSD (4- Hour Chart)

The pair AUD/USD tumbled on Tuesday, surrounding by strong selling pressure all day amid dovish RBA. After the central bank Governor Phillip Lowe said that it was still “likely to take some time” for inflation to sustainably return to its target, the falling short-term Australian government bond yields dragged the pair down to weekly low. On top of that, the stronger US dollar is also hurting the pair, as the downbeat market mood weighed on global stocks and the riskier Aussie. AUD/USD was last seen trading at 0.7533, posting a 0.21% gain for the day.

For technical aspect, RSI indicator 29 figures as of writing, suggesting that the pair is in oversold zone now, investors should be aware of a trend reversal. Looking at the Bollinger Bands, price is moving out of the bands so a strong trend continuation can be expected. In conclusion, we think market will be bearish as the pair just dropped below the previous support, and now it’s heading to test the 0.7379 support.

Resistance: 0.7478, 0.7556

Support: 0.7379, 0.7324, 0.7226


USDCAD (4- Hour Chart)

After ending in the negative territory yesterday, the pair USD/CAD rebounded on Tuesday and moved towards 1.240 area. The pair is currently flirting with the 1.2400 level, up about 0.28% on the day. USD/CAD was supported by stronger US dollar across the board and falling oil prices. Market focus now shifts to the OPEC+ and Fed meetings, as most analysts remain bullish on oil prices amid the rebound in global oil demand. On top of that, Canadian jobs data is scheduled to release this Friday, which is critical for early BoC rate hikes expectations.

For technical aspect, RSI indicator 55 figures as of writing, suggesting tepid bull movement ahead. As for the Bollinger Bands, price crossed above the moving average and keep climb upward, therefore, the upper band becomes the profit target. In conclusion, we think market will be bullish as the pair is trying to re-test the 1.2431 resistance, a break above that level will open the door for additional near-term profits.

Resistance: 1.2431, 1.2499, 1.2648, 1.2775

Support: 1.2288, 1.2157


Economic Data

Currency

Data

Time (GMT + 8)

Forecast

NZD

Employment Change (QoQ) (Q3)

05:45

0.4%

NZD

RBNZ Gov Orr Speaks

06:00

GBP

Composite PMI (Oct)

17:30

56.8

GBP

Services PMI (Oct)

17:30

58.0

EUR

ECB President Lagarde Speaks

18:15

BRL

BCB Copom Meeting Minutes

19:00

USD

ADP Nonfarm Employment Change (Oct)

20:15

400K

USD

ISM Non-Manufacturing PMI (Oct)

22:00

62.0

USD

Crude Oil Inventories

22:30

2.225M

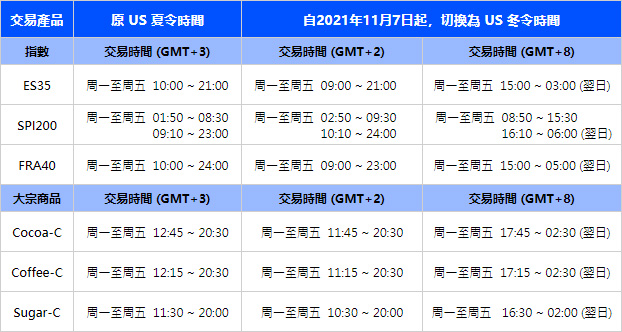
VT Markets The Adjustment Of DST

Dear Client,

Due to the end of U.S. Daylight Saving Time, the trading hours for the following products will change on November 7, 2021.

At the same day, the Server time will also change from GMT+3 to GMT+2.

Note: The above data is for reference only, the actual execution data may be changed, please refer to the MT4/MT5 software for details.

Friendly reminders:
1. Some trading products will not be available for trading on November 7, 2021 due to DST adjustment.

2. You can check the specifications on MT4/MT5 if you want to know the trading hours of products.

If you’d like more information, please don’t hesitate to contact [email protected].

Market Focus

Wall Street stocks rose slightly on Monday, continuing the recent record gains of major stock indexes. The S&P 500 Index rose 0.2%, the Dow Jones Industrial Average rose 0.3%, and the Nasdaq Index rose 0.6%. The gains pushed the three indexes above the all-time highs set on Friday. As U.S. crude oil prices rose 0.6%, more than 65% of the S&P 500 stocks rose, and energy companies led the gains, with a year-to-date increase of more than 75%. Exxon Mobil rose 1.8%. Companies that rely on consumers to directly consume goods and services constitute a large part of the index’s earnings. Tesla rose 8.5% and Starbucks rose 3.5%.

一張含有 文字 的圖片

自動產生的描述

More than half of the companies in the benchmark S&P 500 index have already announced their results. Analysts expect that by the time the report is completed, overall profits will increase by 36%. Another 167 companies in the index will report their performance this week. Investors will also pay attention to another Fed policy meeting, which is considering how to end the special support measures for the economy. The central bank will issue its latest statement on Wednesday. Besides, Investors will also get another update on the job market when the Bureau of Labor Statistics releases its report for October on Friday.


Main Pairs Movement:

Compared to the last trading of October, most currency pairs got some respite on Monday. The benchmark 10-year U.S. Treasury bond yield is trading sideways at around 1.5%, but investors are still concerned about the flattening yield curve.

The EUR/USD faced heavy bearish pressure last Friday and erased all gains after the European Central Bank (ECB) meeting on Thursday. On Monday, the currency pair finally found support near the 2021 low of 1.1524 in early October, and rebounded by about 0.58%, breaking through the 1.16000 level.

The cable traded around 1.3660, the lowest level since mid-October, and was pressured by the renewed concerns about Brexit and the overall strength of the U.S. dollar.


Technical Analysis:

EURUSD (4- Hour Chart)

The pair EUR/USD advanced on Monday, ending its slide that happened last Friday. The pair was trading lower in early Asian session and dropped to a daily low under 1.155 area. But the bearish momentum didn’t persist as the pair rebounded back above 1.157 level during European session. The recent strength witnessed in EUR/USD is manly due to weaker US dollar across the board, as the risk-on market sentiment put some pressure around the safe-haven US dollar and assisted the EUR/USD pair to move higher.

For technical aspect, RSI indicator 44 figures as of writing, suggesting tepid bear movement ahead. But for the MACD indicator, the negative histogram starts to diminish which indicates a possible upward trend for the pair. If we take a look at the Bollinger Bands, the price rises from the lower band after touching it, so the price might move up toward the moving average, which means that the bullish momentum is likely to persist. In conclusion, we think market will be bullish as long as the 1.1546 support holds. The pair is now heading to test the 1.1624 resistance line.

Resistance: 1.1624, 1.1669, 1.1692

Support: 1.1546, 1.1524


AUDUSD (4- Hour Chart)

The pair AUD/USD advanced on Monday, attracting some dip-buying and trading around daily tops at the time of writing. The pair was trading lower in early Asian session, but then started to see some buying and climbed toward 0.752 area. The US dollar struggled to preserve its modest intraday gains and pulled back below 94.00 level, which underpinned the riskier aussie and assisted the AUD/USD pair to find support. AUD/USD was last seen trading at 0.7533, posting a 0.21% gain for the day. Market focus now shifts to RBA’s interest rate decision, which is scheduled to release on Tuesday.

For technical aspect, RSI indicator 56 figures as of writing, suggesting tepid bull movement ahead. As for the MACD indicator, the negative histogram starts to diminish which indicates a possible upward trend for the pair. Looking at the Bollinger Bands, price is rising from the lower band and crossing above the moving average, as a result, the upper band becomes the profit target. In conclusion, we think market will be bullish as the pair is heading to test the 0.7556 resistance, a break above that level will open the door for additional near-term profits.

Resistance: 0.7556, 0.7618

Support: 0.7454, 0.7379, 0.7227


USDCAD (4- Hour Chart)

The pair USD/CAD declined on Monday as investors looked past Friday’s downbeat Canadian GDP print for August. The pair was trading higher during Asian session, but failed to preserve its bullish momentum. USD/CAD was surrounded by selling pressure and dropped to a daily low in American session. The higher oil prices continue to support the pair with expectations that OPEC+ will slowly increase oil production. On top of that, a more hawkish Bank of Canada pulled forward its expected timeline for interest rate hikes, acting as a tailwind for the domestic currency.

For technical aspect, RSI indicator 44 figures as of writing, suggesting tepid bear movement ahead. As for the MACD indicator, the negative histogram starts to diminish which indicates a possible upward trend for the pair. As for the Bollinger Bands, price dropped below the moving average and moved toward the lower band, which indicates a bear market. In conclusion, we think market will be bearish as long as the 1.2432 resistance line holds.

Resistance: 1.2432, 1.2499, 1.2648

Support: 1.2288, 1.2013


Economic Data

Currency

Data

Time (GMT + 8)

Forecast

JPY

BoJ Monetary Policy Statement

07:50

AUD

RBA Interest Rate Decision (Nov)

11:30

0.10%

AUD

RBA Rate Statement

11:30

EUR

German Manufacturing PMI (Oct)

16:55

58.2

Market Focus

Stocks ended at records on Friday as investors digested disappointing earnings results from Apple (AAPL) and Amazon (AMZN) that came during an otherwise solid quarterly reporting season from many major companies. The S&P 500 set record intraday and closing highs. The index posted monthly gain of over 6.5% in October, or its best single-month advance since November 2020. The consumer discretionary, energy and information technology sectors outperformed during the month. The Nasdaq also eked out a fresh record level, even as a couple of heavily weighted technology giants saw shares dip.

一張含有 文字 的圖片

自動產生的描述

Apple had seemingly avoided the chip shortage for months, but the company’s fortunes have now changed. On Apple Inc.’s quarterly earnings call Thursday, CEO Tim Cook was quick to tell investors and analysts that the company’s product shortages aren’t the result of a “fundamental error that we’ve made” and that its supply chain strategy didn’t create the current troubles.

Instead, he laid the blame on suppliers. While Apple designs its products in-house and relies on contract manufacturers like Foxconn Technology Group to assemble its devices, it’s dependent on hundreds of global suppliers to provide it with the parts and chips that make up an iPhone, iPad, Apple Watch or other device. If only one chip or part is in tight supply, Apple can’t build and ship that device. There lies the problem—not Apple’s scrutinized manufacturers in China, Cook seemed to imply.

It’s not surprising to see Cook defend Apple’s supply chain strategy. After all, he was the one who helped forge the partnership with Foxconn and build its supply chain empire two decades ago. If it were not for the current problems, Apple would have reported a record $90 billion for its fiscal fourth quarter. And instead of missing analyst expectations for total sales—as well as falling short in revenue from the iPhone, Mac and accessories—it probably would have had a clean sweep of beating Wall Street forecasts.


Main Pairs Movement:

The US dollar appreciated hugely on Friday as the market positions for the Fed’s meetings next week and amid higher US Treasury yield. The dollar index surged 0.83% at the end of the week, and the greenback beat all of its major rivals. The US Core Personal Consumption Expenditures accelerated 3.6% YoY in September, reaffirming the theory that the Fed will be forced to accelerate its monetary normalization plans, which, less than one week ahead of November’s meeting, has boosted demand for the USD.

The shared currency erased all of its gains against its rivals as the GDP figures appeared disappointing. The cable closed the day in the red, dropping 0.76% throughout the day. Commodity-linked currencies are also lost significantly against the greenback as well. And so does the USD/JPY pair.

Gold slid to $1783/ounce amid the broader dollar strength. Crude oil prices closed mixed, with WTI posted a modest gain to $83.28, and Brent dropped over 1% to $83.62 after Iran’s return to Joint Comprehensive Plan of Action (JCPOA), a nuclear agreement between Iran and some major countries, becomes possible.


Technical Analysis:

USDJPY (4- Hour Chart)

USDJPY gains positive traction after the release of the US PCE Price Index, trading at 114.0215. The US dollar revives as a strong pick up in the US treasury yields, boosting the demand for the greenback. From the technical perspective, USDJPY remains supportive on Friday after the pair trades above the midline of Bollinger Band. However, from a bigger outlook, the pair still maintains its bid tone as the October’s trend is still in the descending mood. Thus, it will be prudent to wait for a strong breakthrough. The pair will need to break above 114.699, the next resistance, in order to reverse its current trend. The RSI indicator has not reached the overbought territory, giving rooms for the pair to extend further north.

Resistance: 114.699

Support: 113.38, 112.57, 111.91


EURUSD (4- Hour Chart)

After the release of US inflation data, EURUSD push lower toward 1.1580 as the time of writing. From the technical perspective, EURUSD lost its upside momentum after attempting to contest the resistance at 1.1685 on Thursday. It can be viewed as a technical correction as the RSI indicator on the 4- hour chart is edging lower after reaching above 70, the overbought territory. The outlook of the currency pair turns bearish as it trades below the Simple Moving Averages. At the same time, bears are supported by the negative MACD. To the downside, the pair is expected to head toward the next immediate support level at 1.1524.

Resistance: 1.1624, 1.1685, 1.1735

Support: 1.1524


GBPUSD (4- Hour Chart)

GBPUSD is on the backfoot, trading below 1.3700, as the US dollar rebounds in the American trading session. From the technical aspect, the outlook of the currency pair remains downside as it falls within the lower bounce of Bollinger band and below the Simple Moving Averages. The RSI indicator returns below 50, suggesting that buyers remain hesitant when it comes to a steady advance. At the moment, the pair is heading to the next immediate support level at 1.3673; downside momentum continues to exist as the RSI has not yet reached the oversold territory, providing rooms for further southern move.

Resistance: 1.3735, 1.3835

Support: 1.3673, 1.3623, 1.3573


Economic Data

Currency

Data

Time (GMT + 8)

Forecast

CNY

Manufacturing PMI (Oct)

09:00

49.7

CNY

Caixin Manufacturing PMI (Oct)

09:45

50.0

GBP

Manufacturing PMI (Oct)

17:30

57.7

USD

ISM Manufacturing PMI (Oct)

23:00

60.4

Market Focus

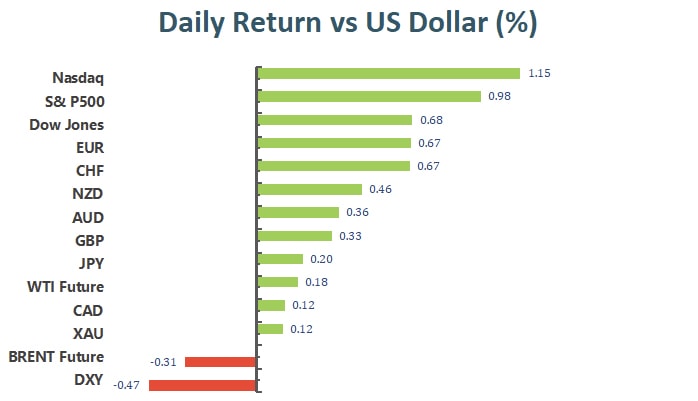
U.S. equity markets bounced back strongly on Thursday as upbeat economic data and stellar corporate earnings results boosted market sentiment. The S&P 500 gained 1% to close at another record high of 4596.42. The Nasdaq gained 1.4% to close at 15448.12, and the Dow gained 0.7% to close at 35730.48. Since earnings season began, 82% of the companies that make up the S&P 500 has been able to report earnings that beat analyst estimates.

The U.S. GDP grew by 2% ,quarter over quarter, marking the weakest quarter of growth since mid-2020. A surge in COVID cases and the supply chain crunch both hindered the growth over the past quarter. On the other hand, initial jobless claims figure hit a fresh pandemic low at 281,000.

The 10 year treasury yield increased slightly to settle at 1.578% and the 30 year treasury yield increased slightly as well to settle at 1.979%.

Facebook’s CEO, Mark Zuckerberg, has announced that, beginning on December 1st, Facebook will be rebranded as Meta Platforms Inc and will be switching the ticker FB to MVRS. The new parent company will be devoted to creating a more immersive experience of the world wide web by combining virtual reality and building a virtual world where all media sources can be combined and utilized.


Main Pairs Movement:

The Greenback declined sharply at the onset of Q3 GDP data release. The U.S. recorded a 2% growth in GBP, quarter over quarter, weaker than analyst estimates. Despite record low jobless claim figures, the Dollar continued to dive as the DXY hit the intraday low of around $93.

The Japanese Yen weakened as BoJ’s Haruhike Kuroda reiterates the central bank’s dovish monetary policy, despite inflation rising to a 13 year high in the month of September. The Euro traded higher against the Greenback, mainly due to the Dollar’s weakness as the ECB left monetary policy unchanged. The Sterling traded lower against the Dollar as well due to across the board Dollar weakness.


Technical Analysis:

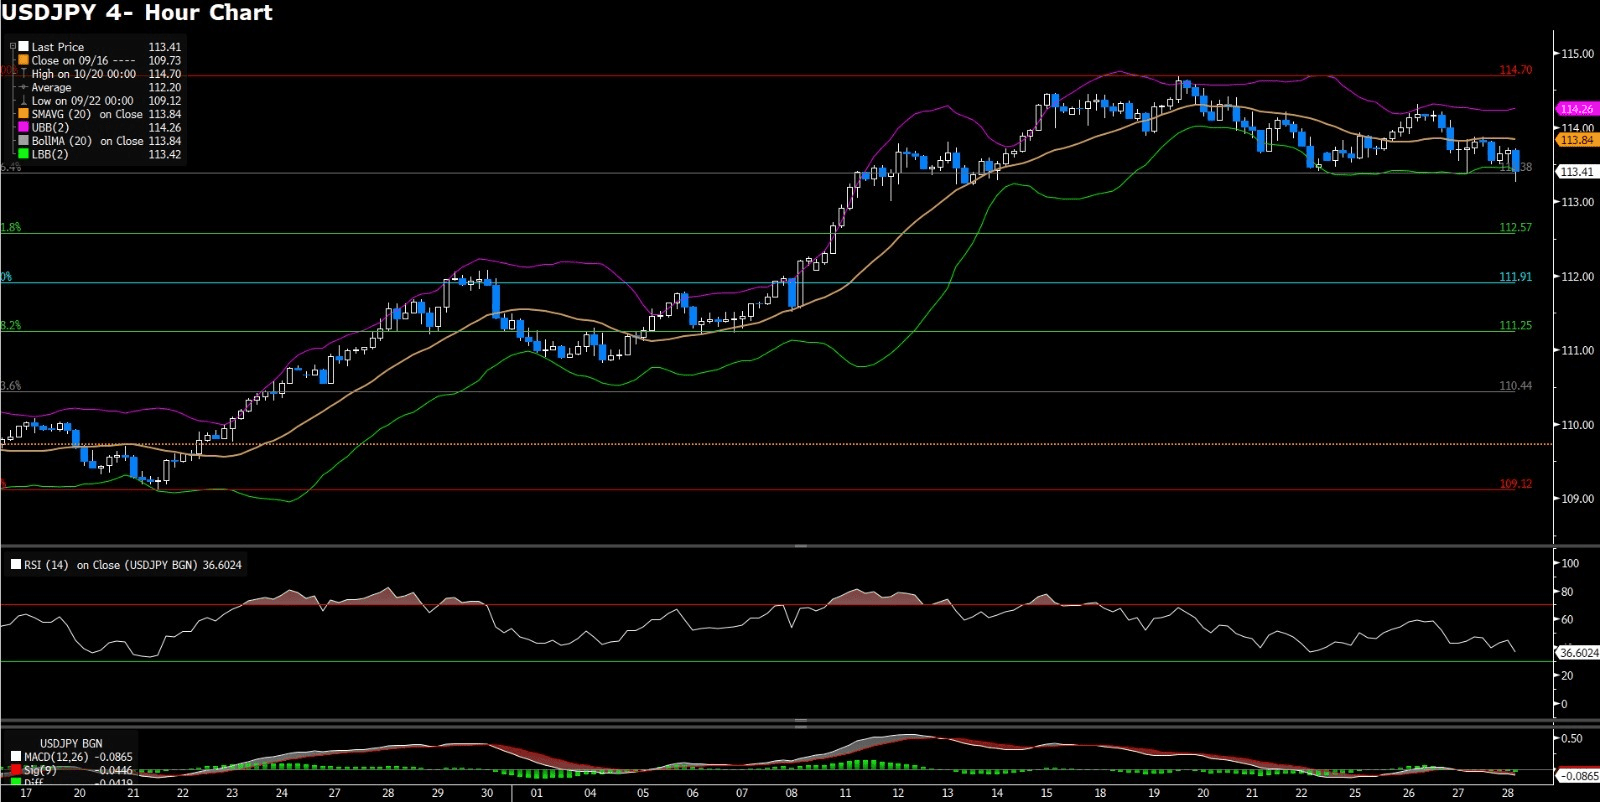
USDJPY (4- Hour Chart)

USDJPY hangs near two week lows, trading around 113.41 as the time of writing. After Bank of Japan’s Haruhiko Kuroda’s comment on the outlook of Japan’s GDP and inflation, the currency pair witnesses some selling pressure. From the technical perspective, USDJPY remains depressed, hovering near the lower bound of Bollinger band and trading in the descending trend. However, the immediate support level at 113.38 would be a possible turning point as the RSI indicator has nearly reached the oversold territory, currently at 36.6 mark, giving the pair rooms to rebound; at the same time, the MACD is nearly flat, indicating a possible direction change from sell to buy.

Resistance: 114.70

Support: 113.38, 112.57, 111.91


EURUSD (4- Hour Chart)

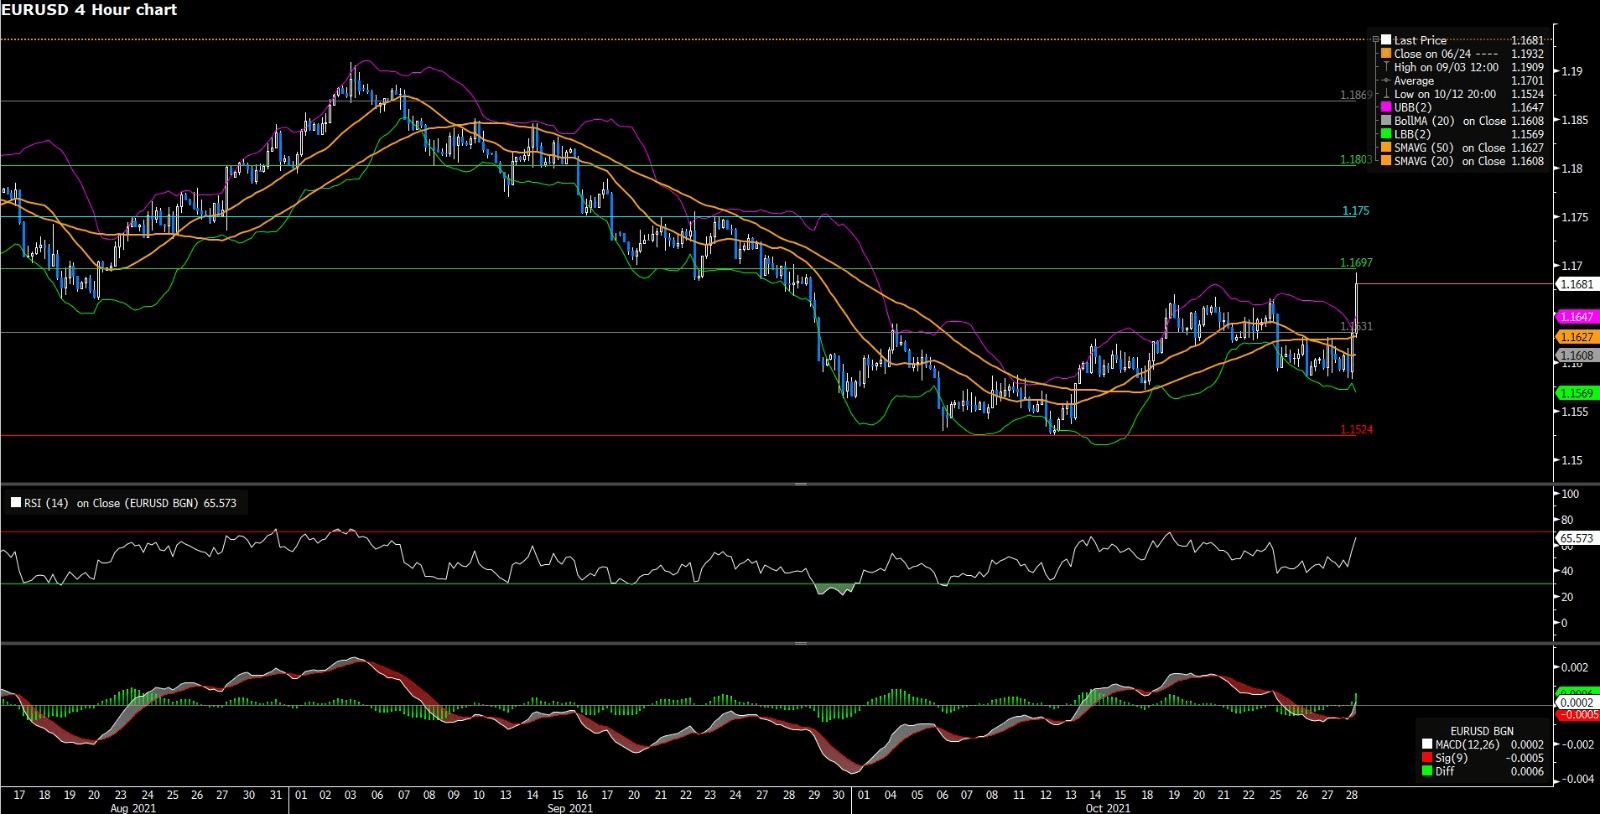
EURUSD trades monthly highs above 1.1680 as the US dollar sell- off picks up steam. The US dollar loses strength, having a hard time finding demand after ECB’s cautious tone on European inflation outlook. From the technical aspect, the 4- hour chart outlook for EURUSD provides a mildly bullish stance since mid- October. Today’s bullish move has breached the monthly highs, providing some supports to bulls. At the same time, the pair has recovered above its 20 Simple Moving Average, indicating a neutral- to- bullish trend. At the moment, the pair is heading to its next immediate resistance at 1.1697, where would be an obstacle to overcome as the RSI has nearly reached the overbought condition and the currency pair has traded above the upper band of Bolliger band. If EURUSD can successfully breached the resistance level, then it will head toward the next level at 1.175; on the contrary, if the pair fails to penetrate the level, it will possibly consolidate for an adjustment.

Resistance: 1.1697, 1.1750, 1.1180

Support: 1.1631, 1.1524


GBPUSD (4- Hour Chart)

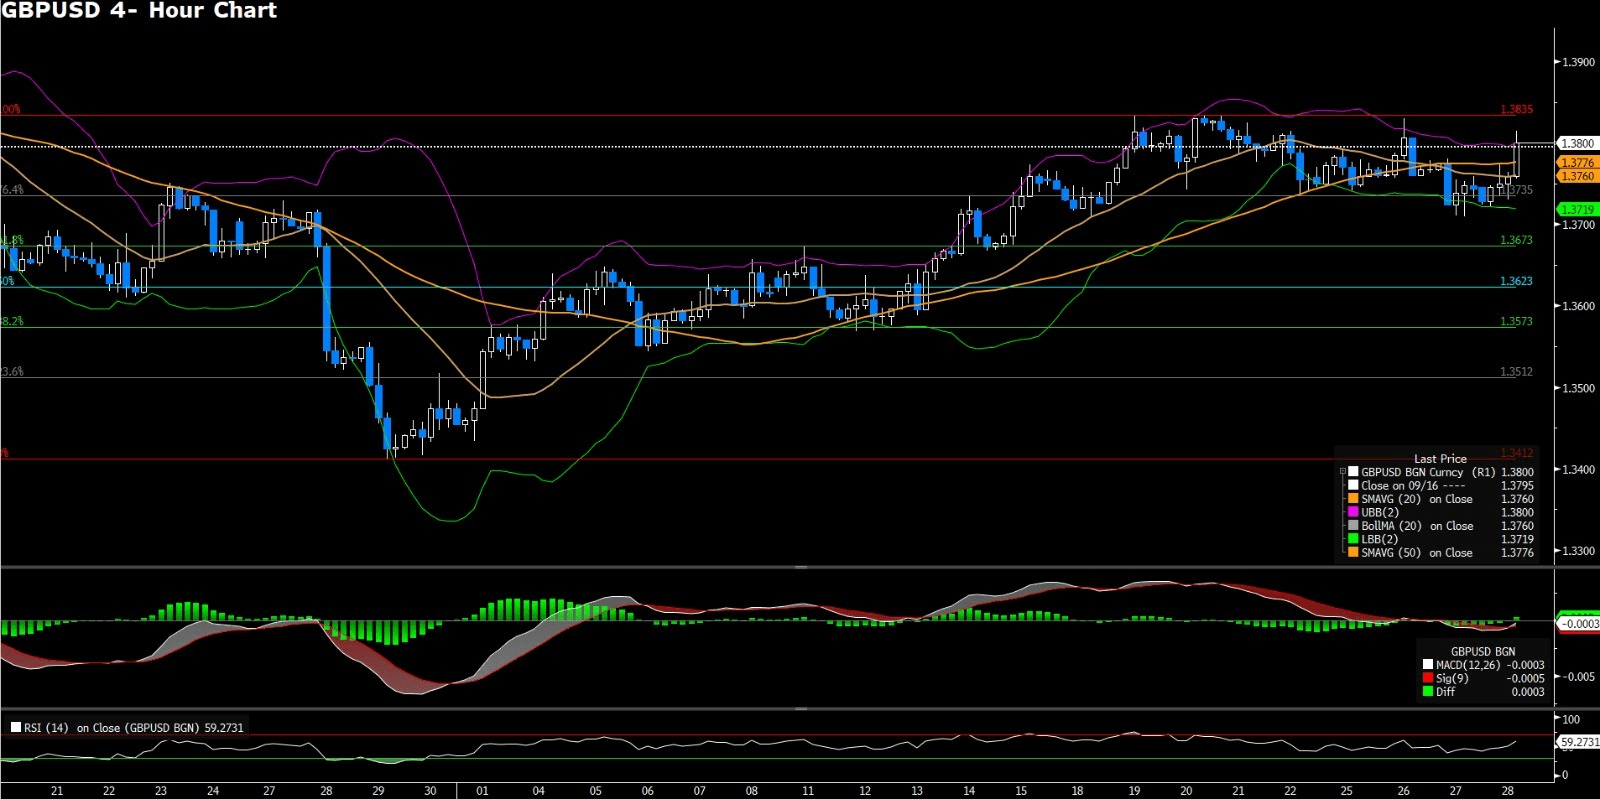
GBPUSD extends, trading around 1.3800 region, as the US dollar loses traction after the disappointing Q3 GDP data. From the technical perspective, despite the recent recovery, the currency pair remains downside, trading in the descending trend. However, the pair still has potential to move further north as the RSI is only in the 59 level, having plenty of rooms to extend further. The short- term bulls are supported as the pair has traded above the 20 Simple Moving Average as the time of writing. To the upside, if the pair can break the next immediate resistance at 1.3801, then the bullish momentum would have a chance to bring the pair further toward 1.3835.

Resistance: 1.3801, 1.3835

Support: 1.3735, 1.3673, 1.3623


Economic Data

Currency

Data

Time (GMT + 8)

Forecast

AUD

Retail Sales (MoM) (Sep)

08:30

0.2%

EUR

German GDP (QoQ) (Q3)

16:00

2.2%

EUR

CPI (YoY) (Oct)

17:00

3.7%

CAD

GDP (MoM) (Aug)

20:30

0.7%

VT Markets The Adjustment Of Weekly Dividend Notification

Dear Client,

Warmly reminds you that the component stocks in the stock index spot generate dividends. When dividends are distributed, VT Markets will make dividends and deductions for the clients who hold the trading products after the close of the day before the ex-dividend date.

Indices dividends will not be paid/charged as an inclusion along with the swap component. It will be executed separately through a balance statement directly to your trading account, the comment for which will be in the following format “Div & Product Name & Net Volume ” .

Please note the specific adjustments as follows:

Note: The above data is for reference only, the actual execution data may be changed, please refer to the MT4/MT5 software for details.

If you’d like more information, please don’t hesitate to contact [email protected].

Back To Top
server

Hello there 👋

How can I help you?

Chat with our team instantly

Live Chat

Start a live conversation through...

  • Telegram
    hold On hold
  • Coming Soon...

Hello there 👋

How can I help you?

telegram

Scan the QR code with your smartphone to start a chat with us, or click here.

Don’t have the Telegram App or Desktop installed? Use Web Telegram instead.

QR code