Market Focus

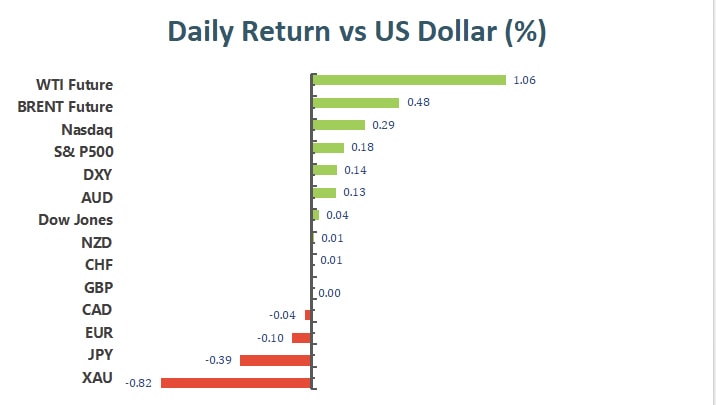
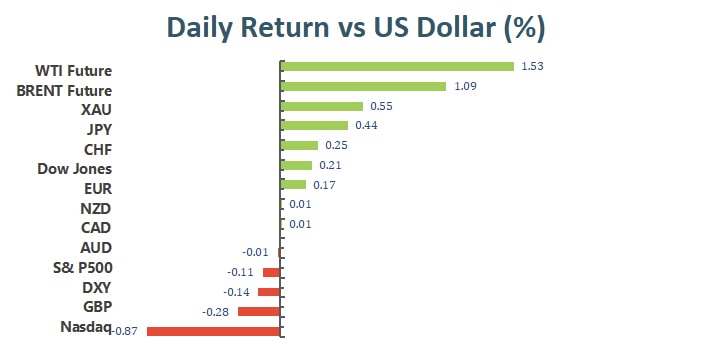
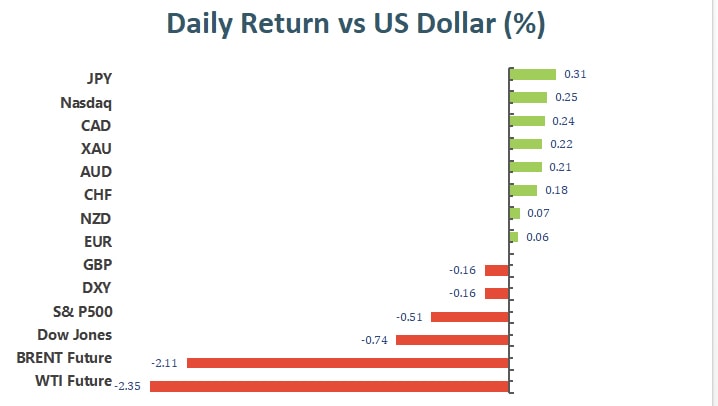
The broad U.S. equity markets retreated on Wednesday’s trading. Indices fell from their previous record closes. The S&P 500 lost 0.51% to close at 4551.68, the Dow lost 0.74% to close at 35490.69, and the Nasdaq traded sideways to close at 15235.84.

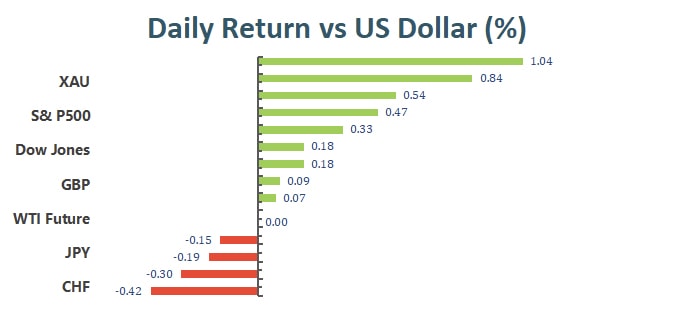
Wednesday’s market retreat was led by the energy sector as oil prices saw its largest single day decline in more than two months. The WTI December future dropped 0.56% as the U.S. reported a larger than expected rise in oil inventory; on the other hand, the Brent Crude December future dropped 0.45%, as well.

The U.S. 10 year treasury yield dropped to 1.54%, while the 30 year treasury yield settled at 1.948%.

一張含有 文字 的圖片

自動產生的描述

Apple Inc, Amazon Inc, and Samsung are due to report their quarterly earnings on the 28th.

The bank of Canada announced major changed to the quantitative easing measures. The BoC announced the end its bond buying program and an accelerated time table for rate hikes as the Bank expresses its fear of continued inflation amid supply chain disruptions.
  

Main Pairs Movement:

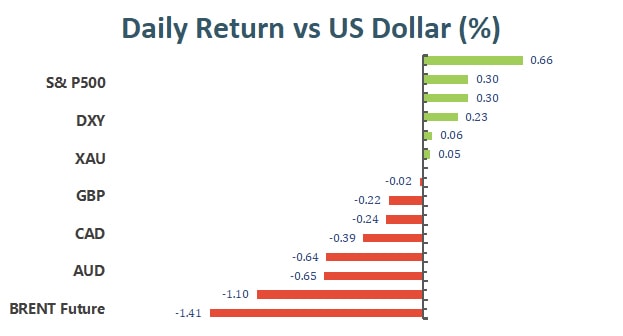
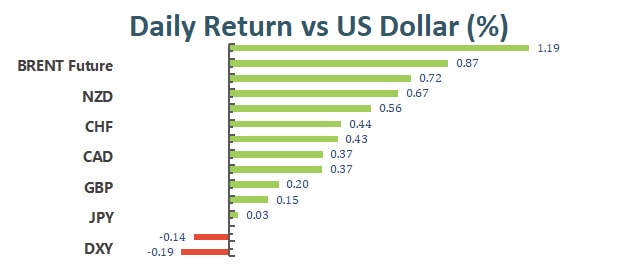
The Greenback depreciated slightly against other currencies as the Dollar Index closed 0.11% lower. Speculators will now turn their attention to the key economic data, the ECB monetary policy decision and the U.S. initial jobless claim report, which are due on the 28th.

The Yen continued to decline against the Dollar, but the BoJ is due to provide monetary policy updates, on the 28th, which will provide price actions for the pair. The Aussie dollar continued its second straight day of gains against the Euro as global energy continues to rise and upbeat inflation figures from the Australian central bank. The BoC’s firm hawkish stance, as it announced the end to quantitative easing, fueled the Loonie to gain 0.24% against the Dollar.


Technical Analysis:
USDJPY (Daily Chart)

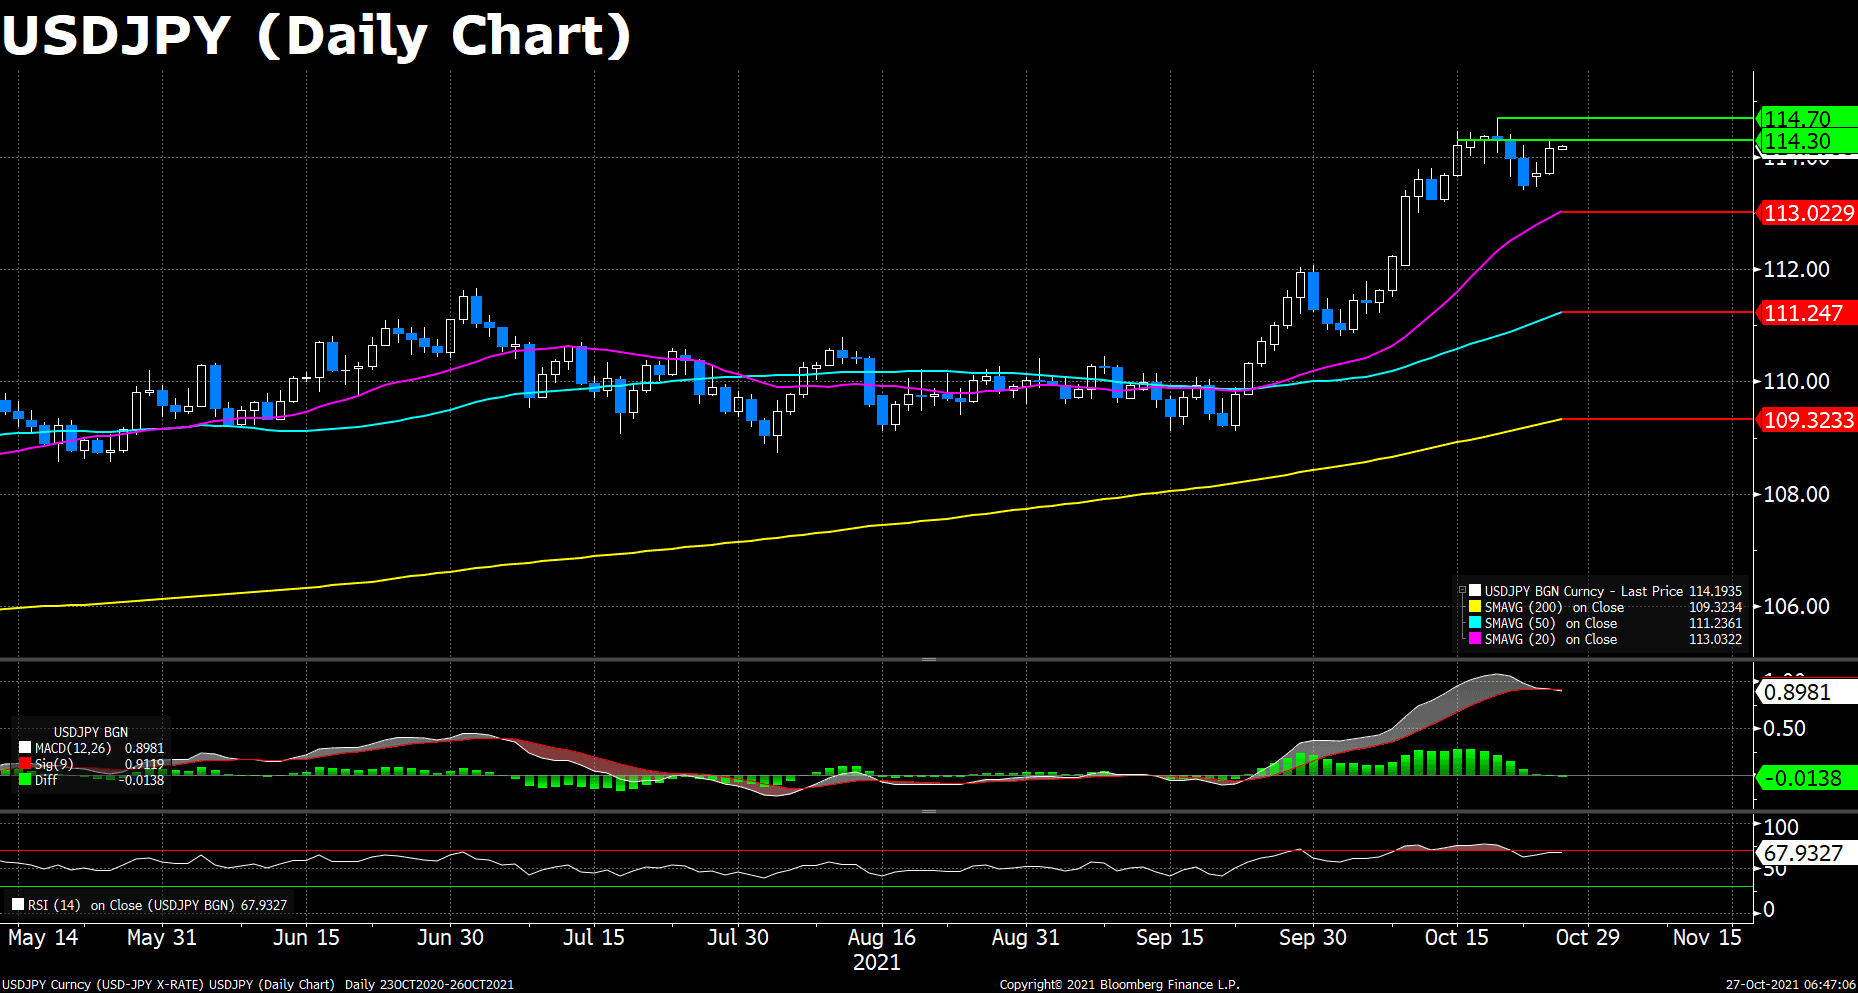
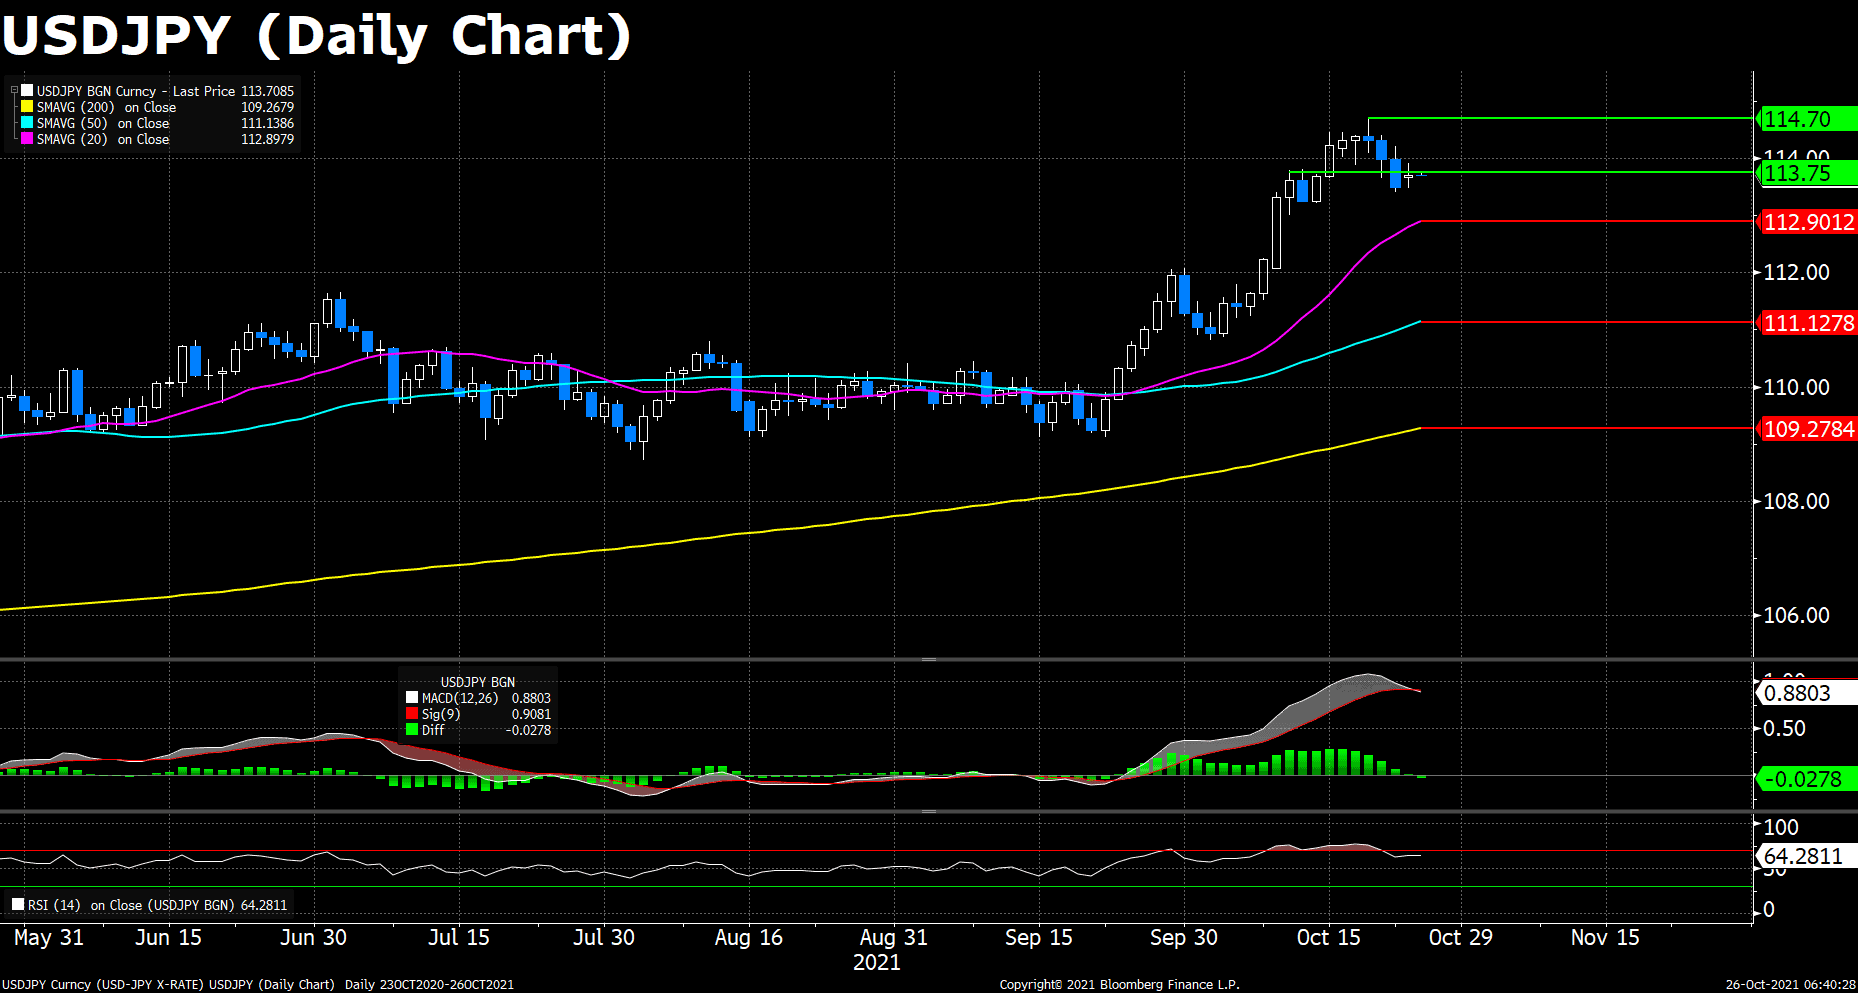
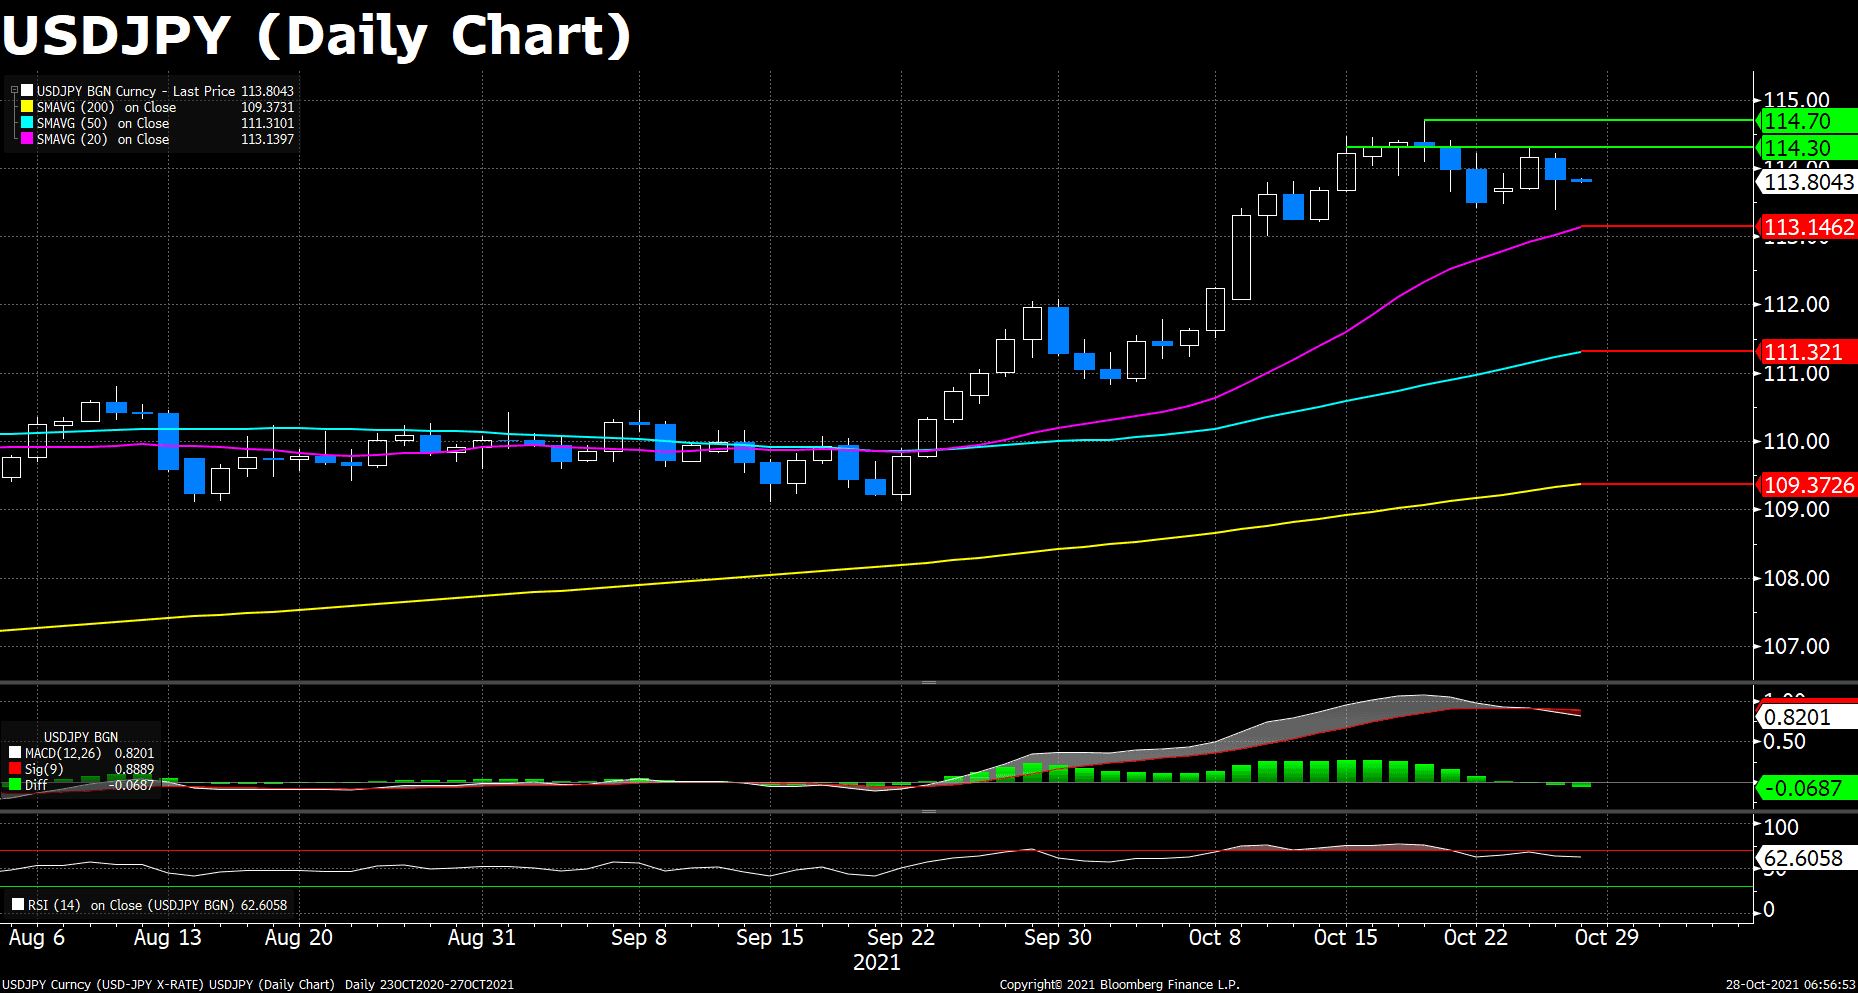
The USD/JPY pair underwent a sudden selling pressure on Wednesday amid the dollar’s weakness, as the US treasury yields plummeted during the day. The pair dived below the 114.00 threshold since the start of the European session, and bottomed at 113.39, the lowest level of the week. However, after the decision of the Bank of Canada to end its QE program released, the US bond yields surged and triggered a spike in USD/JPY to 113.83.

After the prolonged risk-on mood, the concerns about the central banks’ contraction moves have finally been bubbling up across the market. The rally of the equities slows down, and even in some regions their equity prices start to fall, benefiting the save-haven Japanese Yen. However, as long as the Bank of Japan remain silent about its monetary policy on Thursday’s meetings, the depreciation of the yen should proceed, as the Fed’s taper is on the schedule, which will keep lifting the value of the USD in the short future.

On the technical front, the daily MACD histogram turned slightly negative on Wednesday, and the RSI indicator still lingers below the overbought territory, suggesting the upward tractions are still under pressure. The 114.00 threshold again comes to our eyes, and the key resistance level for further uptrend at 114.30 is the next barricade to pass. If breached, then a fresh yearly high could be anticipated.

Resistance: 114.00, 114.30, 114.70

Support: 113.15, 111.32, 109.37
  

EURAUD (Daily Chart)

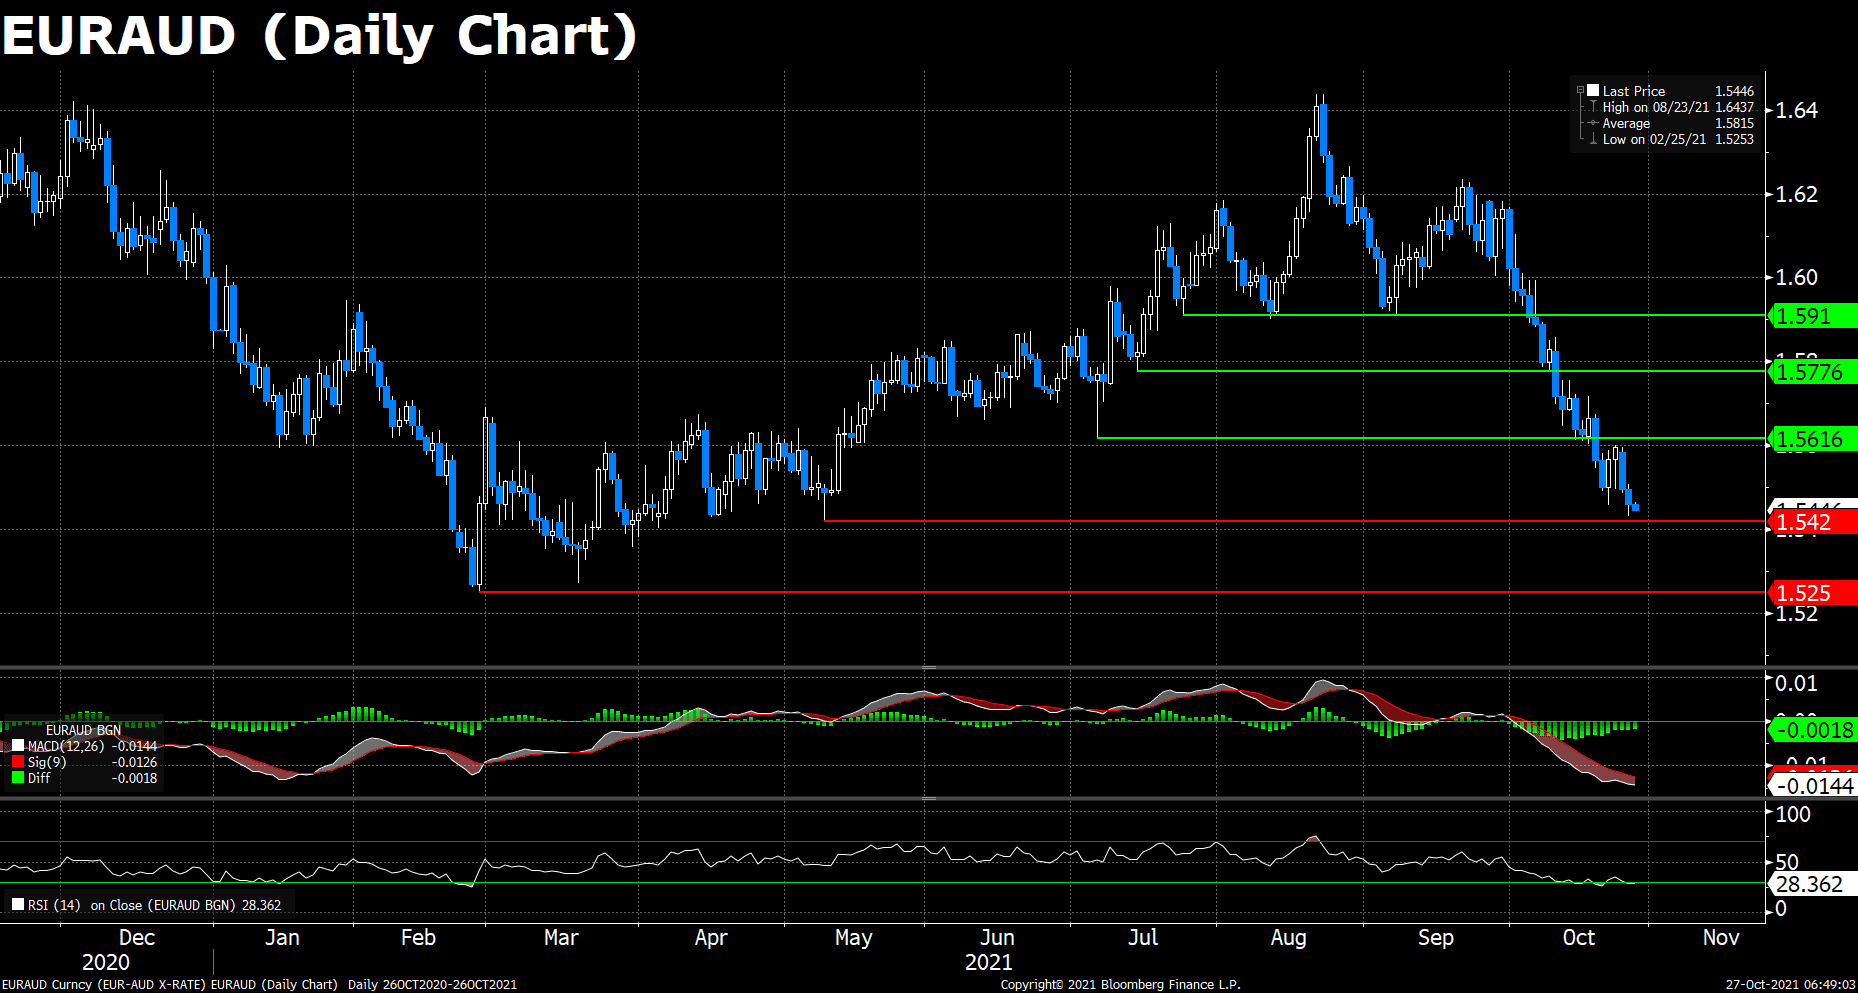
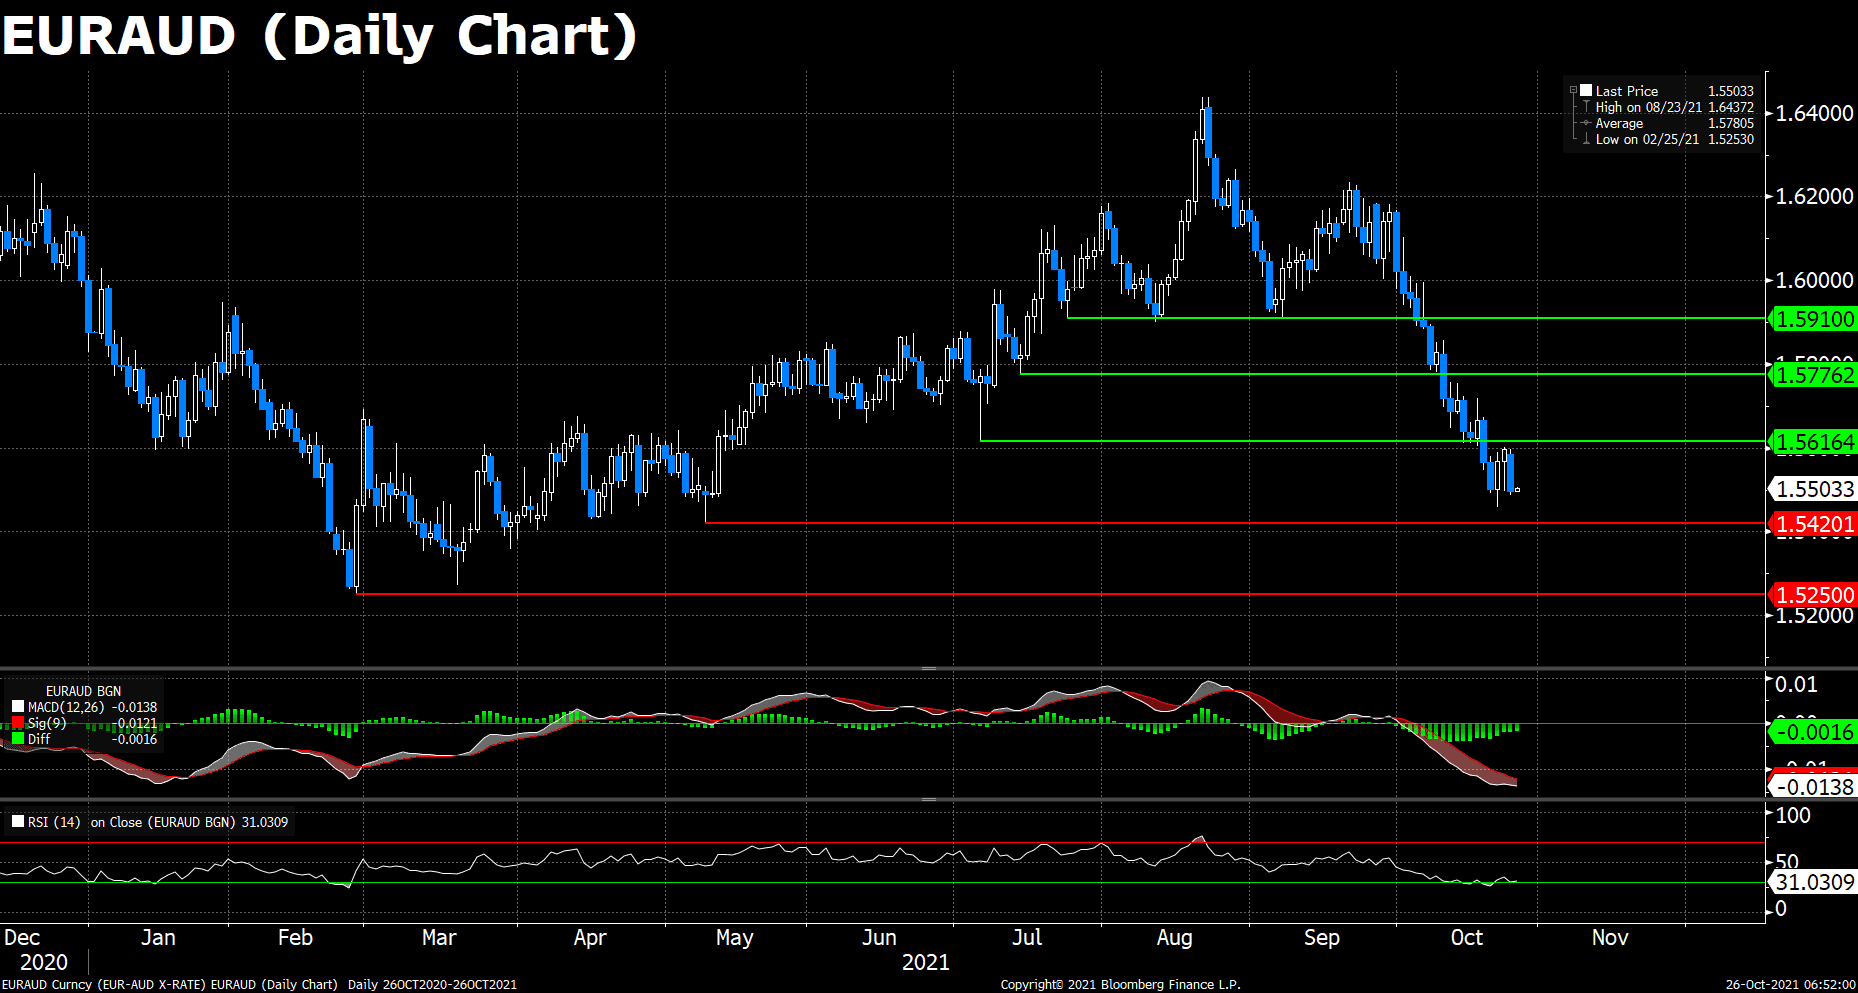
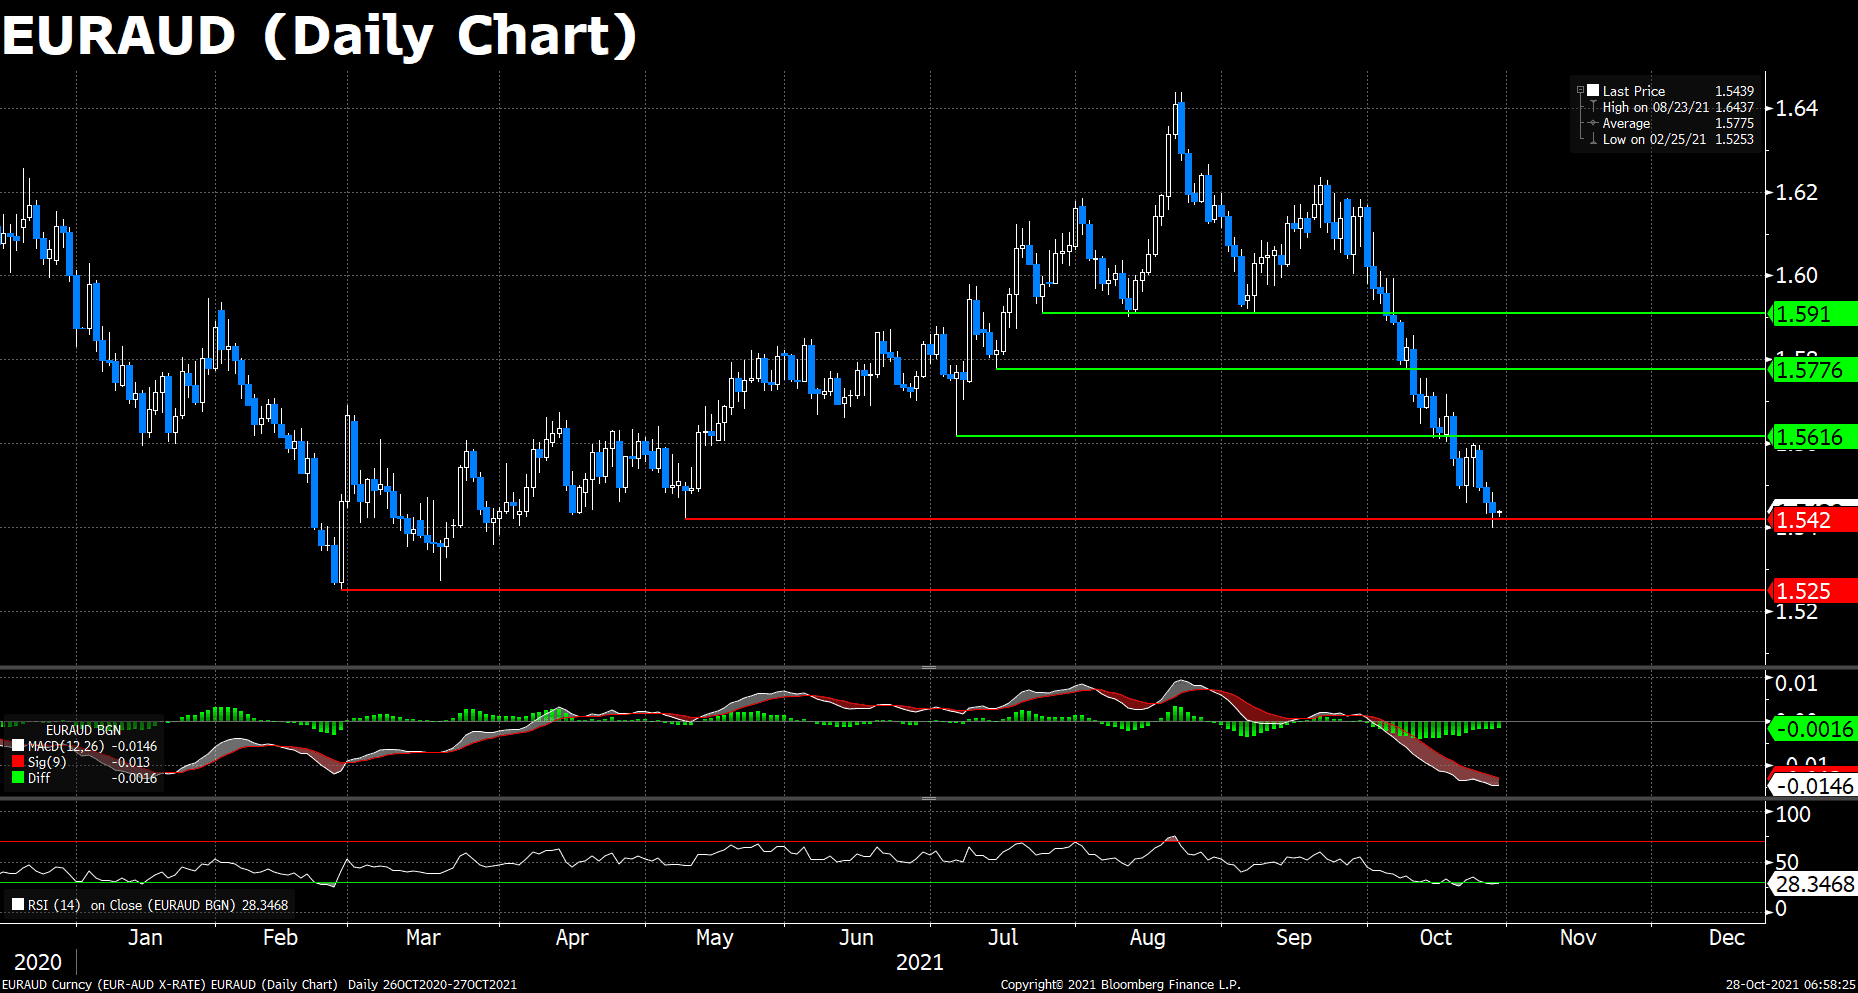
The EUR/AUD pair declined for a third consecutive day on Wednesday amid the flat EUR and the strong AUD, and now hovers around the key support level 1.5420, where the lows last seen in May sit.

The market mood got cautious on Wednesday. Mineral prices closed mixed, trimming the strength of the commodity-linked AUD. The investors are looking for direction with all eyes on the ECB’s monetary policy decision, though it is expected to maintain its bond-purchasing plan unchanged and the interest rate near zero despite the persistently high inflation, to avoid tensions in some peripheral markets.

On the technical aspect, the MACD histogram remains in the bearish territory, suggesting the selling stream of the cross may proceed. However, the RSI indicator dived deeper into the oversold region, the growing pressure for sellers may trigger a short-term correction in the very near term, especially if ECB pops up some surprise during the upcoming meetings. On the downside, the May’s low 1.5420 would be a strong support against the bears, followed by 1.5250, the yearly low.

Resistance: 1.5616, 1.5776, 1.5910
Support: 1.5420, 1.5250


USDCAD (Daily Chart)

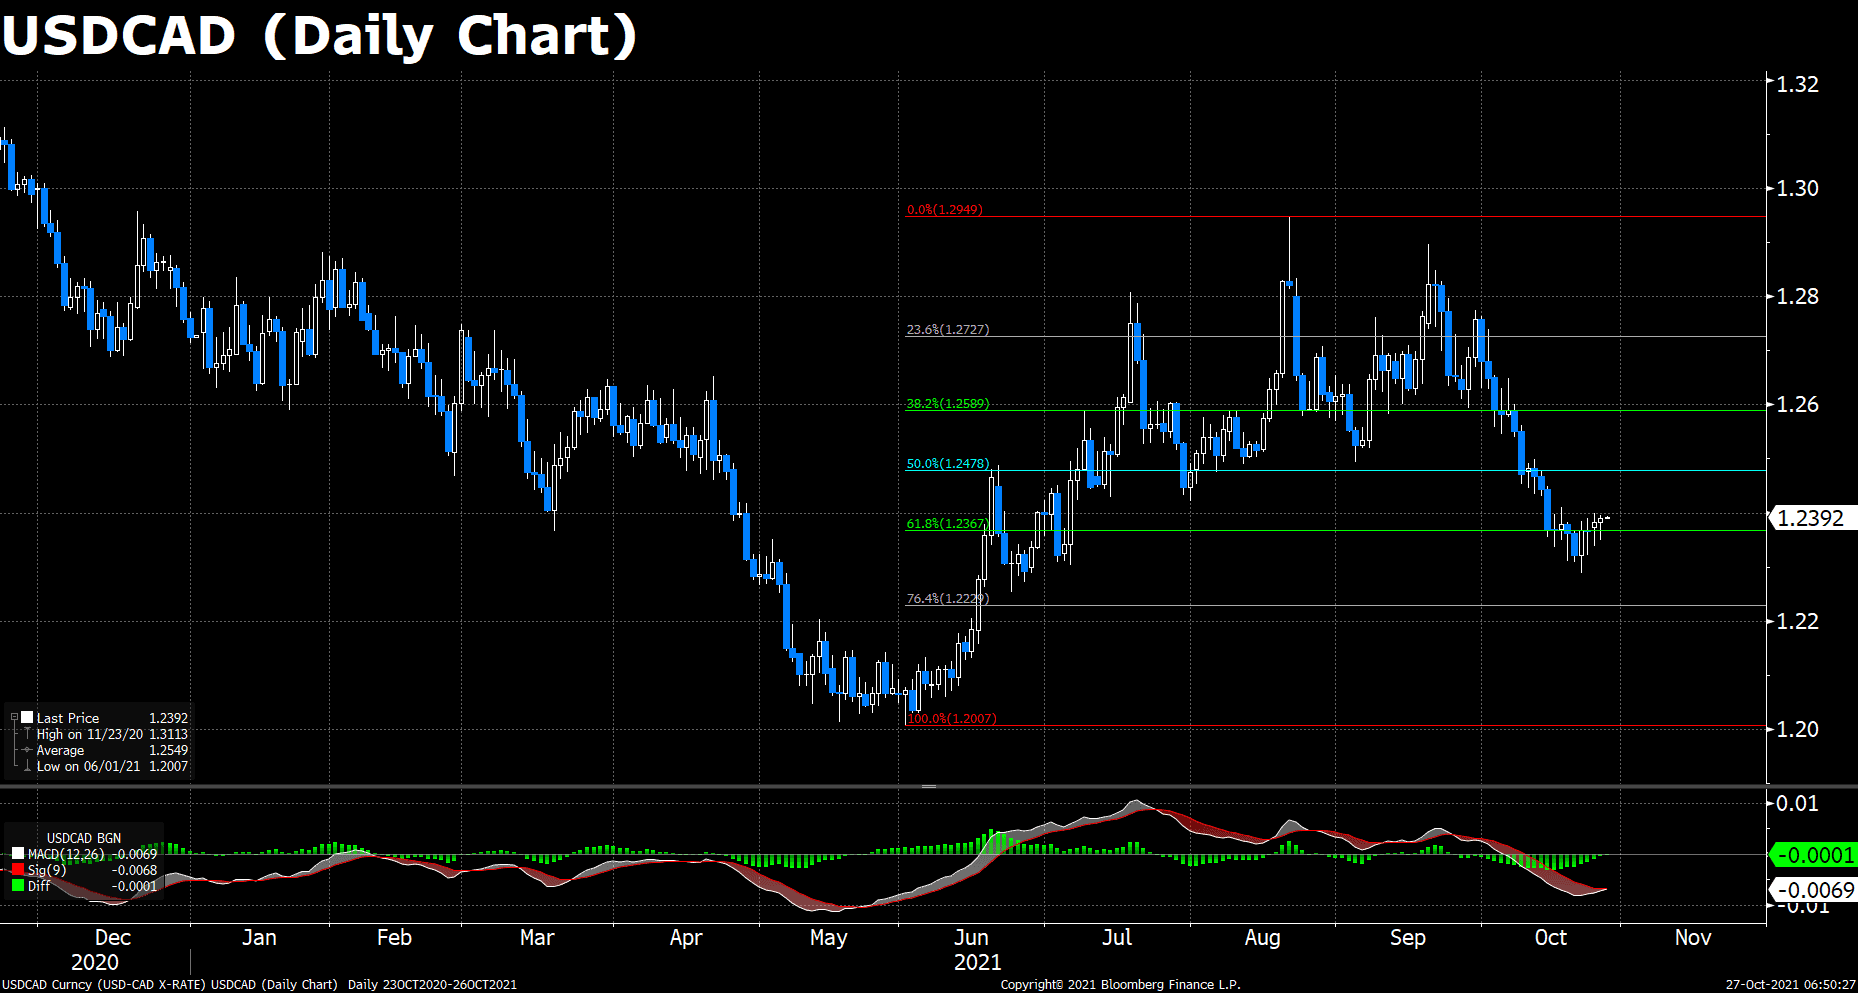
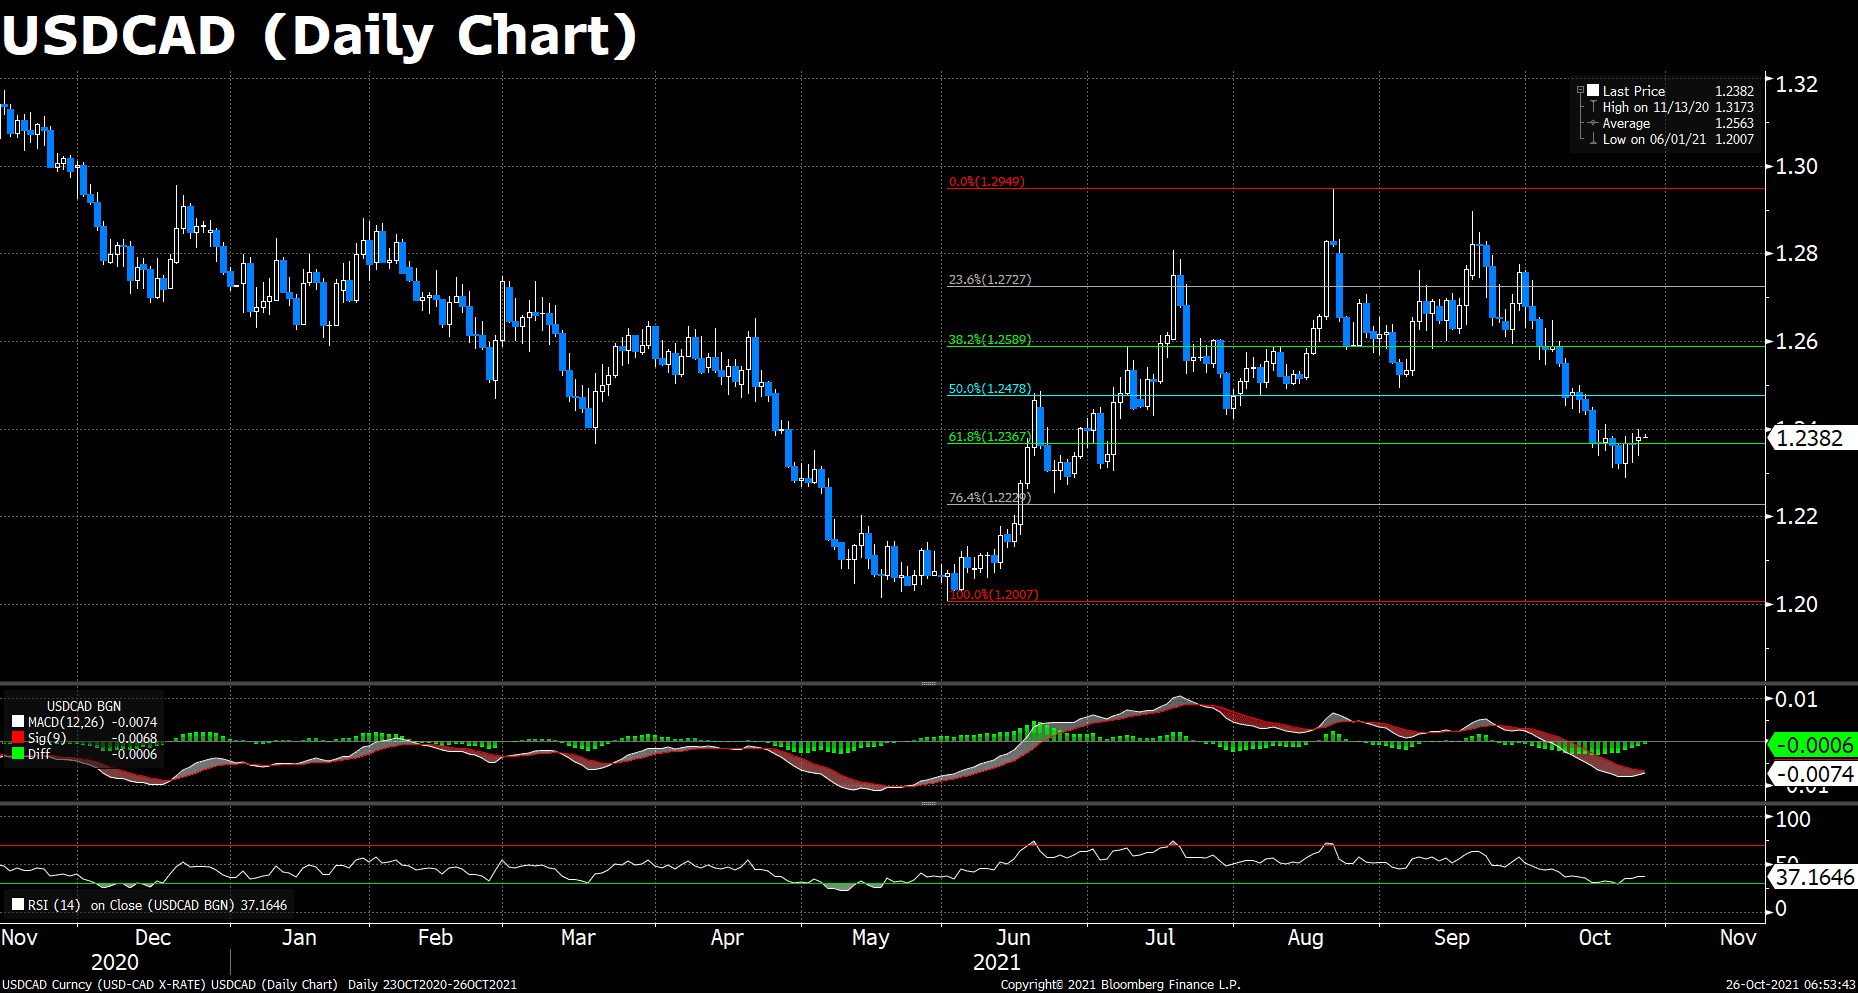
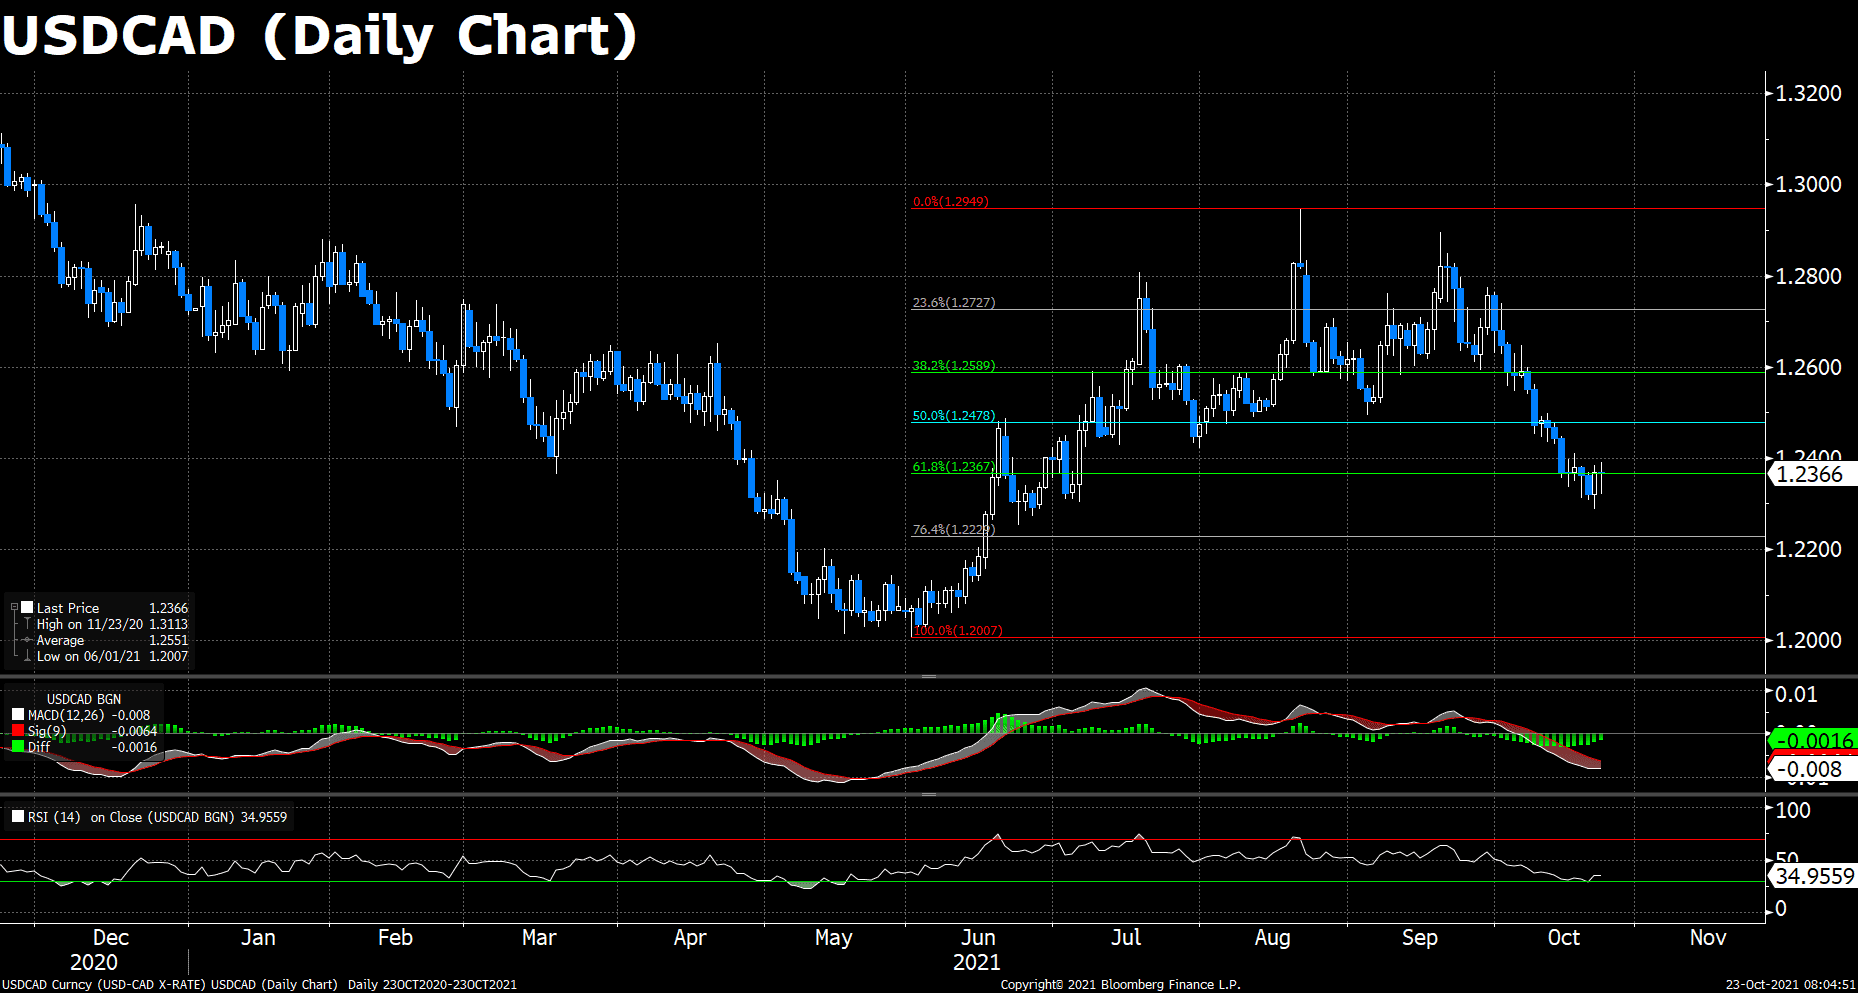
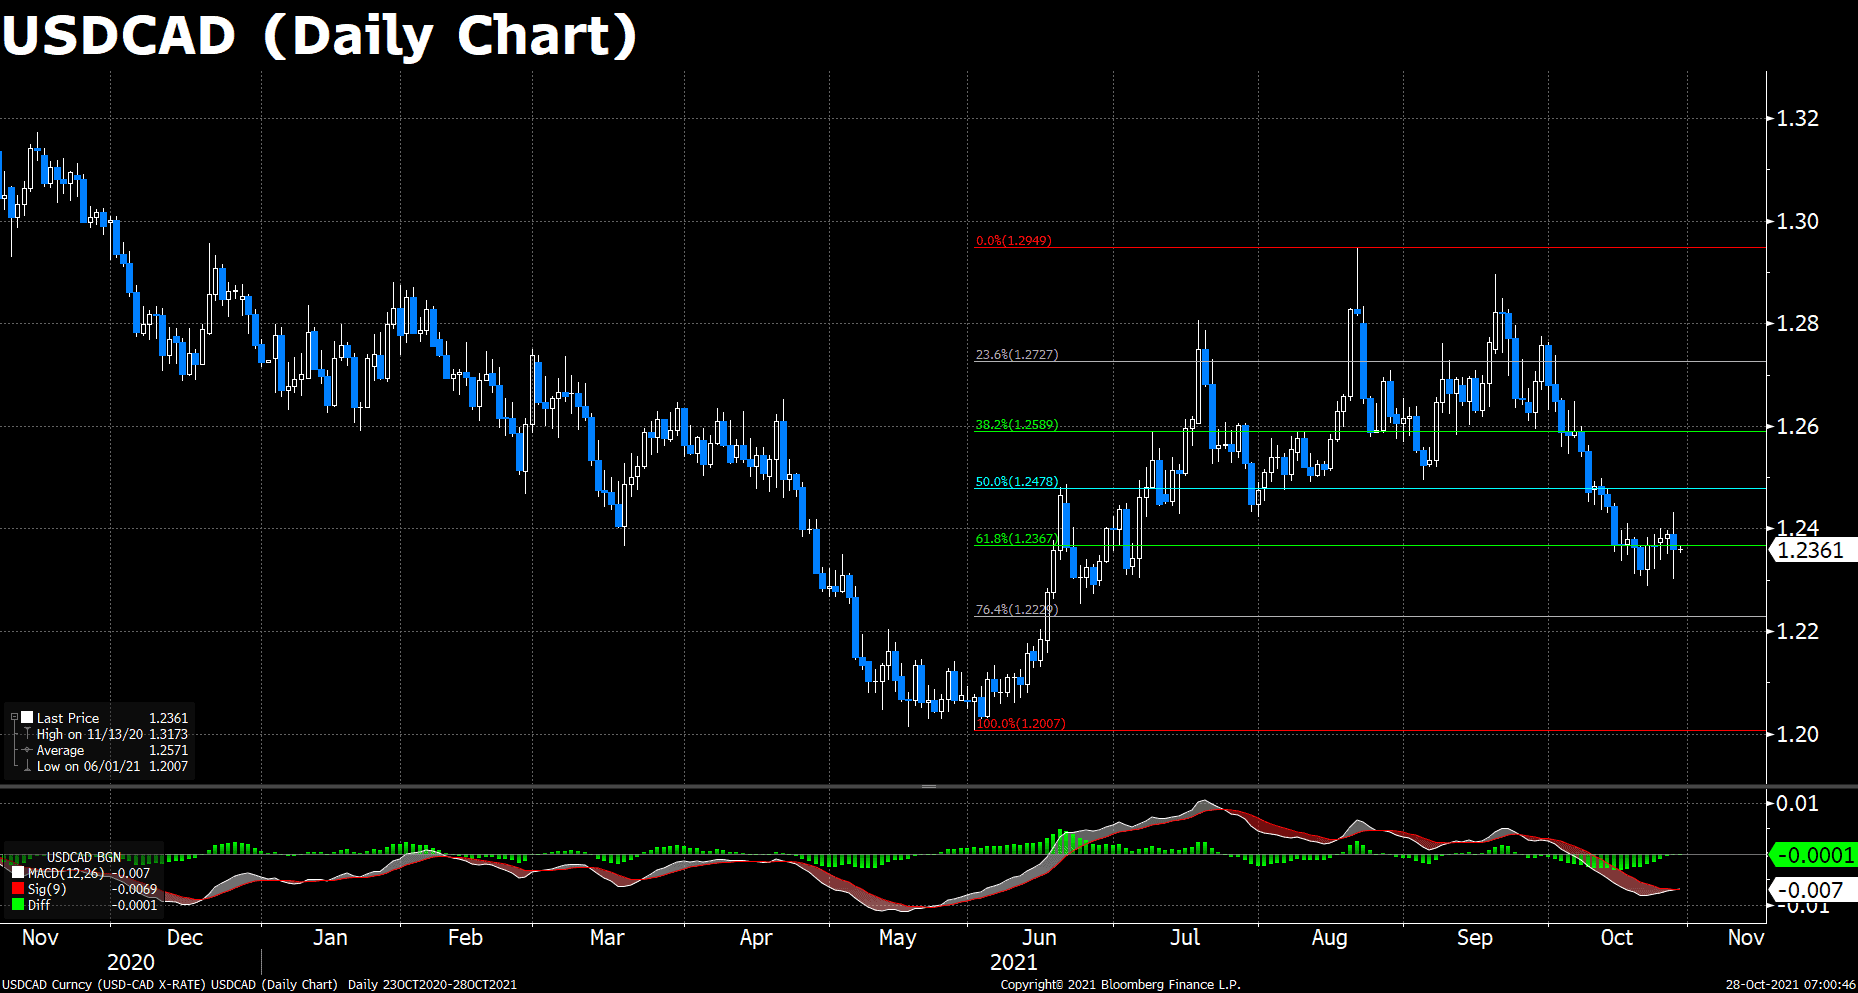
The USD/CAD slumps for the first time in the week, down 0.25%, trading at 1.2360 during the late New York session at the time of writing. Earlier 30-minutes into the Wall Street opening, the Bank of Canada released its monetary policy decisions announcing the ending of its QE program, which was well expected to be a reduction instead of a halt.

Before the announcement, the pair climbed above the 114.00 threshold and settled around the 1.2430 level, but soon plummeted over 130 pips after the release of the report, marking a daily low at 1.2300. However, the pair was soon back to its upward trajectory, posting a 60 pip recovery at the moment.

On the technical front, the daily MACD histogram is almost going to form a golden cross, while the RSI indicator is still under the bearish levels, though improving. The price actions are still hovering around the 61.8% Fibonacci. Looking forward, the US GDP reports is going to release within hours. The pair may regains 114.00 with a boost by the upbeat news of the US.

Resistance: 1.2478, 1.2727, 1.2949

Support: 1.2229, 1.2007


Economic Data

Currency

Data

Time (GMT + 8)

Forecast

JPY

BoJ Monetary Policy Statement

11:00

JPY

BoJ Outlook Report (YoY)

11:00

 JPY

BoJ Press Conference

14:30

EUR

German Unemployment Change (Oct)

15:55

-20K

EUR

Deposit Facility Rate (Oct)

19:45

-0.5%

EUR

ECB Marginal Lending Facility

19:45

EUR

ECB Monetary Policy Statement

19:45

EUR

ECB Interest Rate Decision (Oct)

19:45

USD

GDP (QoQ) (Q3)

20:30

2.7%

USD

Initial Jobless Claims

20:30

290K

EUR

ECB Press Conference

20:30

USD

Pending Home Sales (MoM) (Sep)

22:00

0.5%

Market Focus

The broad U.S. equity market enjoyed another session of gains fueled by healthy corporate earnings. The S&P 500 and the DJIA notched another record close—the S&P 500 gained 0.18% to close at 4574.79, while the DJIA gained 0.04% to close at 35756.88; on the other hand, the tech heavy Nasdaq gained 0.06% to close at 15235.71. The combination of healthy corporate earnings and rising consumer confidence provides a much needed boost to market sentiments.

Facebook, however, reported earnings that missed analyst estimates. Facebook attributes this quarter’s poor performance to Apple’s revised privacy rules, which have hindered Facebook’s advertisement revenue. Facebook’s share price slid 3.9% after Tuesday’s trading session. Meanwhile, Google reported its highest sales growth in more than a decade and nearly doublings its profit in Q3. Google has attributed strong profit growth to an accounting change that has reduced Google’s depreciation figure thus helping its bottom line.

Coca-Cola, McDonald’s Corp. and Boeing Co. will headline earnings release for 27th.

一張含有 文字 的圖片

自動產生的描述

The U.S. 10 year treasury yield trended lower to 1.618%. The VIX trended slighly higher to 15.98.


Main Pairs Movement:

U.S. consumer confidence rose for the month of October after three straight months of decline. U.S. September new home sales figures also beat analyst estimates and rose for the month of September. The combination of two surprisingly positive economic data has buoyed the Greenback as the Dollar index gained 0.15%.

The Japanese Yen continues to decline against the dollar as market sentiments continue to improve. The Japanese Central Bank’s dovish stance provides no support to the Yen as the Fed continues to turn hawkish. The Euro fared worse against the Aussie dollar as global commodity prices continue to favor the Australian economy. The loonie declined against the dollar as the Greenback gained steam from better than expected economic data.


Technical Analysis:

USDJPY (Daily Chart)

The USD/JPY pair maintains a moderate bullish momentum on Tuesday, extending its rebound from the 113.40 low hit last Friday. The pair has breached the 114.00 threshold, with the current risk-on mood weighing on the safe-haven JPY, before capped by resistance at 114.30 area.

The Japanese yen has opened the week on a soft tone on the back of a moderate appetite for risk with quarterly earnings reports triggering advances in the world’s major equity markets. Moreover, investors in general don’t hold out much hope on the Bank of Japan’s meetings on Thursday, as their monetary policy policies have long been unchanged. This may further add negative pressure on the yen, especially when it’s compared to the Fed’s hawkish statements.

On the technical front, the daily MACD histogram seesaws around the neutral zone, and the RSI indicator lingers right below the overbought territory, suggesting the upward tractions have encountered some pressures. The key resistance level for further uptrend is at 114.30. If breached, then a fresh yearly high could be anticipated.

Resistance: 114.30, 114.70

Support: 113.02, 111.24, 109.32


EURAUD (Daily Chart)

The EUR/AUD cross extended its Monday’s loss on Tuesday, and now traded just one step ahead of the key support level 1.5420, where the lows last seen in May sit. After plummeting in the early Asian session, EUR/AUD consolidated drastically within a modest range between 1.5430 to 1.5495. The pair once bounced off the intraday high at 1.5493, but soon failed to find buyers and dipped to the lower price levels amid the American hours.

The market mood remained positive on Tuesday, but leaving some cautious sentiments at the end of the Wall Street trades. Euro posted red against its Australian peers due to the commodities’ price hike. Attentions now shifted to the Australian inflation figures due hours later, and looming ECB meeting on Thursday is also well-anticipated.

On the technical aspect, the MACD histogram remains in the bearish territory, suggesting the selling stream of the cross may proceed. However, the RSI indicator has crossed over the oversold region, indicating a short-term correction may occur before the pair continues its downtrend. On the downside, the May’s low 1.5420 would be a strong support against the bears, followed by 1.5250, the yearly low.

Resistance: 1.5616, 1.5776, 1.5910

Support: 1.5420, 1.5250


USDCAD (Daily Chart)

Loonie consolidated within the familiar levels on Tuesday, despite the strong demand of the greenback. The pair slid to the daily low at around 1.2350 in the early European hours, but soon bounced back to the 1.2390 level during the American session. Nonetheless, Loonie seems stuck on the levels below the 1.2400 threshold, seeking more catalysts to break through.

The strong US dollar across the board has kept on being the major driver for the rally of Loonie. However, the rising commodity prices are gradually boosting the CAD’s demand and thus weighing on the pair. Looking ahead, Bank of Canada’s rate meetings and the US GDP report are on the table. Investors seem reluctant to place significant bets ahead of the crucial releases.

On the technical front, the daily MACD histogram is almost going to form a golden cross at the moment. The price actions are still hovering around the 61.8% Fibonacci. As above mentioned, some catalysts may be required to break through this awkward situation.

Resistance: 1.2478, 1.2727, 1.2949

Support: 1.2229, 1.2007


Economic Data

Currency

Data

Time (GMT + 8)

Forecast

AUD

CPI (QoQ) (Q3)

08:30

0.8%

USD

Core Durable Goods Orders

(MoM) (Sep)

20:30

0.4%

CAD

BoC Monetary Policy Report

22:00

CAD

BoC Interest Rate Decision

22:00

0.25%

USD

Crude Oil Inventories

22:30

1.914M

CAD

BOC Press Conference

23:00

VT Markets Modifications of trading settings

Dear Clients,

VT Markets is devoted to offering a favorable trading environment to our clients. After a punctilious assessment, from Nov. 1st, 2021, clients will be only available for long positions on certain products.

The short positions will no longer be accessible for clients on these products. After the modification, clients still can decide to keep or close the exsisting short positions of these products. For further details, please refer to the table below.

Effective time: 00:00 on Nov. 1st, 2021 (GMT+3)

Notes: The figures above are only for reference. The actual execution data should be subject to the numbers on MT4/MT5.

Friendly reminders:

Trading shares CFDs products in VT Markets will be charged for commision fee. Please refer the following statements for further information:

1. 6 commisssion per trade for US shares CFDs products
https://www.vtmarkets.com/trading/markets/us-cfd-shares/

2. 0.25% contract value of the HK shares CFDs products (at least 50 HKD)
https://www.vtmarkets.com/trading/markets/us-cfd-shares/

If you’d like more information, please don’t hesitate to contact [email protected].

Market Focus

US markets started this week with outperformance as major tech companies’ earnings on deck. The Dow Jones Industrial Averages closed at record highs while the Nasdaq rose 0.9% on Monday. The S&P 500 also traded at record highs, boosted by a 12% surge in Tesla’s share as it hit $1 trillion market capitalization for the first time.

一張含有 文字 的圖片

自動產生的描述

The electric carmaker, Tesla, hit a $1 trillion market cap on Monday after Hertz decided to buy 100,000 vehicles. After the news of the deal, it brought up the price of Tesla to $1,045, a new record high.

China has the political momentum to get a ball rolling on property. Last weekend, the Chinese state Council was authorized to conduct a test in unspecified regions for five years. The purpose of the test attempts to limit speculation in China’s property market. Since real estate and related sectors account for at least 25% GDP, tapped taxes will significantly bring major revenues to Chinese government.


Main Pairs Movement:

Gold price advanced above $1,800 on Monday despite risk- on market sentiment. Demand for gold was underpinned as the market was cautious ahead of the inflation issue. Gold price will eye on several economic releases later this week.

EURUSD traded in a tight range as the markets took a high alert ahead of the ECB meeting this week. At the end of the day, EURUSD traded at 1.16065, 0.33% lower.

USDJPY remained strong near 113.70 despite slightly weaker US 10- year yield, trading lower at 1.63%, which undermined the demand for the US dollar. USDJPY traded slightly higher as Janet Yellen commented on inflation and Fed’s tapering schedule.


Technical Analysis:

USDJPY (Daily Chart)

The USD/JPY pair posts some demand at the start of the week and seems to have stalled its recent corrective pullback from multi-year tops for now. The pair held on to its modest intraday gains, around the 113.65-75 region through the mid-European session, albeit once jumped to the daily high ay 113.92 at the Wall Street opening, it soon fell back to the tight range that it previously settled.

With a light economic calendar, the revived risk-on mood weighed on the safe-haven Japanese yen and may be seen as the major factor that underpinned the rally of the USD/JPY pair. Bulls need to wait until Thursday’s US GDP reports for further clues to support the US dollar demand and assisted the pair to defend the lower end of a short-term ascending channel.

On the technical front, the daily MACD histogram is still at the bullish side, plus the RSI indicator has just dropped below the overbought territory, leaving rooms for the pair to the upside. The first resistance for the pair may appear at 113.75, followed by the yearly peak 114.70.

Resistance: 113.75, 114.70

Support: 112.90, 111.13, 109.28


EURAUD (Daily Chart)

The EUR/AUD cross plummeted on the first day of the week, losing most of its gains from last Thursday and Friday’s rally, and now trading at 1.5495, where the season lows sit. The pair began its downward ride in the early European session, recovered some loss during the American opening, but then continue its negative trajectory afterward.

The cross’s weakness may derive from the AUD’s appreciation amid the broader positive market mood. Investors now shift their focus toward the Australian inflation figures due on Wednesday, and looming ECB meeting on Thursday is also well-anticipated.

On the technical aspect, the MACD histogram remains in the bearish territory, suggesting the selling stream of the cross may proceed. However, the RSI indicator shows 30.22 at the moment, just one step ahead of the oversold region, indicating a short-term correction may occur before the cross takes a nosedive. On the downside, the May’s low 1.5420 would be a strong support against the bears, followed by 1.5250, the yearly low.

Resistance: 1.5616, 1.5776, 1.5910

Support: 1.5420, 1.5250


USDCAD (Daily Chart)

Loonie continued its gains on Friday amid the broader greenback strength. The pair made its first attempt to breakthrough the 1.2400 threshold, but failed as the risk-on market mood limited the strength of the safe-haven USD. However, as the Fed’s taper schedule looms, a breach of that level may just be a matter of course.

The strong US dollar across the board has kept on being the major driver for the rise of the Loonie pair. Powell’s hawkish comment is still fueling greenback’s demand despite the elevating prices of the commodities. Looking ahead, Bank of Canada’s rate meetings and the US GDP report are on the table. Investors seem reluctant to place significant bets ahead of the crucial releases.

On the technical front, the daily MACD histogram is almost going to form a golden cross at the moment. The price actions are still hovering around the 61.8% Fibonacci. As above mentioned, some catalysts may be required to breakthrough this awkward situation.

Resistance: 1.2478, 1.2727, 1.2949

Support: 1.2229, 1.2007


Economic Data

Currency

Data

Time (GMT + 8)

Forecast

USD

CB Consumer Confidence (Oct)

22:00

108.3

USD

  New Home Sales (Sep)

22:00

760K

VT Markets Notification of trading adjustment

Dear Clients,

Please note change of the following products when Europe will enter Standard time that begins in October 30th, 2021.

Note: The above data is for reference only, the actual execution data may be changed, please refer to the MT4/MT5 software for details.

If you’d like more information, please don’t hesitate to contact [email protected].

Market Focus

All three major U.S. stock indices recorded weekly gains on the back of better than expected 3rd quarter earnings results from major companies. The Dow notched another record close on Friday to close at 35677.02. The S&P 500 lost 0.1% to close at 4544.9, while the Nasdaq lost 0.8% to close at 15090.2. The U.S. 10 year Treasury yield trended higher to close at 1.638%.

Major companies including Procter & Gamble and Netflix both reported their 3rd quarter earning results during this week. Procter & Gamble reported Q3 earnings that beat Wall Street’s estimate as consumers continue to demand cleaning supplies and beauty products. Netflix also posted better than expected earnings as the company was able to add 4.4 million subscribers over the quarter. Facebook, AMD, Alphabet Inc, Amazon Inc, and Berkshire Hathaway are among the major companies that will report their Q3 earnings for this week.

一張含有 文字 的圖片

自動產生的描述

Cryptocurrencies enjoyed a healthy rise over the past week as Bitcoin rallied past $60,000 and reached historical heights. Ethereum and other alternative coins also experienced healthy gains. As of writing, Bitcoin is trading at $61,071, Ethereum is trading at $4088, and XRP os tradomg at $1.0803.

This week’s economic docket is highlighted by the Australian CPI, U.S. GDP for Q3, U.S. initial jobless claims and the European Union CPI.


Main Pairs Movement:

The Greenback rose on Friday as Fed Chair Jerome Powell’s speech, once again, affirms the Fed’s previously adopted hawkish stance. In his speech, Fed Chair Jerome Powell, reiterates the urgency to begin tapering, while at the same time stating that it is not time for a rate hike, yet. Chairman Powell also provided a positive outlook on the recent supply chain crunch as he expects constraints to ease as expected and it is “very possible” that the Fed’s full employment goal would be met by next year.

Most currency pairs against the dollar struggled as the Greenback gained steam. USDJPY, however, experienced a 0.44% daily slide as the pair could have already reached some investors profit taking level. GBPUSD saw a 0.3% intraday decline. The Pound struggled due to weaker than expected September retail sales. USDCAD gained 0.03% as the Dollar strengthens to help the pair extend yesterday’s winning session.


Technical Analysis:

USDJPY (Daily Chart)

The USD/JPY pair dived deeper on Friday, extending its southern corrections from muti-year highs at 114.70 to session lows right above 113.40. The pair started its intraday slide since the early European session, rebounded slightly as the Powell’s speech talking about an upcoming taper from the Fed, and then resumed its downside sloping afterward.

On Friday’s speech, Fed Chair Jerome Powell said that he thinks it is the time to start reducing asset purchases, which reaffirmed the investors’ anticipation of November tapering and rose a sudden panic throughout the market. The dollar has surged for a bit, though, it did not stop the selling stream of the USD/JPY. A possibility for that may be profit-taking, as some investors might have closed their long positions after the prolonged USD/JPY uptrend.

On the technical front, both the daily MACD histogram and the RSI indicator are still at the bullish side. The price actions have been away from the top of the Bollinger band, sparing some rooms for further rally.

Resistance: 113.75, 114.70

Support: 112.65, 110.97, 109.17


GBPUSD (Daily Chart)

Cable continue its yesterday’s decline, edging lower to end the week at 1.3755. The pair climbed higher to a daily top in early European session but failed to preserve its bullish momentum afterward, as the Fed’s Chair Powell popped up taper issues in his speech during the American trading hours, which led the pair plummeted over 40 pips in a sudden.

Sterling’s weakness may derive from the dismal retail sales data. The UK retail sales released Friday showed a -0.2% reading in September, a big miss to market’s expectation of 0.5%. The downbeat macros also revived the Covid concerns as UK policymakers rejected restrictions, further weighing on the British Pound.

On the technical aspect, both the MACD histogram and RSI indicator remain in the bullish territory, suggesting the demand for the Quid is still robust. Considering the looming UK rates hike plan, it is reasonable to expect the pair to get back to its upward track.

Resistance: 1.3830, 1.4000, 1.4220

Support: 1.3720, 1.3580, 1.3410


USDCAD (Daily Chart)

Loonie defended its gains on Thursday and successfully closed in the green amid the broader greenback strength. The pair once climbed to daily high at 1.2383, which matched Thursday’s high, and consolidates near the high afterward, with a strong bullish impulse. A break higher would clear the way for a test of 1.2400.

A stronger US dollar across the board has been the critical driver in the Loonie pair. Fed Chair Powell mentioned that high inflation will likely last well into next year. He affirmed that it is the time to taper QE but not to raise rates. Commodities including crude oils reversed sharply after Powell’s speech.

On the technical front, both the daily MACD histogram and the RSI indicator are still deeply under the bearish territory. The price actions lingered around the 61.8% Fibonacci throughout the day, some catalysts may be required to breakthrough this awkward situation.

Resistance: 1.2478, 1.2727, 1.2949

Support: 1.2229, 1.2007


Economic Data

Currency

Data

Time (GMT + 8)

Forecast

EUR

German Ifo Business Climate Index (Oct)

16:00

97.9

VT Markets Modifications on Indices contracts

Dear Clients,

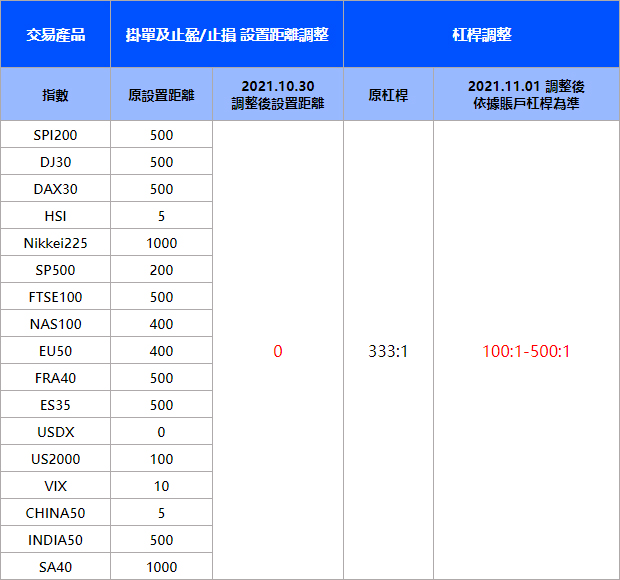
Along with the gradual recovery of International financial markets, the trading environment for major indices becomes more stable. Therefore, it’s VT Markets’s pleasure to announce that there’ll be relaxation, which is stated below, on the requirements of trading indices contracts.

1. The stops-levels of all indices contract will be reduced to 0.
VT Markets will enforce this new policy at 00:00 on Oct. 30th, 2021 (GMT+3).

2. The leverage of indices contracts will be between 100:1 and 500:1 (It’s subject to your account leverage) instead of being fixed at 333:1.
VT Markets will enforce this new policy at 00:00 on Nov. 1st, 2021 (GMT+3).

Notes: The figures above are only for reference. The actual execution data should be subject to the numbers on MT4/MT5.

Friendly reminders:
1. All contract specifications of Indices stay the same except the stops-levels and leverages.
2. If there’s any Indices position in your trading account and your account leverage is between 100:1 and 300:1, there might be liquidations due to increasing margin requirements after the leverage modification. Therefore, VT Markets recommends that you retain sufficient funds in your trading account before this modification to keep those positions.

If you’d like more information, please don’t hesitate to contact [email protected].

Market Focus

US markets were mixed amid strong earning reports from companies and upcoming Fed’s tapering move. The S&P 500 continued to notch a new record, and the tech- heavy weighted Nasdaq Composite rose 0.6% on Thursday. The Dow Jones Industrial Averages closed a bit lower after reaching a all- time high on Wednesday, dropping 6 points.

一張含有 文字 的圖片

自動產生的描述

Bloomberg

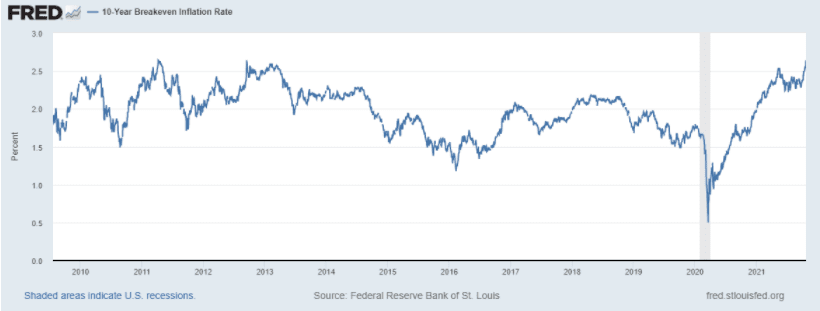
US Treasury yields rise as markets await on Fed’s next move on the timing of lifting interest rates after it finished tapering. US inflation expectation, which is measured by the 10- year breakeven inflation jumps to the highest since 2012. The US dollar might witness a rally when the 10- year yield crosses 1.70% mark.

Fred

Responding to a growing controversy over investing practices, the Fed has announced new rules to ban policymakers from investing individual stocks. In the meantime, they will be restricted to buy and sell mutual funds, needing permissions to buy and sell. The purpose of the change is to rephrase Fed’s ethical conduct and wipe out the controversy.


Main Pairs Movement:

The US dollar trades at the familiar levels throughout the day as the light macro calendar provides no news to impact the market. The dollar index consolidated within a tight range between 93.550 to 93.800. Further instructions may be given after the Markit PMIs revealed on Friday.

However, most major pair performs badly against the greenback. The EUR/USD pair trades around 1.1625, while GBP/USD dropped below the 1.3800 level, hovering around 1.3785. The commodity-linked currencies failed to maintain their previous momentum, with AUD/USD dropped over 0.5% to 0.7465, NZD/USD retreated to 0.7150, and USD/CAD surged over 70 pips to 1.2375. JPY is the best performer of the day. USD/JPY once dived to 113.65, and settled at 114.00 at the time of writing.

Gold seesawed around $1,780 a troy ounce during the day, while crude oil encountered some corrective selling pressures, with WTI slip to $82.60 a barrel, and Brent at $84.70. The US benchmark 10-year Treasury yield resumed its 5-day winning streak and reached a 5-month high at 1.690%.

Digital assets plunged on Thursday right after Bitcoin hit an all time high yesterday. Bitcoin has lost over 7% of its total value from its peak, while Ethereum declined a modest 1.90%, still standing above the $4,000 threshold.


Technical Analysis:

USDCAD (Daily Chart)

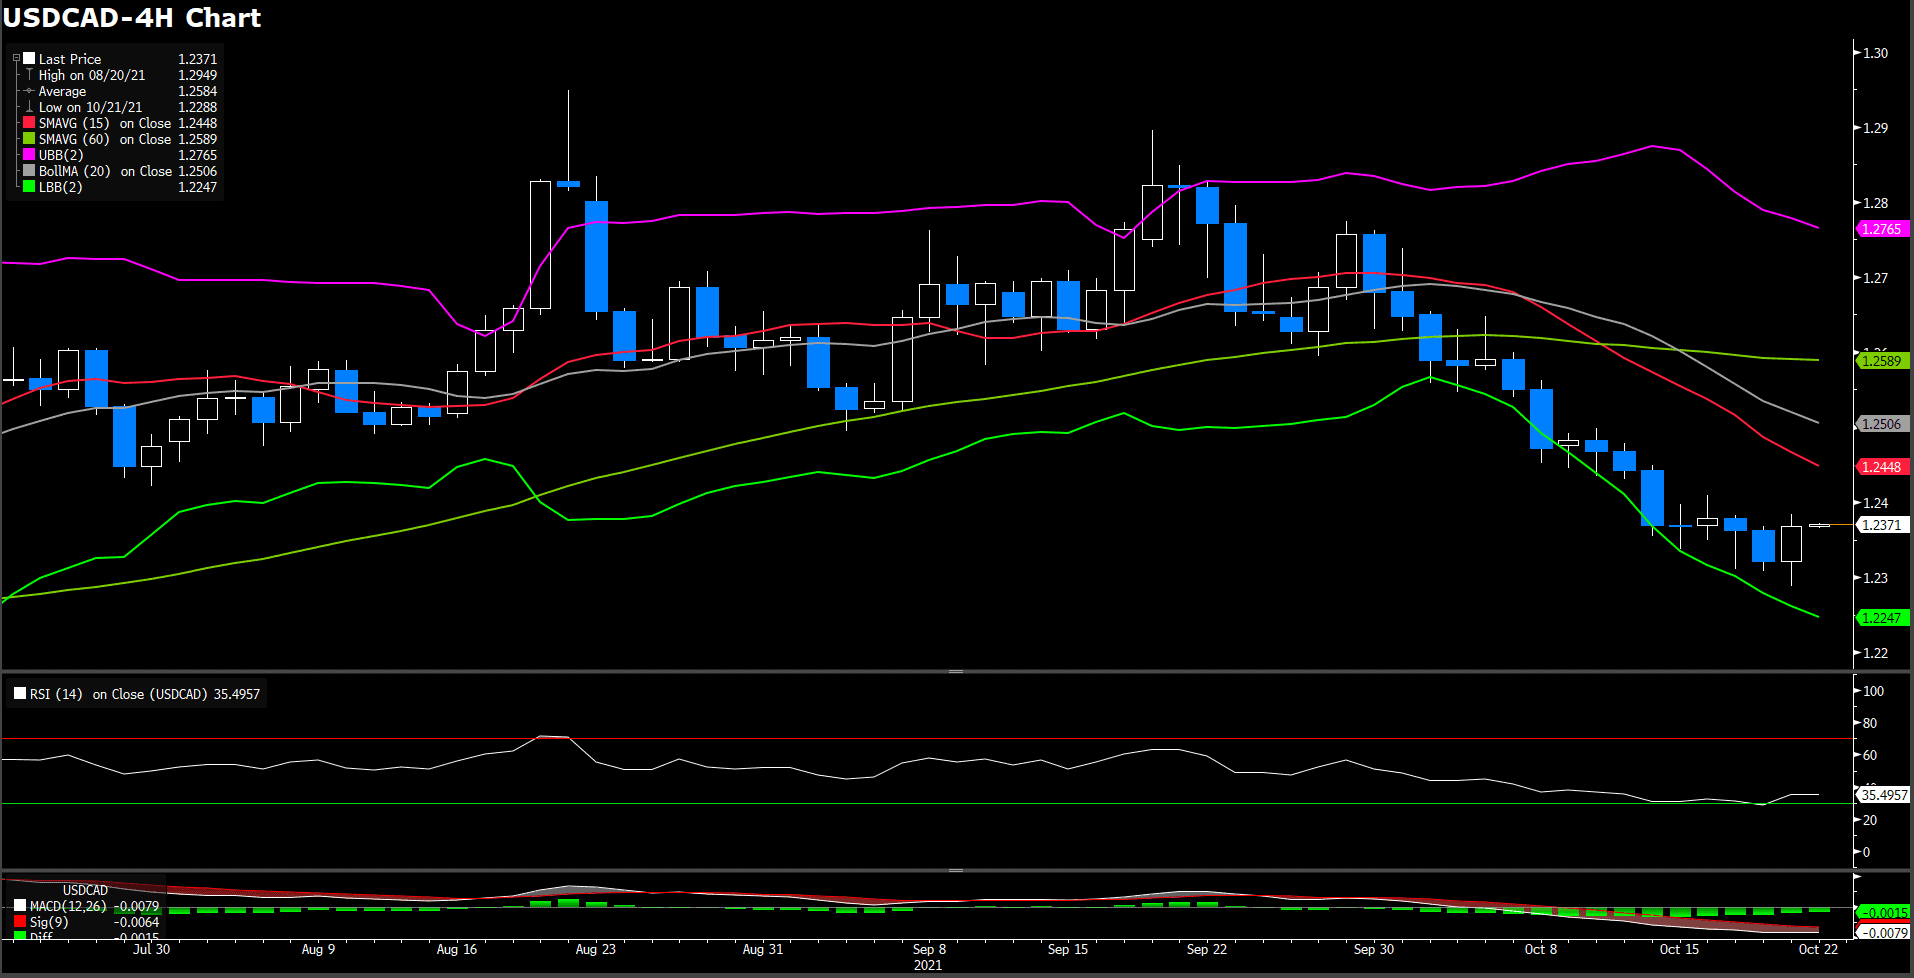
Loonie has finally got a decent hike on Thursday after losing for almost 3 weeks. The pair posted a lowest daily close since early July at 1.2288 on Asian hours, and then bounced to the upside. During the American session, it printed a fresh daily high at 1.2383 and was last seen at 1.2370.

The dollar index swung higher at the close of the Wall Street, ending its six-day downtrend. Higher US Treasury yields and deteriorating market mood underpinned the greenback. Moreover, the correction moves in oil prices also weighed on the CAD demand, further pushing the USD/CAD price level upward. The main trend in USD/CAD should still be downside, as long as the worldwide recovery from the pandemic continues, and the demand for energy remains robust.

On the technical front, both the daily MACD histogram and the RSI indicator suggested a strong bearish sentiment. The price actions have been away from the bottom of the Bollinger band, sparing some rooms for further southern extension.

Resistance: 1.2480 (50% Fibonacci), 1.2750 (78.6% Fibonacci), 1.29490 (yearly high)

Support: 1.2232 (23.6% Fibonacci), 1.2010 (yearly low)


EURUSD (4-hour Chart)

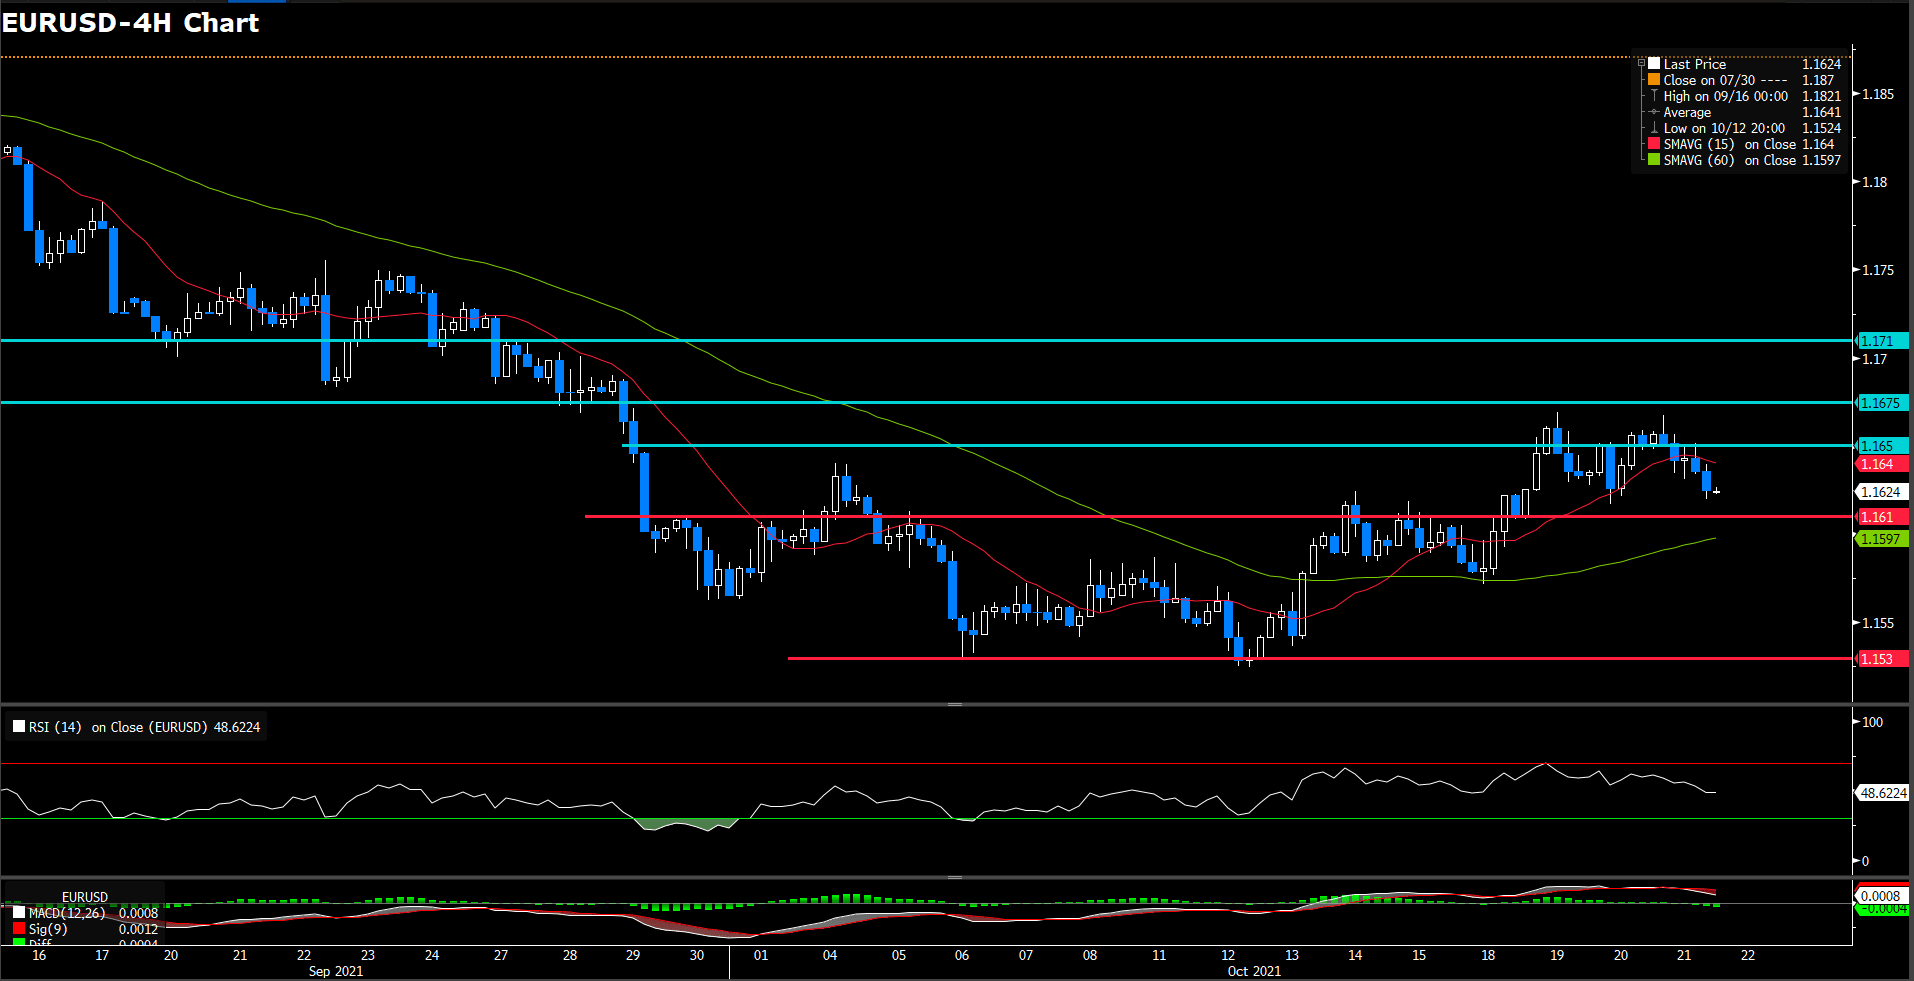
The euro has consecutive its reversal from week-highs at 1.1665 to hit fresh session lows at 1.16 during Thursday’s late U.S. session. The pair is giving away gains. After a three-day rally, weighed by higher demand for greenback amid a sourer market sentiment. Quarterly earning has failed to lift spirits and concerns about the surging inflation and supply chain collapse have turned to the hotline, bolster demand for safe assets against riskier currencies as euro fiber. On macroeconomic side, U.S. data gas been mixed. Weekly jobless claims have dropped to their lowest levels in 19 months and existing home sales increased 7.0%, the highest reading since January. On the other hands, the Philadelphia Fed Manufacturing survey dropped to 23.8 from 30.7 in the previous month. On technical side, the RSI moved down under 50 threshold to 48.6 figures in day market, suggesting a slightly bearish movement in short term. On moving average aspect, 15- long indicator has reversed it way to downward with exceedingly rapid momentum and 60-long indicator is turning it head to slightly upward momentum.

In lights of the backdrop to mixed suggestion from indicators, we deem euro fiber will continue afloat in a consolidation range between 1.161 and 1.1675. Moreover, it should hovered perfectly upside momentum as it breakthrough a W patter by price action suggestion. However, market still linger in a choppy box pattern.

Resistance: 1165, 1.1675, 1.171

Support: 1.153, 1.161


USDJPY (4 Hour Chart)

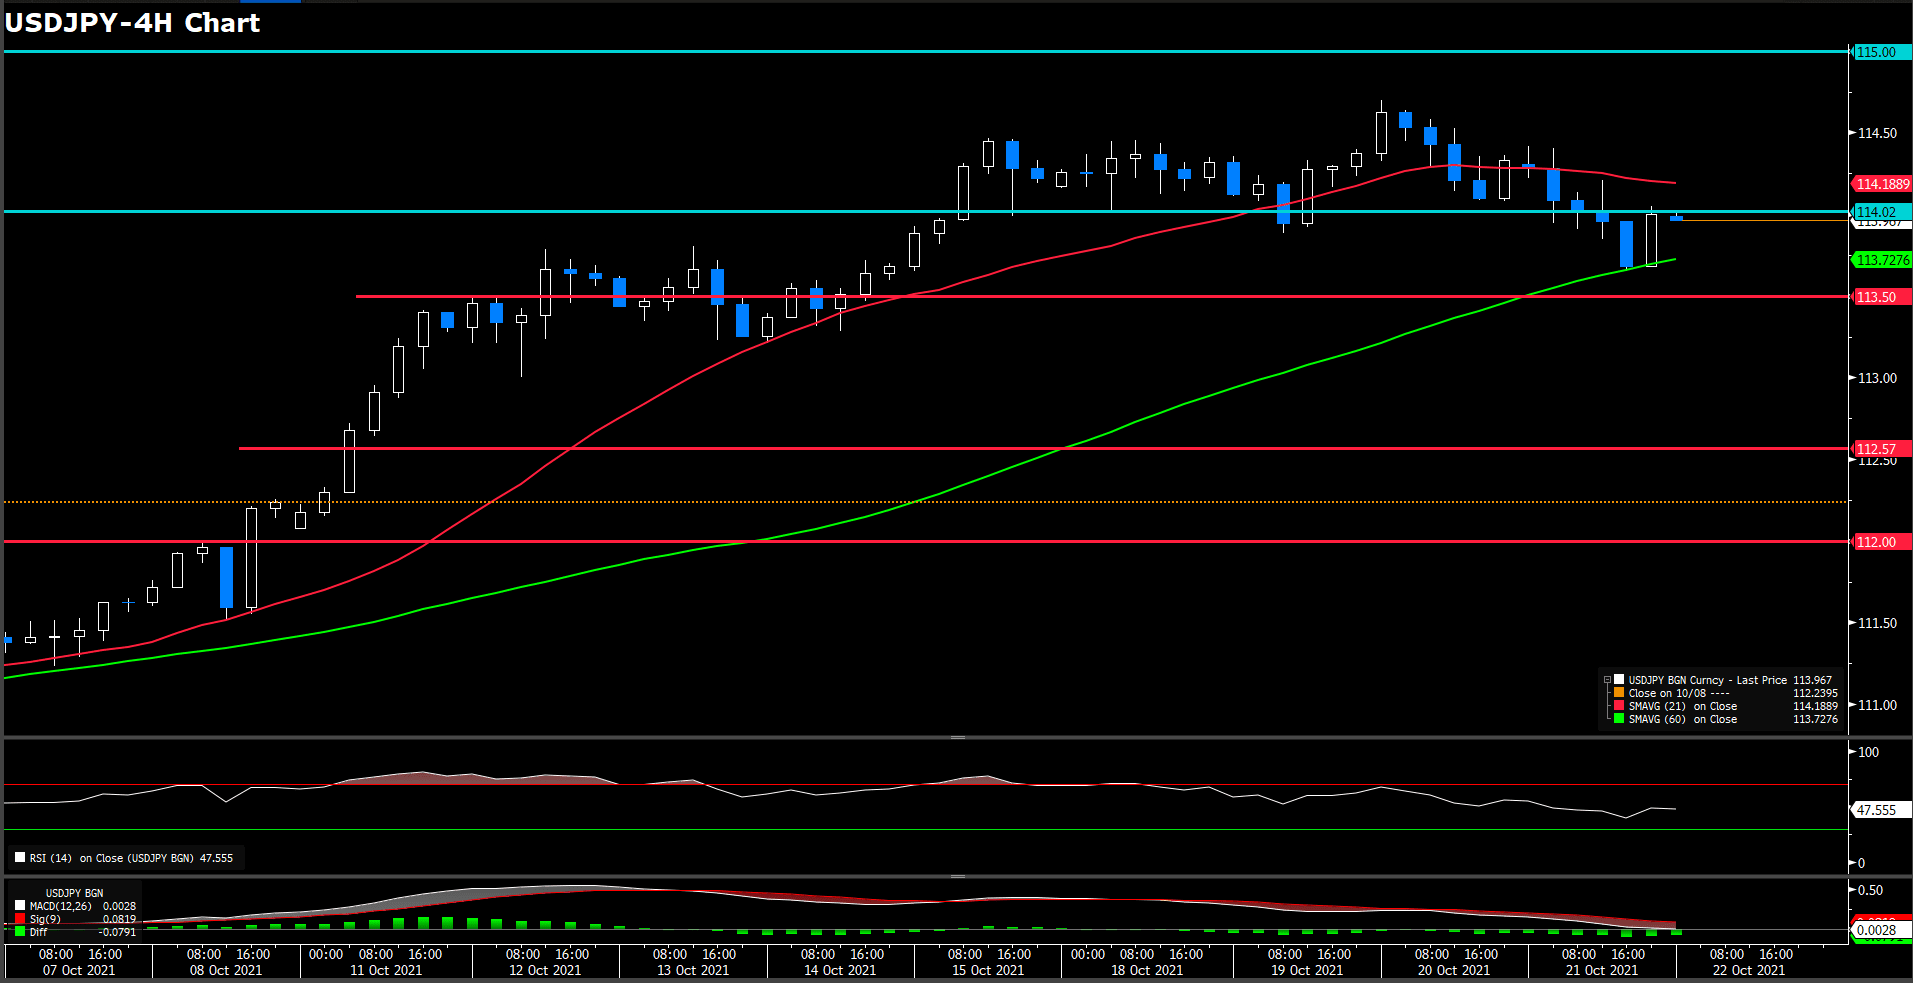
Japan yen edged lower for the second successive day after hitting the highest level in years amid reviving safe-haven demand. Renewed worries about China’s property sector extended support to the safe-haven JPY. Recently, it dropped below 114 level to 113.63, the lowest point in the week. Furthermore, U.S. 10-year Treasuries bond yield hitting 4-month peak at 1.68%. The market is anticipating that the persistently high inflation and global supply chain congestion will force the Fed to accelerate its tapering of their monetary policy, which has provided additional support to the dollar as well.

From a technical perspective, RSI indicator retreat under natural level at 48, suggesting slightly bearish momentum in short term. On moving average indicator, 15-long indicator has turned it way to subtle downside and 60-long indicator retaining upward movement.

Since yen sipped under 114 level as a neckline of double head, it seems lost bullish momentum under currently circumstance according price action. Therefore, we deem strong resistance has turn to 114 and 115 next. On slip way, we expect next immediately support will be psychological level at 113.5

Resistance: 114, 115

Support: 113.5, 112.57, 112


Economic Data

Currency

Data

Time (GMT + 8)

Forecast

GBP

Retail Sales (MoM)(Sep)

14:00

0.5%

EUR

German Manufacturing PMI (Oct)

15:30

56.5

GBP

Composite PMI (Oct)

16:30

GBP

Manufacturing PMI (Oct)

16:30

GBP

Service PMI

16:30

EUR

EU Leader Summit

18:00

CAD

Core Retail Sales (MoM)(Aug)

20:30

2.8%

USD

Fed Chairman Powell Speaks

23:00

VT Markets Notification of Server Upgrade

Dear Client,

As part of our commitment to providing the best reliability and service to our client, we are planning an upgrade in our server on October 23th 2021.

As a result, we will be conduct maintenance according to the schedule below.
Start date and time: 2021-10-23 16:00 GMT+3(Server time)
End date and time: 2021-10-23 19:00 GMT+3(Server time)

Kindly be reminded that the following things might be affected during this maintenance period:

1. The login and operation of the client portal

2. The login of the trading account

3. The quotations of products will be paused. Clients might not be able to open new positions or close the held positions.

4. There might be a gap between the original price and the price after maintenance. Pending orders, Stop Loss, and Take Profit settings within the gap will be filled at the market price after maintenance ends.

After the upgrade, clients can login to trading account using the server which is shown in the account activation mail.

No action is required by our client. Your services will come back online at the end of the maintenance.

Thank you for your patience and understanding with regard to this important initiative.

If you’d like more information, please don’t hesitate to contact [email protected].

Market Focus

US markets were mixed on Wednesday with the major indices hovering slightly below all time highs. The Dow Jones jumped 0.4% to a new high whilst the S&P 500 rose for 6th straight- day as a parade of strong earnings results boosted the equities; the Nasdaq dropped 0.05%. Recent rallies of US markets have essentially shown that the markets are in the process of climbing a wall of worries over the last two months, including fears over the pandemic resurgence, Chinese property crisis, and the Federal Reserve’s hawkish tone.

一張含有 文字 的圖片

自動產生的描述

After the first Bitcoin ETF debuted in New York on Tuesday, Bitcoin investors cheered and push Bitcoin price to notch a fresh all- time high on Wednesday. Bitcoin climbed 3.9% to $66,398 while Ethereum also rallied 7.4% to $4,000 level.

China’s Evergrande scenario has signaled and warned Chinese real estate sector that has to be substantially smaller the keep the overall Chinese economy stable and healthy. According to an economic professor at Texas A&M University, China has “too big of risk in the sector.” The sector can potentially slowdown China’s economic growth, reported a disappointing 4.9% Q3 GDP.


Main Pairs Movement:

The greenback again closed in the red against most of its major rivals on Wednesday. The dollar index climbed to the intraday high around 93.870 in the early European session, but plunged after the American trading hours. The inflation data from the EU and Canada appeared positive, while the UK one missed the anticipations, adding pressures on the Bank of England to accelerate its monetary normalization plan.

The EUR/USD pair trades around 1.1650, while GBP/USD sticks firmly above the 1.3800 threshold. The commodity-linked currencies resume their yesterday’s strength, with AUD/USD breached the 0.7500 level, NZD/USD bounced off 0.7200, and USDCAD retreated toward the 1.2300 support. USD/JPY hovers around the familiar levels, trading at 114.28 at the moment.

Gold surged nearly 1% to $1,785 a troy ounce during the day. Crude oil prices continued the upward tractions, with WTI went up to $83.30 a barrel, and Brent at $85.70. The US benchmark 10-year Treasury yield posted a fresh monthly high at 1.673% and was last seen trading at 1.650%.

Cryptos got nuts as the trading in the first Bitcoin ETF kicked off on Tuesday. Bitcoin marked an all-time high at $67,000, and Ethereum breached the strong $4,000 resistance and awaits to beat its previous high.


Technical Analysis:

USDCAD (Daily Chart)

Loonie consolidated at the start of the day, but soon plummeted after the Wall Street opening, losing near 0.4%, approaching the key 1.2300 level at the time of writing. The recent dive may derive from the sharp rise in energy prices, as the price actions of the pair has been in tandem with other commodity-linked currencies.

Domestic factors have also contributed to the move of Loonie lately. The Bank of Canada (BoC) is set to taper bond purchases further to $1 billion Canadian dollars per week, and the whole QE program is anticipated to end in December as investors bet the BoC announces a rate hike in 2022. The tighter job market and rising inflation appear supportive to this kind of perspectives.

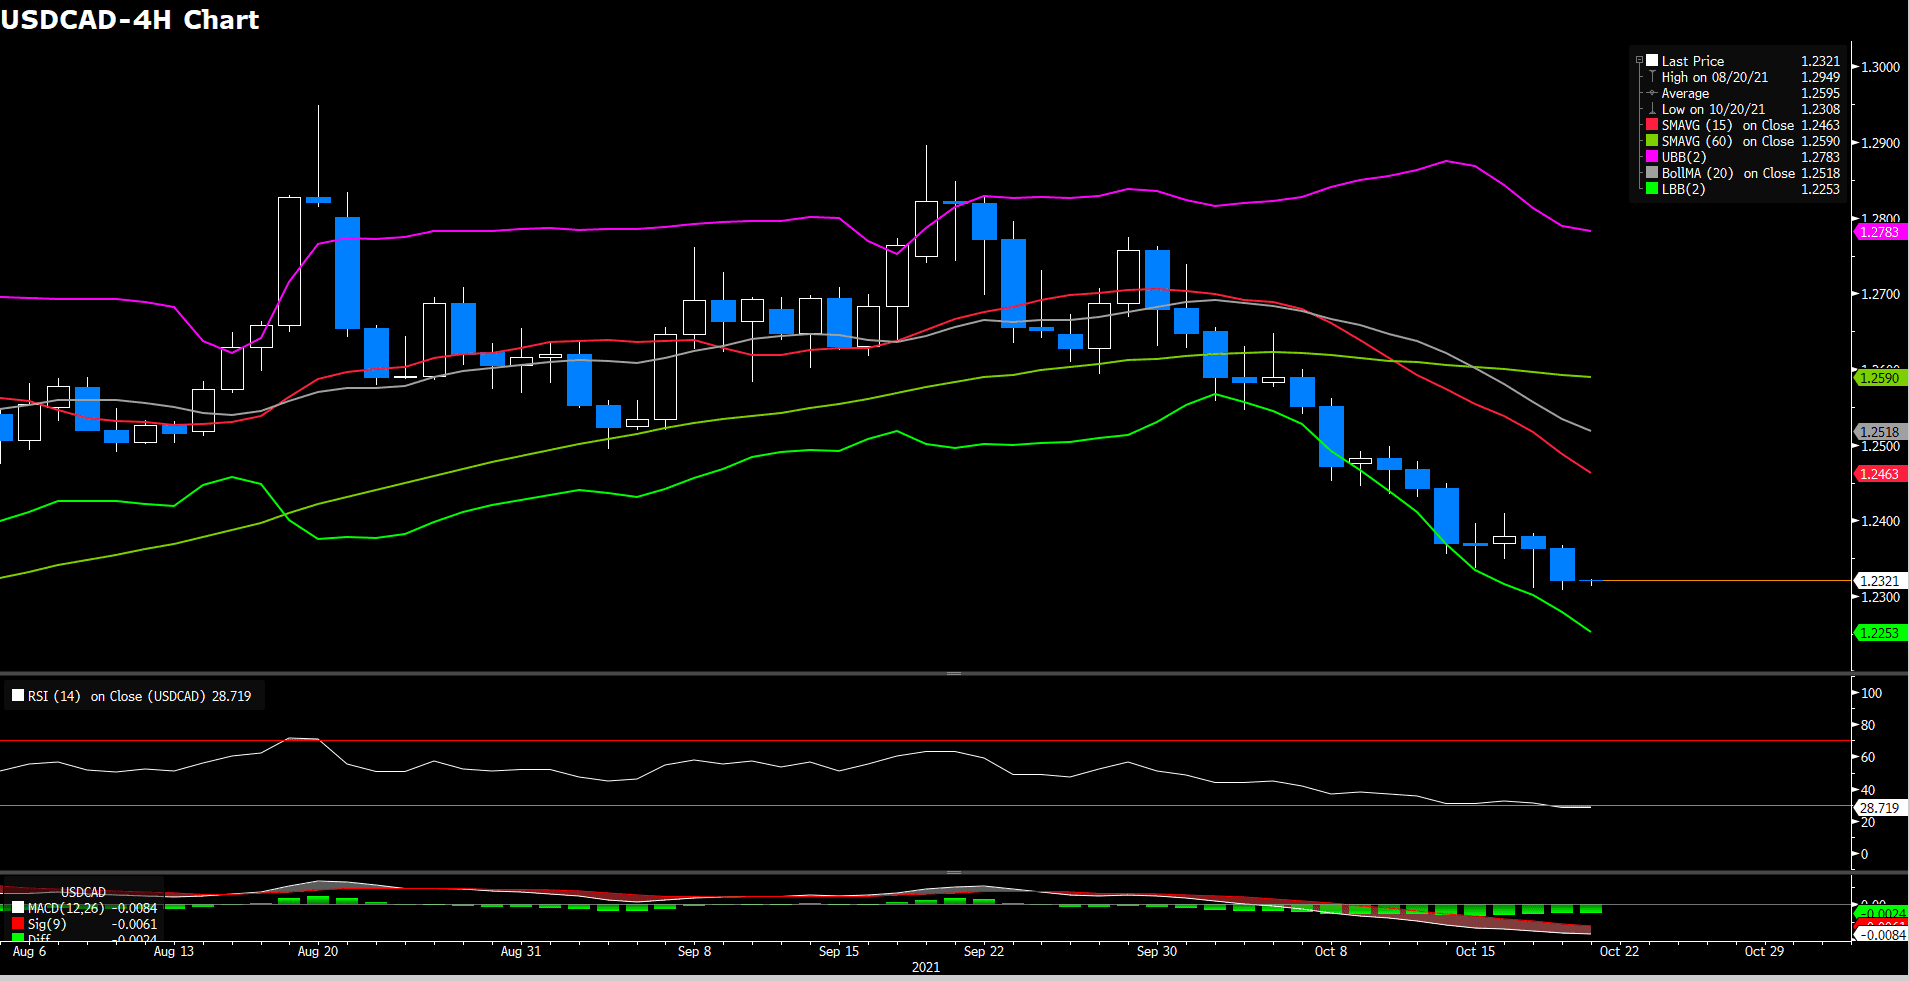
On the technical front, the daily RSI has just breached the oversold territory, and the price actions have been one step ahead of the bottom of the bollinger band, suggesting a short-term correction may come before further decline.

Resistance: 1.2480 (50% Fibonacci), 1.2750 (78.6% Fibonacci), 1.29490 (yearly high)

Support: 1.2273 (Bottom of Bollinger Band), 1.2232 (23.6% Fibonacci), 1.2010 (yearly low)


EURUSD (4-hour Chart)

The euro keeps crawling higher against a somewhat softer U.S. dollar on Wednesday, on track to complete a three-day recovery. The pair has confirmed above 1.16 earlier today to ease negative pressure, before hitting resistance right below October’s peak, at 1.167. In the background, the U.S. dollar index has retreated further from the one-year high at 94.5 hit last week, reaching session lows at 93.5 area, 1% below last week’s top. The positive market sentiment has been reflected on moderate advances in Wall Street.

On technical side, the RSI solely moved whereabout 60.2 figures, a slightly changed compare yesterday, suggesting a slightly bullish movement in short term. On moving average aspect, 15- long indicator has expedited it up side traction and 60-long indicator is turning it head to slightly upward momentum.

In lights of current price has penetrated 1.165 level which we expected as a critical resistance for up traction before, it seems could continue the bullish movement if it could hold above the threshold. On up side, we expect the immediately resistance will be psychological level at 1.1675 which is a 2-month-long resistance for current price action.

Resistance: 1.1675, 1.171

Support: 1.153, 1.161, 1.165


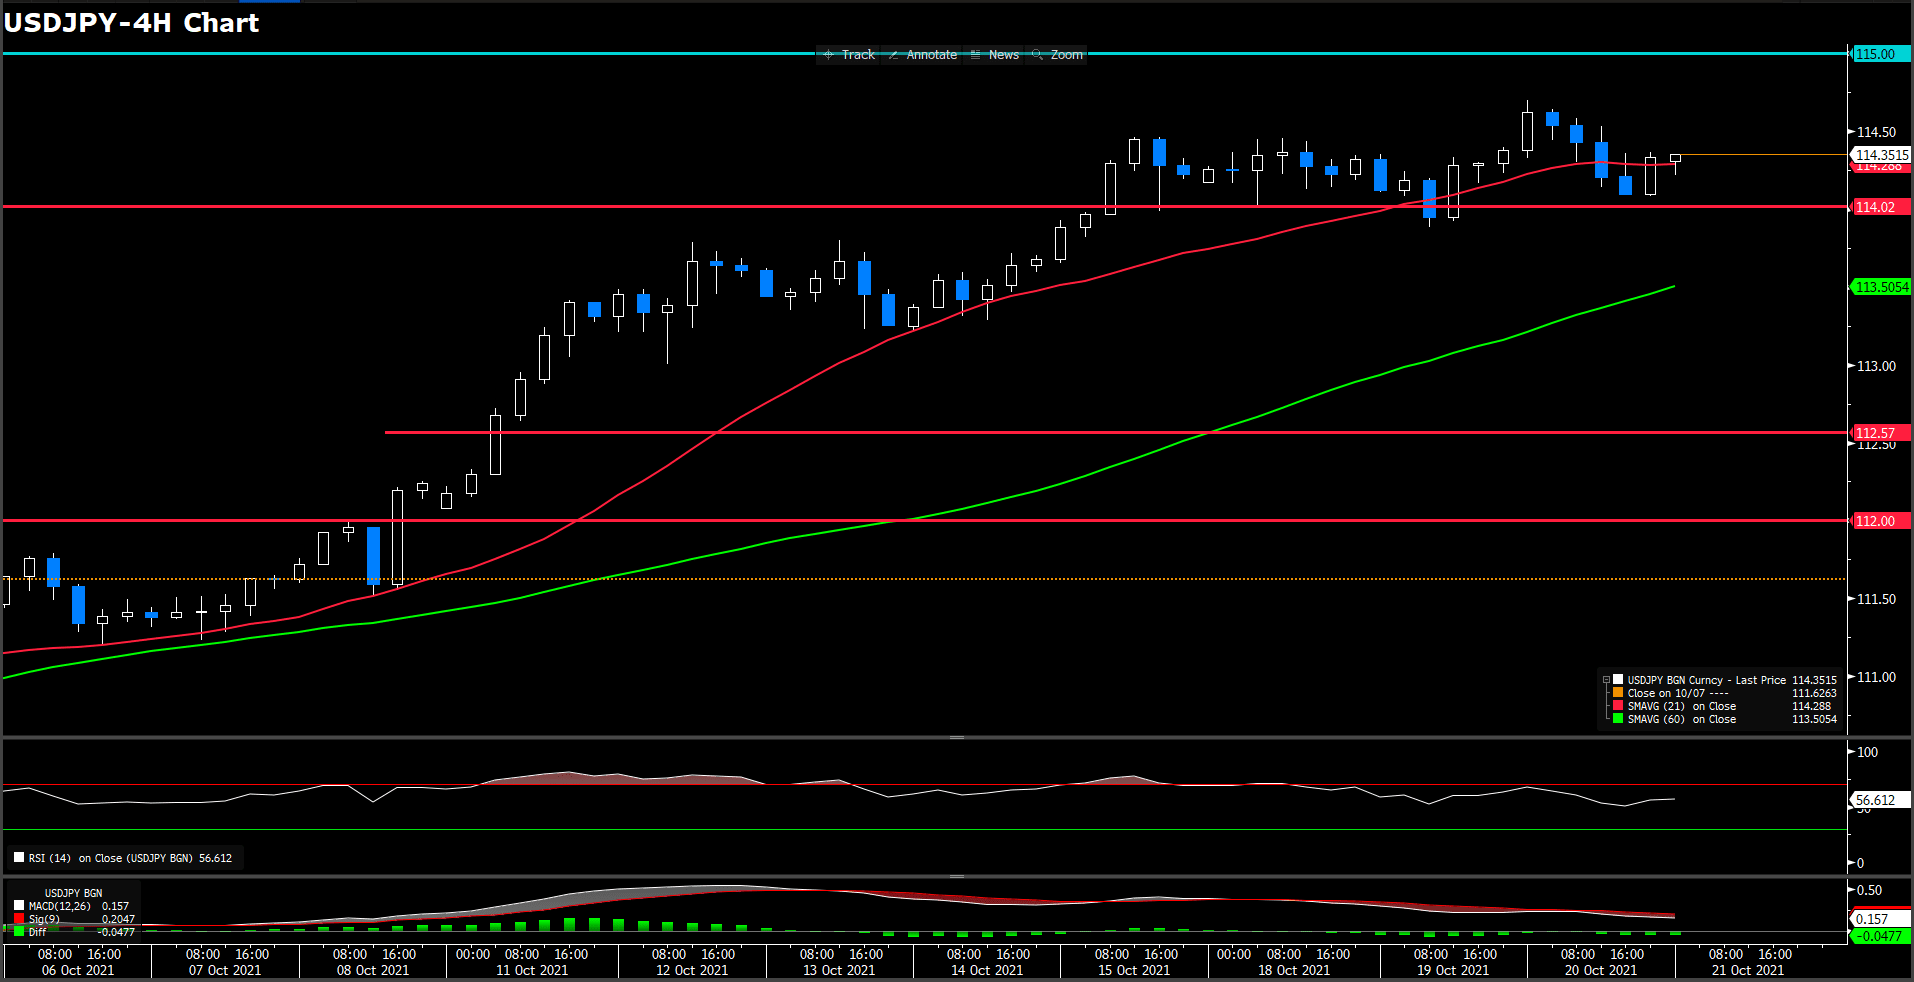
USDJPY (4 Hour Chart)

The U.S. dollar has pulled pack after hitting fresh five-year highs at 114.7 on Wednesday, to consolidate in lower range of 114. The pair has turned negative on daily charts, although the near-term trend remains positive, after have rallied nearly 5% over the last four weeks. Investors’ optimism and the pause on U.S. bond yields’ rally have dented demand for the dollar, allowing most majors to post moderate recoveries. Meanwhile, a consecutive widening gap of U.S. and Japan has squeezed the yen’s attractiveness for the investors.

From a technical perspective, RSI indicator rebound reversed from over bought sentiment at 56.6, suggesting bullsish momentum in short term. On moving average indicator, 15- and 60-long indicator still retaining upside traction.

Since yen stand above 114 level solidly for days, it seems lost driving momentum or further trigger foundamental news currently. Therefore, 114 level still a important support level for buy side investor.

Resistance: 115

Support: 114.02, 112.57, 112


Economic Data

Currency

Data

Time (GMT + 8)

Forecast

EUR

EU Leader Summit

18:00

USD

Initial Jobless Claims

20:30

300 K

USD

Philadelphia Fed Manufacturing Index (Oct)

20:30

25

USD

Existing Home Sales (Sep)

22:00

6.09 M

Back To Top
server

Hello there 👋

How can I help you?

Chat with our team instantly

Live Chat

Start a live conversation through...

  • Telegram
    hold On hold
  • Coming Soon...

Hello there 👋

How can I help you?

telegram

Scan the QR code with your smartphone to start a chat with us, or click here.

Don’t have the Telegram App or Desktop installed? Use Web Telegram instead.

QR code