Market Focus

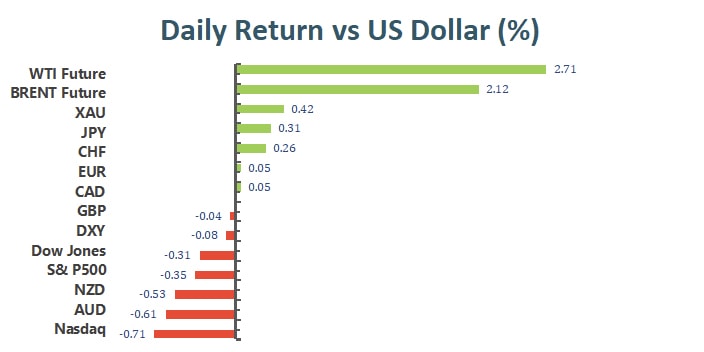
US equities advanced on Friday after a mixed session in the markets, with both earnings and inflation data remaining at the investor’s focus. The S&P 500 posted gains, and both the Dow and Nasdaq also closed out Friday’s session in the green after a volatile trading week. Johnson & Johnson (JNJ) rose after the company said it was planning to split into two separate companies focused on consumer health products and pharmaceuticals, respectively, in a move echoing a similar breakup announcement by General Electric (GE) earlier this week.

一張含有 文字 的圖片

自動產生的描述

Federal Reserve Bank of Minneapolis President Neel Kashkari said the U.S. central bank shouldn’t overreact to elevated inflation even as it causes pain for Americans, because it is likely to prove temporary.

“The high prices that families are paying, those are real and people are experiencing that pain right now,” Kashkari said Sunday on CBS’ “Face the Nation.”

“We need to take it very seriously, but my view is we also need to not overreact to some of these temporary factors even though the pain is real,” he said.

The consumer price index increased 6.2% in the 12 months through October, the fastest annual pace since 1990, according to Labor Department data released last week. That has increased the pressure on the Fed from some economists to accelerate its withdrawal of support for the U.S. economy.

Former Treasury Secretary Lawrence Summers, speaking Sunday on CNN’s “Fareed Zakaria GPS,” said inflation’s momentum has built up to a point where “it’s going to take some significant policy adjustment or some unfortunate accident that slows the economy before inflation gets back to the 2% range.”

Fed policy makers announced November 3rd that they had agreed to begin reducing monthly bond purchases designed to boost the economy by suppressing borrowing costs. They left their benchmark interest rate in a range between zero and 0.25%.


Main Pairs Movement:

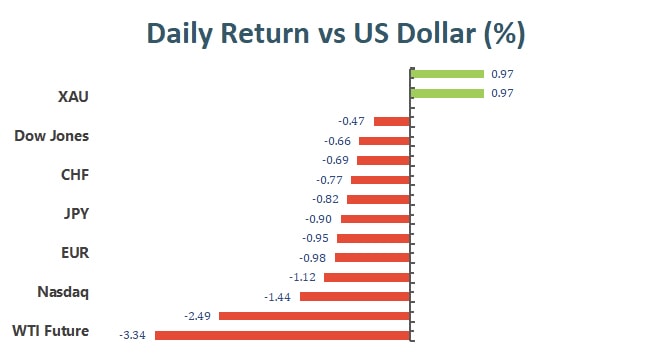
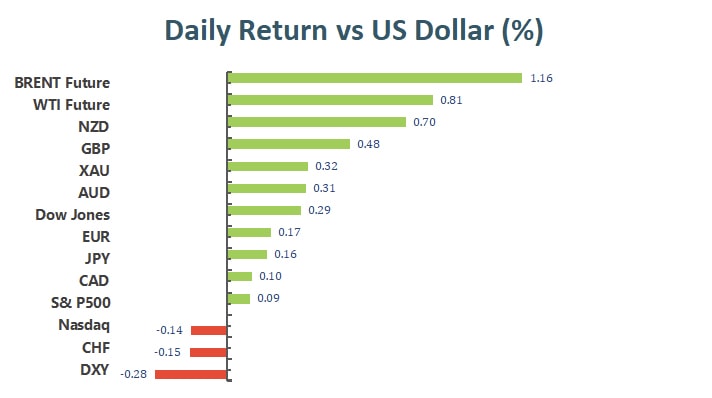
The US dollar lost its strength against most of its major rivals during Friday’s trading hours. The dollar index hovered around a tight range just above 95.00, with losers on Thursday taking back their lost lands, and the shared currency being the worst performer as the selling pressure are still strong amid a dovish ECB.

The Euro pair continues to drill to its yearly low, pinned 1.1433 and ending the day 10 pips above it. Cable recovered all of its losses on Thursday after a 50-pip surge, closing the week at 1.3412. Loonie bounced off 1.2600 at the early London hours, but then failed to fuel the uptrend and fell to 1.2550 at the end of the day. Aussie, however, posted gains against the greenback, up 0.6% and now trades at 0.7330, while Ninja lost ground on Friday, closing the day at 113.85.

Gold’s demand remains robust amid a weeklong gaining streak. Spot trades above $1,867 a troy ounce, a price last seen in June. Crude oil prices underwent a mild loss, with WTI ending the day red at $80.80 a barrel, and Brent down to $81.95.


Technical Analysis:

GBPUSD (4- Hour Chart)

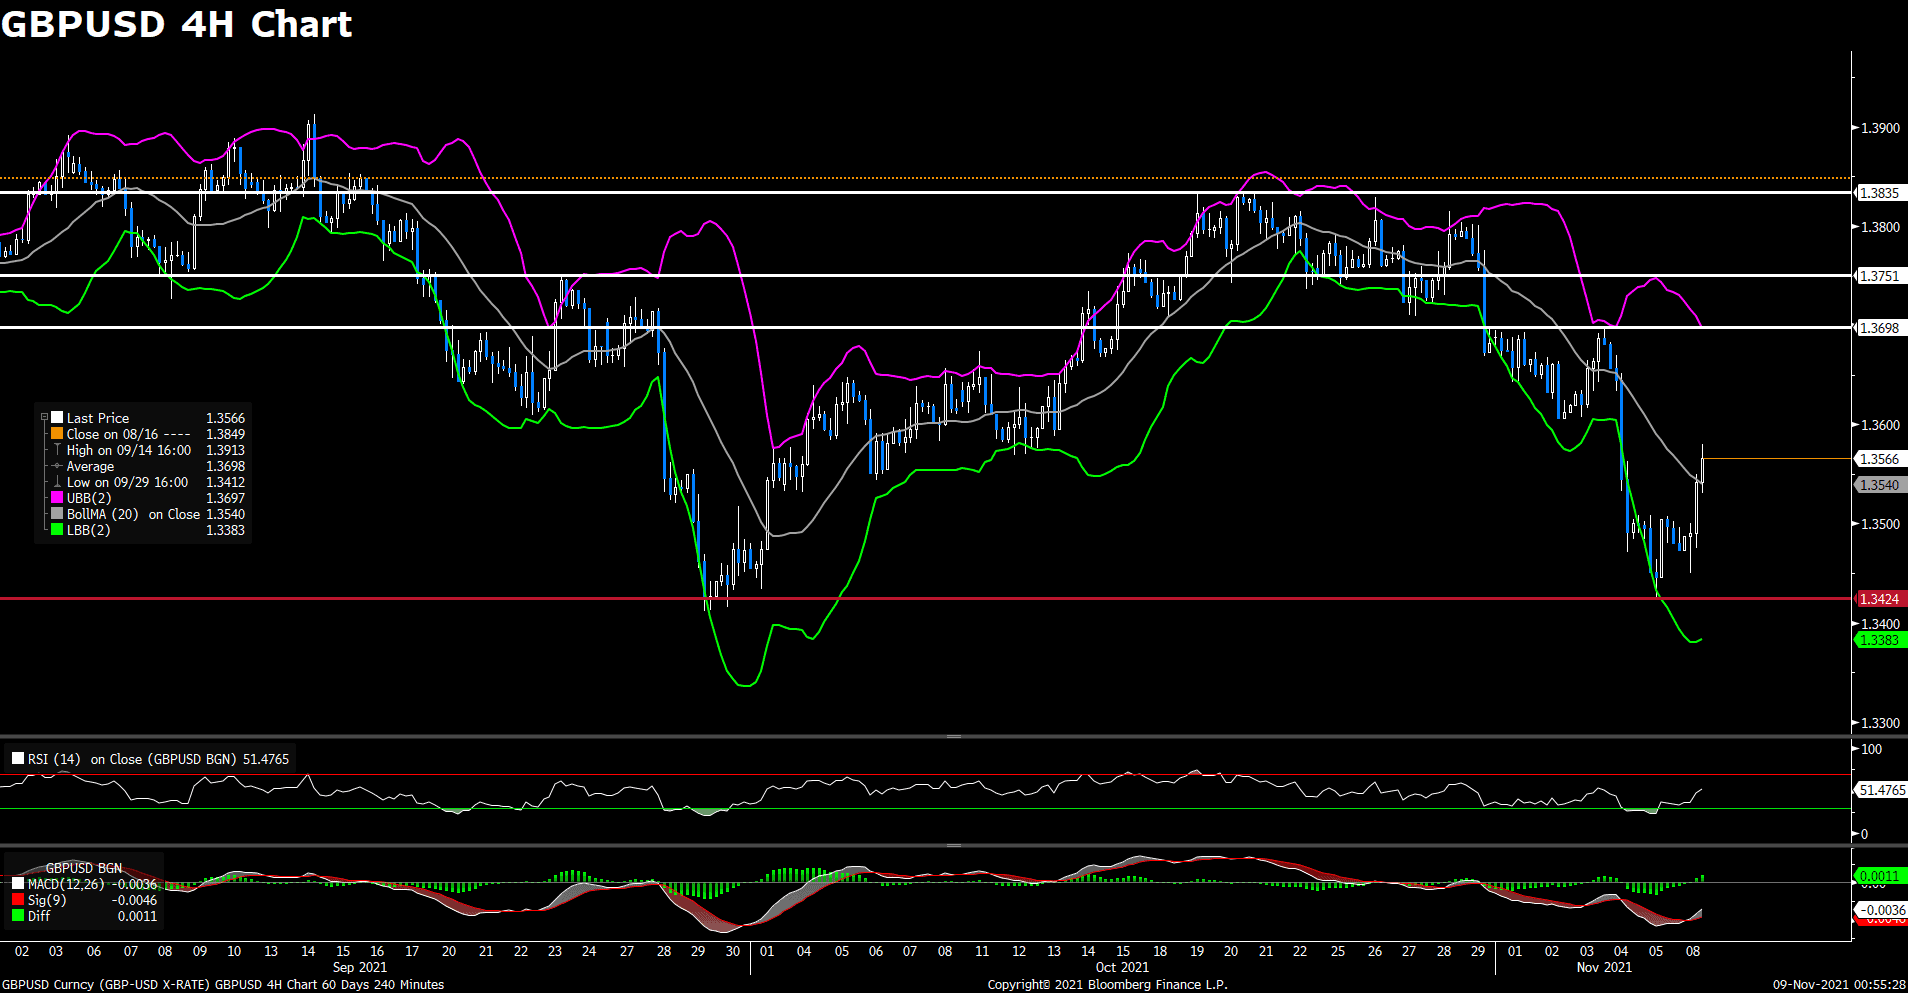
Following previous two-day slide to a yearly low, the pair GBP/USD rebounded moderately on Friday. The pair was pushed higher to daily top in early European session, then started to see some selling and pared part of its intraday gains. However, the pair still stays in positive territory amid US dollar weakness, rising 0.36% on a daily basis. British Pound is the best performing G10 currency so far today, as news reported that the UK wants to de-escalate Brexit-related tensions with the EU and they don’t want to trigger Article 16 of the Northern Ireland Protocol. But the Bank of England’s dovish decision last week might continue to cap the upside for the cable.

For technical aspect, RSI indicator 40 figures as of writing, suggesting bear movement ahead. But for the MACD indicator, a golden cross is forming on the histogram, which indicates an upward trend for the pair. Looking at the Bollinger Bands, the price rose from the lower band and now it’s moving towards the moving average. Therefore the pair will experience some bullish momentum since prices have a tendency to bounce within the bands’ envelope. In conclusion, we think market will be bullish as long as the 1.3355 support line holds.

Resistance: 1.3607, 1.3698, 1.3835

Support: 1.3355, 1.3188
 

USDJPY (4- Hour Chart)

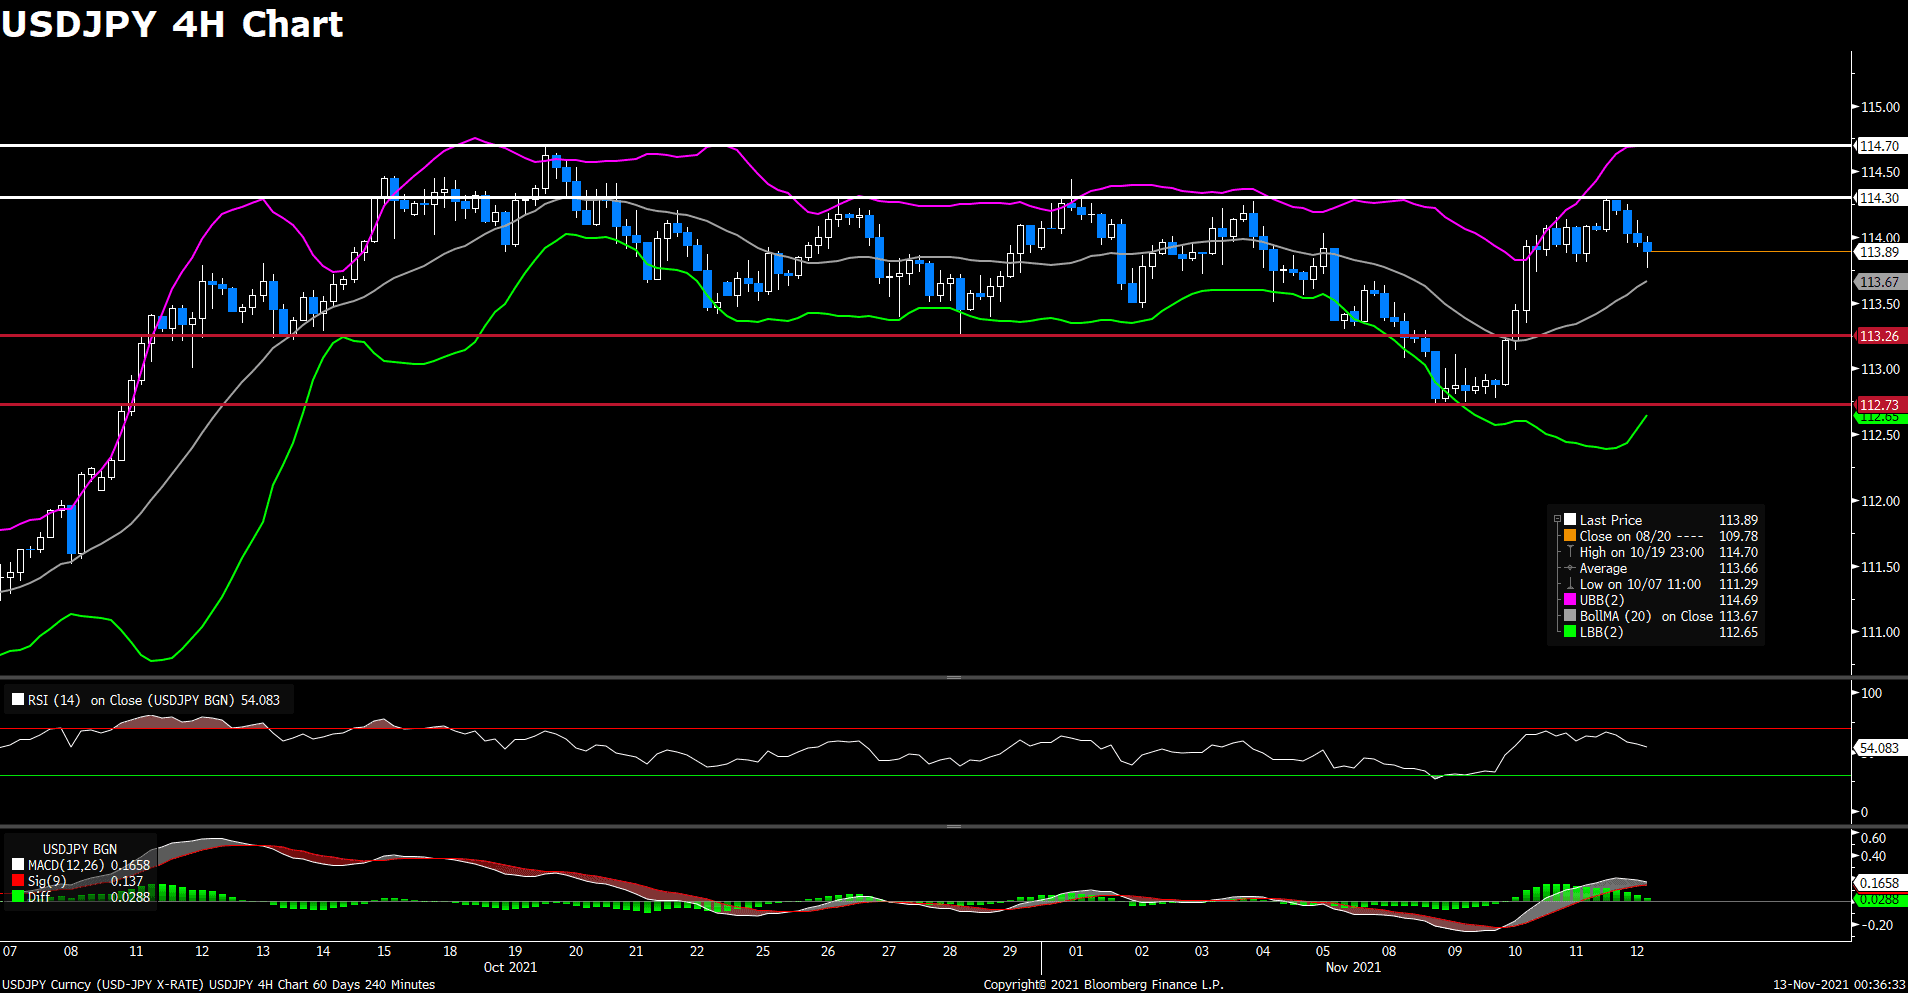
The pair USD/JPY declined on Friday, pulling back from a two-week high above 114.25 level. The pair supported by US dollar strength in early Asian session, but failed to keep its bullish traction and dropped further during American trading hours. USD/JPY has slightly rebounded from a daily low, currently losing 0.14% on a daily basis. The risk-off sentiment around the equity markets and lower US Treasury bond yields both underpinned the safe-haven Japanese yen, but expectations about an early policy tightening by the Fed after an upbeat US CPI reports should lend some support to the greenback and limit the losses for USD/JPY pair.

For technical aspect, RSI indicator 54 figures as of writing, suggesting tepid bull movement ahead. But looking at the MACD indicator, the positive histogram starts to diminish which indicates a possible downward trend for the pair. As for the Bollinger Bands, the negative tone should be intensified if the pair drop below the moving average. In conclusion, we think market will be bearish as long as the 114.30 resistance line holds, and if the pair slip below the 113.26 support, a test of the monthly lows seems likely.

Resistance: 114.30, 114.70
Support: 113.26, 112.73


AUDUSD (4- Hour Chart)

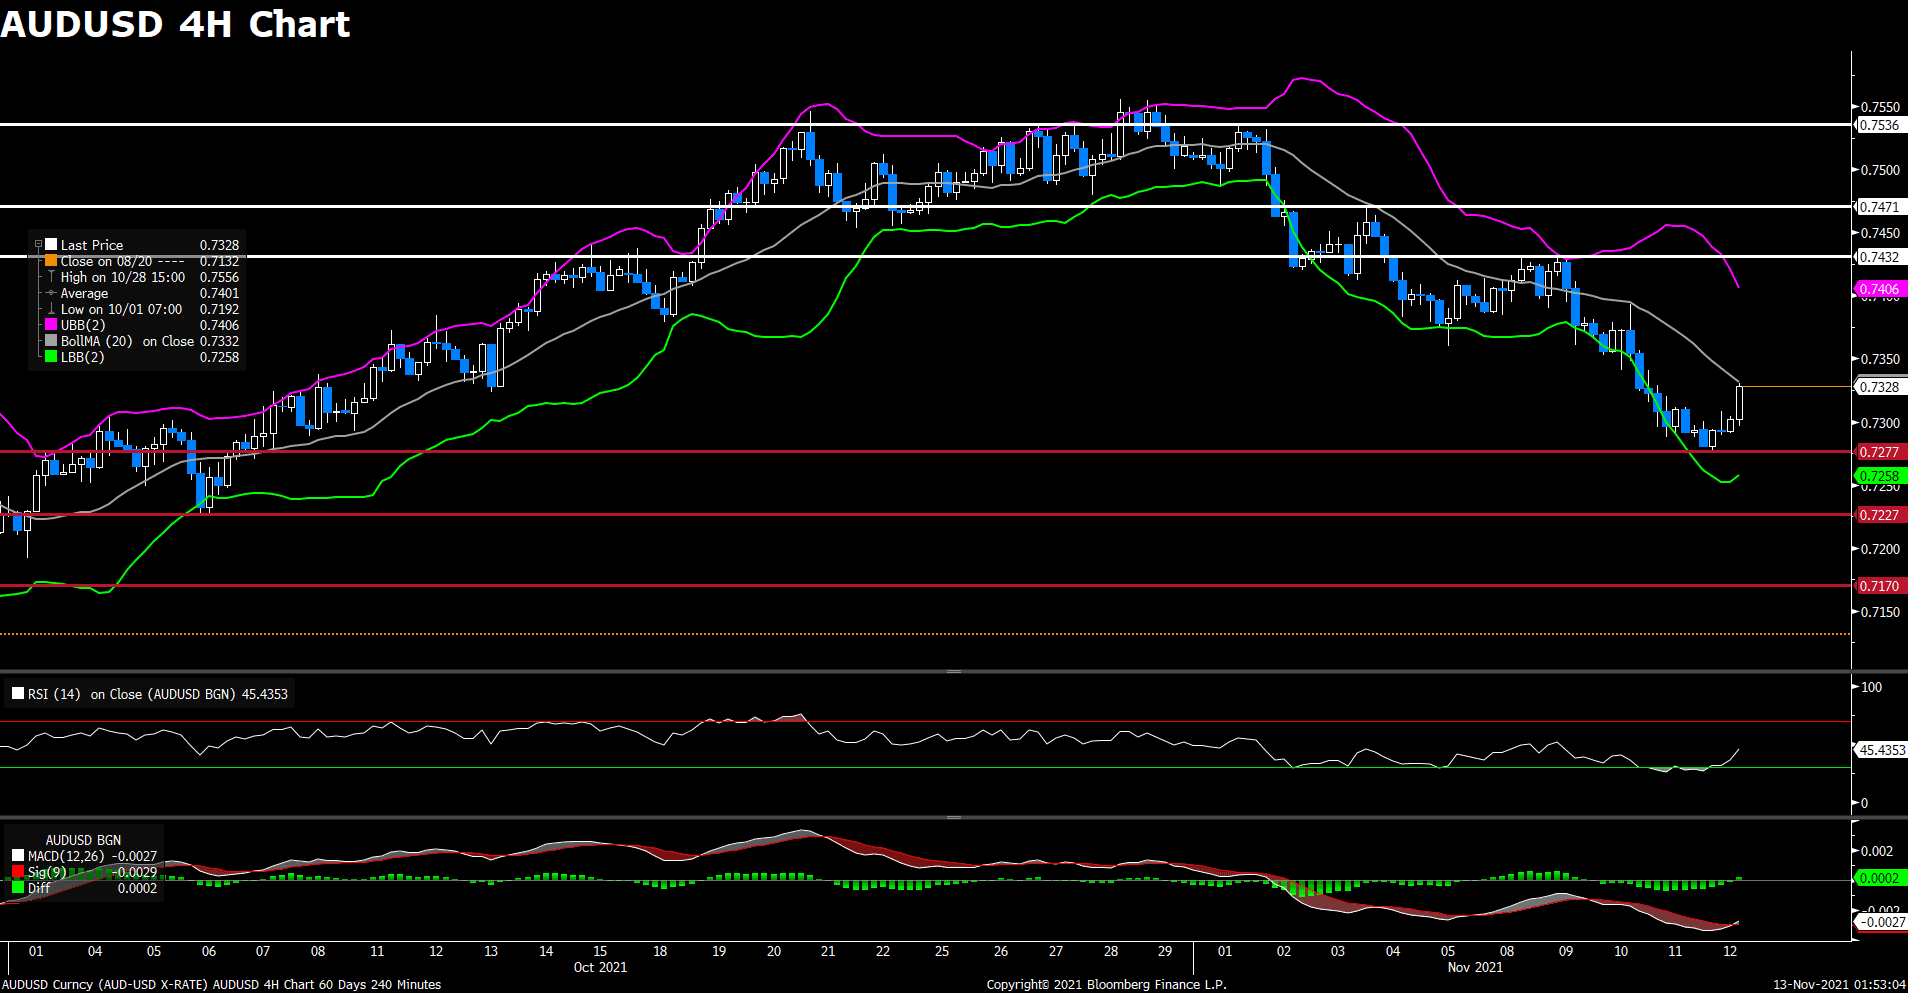
The pair AUD/USD rebounded on Friday, ending its three-day slide amid weaker US dollar across the board. The pair saw some selling in early Asian session but then was able to find demand later, posting a 0.55% gain for the day. The University of Michigan Consumer Sentiment Index for November declined to 66.8, marking the lowest reading since November 2011. Concerns about surging inflation resulted in the dismal data, which dragged the greenback under 95.1 area. On top of that, downbeat Australian jobs report and rising unemployment rate might limit any meaningful gains for the AUD/USD pair.

For technical aspect, RSI indicator 45 figures as of writing, suggesting tepid bear movement ahead. But looking at the MACD indicator, a golden cross is shown on the histogram, which indicates a upward trend for the pair. As for the Bollinger Bands, the price moved alongside the lower band first and then rebounded toward the moving average, which could be a buying signal for the pair. In conclusion, we think market will be bullish as the pair is eyeing a test of the 0.7432 resistance.

Resistance: 0.7432, 0.7471, 0.7536

Support: 0.7277, 0.7227, 0.7170


Economic Data

Currency

Data

Time (GMT + 8)

Forecast

JPY

GDP (QoQ) (Q3)

07:50

-0.2%

CNY

Industrial Production (YoY) (Oct)

10:00

3.0%

Market Focus

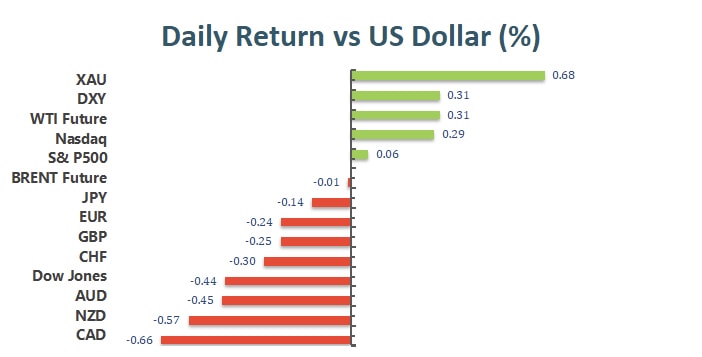
U.S. equities pared back a rebound Thursday after a selloff in the previous session due to fears that high inflation could spur more hawkish monetary policies. The Nasdaq Composite climbed 0.52% after plummeted 1.66% on Wednesday, while the Dow Jones slip 0.44%, following the 0.66% slump in the previous day.

The S&P 500 gained less than 0.1% — led by gains in materials and technology — after falling 0.8% Wednesday in its worst slump in more than a month. Tesla Inc. fluctuated after filings showed CEO Elon Musk unloaded $5 billion of stock. Meanwhile, Walt Disney Co. slid and Beyond Meat Inc. plunged after disappointing quarterly figures.

一張含有 文字 的圖片

自動產生的描述

Top White House officials don’t believe that Fed Chair Jerome Powell’s sale of shares in a stock index fund last year disqualify him from being appointed to a second term, according to people familiar with the matter.

Back to last October, Powell sold a stock index fund worth between $1 million and $5 million. The transaction was outside the Fed’s blackout period and months after the Fed had set its pandemic monetary policy. However, as the Fed chair nomination looms, even the tiniest move will come under close scrutiny.

President Joe Biden has said he will decide “fairly quickly” on his Fed chair pick, since Powell’s term as chair expires in February. According to Bloomberg news, the president has met last week with both Powell and Fed Governor Lael Brainard at the White House. Indications of the White House thinking on the trading situation don’t mean Powell will get the nomination. But they do suggest that area of contention over the current chair has receded. Some within the administration who support Brainard for chair are still concerned about the trades, the people said.


Main Pairs Movement:

The US dollar continues its uptrend amid the skyrocketing inflation that drove the investors to risk-off mode. The dollar index climbed to a fresh 2021 high of 95.15, and the greenback posted gains against all its major rivals, with the Australian dollar being the worst performer as the commodity market is experiencing a price correction.

The EUR/USD pair fell to its lowest for this year, hitting 1.1445 and ending the day a handful of pips above it. The selling pressure for the shared currency comes from central banks imbalances, as while the Fed has already kick-started tightening and may have to accelerate its pace, the ECB maintains a conservative stance.

Cable also plummeted to fresh lows around 1.3360 during the day, as poor UK data dragged the price action down. Loonie flirts with the 1.2600 level, posting a fresh monthly high, while Ninga regains 114.00, last seen trading at 114.05.

Gold retained its strength, advancing for a sixth consecutive day. Spot trades above $1,860 a troy ounce and has room to extend its rally towards the 1,900 mark. Crude oil prices seesawed between gains and losses, with WTI ending the day little changed at $81.50 a barrel, and Brent remaining at $82.50.


Technical Analysis:

GBPUSD (4- Hour Chart)

The pair GBP/USD declined on Thursday, following yesterday’s sharp slide to two-month lows under 1.342 level. The pair was trading higher and touched a daily high in late Asian session, but then started to see fresh selling after the release of UK GDP report. The downbeat data showed that the UK economy expanded by 1.3% during the July-September period, which is less than expected of 1.5%, and meanwhile marked a sharp deceleration from 5.5% growth reported in the previous quarter. Manufacturing Production data also fell short of expectations. Moreover, a stronger US dollar across the board and concerns that the UK government will trigger Article 16 of the Northern Ireland Protocol both weighed on the cable.

For technical aspect, RSI indicator 30 figures as of writing, suggesting that the pair is in oversold zone and a trend reversal could be expected. For the MACD indicator, the MACD is now sitting below the signal line, which also indicates a possible downward trend for the pair. Looking at the Bollinger Bands, the price moved out of lower band first, and now it’s moving alongside the band, which indicates a bear market. In conclusion, we think market will be bearish as the pair might have a chance to test the 1.3214 support, which was last seen in December 2020.

Resistance: 1.3607, 1.3698, 1.3835

Support: 1.3214, 1.3135


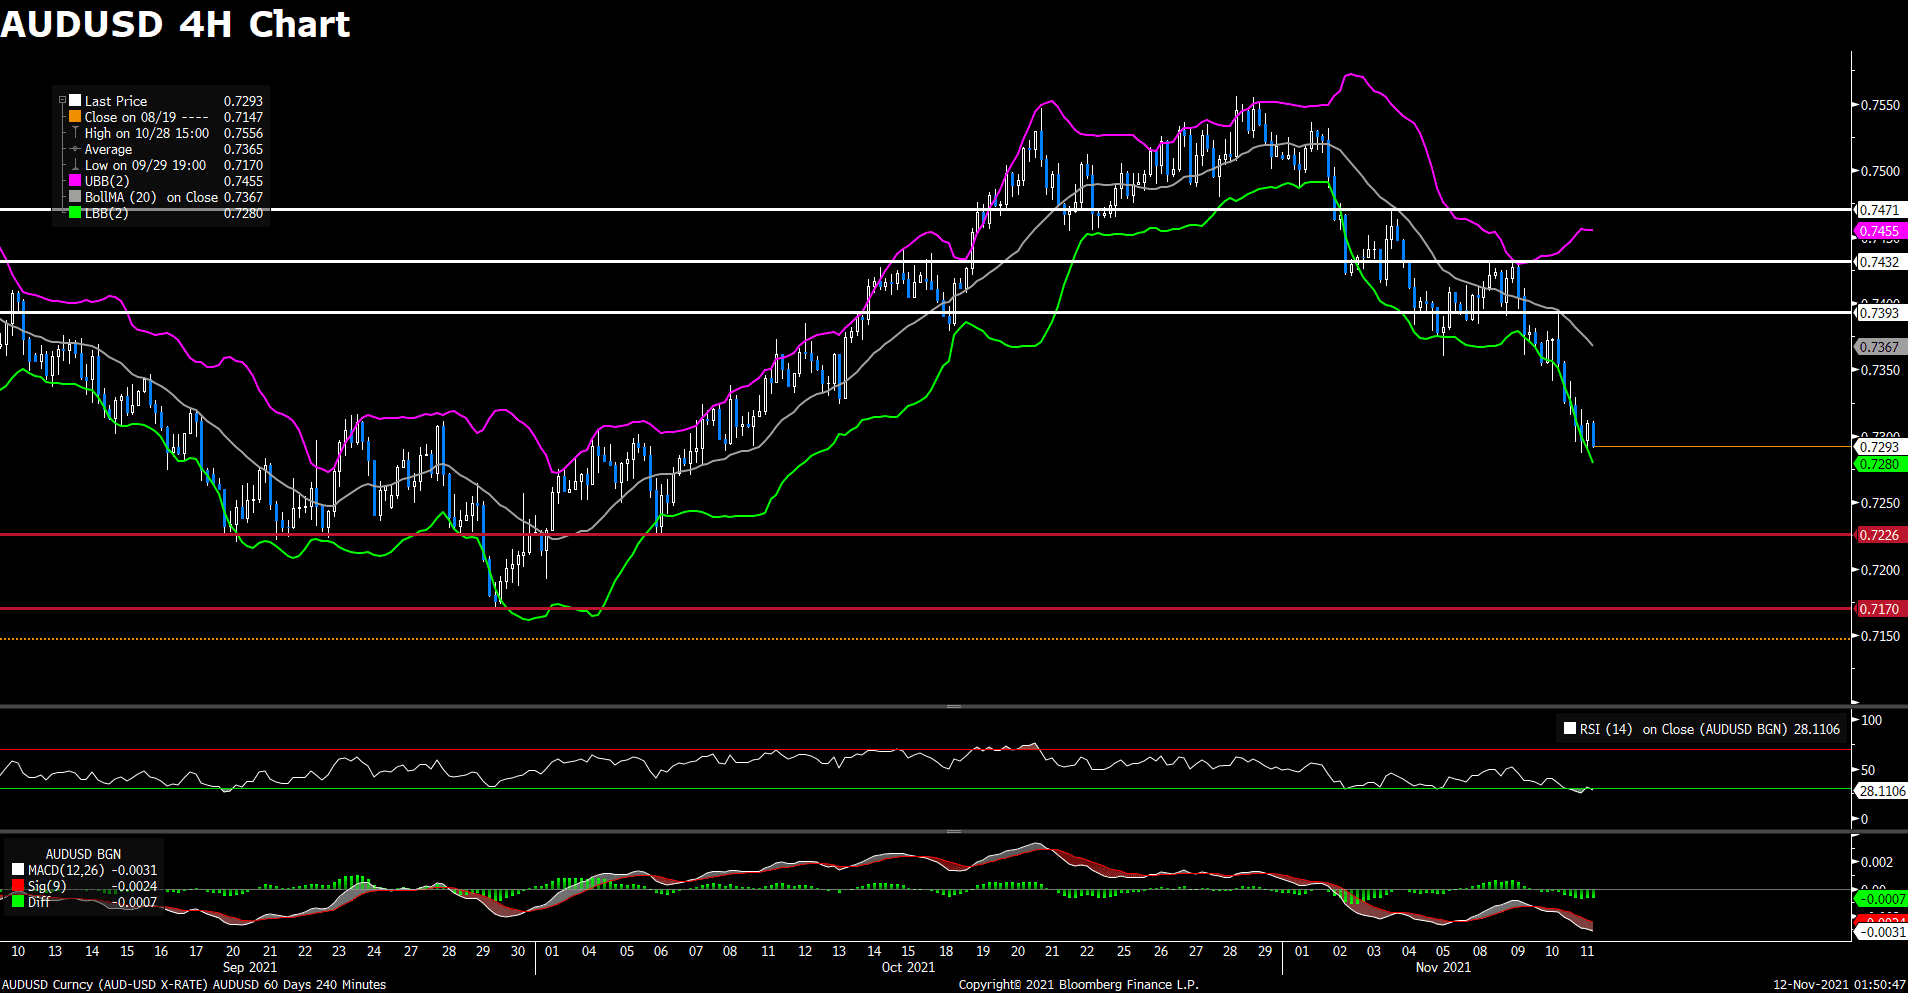
AUDUSD (4- Hour Chart)

The pair AUD/USD is having a tough week, staying in the negative territory for three days. The pair extends its previous decline, touching the lowest level since October 8. It is hovering around 0.73 area, currently losing 0.44% on a daily basis. AUD/USD continue its bearish traction amid weaker Australian jobs report today, as the Australian Employment Change for October dropped 46.3K, which is sharply lower than the 50K rise expected by analysts. The Unemployment Rate, meanwhile, jumping from 4.7% to 5.2%. In addition to the economic data, the renewed US dollar strength also weighed on the pair.

For technical aspect, RSI indicator 28 figures as of writing, suggesting that the selling pressure is too high, and the pair could experience some trend reversals. Looking at the Bollinger Bands, the price moves alongside the lower band, therefore the bearish momentum is likely to persist. In conclusion, we think market will be bearish as the pair will likely extend the downward move and head to test the 0.7226 support. A break under that support exposes the September 29 low at 0.7170.

Resistance: 0.7393, 0.7432, 0.7471

Support: 0.7226, 0.7170


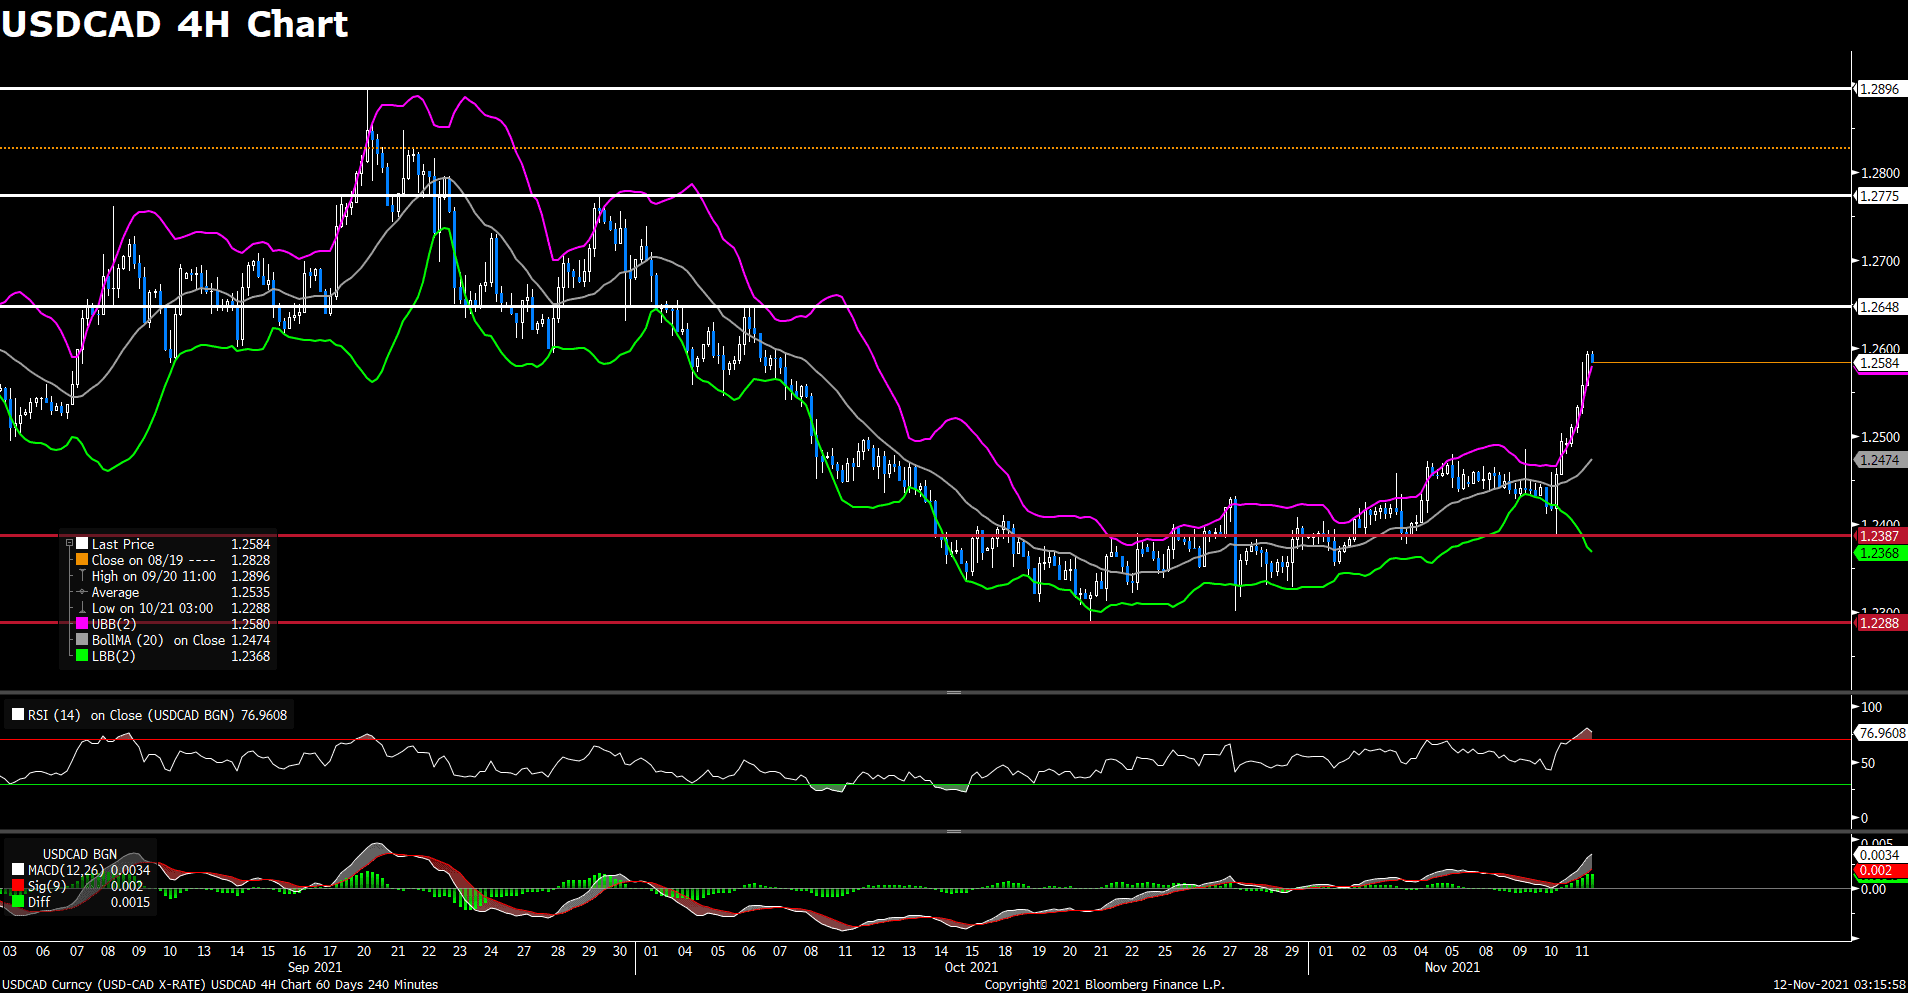
USDCAD (4- Hour Chart)

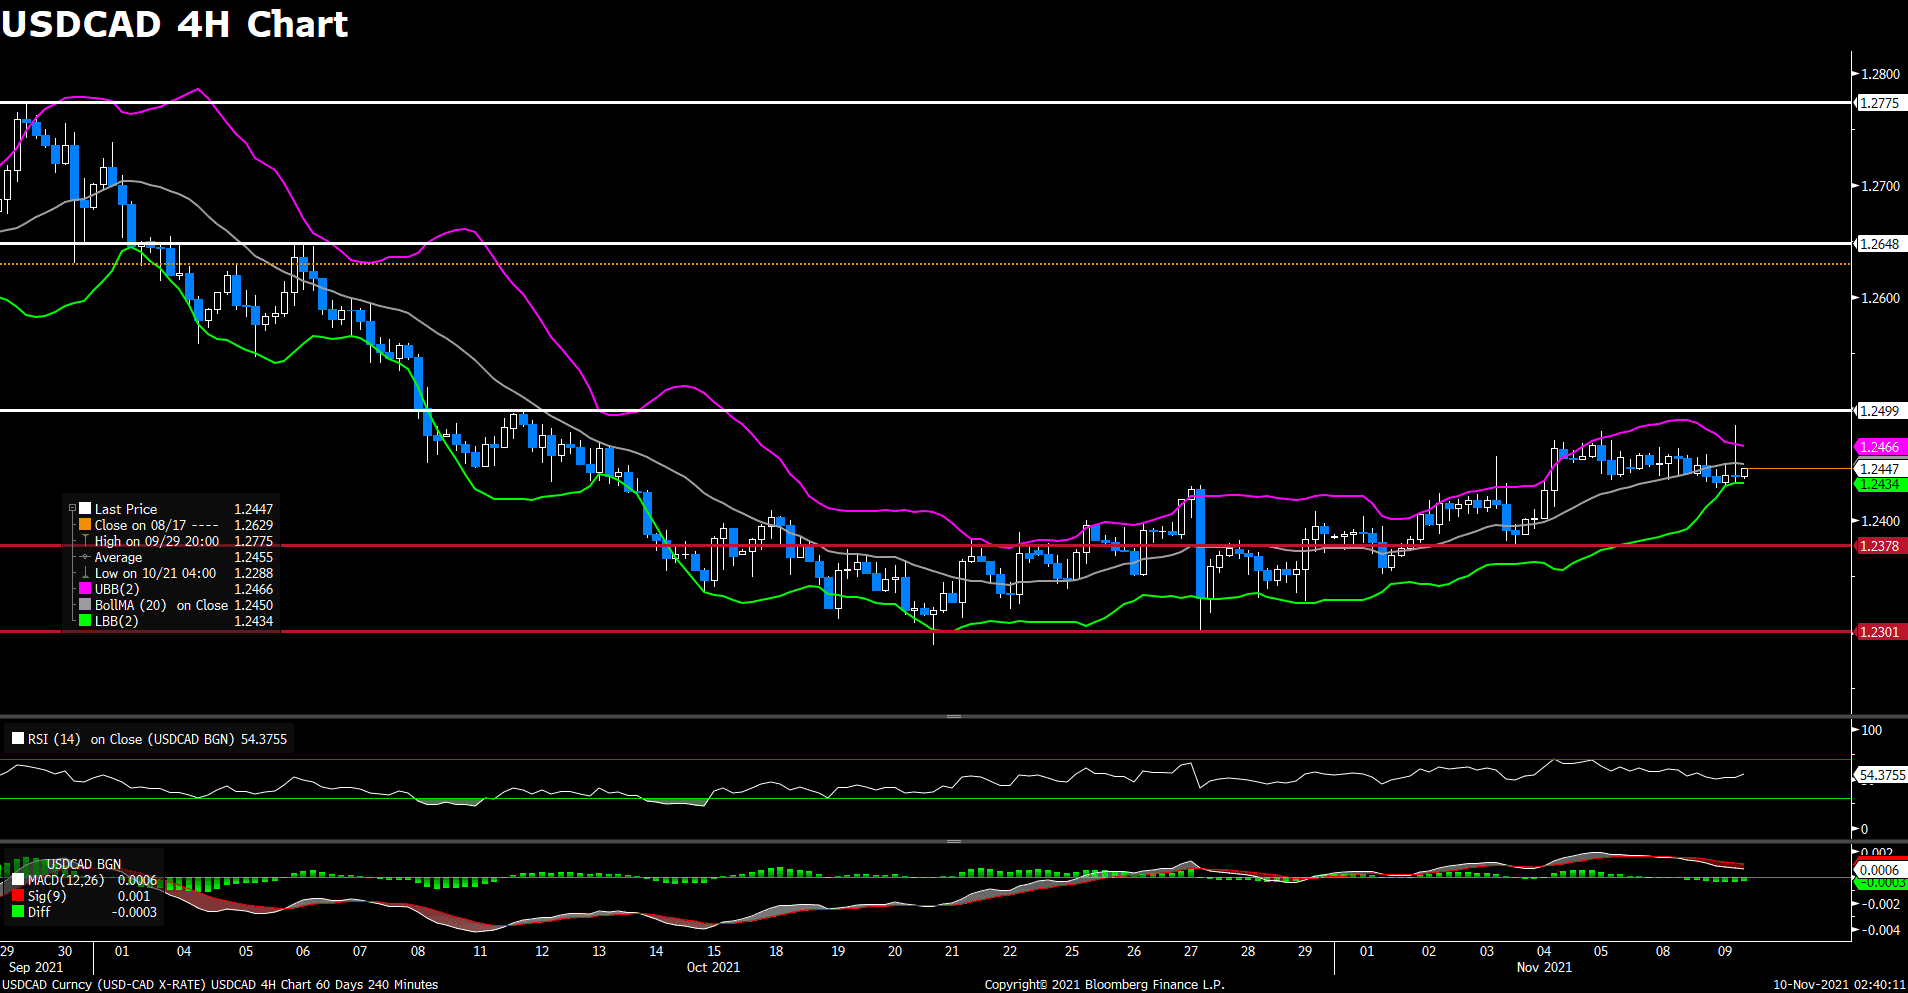
Following yesterday’s remarkable rally, the pair USD/CAD continued to advance on Wednesday amid surging US dollar. The pair climbed higher after breaking above the key resistance at 1.2480, now hoping to surpass the 1.260 level. The DXY index has gained bullish momentum since the release of Wednesday’s hot US CPI report. On top of that, oil prices dropped sharply amid fears that the Biden administration will release crude oil reserves to deal with high energy costs due to inflation pressures. The falling oil prices also dragged the commodity-linked loonie lower.

For technical aspect, RSI indicator 78 figures as of writing, suggesting that the pair is in overbought zone and a trend reversal could be expected. Looking at the MACD indicator, the MACD is now sitting above the signal line, which also indicates a upward trend for the pair. As for the Bollinger Bands, the price is moving out of the bands so a strong trend continuation can be expected. In conclusion, we think market will be bullish as the pair is eyeing a test of the 1.2648 resistance. A surge above that level should strengthen the positive tone.

Resistance: 1.2648, 1.2775, 1.2896

Support: 1.2387, 1.2288


Economic Data

Currency

Data

Time (GMT + 8)

Forecast

USD

JOLTs Job Openings (Sep)

23:00

10.300M

VT Markets The Adjustment Of Weekly Dividend Notification

Dear Client,

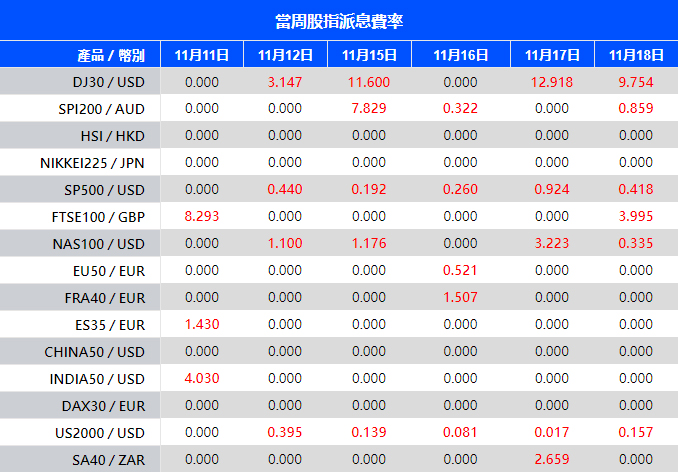
Warmly reminds you that the component stocks in the stock index spot generate dividends. When dividends are distributed, VT Markets will make dividends and deductions for the clients who hold the trading products after the close of the day before the ex-dividend date.

Indices dividends will not be paid/charged as an inclusion along with the swap component. It will be executed separately through a balance statement directly to your trading account, the comment for which will be in the following format “Div & Product Name & Net Volume ” .

Please note the specific adjustments as follows:

Note: The above data is for reference only, the actual execution data may be changed, please refer to the MT4/MT5 software for details.

If you’d like more information, please don’t hesitate to contact [email protected].

Market Focus

US stocks have continued to fall in the past trading day and have been weak since the market opened. After the US consumer price inflation report in October was much hotter than expected, inflation concerns led to massive sell-offs. The data shows that the overall CPI rose 6.2% YoY and 0.9% MoM, much higher than expected, while the core CPI rose 4.6% YoY and 0.6% MoM, which was also much higher than expected. The YoY growth rate of CPI was the highest since 1990, while the YoY growth rate of core CPI was the highest since the early 1990s. The worst inflation since 1990 has forced investors to believe more that the Fed will have to raise short-term interest rates faster from historical lows. This, in turn, made U.S. Treasury yields their biggest increase in months. Higher yields tend to hurt high-growth stocks, with the S&P 500, Dow Jones Industrial Average and Nasdaq all falling.

一張含有 文字 的圖片

自動產生的描述

After the market closed, the S&P 500 fell 0.8% to 4,646.71, the Dow Jones Industrial Average fell 0.7% to 36,079.94 and the Nasdaq fell 1.7% to 15,622.71. Energy stocks were one of the sectors with the largest decline in the S&P 500. Coterra Energy, Occidental Petroleum, Hess, Diamondback Energy and Halliburton all fell about 5%.


Main Pairs Movement:

The consumer price index surged to its highest level in 30 years in October, rising by 6.2% YoY, leading to soaring yields and falling stock markets, reflecting increased concerns about further tightening policies.

In such a state of high inflation, U.S. Treasury bond yields have soared, the U.S. dollar has risen, and gold has skyrocketed because of risk aversion. Hence, the market expects that the Fed will need to accelerate its bond scale reduction in the face of long-term inflation and currently market participants expect the Fed to raise interest rates in June 2022.

As the soaring of the greenback, most of the rival currencies fell against the U.S. dollar. At the time of writing, the EUR/USD settled below 1.1500, its lowest since July 2020, and stay around the level of 1.4864, and the GPB/USD near the level of 1.34178, which also below its support level.

XAU/USD hit a recent high of $1,868.61 and then retreated. It is currently at $1,852.33 per ounce, which is still on an upward trend.


Technical Analysis:

GBPUSD (4- Hour Chart)

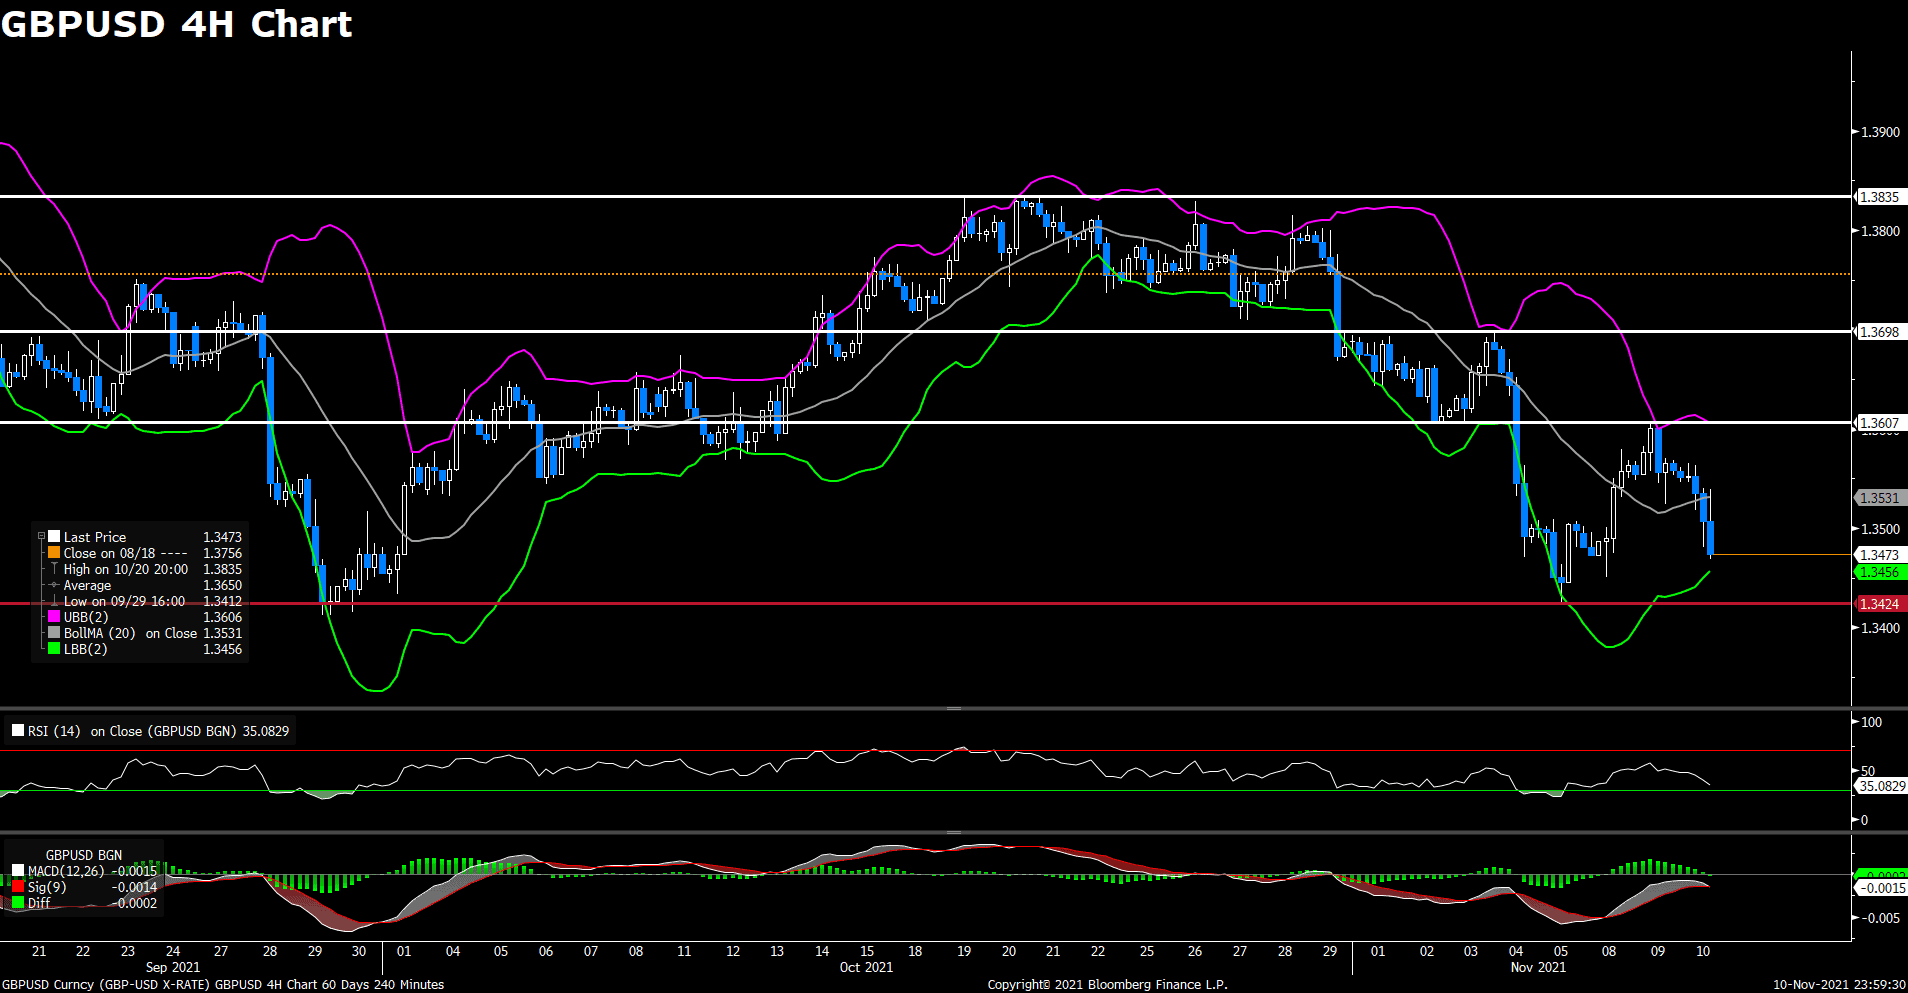
The pair GBP/USD declined on Wednesday, surrounding by heavy selling amid stronger US dollar across the board. The pair was trading in consolidation in early Asian session, but bear started to take over during European session. The US CPI data showed that the headline CPI rose 0.9% MoM in October and the yearly rate accelerated to the most since 1990 at 6.2%. Therefore, the hotter-than-expected US CPI underpinned the greenback as it reinforced speculations about an early policy tightening by the Fed. In the UK, dovish BoE and Brexit concerns keep weighing on the GBP/USD pair.

For technical aspect, RSI indicator 34 figures as of writing, suggesting bear movement ahead. For the MACD indicator, a death cross showed on the histogram, indicating a possible downward trend for the pair. If we take a look at the Bollinger Bands, the price crossed above the moving average after touching the higher band, therefore the lower band becomes the loss target. In conclusion, we think market will be bearish as the pair is heading to test the 1.3424 support. If the support line doesn’t hold, additional losses could be expected.

Resistance: 1.3607, 1.3698, 1.3835

Support: 1.3424


AUDUSD (4- Hour Chart)

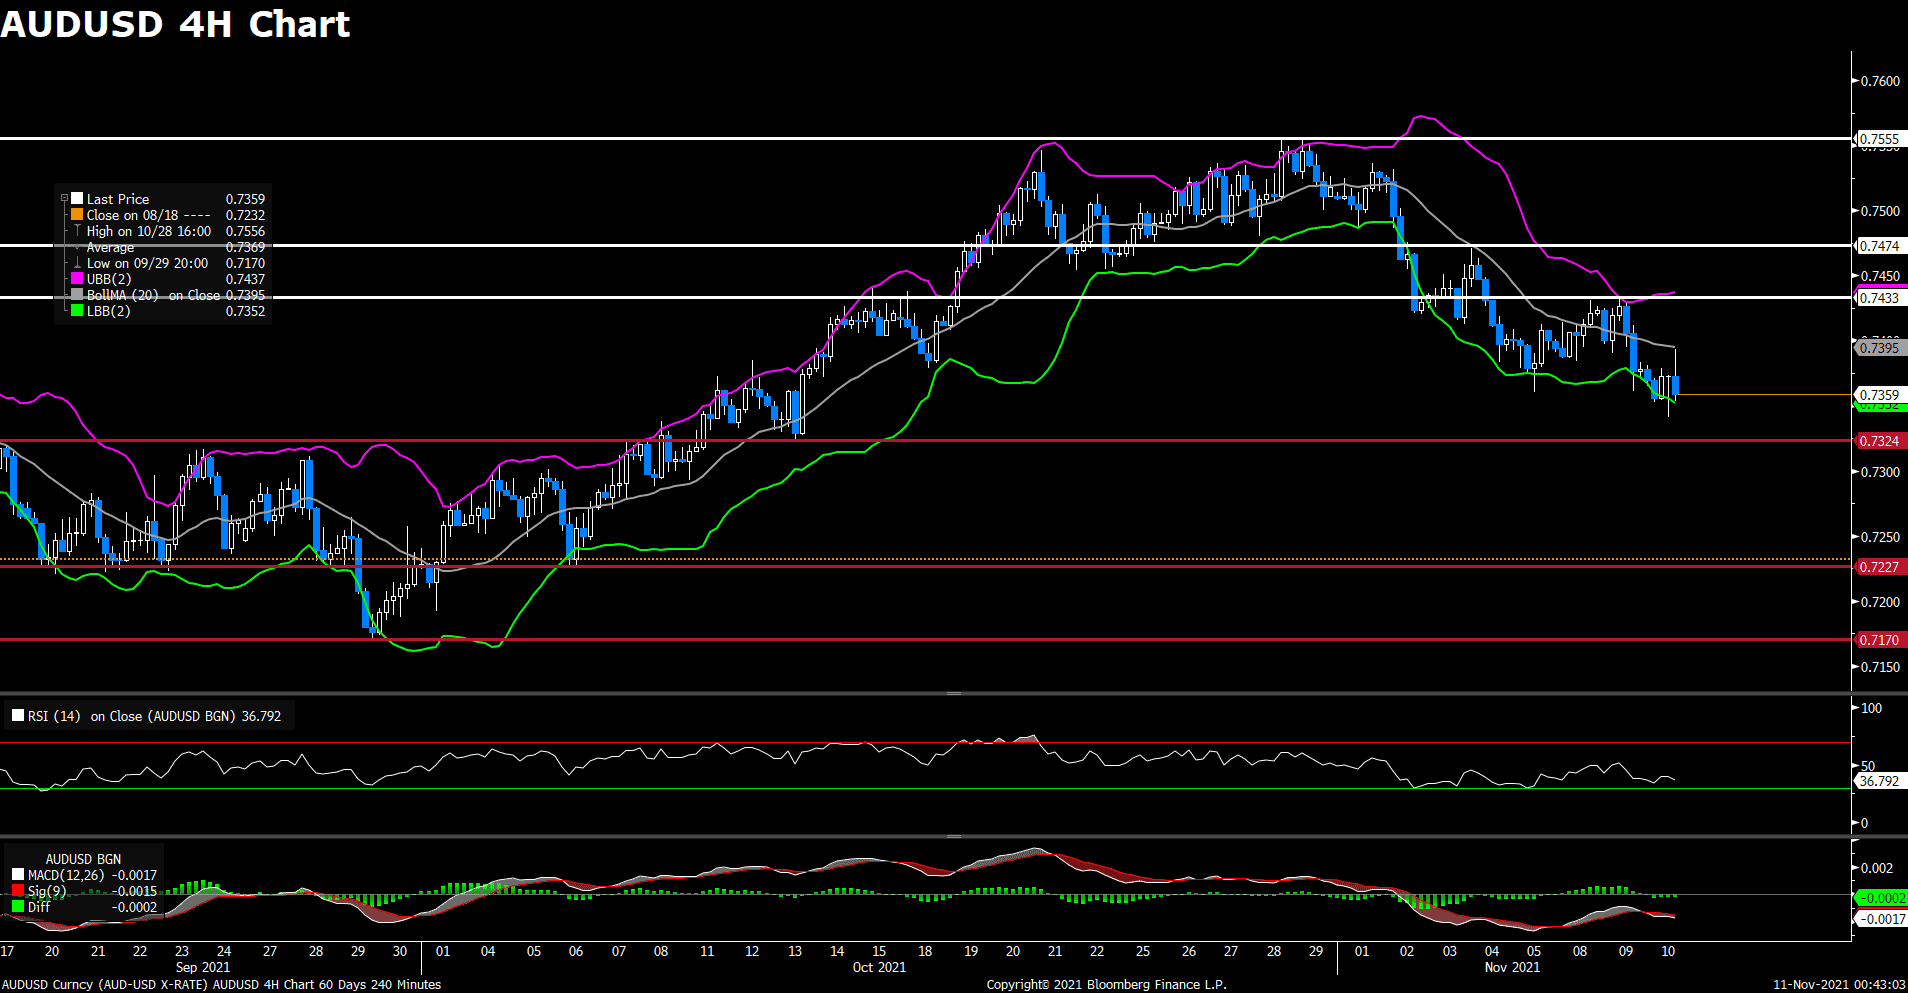
Following previous day’s heavy losses, the pair AUD/USD stay in the negative territory for the second day on Wednesday, currently losing 0.18% on a daily basis. The pair witnessed fresh buying after the releasing of the US CPI data, but then quickly reversed its intraday gains and dropped to monthly low. The hotter-than-expected US consumer report underpinned the US dollar and put some selling pressure on the pair, as the headline CPI rose 0.9% in October, which is the largest advance in four month. The data added to concerns about high inflation and acted as a tailwind for the US Treasury bond yields. Investors now await the release of the Australian jobs report tomorrow.

For technical aspect, RSI indicator 37 figures as of writing, suggesting bear movement ahead . As for the MACD indicator, The MACD is now sitting below the signal line, which also indicates a possible downward trend for the pair. Looking at the Bollinger Bands, the price moves alongside the lower band, therefore the bearish momentum is likely to persist. In conclusion, we think market will be bearish as the pair failed to break the 0.7433 resistance and now heading to test the 0.7324 support.

Resistance: 0.7433, 0.7474, 0.7555

Support: 0.7324, 0.7227, 0.7170


USDCAD (4- Hour Chart)

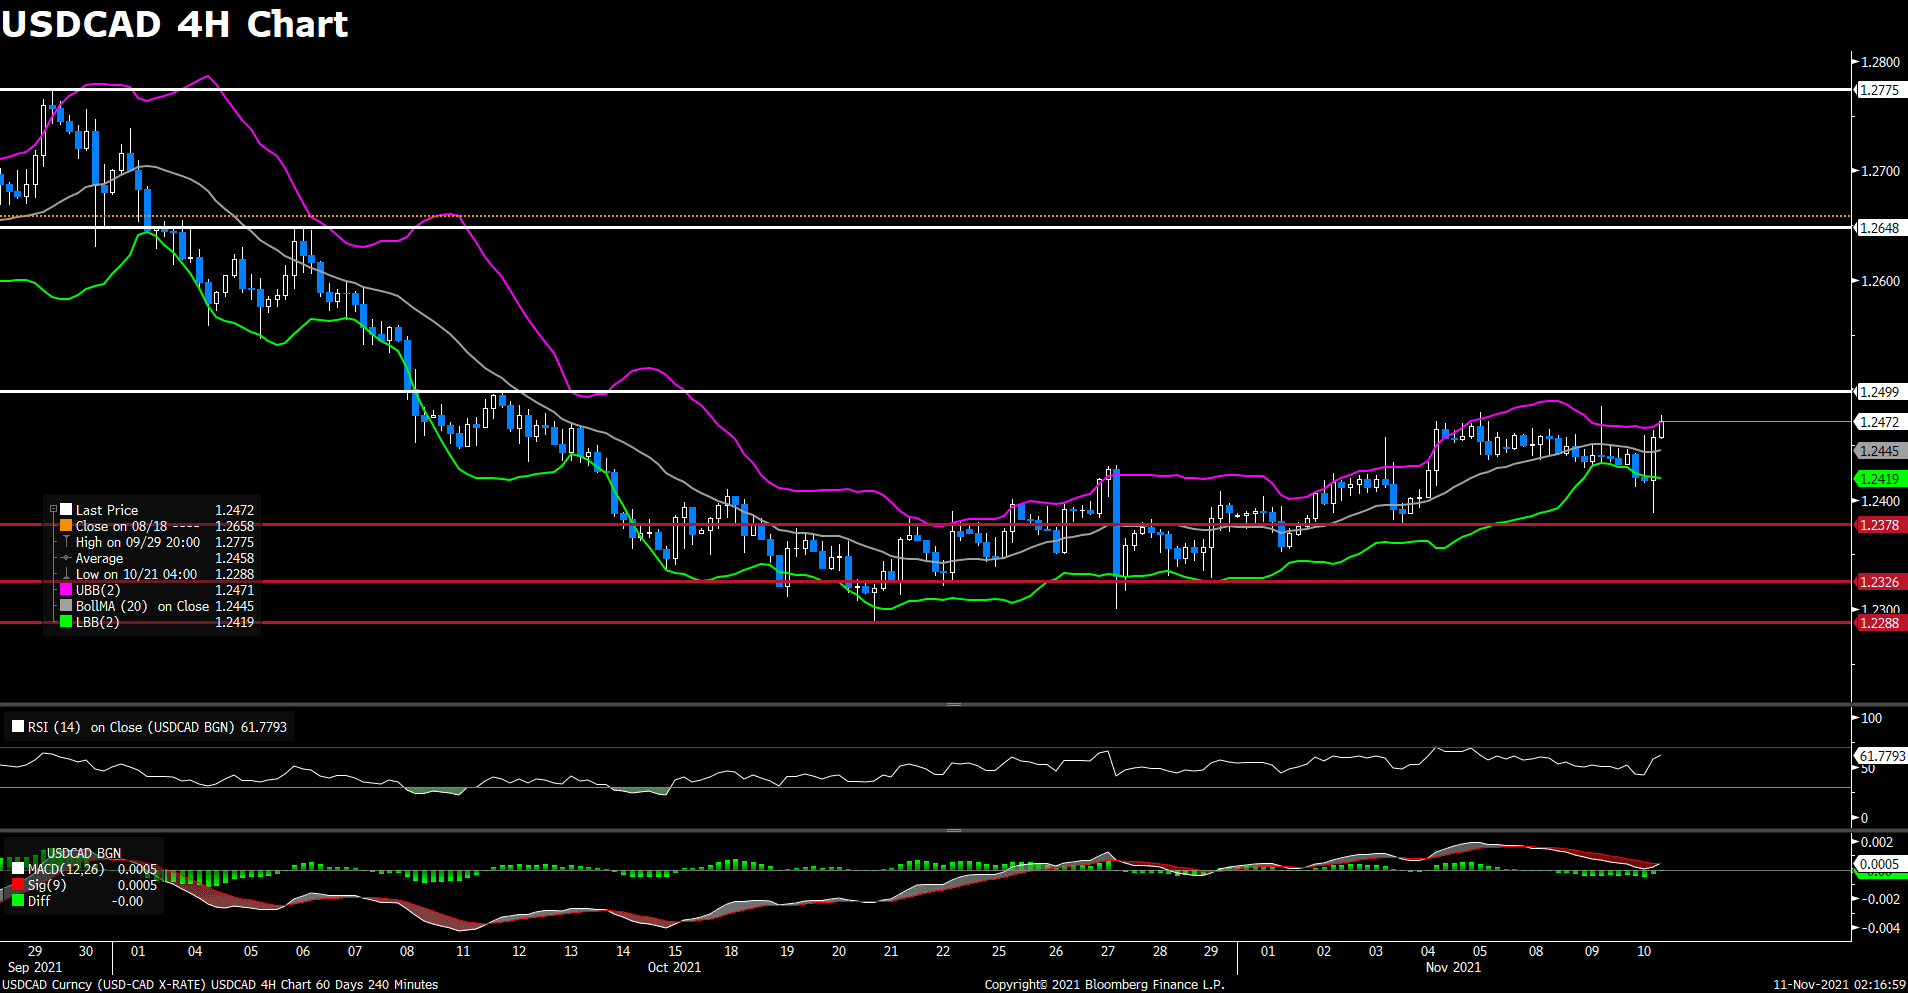
The pair USD/CAD advanced on Wednesday amid US dollar strength, touching a fresh daily top at the time of writing. Despite dropping to a six-day low after the US CPI report, the pair rebounded back above 1.245 level as the DXY index regain upside momentum. On top of that, falling crude oil prices weighed on the Loonie after the latest official weekly US crude oil inventory report released. The report showed that crude oil stocks had risen by just over 1M barrels last week. But crude oil’s near-term prospects should remain bullish given the fact that global oil demand is recovering to pre-pandemic levels.

For technical aspect, RSI indicator 60 figures as of writing, suggesting bull movement ahead. Looking at the MACD indicator, a golden cross is forming in the histogram, which indicates a bull market. As for the Bollinger Bands, the price is moving out of the bands so a strong trend continuation can be expected. In conclusion, we think market will be bullish as the pair may try to re-test the 1.2499 resistance, a recovery above 1.2499 should strengthen the positive tone.

Resistance: 1.2499, 1.2648, 1.2775

Support: 1.2378, 1.2326, 1.2288


Economic Data

Currency

Data

Time (GMT + 8)

Forecast

AUD

Employment Change (Oct)

08:30

50K

GBP

GDP (QoQ) (Q3)

15:00

1.5%

GBP

GDP (YoY) (Q3)

15:00

6.8%

GBP

Manufacturing Production (MoM) (Sep)

15:00

0.2%

EUR

ECB Forecast

18:00

VT Markets The notification of new product launched

Dear Client,

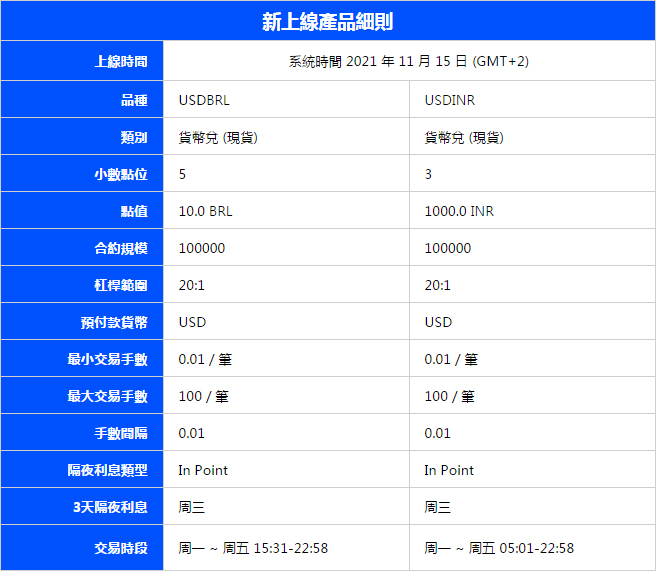
To provide our clients with a wealth of trading options, VT Markets will launch new products on Nov 15, 2021.

The details as shown in the table below.

Note: The above data is for reference only, please refer to the MT4/MT5 software for specific data.

Please check our official page to get more detail about Forex: https://www.vtmarkets.com/trading/markets/forex/

If you’d like more information, please don’t hesitate to contact [email protected].

Market Focus

U.S. stocks halted the longest rally since 2017, sending major indices lower from all-time highs as Treasuries surged. The S&P 500 fell for the first time in nine sessions, led by a drop in financial shares that came under pressure as the 10-year yield slumped to the lowest level in seven weeks. Nasdaq tumbled 0.6%, with Tesla Inc. sinking as much as 13% after a tweet by investor Michael Burry. PayPal Holdings Inc. fell after its guidance disappointed. And General Electric Co. rose after saying it will split into three companies.

一張含有 文字 的圖片

自動產生的描述

Every day in the early afternoon, money-market traders are glued to the Fed of New York’s website to see the results of the overnight reverse-repurchase agreement facility.

They’re not the only one. A screenshot of this obscure but important facility’s daily usage is religiously uploaded to a Reddit forum called Superstonk, a discussion board similar to WallStreetBets where users swap memes and stock tips. As usage of the facility swelled, the post regularly became one of the site’s most popular of the day, often attracting thousands of comments.

While professional traders check the central bank’s website to see how much excess liquidity the Fed is sopping up, many Reddit users are interested in, well, something else: Signs of an impending market crash. Or, in some cases, you guessed it: more evidence for why stocks like GameStop Corp. are headed “to the moon.”

If this all sounds a little weird, that’s because it is. There is no way for the type of individual traders who frequent Reddit boards to use the facility, yet the posts appear to be influencing their trading. And the behavior is worth scrutinizing because it’s the type of hive-mind theorizing that has a habit of beginning as a social-media curiosity and ending up having big effects in the real world, such as the wild price action in meme stocks earlier this year.


Main Pairs Movement:

The greenback maintained its tepid tone during the Asian session but became more attractive during US trading hours. The catalyst for the dollar’s demand was another sign of inflationary pressures spurring risk-off. Wall Street edged lower after the release of the US Producer Price Index, confirmed at 8.6% YoY in October.

The EUR/USD pair tried to breach 1.1600 a couple of times but was stopped by robust selling pressure. European Central Bank (ECB) policymakers’ comments were mixed toward the union’s future monetary policy. Klaas Knot said that conditions for a rate hike are very unlikely to be met in 2022, while Supervisory Board Chair Andrea Enria said low ECB interest rates are now hurting bank margins more than they are boosting lending volumes.

Dollar’s performance was mixed against its other major rivals. Cable hovers around 1.3550 after a failed attempt to recover above 1.3600. Ninga dived below the 113.00 threshold, while commodity-linked currencies seemed to lose their upward momentum, as the US EIA raising this year forecast for oil demand by 60,000 barrels per day.

Gold trades at fresh one-month highs around $1,830 a troy ounce amid dismal market sentiments. Crude oil prices soared as well, with WTI posting $84.50, and Brent last seen at $85.10. US Treasury yields declined further on Tuesday, with 10-year benchmark closed at 1.44%.


Technical Analysis:

AUDUSD (4- Hour Chart)

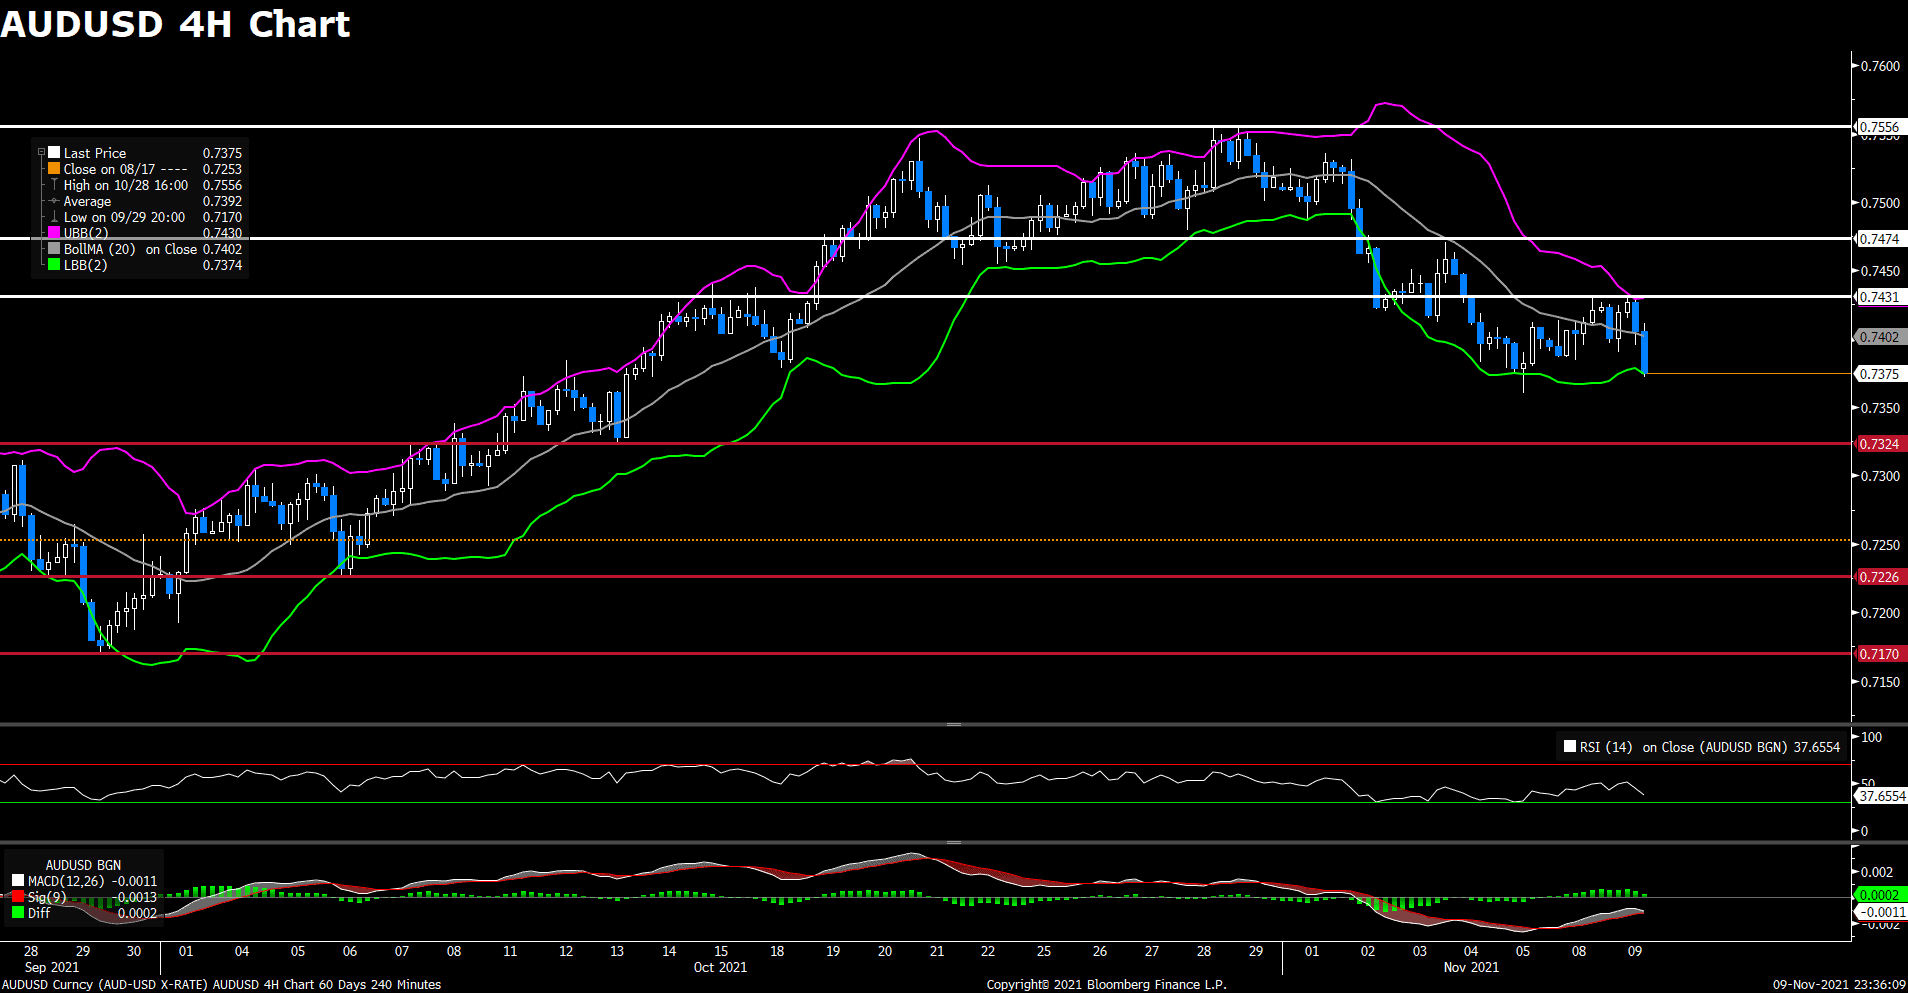
The pair AUD/USD declined on Tuesday, struggling to preserve its previous day rally. The pair was trading lower in early Asian session and touched a daily low under 0.74 level for a time. Even though AUD/USD tried to rebound back during European session, it started to see heavy selling at the time of writing. The National Australia Bank Business Confidence report showed 21 on Tuesday, as the easing of lockdown restrictions resulted in improvement in business confidence. But the upbeat data failed to underpinned AUD/USD, which currently drops towards 0.735 area.

For technical aspect, RSI indicator 38 figures as of writing, suggesting bear movement ahead. For the MACD indicator, the positive histogram starts to diminish which also indicates a possible downward trend for the pair. If we take a look at the Bollinger Bands, the price crossed above the moving average after touching the higher band, therefore the lower band becomes the loss target. In conclusion, we think market will be bearish as long as the 0.7431 resistance line holds.

Resistance: 0.7431, 0.7474, 0.7556

Support: 0.7324, 0.7226, 0.7170


EURUSD (4- Hour Chart)

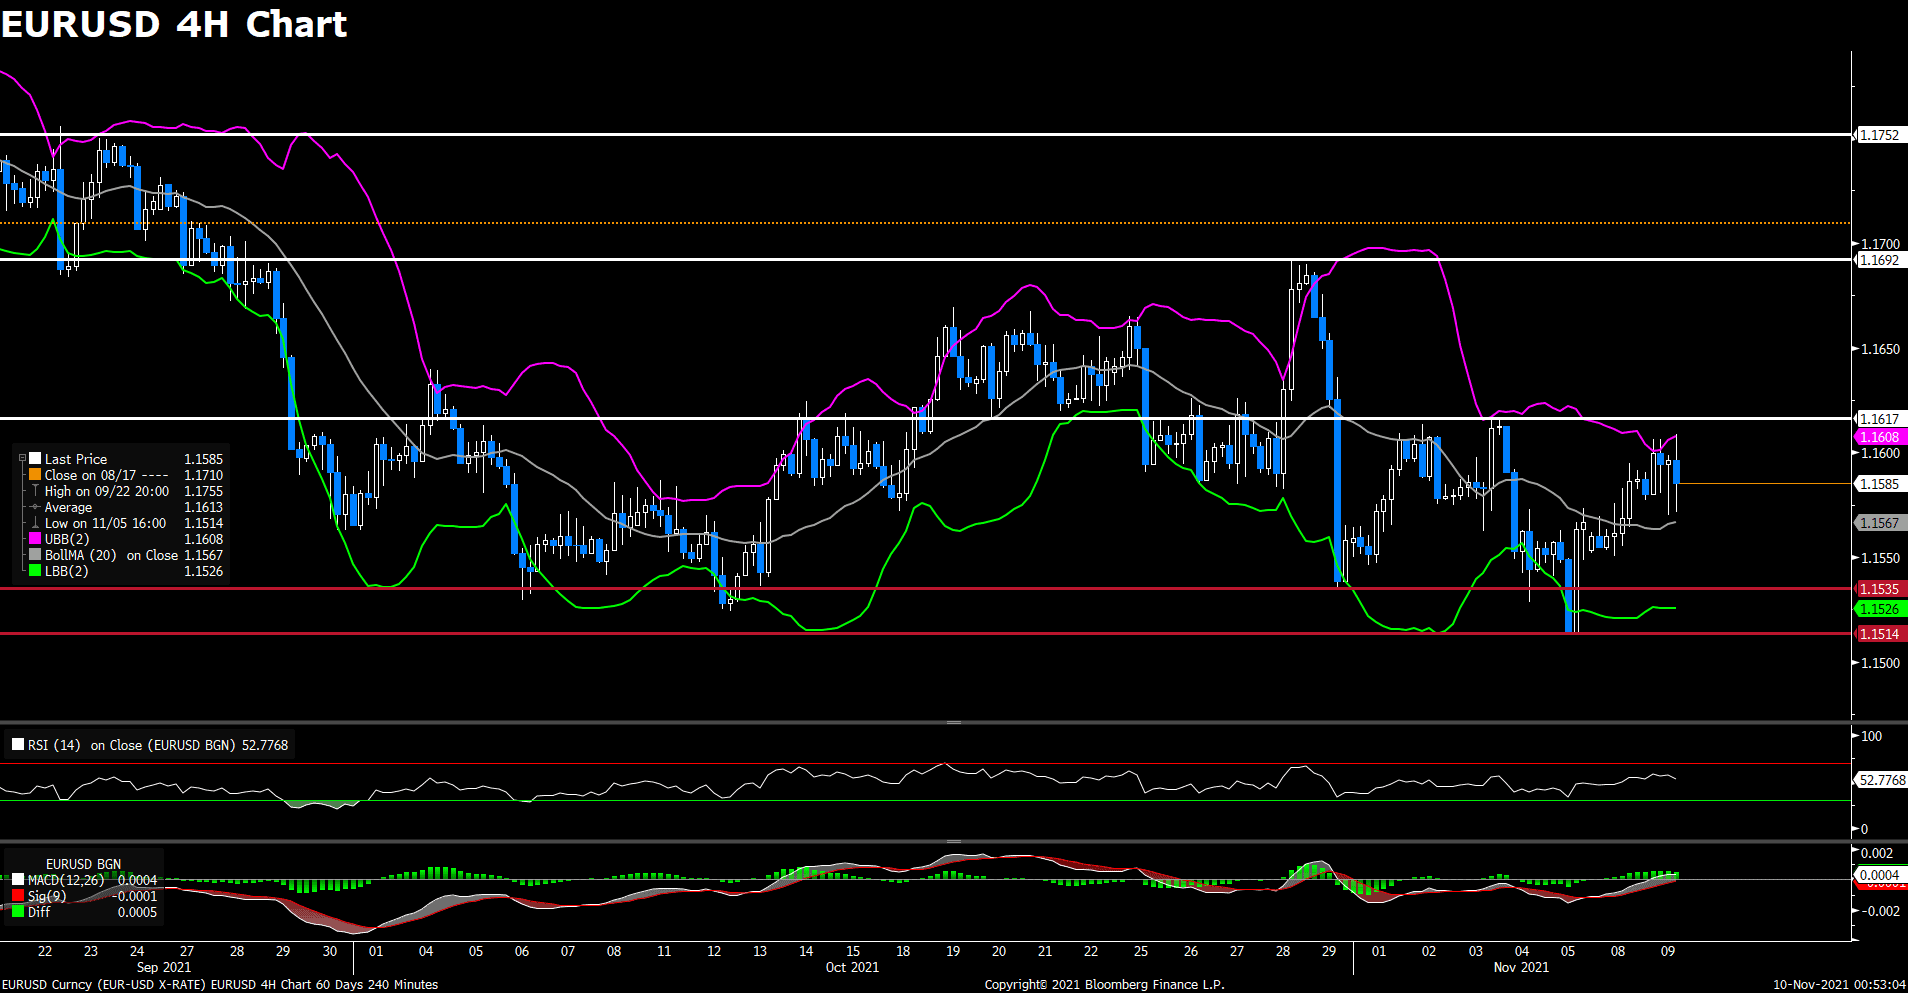
The pair EUR/USD edged higher on Tuesday, currently moving sideways around 1.159 area. The pair touched a three-day high in late Asian session but failed to preserve its bullish momentum as bears took over in European trading hours. EUR/USD was last seen trading at 1.1588, posting a 0.03% gain for the day. The renewed weakness witnessed in US dollar provided some supports for the pair. However, expectations that the Fed would adopt a more aggressive policy response to high inflation could limit the loss for the greenback and cap the upside for EUR/USD. Some FOMC officials also signaled that the Fed could raise rates by the end of 2022.

For technical aspect, RSI indicator 50 figures as of writing, suggesting that there is no obvious trend now. As for the MACD indicator, The MACD is now sitting above the signal line, which indicates a possible upward trend for the pair. Looking at the Bollinger Bands, the price fall towards the moving average after touch the upper band, which also indicate a downward trend continuation. In conclusion, we think market is consolidating now without clear direction. Market focus shifts to US CPI report on Wednesday and investors could look for trading impetus.

Resistance: 1.1617, 1.1692, 1.1752

Support: 1.1535, 1.1514


USDCAD (4- Hour Chart)

The pair USD/CAD now rising 0.02% on Tuesday despite weaker US dollar across the board. USD/CAD pair starting to see heavy selling after it touched a fresh daily top. Falling US Treasury bond yields weighed on the greenback, as the 10-year yield loses 4.15% for the day. On top of that, higher crude oil prices underpinned the Loonie as the rising jet fuel demand helped global oil demand recover back to pre-pandemic levels above 100M barrels per day. Investors now await tomorrow’s US CPI data, which is a key way to measure changes in purchasing trends and inflation.

For technical aspect, RSI indicator 53 figures as of writing, suggesting tepid bull movement ahead. As for the Bollinger Bands, the price is rising from the lower band and chances are high that it will move towards the upper band since prices have a tendency to bounce within the bands’ envelope. In conclusion, we think market will be bullish as the pair may try to re-test the 1.2499 resistance.

Resistance: 1.2499, 1.2648, 1.2775

Support: 1.2378, 1.2301


Economic Data

Currency

Data

Time (GMT + 8)

Forecast

USD

Core CPI (MoM) (Oct)

21:30

0.4%

USD

Initial Jobless Claims

21:30

265K

USD

Crude Oil Inventories

21:30

2.125M

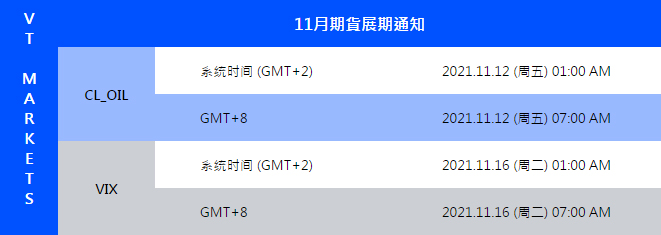
VT Markets Nov futures rollover announcement

Dear Client,

New contracts will automatically rolled-over as follows:

Please note:

• The rollover will be automatic, and any existing open positions will remain open.

• Positions that are open on the expiration date will be adjusted via a rollover charge or credit to reflect the price difference between the expiring and new contracts.

• To avoid CFD rollovers, clients can choose to close any open CFD positions prior to the expiration date.

• Clients should ensure that take profits and stop losses are adjusted before this rollover occurs.

If you’d like more information, please don’t hesitate to contact [email protected].

Market Focus

Major three indexes closed at a record high on Monday, as investors bought materials, energy and technology stocks because of their apparent optimism about the economic outlook. Last night, the Dow Jones Industrial Average rose 0.29% and up 104.27 points, the S&P 500 inched up by 4.17 points, or 0.1%, and the Nasdaq Composite Index finished up 0.07% to close at 15,982.36.

一張含有 文字 的圖片

自動產生的描述

The S&P 500 rose for the eighth day in a row, tying the longest streak of gains since April 2019. After Congress passed a $1 trillion infrastructure bill on Friday, shares of construction-related companies saw the biggest gains. Mining company Freeport-McMoRan, construction materials stock Vulcan and steel company Nucor are significant risers in the S&P 500 index. In addition, construction equipment manufacturer Caterpillar rose 4% and heavy equipment maker Deere’s shares rose about 1.6%.On the other hand, after chip manufacturer AMD announced that it had acquired Meta as a chip customer and demonstrated new chip products, its stock price rose 10.1%. One aspect of the loss is Tesla, the company’s share price fell 4.84% after CEO Elon Musk said that he would sell 10% of the company’s shares based on the results of a poll he conducted on Twitter over the weekend. Last but not least, some companies will announce their financial results in the near future, healthcare services and products company Cardinal Health will announce financial results on Tuesday, and entertainment giant Walt Disney will announce on Wednesday.


Main Pairs Movement:

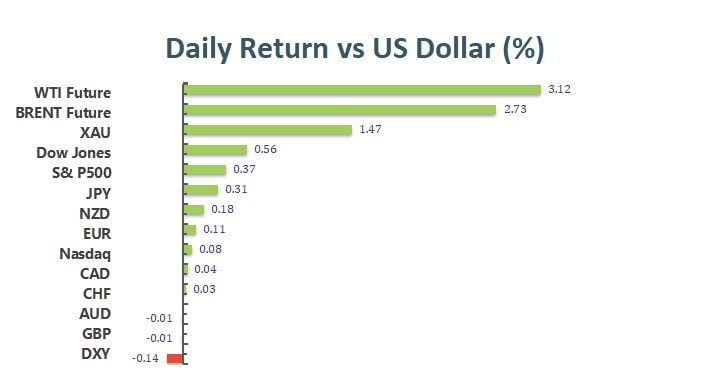
Due to the collapse of the real yield in the United States, the U.S. dollar fell, which gave the currency a good rebound against the U.S. dollar. In particular, the price of gold received huge support, soaring to a new one-month high of $1,826.43 per ounce, and closing at a nearby level.

The EUR/USD is close to 1.1600, but still maintains the continuation pattern between 1.15685 and 1.16153, while the GBP/USD continued to rebound to the 1.3550 price area after a strong rebound after hitting the support level of 1.34301 last Friday. Commodity-related currencies rose slightly, with AUD/USD trading near 0.7420 and USD/CAD trading at the 1.2440 price range. Although the tone of Wall Street is better, the USD/JPY is still facing selling pressure, falling to the 113.20 area.

On the cryptocurrencies end, Ether soared by more than 4% in 24 hours on Monday, setting a record high of over $4,700. At the same time, Bitcoin rose 7% to $66,250 and recovered to a record high above $66,900 set at the end of October.


Technical Analysis:

GBPUSD (4- Hour Chart)

The pair GBP/USD advanced on Monday, trading around daily tops at the time of writing. The pair was flirting with 1.439 level in early Asian session and started to see fresh selling after European session began. GBP/USD is currently pushed higher towards 1.358 area amid weaker US dollar across the board, as the risk-on market sentiment acted as a headwind for the safe-haven dollars. The DXY index loses 0.12% for the day and underpinned the GBP/USD pair, but the higher US bond yields should cap the upside for the pair. Meanwhile in UK, the dovish BoE and Brexit concerns might also cap gains for the major.

For technical aspect, RSI indicator 52 figures as of writing, suggesting tepid bull movement ahead. As for the MACD indicator, the positive histogram also indicates a possible upward trend for the pair. If we take a look at the Bollinger Bands, the price crossed above the moving average after touching the lower band, therefore the upper band becomes the profit target. In conclusion, we think market will be bullish as the pair is now heading to test the 1.3698 resistance. Later in the session, BoE Governor Andrew Bailey will speak, and his comments may provide some trading opportunities to the GBP/USD pair.

Resistance: 1.3698, 1.3751, 1.3835

Support: 1.3424


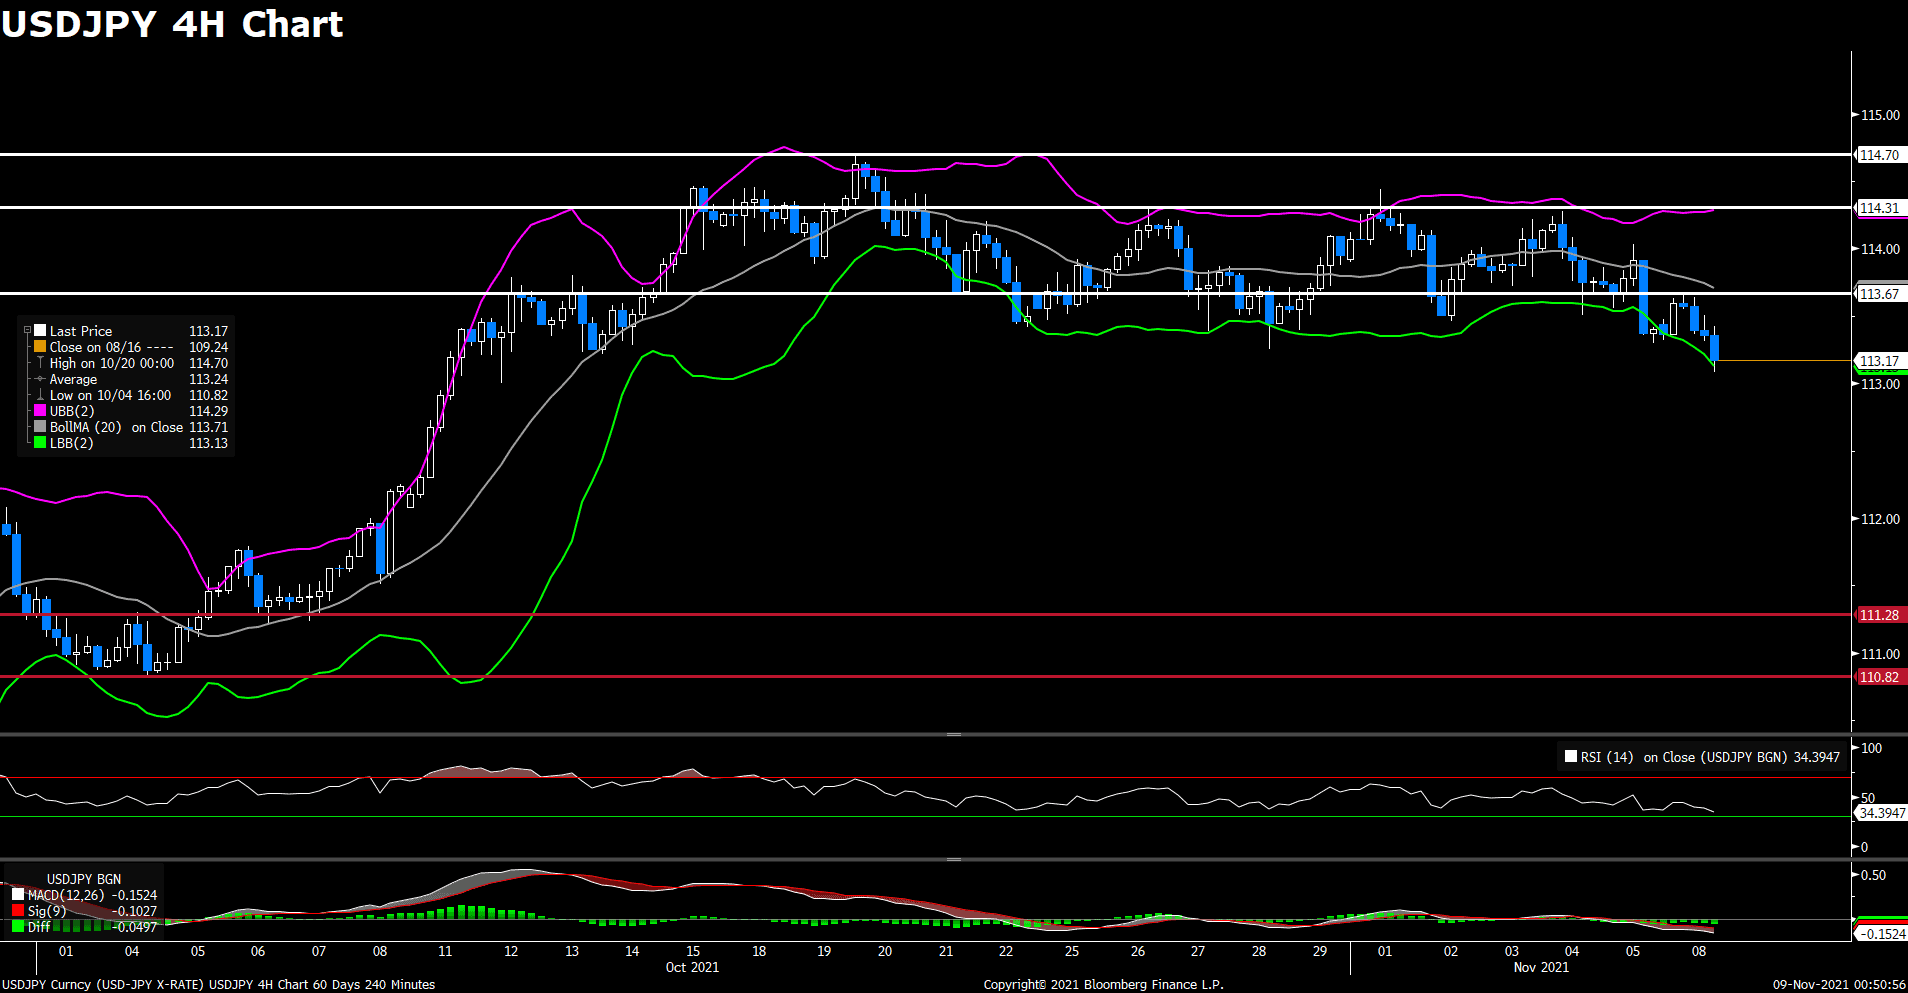
USDJPY (4- Hour Chart)

The pair USD/JPY declined on the first day of a new trading week, touching the lowest level since October 12. The pair was trading higher in early Asian session, but the stronger Japanses Yen started to drag the pair down toward 113.3 area. USD/JPY was last seen trading at 113.24, posting a 0.12% loss for the day. The renewed selling witnessed in US dollar continue to weigh on the pair, as the greenback weakened in response to last Friday’s US labour market report. On top of that, the Japanese Yen was the top performer today despite the risk appetite.

For technical aspect, RSI indicator 35 figures as of writing, suggesting bear movement ahead. As for the MACD indicator, The MACD is now sitting below the signal line, which indicates a possible downward trend for the pair. Looking at the Bollinger Bands, the price continue to fall toward the lower band, which also indicate a bear market. In conclusion, we think market will be bearish as long as the 113.67 resistance line holds. Investors now await the PPI data released on Tuesday, which could trigger market moves following last week’s FOMC meeting.

Resistance: 113.67, 114.31, 114.70

Support: 111.28, 110.82


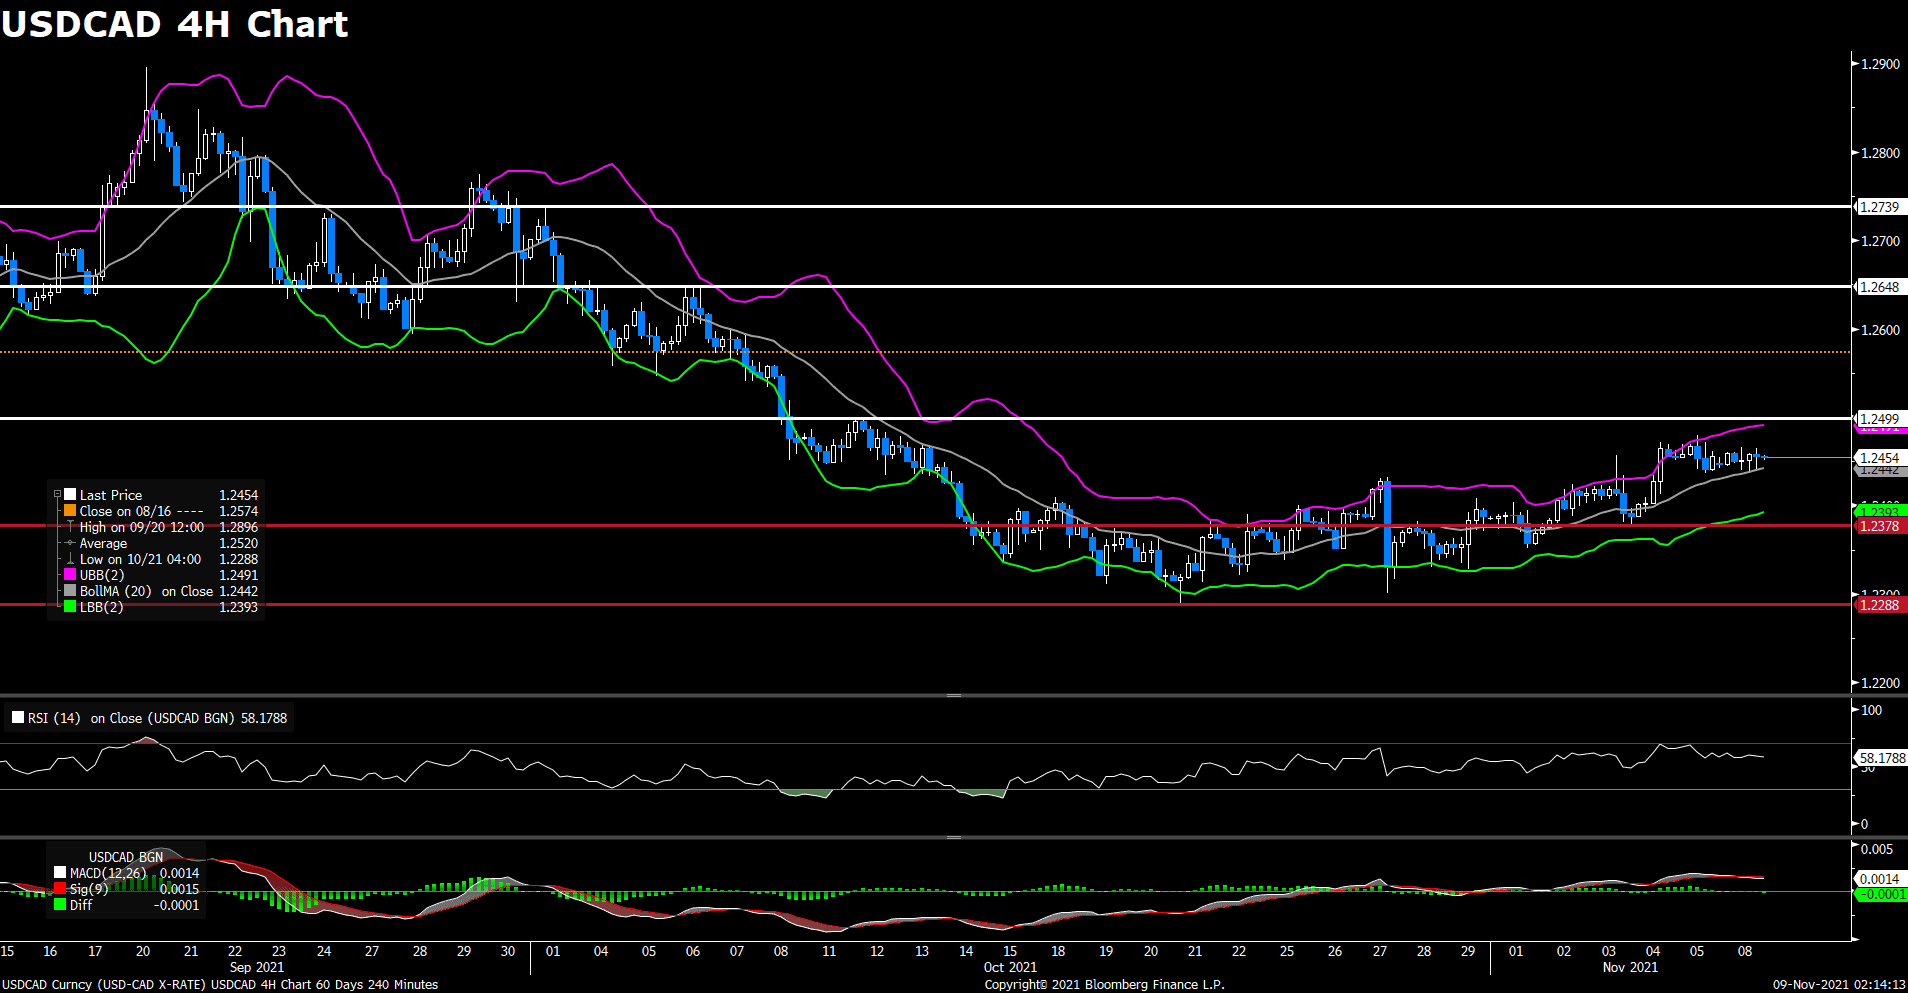
USDCAD (4- Hour Chart)

The pair USD/CAD edged lower on Monday, flirting with 1.245 area most of the day and now staying in negative territory. Higher crude oil prices underpinned the Loonie as the passage of the $550B US infrastructure investment package is likely to improve the US growth and oil demand outlook. Global jet fuel demand is also set to rebound back to pre-pandemic levels as countries reduce travel restrictions. Moreover, the bearish momentum witnessed in US dollar keep weighing on USD/CAD pair.

For technical aspect, RSI indicator 58 figures as of writing, suggesting bull movement ahead. But the MACD indicator showed a death cross on the histogram, indicating a possible upward trend for the pair. As for the Bollinger Bands, the price is falling from the upper band and chances are high that it will touch the moving average. In conclusion, we think market is consolidating now around 1.24 area. But if the bearish momentum persist and drag the pair under 1.2378 support, some additional near-term losses can be expected.

Resistance: 1.2499, 1.2648, 1.2739

Support: 1.2378, 1.2288


Economic Data

Currency

Data

Time (GMT + 8)

Forecast

EUR

German ZEW Economic Sentiment (Nov)

18:00

20.0

EUR

ECB President Lagarde Speaks

21:00

4.7%

USD

PPI (MoM) (Oct)

21:30

0.6%

USD

Fed Chair Powell Speaks

22:00

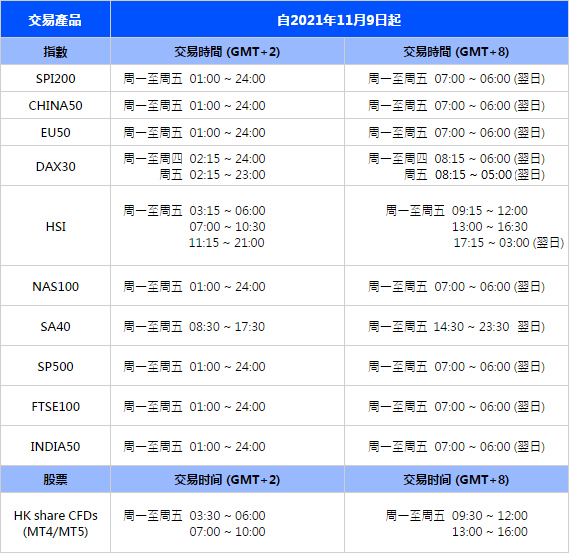
VT Markets Notification of trading adjustment

Dear Client,

VT Markets is devoted to offering a favorable trading environment to our clients. After a punctilious assessment, from Nov. 9th, 2021, the trading hours of following products will changed.

Note: The above data is for reference only, the actual execution data may be changed, please refer to the MT4/MT5 software for details.

If you’d like more information, please don’t hesitate to contact [email protected].

Stocks surged at the end of the week, with major indices rallying to fresh highs as investors reacted positively to the October jobs reports, which showed a better-than-expected pick-up in payroll growth and further improvement in the unemployment rate. The S&P 500 rose about 2% for the week to mark a fifth consecutive weekly gain — its longest winning streak since August 2020. The Nasdaq also jumped to a record as the broad move higher in tech shares, and the Dow reached a record close as well.

一張含有 文字 的圖片

自動產生的描述

Elon Musk’s social media followers have spoken: The Tesla Inc. chief should sell 10% of his stake in the electric-car maker. A majority of 3.5 million Twitter users said they’d support the move in a poll that Musk launched Saturday when he floated the idea of selling the stock, which is valued at about $21 billion based on 170.5 million Tesla shares he holds. The poll closed shortly after 2:15 p.m. Sunday in New York, with about 58% of respondents backing the idea of the sale.

“I was prepared to accept either outcome,” Musk said in a tweet after the poll closed.

In Sunday trading on FTX, a digital asset version of Tesla’s shares recently fetched $1,138.95 — 6.8% lower than Friday’s close for the real stock — suggesting Musk’s tweeting may cause the shares to fall when Wall Street wakes up Monday.

While large sales by insiders are often seen as a negative signal, a sale of this size won’t alter Tesla’s story in a meaningful way, said Dan Ives, an analyst at Wedbush Securities. Demand remains high for Tesla shares among both institutional and retail investors, he said. The unorthodox step of getting buy-in from fans and investors via a poll may also ease any concerns.


Main Pairs Movement:

The greenback was mixed against G10 peers as the trading week gets underway in Sydney. The dollar’s strength shattered after the upbeat job reports, as the risk-on mood arose, weighing on the save-heaven bucks.

EUR/USD was up 0.12% to 1.1568 after touching a year-to-date low of 1.1514 on Friday. Despite an abundance of Covid-19 shots, countries from Germany to Greece have reported record infections in recent days. GBP/USD declined a modest 0.03% to 1.3494 later the Thursday’s massive plummet. The impact of Bank of England’s dovish statement was so huge that the pound had yet to recover from the loss.

USD/CAD held at familiar 1.2452; closed last week up 0.6% for a third straight weekly gain. Bank of Canada Governor Tiff Macklem says the central bank is “in control” of inflation. The November 17th CPI data will provide further insight in the bank’s statement. USD/JPY posted a 0.31% loss on Friday, plunged after the US NFP release and closed at 113.39.

Commodities ended the day in green. Gold jumped nearly 1.5% to $1816.17 a troy ounce. Crude oil posted gains as well. The WTI was last seen $81.34, 2.5% up on Friday, and Brent up 1.73% to $82.32.


Technical Analysis:

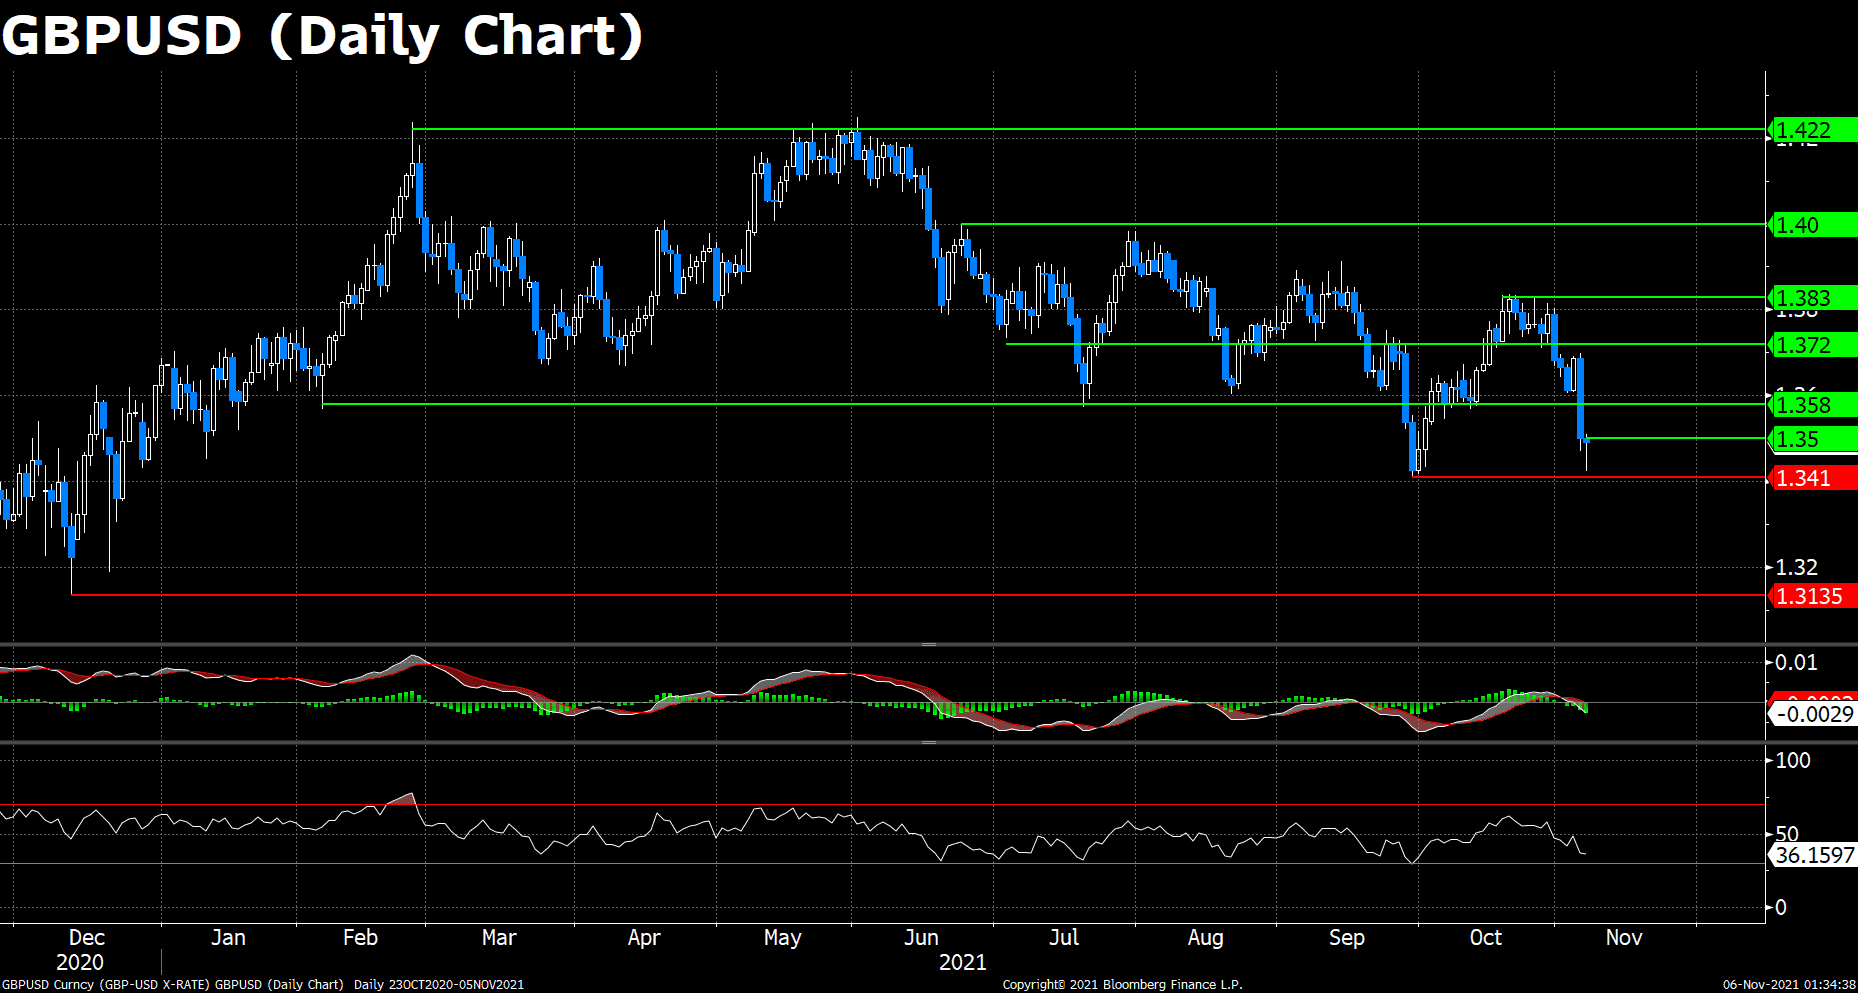
GBPUSD (Daily Chart)

GBP/USD plummeted over 1.3% on Thursday after the Bank of England (BoE) voted to continue its bond-purchase program and to remain the interest rate unchanged at 0.1%. Cable extended further south on Friday and a recovery seems difficult in the short term. The pair trades at 1.3440 at the moment of writing, declined 1.8% from the open price of the week. 

On the technical front, after the failing attempt to breach the 20-day moving average (DMA) on Wednesday, the unstoppable downward traction has dragged Cable over the lower bound of the Bollinger Bands. Moreover, the longer-term DMAs shifted to the downside on Friday. The diving 50 DMA is endorsing the growing downtrend and could boost it with a bearish crossover of the 200 DMA. The MACD and RSI also appears bearish, and despite the huge selling pressure, the RSI indicator has not reached the oversold territory yet, suggesting the downfall may proceed. 

Resistance: 1.3500, 1.3567, 1.3720

Support: 1.3410, 1.3135


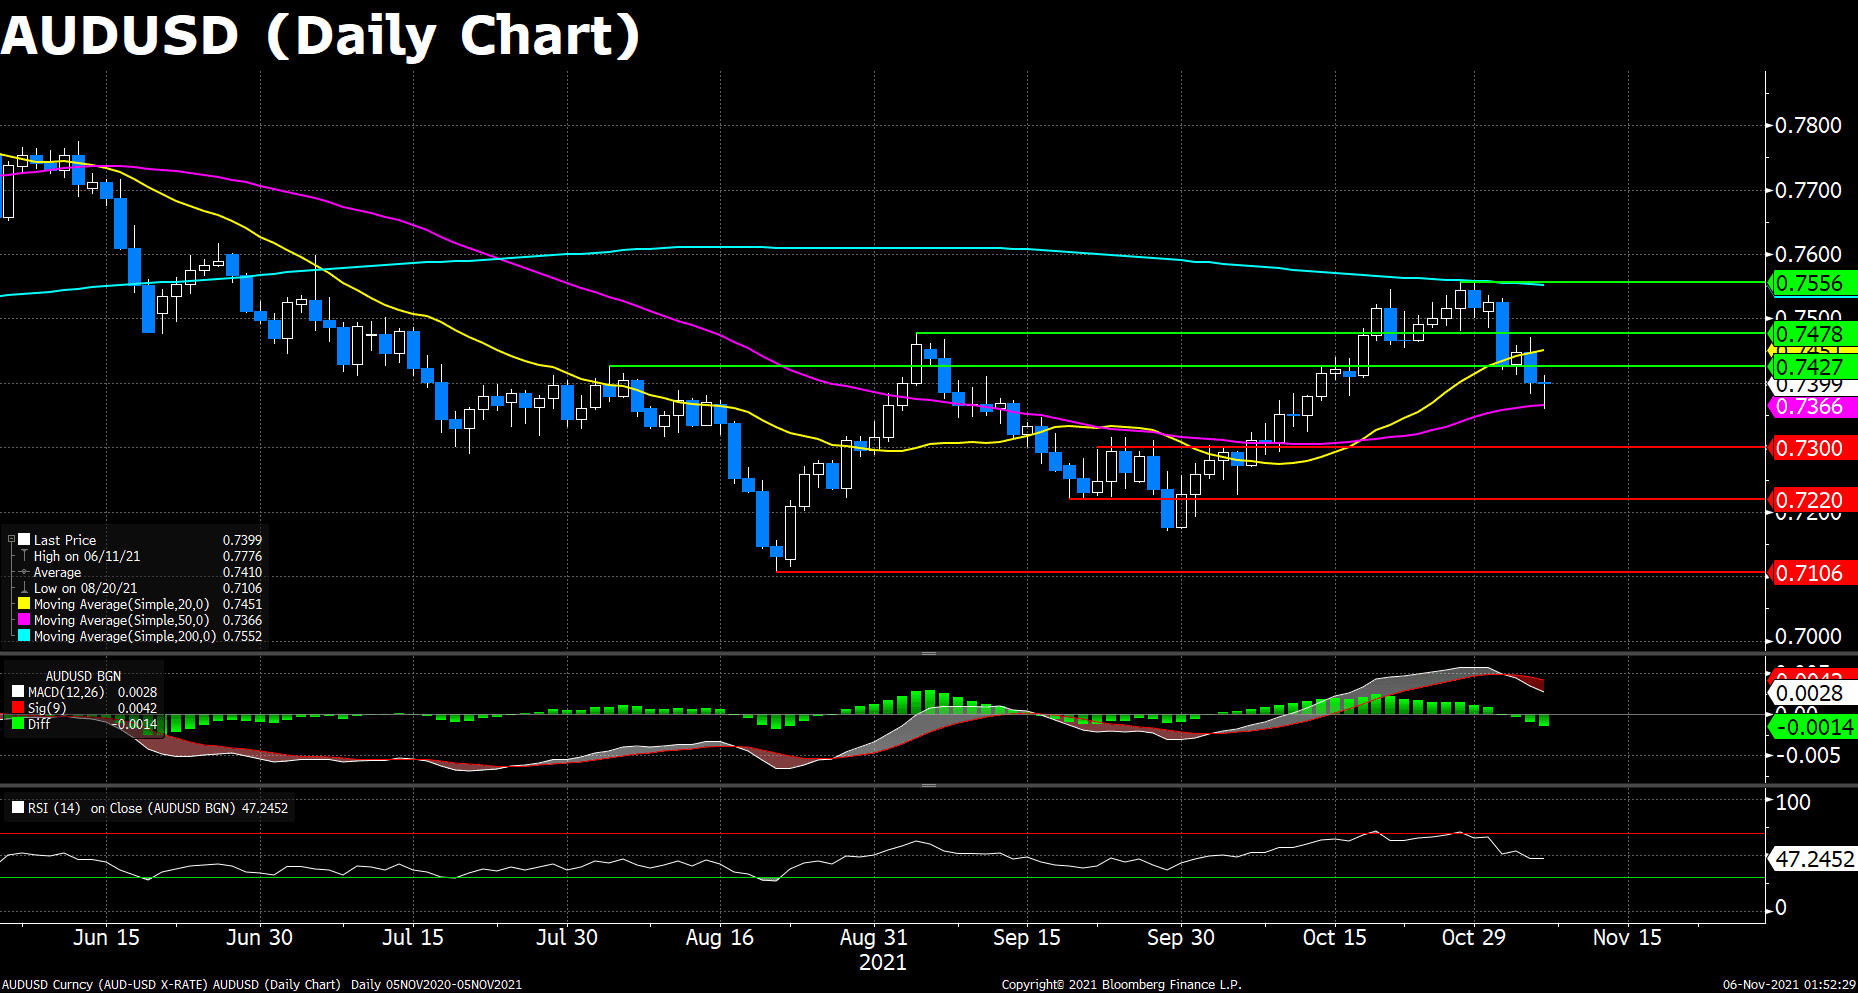
AUDUSD (Daily Chart)

AUD/USD remains on the backfoot below 0.7400, looking to extend Thursday’s sell-off amid the recent strength in the US dollar against its major rivals. The Reserve Bank of Australia’s (RBA) dovish stance on the monetary policies also weighed on Aussie, let alone the recent plummet in commodity prices to make the commodity-linked AUD less attractive. 

On the other hand, the high Treasury yield levels and fresh Chinese property sector concerns continue to keep the buoyant tone intact around the greenback. The dollar index hovers around the highest levels throughout the year, last seen 94.50. 

Looking at AUD/USD’s daily chart, the price action on Friday is below all the moving averages, along with the bearish MACD histogram and RSI indicator, showing the downward traction is in charge and will prevail for a period of time. 

Resistance: 0.7427, 0.7478, 0.7556 

Support: 0.7300, 0.7220, 0.7106


USDJPY (Daily Chart)

USD/JPY seesawed around the familiar levels during the day, consolidating around a narrow range between 113.50 to 114.05. The pair witnessed some demand in the European session, posting a daily high at 114.03. However, after the upbeat NFP data released, the pair plummeted around 50 pips and touched a daily low at around 113.50.

Looking at USDJPY’s daily chart, we can see the price actions were simply lingering around the 76.4% to 100% Fibonacci interval since it jumped into this territory at mid-October. The pair seems lack of momentum to either penetrate the 76.4% support or refresh the yearly high. The technical indicators also hovering around the average levels in this period, failing to provide insights for further directions. To the upside, the instant resistance will appear at 114.45, where the multiple October highs sits, then the yearly high 114.70; on the flip side, the Fibonacci levels await, along with the daily moving averages (DMAs), especially the 200 DMA, a breach over that line may open a long term downtrend.

Resistance: 114.45, 114.70

Support: 113.38, 112.57, 111.91


Economic Data

Currency

Data

Time (GMT + 8)

Forecast

CHF

Unemployment Rate n.s.a. (Oct)

14:45

2.6%

CHF

Unemployment Rate s.a. (Oct)

14:45

2.7%

EUR

Eurogroup Meetings

18:00

Back To Top
server

Hello there 👋

How can I help you?

Chat with our team instantly

Live Chat

Start a live conversation through...

  • Telegram
    hold On hold
  • Coming Soon...

Hello there 👋

How can I help you?

telegram

Scan the QR code with your smartphone to start a chat with us, or click here.

Don’t have the Telegram App or Desktop installed? Use Web Telegram instead.

QR code