Types of Orders in Forex trading

As a trader, you have to know and understand the terms used in trading to achieve your trading goals and earn a profit.

Among the terms that a trader must arm himself is Forex order, which means an offer you receive using your broker’s trading platform whether to open or close a transaction—should your specific instructions are satisfied.

At VT Markets, we have common types of orders available on our platform: market orders, limit orders, and stop-loss orders.

But first, let’s talk about buying and selling.

Buy and Sell

Buying and selling revolve around the potential movement of an instrument to earn profit. You buy when we see an opportunity for an instrument to raise and sell when you see an opportunity for an instrument to fall.

In Forex Trading, you trade in pairs. When you buy, you are buying one currency and selling another, and when you sell, you are selling a currency and buying another.

Here’s an example:

The image above shows 3 forex pairs: EURUSD, AUDJPY, and EURSGD.

If you want to buy or sell, you have to choose which pair to use. This example uses EURUSD, a forex pair between EUR and USD.

If you click buy, you are buying EUR and selling USD. And if you click sell, you are selling EUR and buying USD.

As discussed earlier, there are several types of orders to trade, buy, and sell in Forex.

Market Order

A market order is a type of order to buy or sell an instrument pair immediately.

When you see a current running price then decide to buy or sell at that instance, you can select Market Order and then click buy or sell based on our analysis.

But you must understand that a Market Order means you click on the running price, which then executes the order; however, you may get a different executed price.

Generally, you will get the executed price near the current price.

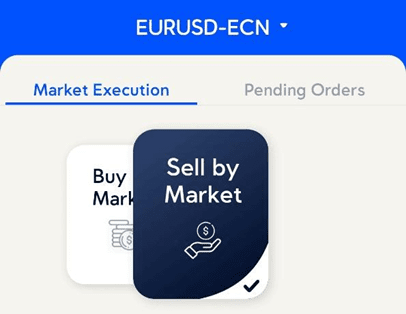
If you have downloaded our VT Markets app, you can use Market Execution to trade instantly. Just select Buy by Market or Sell by Market.

Pending Orders

Sometimes, a trader has a trading plan to Buy or Sell at a specific price. However, the current price is still nowhere near the price. So, rather than waiting for the market to reach their strategy, they usually use Pending Orders and put in that specific price.

There are 2 types of Pending Orders:

Limit Orders – A limit order is an order to buy or sell an instrument/forex pair at a specific price[2] . A buy limit order can only be executed below the current running price. Meanwhile, a sell limit order can only be executed higher than the current running price.

Here’s an example:

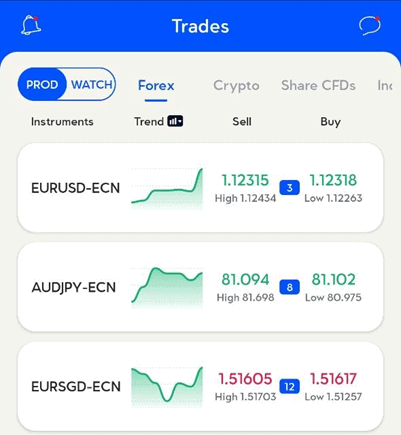
If you want to order a buy limit in EURUSD, then from the current running buy price of 1.12318, you can only order a Buy Limit lower than 1.12318.

When you want to order a sell limit in EURUSD, then from the current running sell price of 1.12315, you can only order a Sell Limit higher than 1.12315.

Stop Orders – A limit order is an order to buy or sell an instrument/forex pair at a specific price . A buy stop order can only be executed higher than the current running price. Meanwhile, a sell stop order can only be executed lower than the current running price.

Here’s an example:

If you want to order a buy stop in EURUSD, then from the current running buy price of 1.12318, you only order a Buy Stop higher than 1.12318.

When you want to order a sell stop in EURUSD, then from the current running sell price of 1.12315, you can only order a Sell Stop lower than 1.12315.

All in all, it is vital to understand these terms for a more informed trading decision. It is equally important to choose a Forex broker that can provide a platform that makes trading much easier and more profitable, whether you are a seasoned trader or a beginner.

Get in touch with us for more details or click here to create an account with VT Markets today!

Market Focus

Wall Street’s three major stock indexes closed higher on Tuesday, with the S&P 500 and the tech-heavy Nasdaq recovering early losses and rising late in the session, with Amazon up 2.2% and Apple and Microsoft both up more than 1%. Also, as the 10-year U.S. Treasury yield hit its highest level since November 2019, the S&P 500 banks index rose 1.9%. At the end of the market, the Dow Jones Industrial Average rose 1.06% to 35,462.78 points, the S&P 500 index gained 0.84% to 4,521.52 and the Nasdaq Composite Index added 1.28% to 14,194.46 points

一張含有 文字 的圖片

自動產生的描述

Of the 11 sectors of the S&P 500, 3 ended lower, with the energy sector falling the most, down 2.12%. The biggest winner was materials sector, up 1.57%, followed by the consumer discretionary sector, which rose 1.50%. The energy sector fell as investors worried that a resumption of indirect talks between the United States and Iran could revive an international nuclear deal and allow OPEC producers to boost oil exports. On the other hand, earnings were mixed on Tuesday, with Pfizer falling after the drugmaker’s full-year sales forecast for its COVID-19 vaccine and antiviral pill fell short of expectations. Amgen surged nearly 8% after the company announced up to $6 billion in buybacks and forecast earnings to double by 2030. Meta fell 2.1% after billionaire investor Peter Thiel decided to step down from the company’s board, sending the stock down for a fourth straight day after last week’s bleak forecast wiped out billions in market value.


Main Pairs Movement:

The major currency pairs continued to lack direction, staying within a consolidation range on Tuesday. The dollar finally found some support amid a surge in government bond yields, with the U.S. 10-year yield hitting 1.97%. However, the strength in yields was not enough to make up for the dollar’s decline over the past week.

Sterling and the euro edged lower as the dollar strengthened, with sterling flat against the dollar, up 0.02% in late trade, while the euro edged down 0.24% against the dollar. The main pressure on the euro came from comments from ECB member François Villeroy, who said that markets may have overreacted to President Christine Lagarde’s remarks.

USD/CAD edged higher and is hovering around 1.2700 as lower oil prices dampen demand for the Canadian dollar.

Gold soared to a fresh two-week high of $1,828.36 an ounce and settled near $1,825. Meanwhile, oil prices faced a two-day losing streak, with WTI closing at $89.75 a barrel and Brent at $91.16 a barrel.


Technical Analysis:

EURUSD (4-Hour Chart)

The EUR/USD pair declined on Tuesday, continuing to edge lower amid ECB President Christine Lagarde’s dovish comment. The pair saw heavy selling at the start of the day and touched a daily low below 1.140 mark in early European session, now ebounding slightly to eliminate some of its intraday losses. The pair was last seen trading at 1.1405, posting a 0.33% loss on a daily basis. EUR/USD stays in the negative territory amid stronger US dollar across the board, as the benchmark 10-year US Treasury bond yield rose toward 2%, helping the greenback outperform its major rivals. Meanwhile the expectations for a Fed tightening might keep weighing on EUR/USD. In Europe, ECB’s Lagarde said that inflation is expected to remain stable and there is no need for major policy tightening, pulling ECB out of the previous hawkish stance.

For technical aspect, RSI indicator 54 figures as of writing, suggesting that the upside is more favored as the RSI stays above the midline. But looking at the Bollinger Bands, the price is approaching the lower band, which indicates that the pair could remain its downside traction. In conclusion, we think market will be bearish as long as the 1.1479 resistance holds. Further declines should favor bears and extend toward the 1.1260 region.

Resistance: 1.1479, 1.160

Support: 1.1386, 1.1284, 1.1132


GBPUSD (4-Hour Chart)

The pair GBP/USD edged higher on Tuesday, attracting some dip-buying and bounce back amid risk-on market sentiment. The pair started to witness bullish momentum in early European session and rallied to a daily high above 1.3560 level, but lacked recovery strength. At the time of writing, the cable stays in positive territory with a 0.13% gain for the day, flirting with the 1.3500~1.360 area with no obvious direction. The risk-on market mood lend support to the British pounds, but the expectations that the Fed would tighten its policy at a faster pace and a rate hike in March might keep a lid on any further upside for the cable. As for now, investors awaits Thursday’s US CPI data, which could adds pressure on the Fed to tighten monetary policy and weigh on GBP/USD pair.

For technical aspect, RSI indicator 54 figures as of writing, suggesting tepid bull movement ahead. For the MACD indicator, a golden cross is forming on the histogram, showing potential upside momentum. The Bollinger Bands is also indicating bull signals as the pair is crossing above the moving average. In conclusion, we think market will be slightly bullish as the pair failed to break below the 1.3512 support. The pair needs to rise above 1.3560 in order to regain its bullish momentum and target 1.3608 resistance.

Resistance: 1.3608, 1.3739

Support: 1.3512, 1.3372


USDCAD (4-Hour Chart)

After previous day’s slide to 1.2670 area, the pair USD/CAD staged a goodish rebound towards 1.2700 level today amid modest US dollar strength. The pair was surrounded by bullish momentum most of the day and reached a daily top near 1.2720 mark during American session, rising 0.27% on a daily basis. The speculations for a faster policy tightening by the Fed bolstered the benchmark 10-year US Treasury bond yield, therefore pushing the greenback and USD/CAD pair higher. On top of that, the falling crude oil price also acted as a headwind for the the commodity-linked loonie, as WTI pulled back from seven-year highs to $89.00 amid profit-taking. But the conflict between Russia and Ukraine should limit losses for oil prices.

For technical aspect, RSI indicator 50 figures as of writing, suggesting that the pair lacks obvious direction now. As for the Bollinger Bands, the pair might crosses above the moving average as prices have a tendency to bounce within the bands’ envelope. In conclusion, we think market will be bullish as long as the 1.2667 support line holds. If the US and Iran can agree on the 2015 nuclear pact deal, this would help ease upward pressure on crude oil markets.

Resistance: 1.2778, 1.2831

Support: 1.2667, 1.2575, 1.2460


Economic Data:

Currency

Data

Time (GMT + 8)

Forecast

USD

Crude Oil Inventories

23:30

0.369M

Market Focus

Stock turned lower to close a choppy session at the start of another busy week for corporate earnings and fresh economic data, as investors continue to assess the Federal Reserve’s path forward for monetary policy. S&P 500 declined after posting its best weekly rise of the year last week, close 0.37% lower at 4483.86. Dow Jones traded sidelined, and the Nasdaq underperformed as technology shares fell anew, down 0.58% to 14015.67 at the end of the day.

一張含有 文字 的圖片

自動產生的描述

U.S. President Joe Biden said the controversial Nord Stream 2 natural gas pipeline between Russia and Germany would be stopped if President Vladimir Putin orders an invasion of Ukraine. “We will bring an end to it,” Biden said at a joint news conference at the White House on Monday with German Chancellor Olaf Scholz in a short answer to a question about whether he had received assurances from Scholz. “The notion that Nord Stream 2 is going to go forward with an invasion by the Russians — that’s not going to happen.”

Earlier, Scholz’s top diplomat said that Europe’s largest economy was willing to “pay a high economic price” that would come with supply cutoffs. Foreign Minister Annalena Baerbock is a member of the Greens and has been more explicit than Scholz in pledging to target Nord Stream 2.

A main concern for Europe, which depends on Russia for gas, is trying to secure supplies in a scenario where it could get cut off. Biden sought to address this worry and said the U.S. had been looking for alternative sources: “We think we could make up a significant portion of it that would be lost.” The comments from Biden represent the largest-yet commitment by the U.S. to ensure European allies have sufficient supplies of natural gas amid potential conflict with Russia, which provides about 40% of the bloc’s needs today.


Main Pairs Movement:

The week started in slow motion, and the dollar ended the day mixed across the board. It managed to add some ground against its European rivals, although EUR/USD held above 1.1400, while GBP/USD settled at around 1.3530. ECB President Christine Lagarde poured cold water on rate hikes speculation. Speaking before the EU Parliament she said that there is no sign that inflation will measurably exceed the bank’s 2% target in the medium term.

Commodity-linked currencies, on the other hand, managed to advance with AUD/USD trading at around 0.7120 and USD/CAD accelerating its slide at the end of the day to trade in the 1.2660 price zone.

Gold maintained its bullish stance throughout the day, ending the American session at $1,820 a troy ounce. Crude oil prices, however, retreated from their multi-year highs and WTI settled at $91.20 a barrel, Brent at $92.90. US Treasury yields were sharply up ahead of the opening, holding on to gains, but pulling back from intraday highs.


Technical Analysis:

EURUSD (4-Hour Chart)

The EUR/USD pair declined on Monday, retreating from multi-week highs above 1.1470 mark that touched last Friday. The pair was trading lower and dropped to a daily low during Asian session, now starting to see fresh selling again after trying to rebound earlier in the session. The pair was last seen trading at 1.1441, posting a 0.08% loss on a daily basis. EUR/USD stays in the negative territory amid the recovering US dollar, despite the greenback remains on the back foot most of the day and failed to build on the post-NFP recovery. A softer tone around the US Treasury bond yields also weighed on the greenback. In Europe, ECB’s Lagarde will speak before the European Parliament later in the session. The expectation for a potential ECB lift-off in September or December might keep acting as a tailwind for the Euros.

For technical aspect, RSI indicator 63 figures as of writing, suggesting that the upside is more favored as the RSI stays above the midline. But looking at the Bollinger Bands, the price dropped towards the moving average after touching the upper band, which indicates that the pair could remain its downside traction. In conclusion, we think market will be bearish as long as the 1.1479 resistance holds. But if the pair break through that level, a rally towards the 1.1550 region could be expected.

Resistance: 1.1479, 1.1599

Support: 1.1284, 1.1132


GBPUSD (4-Hour Chart)

The pair GBP/USD edged lower on Monday, trading broadly flat at the start of the week within 1.3500-1.3550 area. The pair was surrounded by bearish momentum and dropped to a daily low below 1.3500 level during European session, then rebounded back to eliminate most of the intraday’s losses. At the time of writing, the cable stays in negative territory with a 0.01% loss for the day, witnessing some fresh selling. The pair is having a difficult time making a decisive move in either direction ahead of Fed policymakers and BoE Governor Andrew Bailey’s speech this week. The upbeat US job data and renewed speculations for a larger Fed rate hike at the March policy meeting should undermine the British pound and keep a lid on the upside for the cable.

For technical aspect, RSI indicator 48 figures as of writing, suggesting that the downside appears more favored as the RSI sits below the midline. But the Bollinger Bands showed the pair is now rising from the lower band, therefore the pair should experience some upside movements. In conclusion, we think market will be slightly bullish as markets weigh on Fed/BoE tightening themes in the coming days. The cable might continue to flirt with the 1.3500-1.3600 area.

Resistance: 1.3608, 1.3687, 1.3739

Support: 1.3456, 1.3372


USDCAD (4-Hour Chart)

After last Friday’s rally to a weekly high above 1.278 level, the pair USD/CAD was surrounded by downside momentum today amid modest US dollar weakness. The pair remained under pressure most of the day and dropped to a daily low during American session, losing 0.60% on a daily basis. The bearish momentum witnessed in USD/CAD is caused by weaker US dollar, as the greenback suffered from a softer tone around the US Treasury bond yields. On top of that, the crude oil is now swinging between the $91.00-$92.00 area, remaining well supported by expectations that global supply would remain tight amid the conflict between Russia and Ukraine. The US/Iran nuclear negotiations would also be looked upon by investors.

For technical aspect, RSI indicator 44 figures as of writing, suggesting bear movement ahead. As for the Bollinger Bands, the pair crossed below moving average after moving out f the upper band, therefore the downside momentum should persist. In conclusion, we think market will be bearish as the pair is heading to test the 1.2622 support. The demand for oil might remain strong and acted as a headwind for the USD/CAD pair in the near-term, as many analysts also expect WTI to hit $100.

Resistance: 1.2791, 1.2829

Support: 1.2622, 1.2575, 1.2462


Economic Data:

Currency

Data

Time (GMT + 8)

Forecast

NZD

RBNZ Gov Orr Speaks

10:15

BRL

BCB Copom Meeting Minutes

19:00

VT Markets Feb futures rollover announcement

Dear Client,

New contracts will automatically rolled-over as follows:

Please note:
•The rollover will be automatic, and any existing open positions will remain open.
•Positions that are open on the expiration date will be adjusted via a rollover charge or credit to reflect the price difference between the expiring and new contracts.
•To avoid CFD rollovers, clients can choose to close any open CFD positions prior to the expiration date.
•Clients should ensure that take profits and stop losses are adjusted before this rollover occurs.

If you’d like more information, please don’t hesitate to contact [email protected].

Market Focus

Stocks shifted earlier losses to mostly rise Friday afternoon even as investors viewed a much stronger-than-expected jobs report as strengthing the case for the Federal Reserve to continue down its more hawkish monetary policy route. The S&P 500 went higher during intraday trading, closing up 0.52% at 4,500.61, while the Dow Jones lost steam to close at 35,089.15, slightly down 0.06%. The Nasdaq also rose by 1.58% to 14,098.01.

一張含有 文字 的圖片

自動產生的描述

Inflationary pressures in the U.S. continued to heat up at the start of the year, data are expected to show, likely putting a Federal Reserve interest-rate increase next month on autopilot. The consumer price index (CPI) probably jumped 7.3% in January from a year ago, the largest annual advance since early 1982, according to the median projection in a survey of Wall Street economists. Excluding volatile energy and food categories, the core CPI is anticipated to have risen 5.9%.

The inflation data rose in tandem with the government’s latest employment report, which showed newfound momentum in the labor market and faster wage growth that spurred bets that the Fed will be more aggressive in raising rates.

It’s a light week for Fed-speak. The relative silence from Washington probably reflects the fact that both Powell and Governor Lael Brainard await Senate confirmation — Powell for another four years at the helm, and Brainard to become vice chair.

Elsewhere, Russia’s central bank may increase rates by 100 basis points, perhaps the biggest move in another week of anticipated global tightening by monetary officials from Poland to Peru.


Main Pairs Movement:

U.S. dollar traded mixed against its Group-of-10 peers in early Sydney trade Monday.

EUR/USD rises 0.1% to 1.1462; on Friday, spot posted its best week since March 2020, climbing 2.7%. AUD/USD adds 0.1% to 0.7081 after closing the day 1% lower in New York, trimming its weekly advance to 1.2%. NZD/USD quoted 0.4% lower to 0.6610 amid thin price action given that New Zealand markets are closed for a public holiday. USD/JPY steady at 115.29; closed up 0.3% on Friday for a second day of gains.

As to commodities, gold advanced 0.17% amid choppy trades on Friday, and sliver’s price action acted in line with the yellow metal, though with greater volatility, up 0.46% intraday. Crude oil prices continued to post fresh highs as the Ukraine-Russia conflict upgraded day-by-day. WTI surged 1.98% to $91.95, and Brent jumped 1.92% to $92.74.

Cryptocurrencies got a huge lift on Friday. Bitcoin skyrocketed 11.42% to $41574.25, while Ethereum mounted 11.11% to $2994.99.


Technical Analysis:

EURUSD (4- Hour Chart)

The EUR/USD pair edged lower on Friday, taking a break after previous day’s rally amid ECB President Christine Lagarde’s hawkish comments. The pair stayed relatively quiet during Asian session, flirting with 1.144~1.148 area. The pair was last seen trading at 1.1427, posting a 0.06% loss on a daily basis. EUR/USD stays in the negative territory amid the recovering US dollar, as the US Nonfarm Payrolls (NFP) beat estimates and rose by 467K in January, pushing the DXY index above the 95.50 level. The much stronger than expected job data provided support to the greenback and weighed on EUR/USD pair, which surrendered most of its daily gains. In Europe, the hawkish message from the ECB event yesterday might keep acting as a tailwind for the Euros, as investors now expect a potential ECB lift-off in September or December.

For technical aspect, RSI indicator 70 figures as of writing, suggesting that the pair is in overbought zone now, a rend reversal could be expected. Looking at the Bollinger Bands, the price dropped towards the moving average after touching the upper band, which indicates that the pair could remain its downside traction. In conclusion, we think market will be bearish as long as long as the 1.1479 resistance holds. The pair might need to make a technical correction before climbing higher.

Resistance: 1.1479, 1.1599

Support: 1.1284, 1.1196, 1.1132


GBPUSD (4- Hour Chart)

The pair GBP/USD declined on Friday, continuing to suffer from its heavy intraday losses following the release of the US Nonfarm Payrolls. The pair was surrounded by bearish momentum most of the day, dropping to a daily low below 1.3520 mark and snapped five days of the winning streak. At the time of writing, the cable stays in negative territory with a 0.51% loss for the day, witnessing some profit-taking movement. The Bank of England’s decision to raise the benchmark interest rate by 25bps to 0.50% had pushed the cable to its strongest level in two weeks at 1.362 yesterday. But BOE Governor Andrew Bailey said that rate hikes was mainly due to concerns about inflation, instead of the better UK economy.

For technical aspect, RSI indicator 47 figures as of writing, suggesting that the downside appears more favored as the RSI sits below the midline. Meanwhile the Bollinger Bands showed the pair had crossed below the moving average, therefore the downside momentum should persist. The MACD indicator also have a negative histogram. In conclusion, we think market will be bearish as the pair failed to break the 1.3608 resistance. The risk-off market mood and rebounding US dollar might continue to weigh on the pair in the near-term.

Resistance: 1.3608, 1.3739

Support: 1.3456, 1.3372


USDCAD (4- Hour Chart)

The pair USD/CAD remained its upside momentum on Friday, attracting some buying for the second successive day despite surging oil prices. The pair was trading higher in Asian session and soared above the 1.277 level after the release of US jod data, now looking steadily around weekly tops. The bullish momentum witnessed in USD/CAD is caused by renewed US dollar strength, as the pair is currently rising 0.67% on a daily basis. An uptick in US Treasury bond yields, along with the cautious market sentiment both extended some support to the USD/CAD pair. On top of that, the crude oil has reached seven-year highs at $93.00/barrel amid the winter storm that recently hit the US. The tensions between Ukraine and Russia also sent the black gold higher.

For technical aspect, RSI indicator 63 figures as of writing, suggesting bull movement ahead. But for the Bollinger Bands, the pair moved immediately back inside the band after moving out of the bands, therefore an downside movement could be expected. In conclusion, we think market will be slightly bearish as long as the pair struggled to break above the 1.2790 mark at the moment, appearing to run out of bullish momentum due to skyrocketing oil prices.

Resistance: 1.2790, 1.2941

Support: 1.2669, 1.2575, 1.2461


Economic Data:

Currency

Data

Time (GMT + 8)

Forecast

AUD

Retail Sales (MoM) (Jan)

08:30

Market Focus

US equities fell hard on Thursday as the markets renewed their previous optimism, driven by a slew of strong earnings, took a turn down after Facebook Meta Platforms’ disappointing earning report on Wednesday. The Dow Jones Industrail Average dropped 1.4% while the S&P 500 slided 2.4%, the first day in nearly a year. In the meantime, the tech heavy weighted Nasdaq fell 3.7% for its worst day since late 2020.

一張含有 文字 的圖片

自動產生的描述

Bloomberg

On “Super Thursday,” European Central Bank decided to keep interest rates unchanged even though the most recent inflation figure has git a record 5.1%. The latest European Central Bank’s forecasts point to the inflation is 3.2% this year, which is above the target rate. The central bank believes that the inflation will be cool down followed by a promising hawkish pivot.

Meanwhile in the UK, the bank of England raised its interest rates for the second time in a quarter. The BOE decided to hike its rate to 0.5% from previous 0.25%. Having UK consumer prices rose to 5.4% in December, the highest in nearly 30 years, the BOE expected that the inflation rate will possibly peak at around 7.25%; the markets are now betting the BOE will hike its rate to 1.5% by mid 2023 in order to combat the inflation.

Main Pairs Movement:

GBPUSD’s bulls took a breather on Thursday, hitting as high as 1.36277 and up 0.04% at the end of the day. The British Pound was boosted as the Bank of England hiked the policy rates back-to-back to 0.5% from 0.25%. At the same time, the labor market in the UK remained robust, strengthening the Pound.

EURUSD was up 1.18% on Thursday, approaching January monthly high. The euro dollar outperformed following ECB President Lagarde’s hawkish comments, overturning from previous dovish stance.

Gold’s bulls were little affected by the Bank of England’s aggressive stance and the ECB’s hawkish comments on Thursday. Gold was once hitting as low as $1,788 and bouncing back above $1,800 at the end of the day.

Technical Analysis:

EURUSD (4- Hour Chart)

The EUR/USD pair declined on Thursday, continuing to retreat from a two-week high that touched earlier this week after four consecutive daily advances. The pair remained under pressure most of the day, dropping to a daily low below 1.1280 level during European session. The pair was last seen trading at 1.1278, posting a 0.21% loss on a daily basis. EUR/USD stays in the negative territory amid stronger US dollar across the board, as the DXY index reversed part of its recent pullback and climbed above 96.00. Despite the falling US bond yields, the greenback still managed to regain some upside momentum on Thursday. In Europe, market focus now shifts to ECB’s interest rate decision, which is expected to be unchanged but ECB President Christine Lagarde’s comments on the inflation outlook will be also watched closely.

For technical aspect, RSI indicator 55 figures as of writing, suggesting bull movement ahead. But looking at the Bollinger Bands, the price dropped towards the moving average after touching the upper band, which indicates that the pair could remain its downside traction. In conclusion, we think market will be bearish as long as the 1.1311 resistance holds. On top of that, the pair could face renewed selling pressure if the ECB continues to push pack against rate hike bets.

Resistance:  1.1311, 1.1424, 1.1479

Support: 1.1196, 1.1132

GBPUSD (4- Hour Chart)

The pair GBP/USD advanced on Thursday, gaining bullish momentum to climb above the 1.3600 mark after the key BoE event. The pair failed to keep its traction after yesterday’s rally to 1.3590 area, once touching a daily low during European session. But the Bank of England’s monetary policy decision lend strong support to GBP/USD. At the time of writing, the cable stays in positive territory with a 0.26% gain for the day, recovering most of its intraday’s losses. The Bank of England raised the benchmark interest rate by 25bps to 0.50%, which was in line with market expectations and marked the first back-to-back interest rate rises since 2004. Moreover, traders await for BOE Governor Andrew Bailey’s speech for fresh hints on future rate hikes.

For technical aspect, RSI indicator 70 figures as of writing, suggesting that the pair is in overbought zone now, a trend reversal could be possible. As for the Bollinger Bands, the pair rebounded and failed to cross below the moving average, therefore the upside momentum should persist. In conclusion, we think market will be bullish amid the rate hike by BoE. If the BOE is hawkish about the inflationary outlook of the economy, this might push the cable to break through the 1.3633 resistance and set the stage for a further near-term upside move.

Resistance: 1.3633, 1.3680, 1.3739

Support: 1.3372, 1.3185

USDCAD (4- Hour Chart)

After three successive days of the losing streak to a one-week low below 1.266 level, the pair USD/CAD regained upside momentum on Thursday. The pair was trading higher in Asian session and touched a two-day high above 1.2710 level, now retreating back slightly to surrender some daily gains. The bullish momentum witnessed in USD/CAD is mainly due to US dollar strength, as the pair is currently rising 0.14% on a daily basis. The dismal US ADP report released yesterday provide some support for the greenback to make a solid comeback. On top of that, the retreating crude oil prices has also weighed on the commodity-linked loonie and acted as a tailwind for the pair, as WTI oil declined 0.48% for the day.

For technical aspect, RSI indicator 47 figures as of writing, suggesting that the downside appears more favored as the RSI sits below the midline. For the the Bollinger Bands, the pair is falling towards the lower band, therefore an downside movement could be expected. In conclusion, we think market will be bearish as long as the 1.2694 resistance line holds. The USD/CAD pair seems lacking bullish momentum and struggled to find acceptance above the 1.2700 mark at the moment.

Resistance: 1.2694, 1.2782, 1.2829

Support: 1.2634, 1.2575, 1.2462

Economic Data:

Currency

Data

Time (GMT + 8)

Forecast

GBP

Construction PMI (Jan)

17:30

54.3

USD

Nonfarm Payrolls (Jan)

21:30

150K

USD

Unemployment Rate (Jan)

21:30

3.9%

CAD

Employment Change (Jan)

21:30

-117.5K

CAD

Ivey PMI (Jan)

23:00

VT Markets The Adjustment Of Weekly Dividend Notification

Dear Client,

Warmly reminds you that the component stocks in the stock index spot generate dividends. When dividends are distributed, VT Markets will make dividends and deductions for the clients who hold the trading products after the close of the day before the ex-dividend date.

Indices dividends will not be paid/charged as an inclusion along with the swap component. It will be executed separately through a balance statement directly to your trading account, the comment for which will be in the following format “Div & Product Name & Net Volume ”.

Please note the specific adjustments as follows:

Note: The above data is for reference only, the actual execution data may be changed, please refer to the MT4/MT5 software for details.

If you’d like more information, please don’t hesitate to contact [email protected].

VT Markets Notification of Server Upgrade

Dear Client,

As part of our commitment to provide the best reliability and service to our client, the trading hours of certain products will be adjusted due to the maintenance.

Please find the table below for further infornation:.

Kindly be reminded that the following things might be affected during this maintenance period:

1. There might be a gap between the original price and the price after maintenance. Pending orders, Stop Loss, and Take Profit settings within the gap will be filled at the market price after maintenance ends.

No action is required by our client. Your service will be back online after the maintenance is completed.:

Thank you for your patience and understanding with regard to this important initiative.

If you’d like more information, please don’t hesitate to contact [email protected].

Market Focus

一張含有 文字 的圖片

自動產生的描述

US equities rose for four consecutive days despite that private payroll fell by 301,000 for January as Omicron slammed labor market. The Dow Jones Industrial Average climbed 0.6% while the S&P 500 rose 0.9%. In meantime, the Nasdaq climbed 0.5%, led by Alphabet after its strong earning report. Notably, even though the Nasdaq closed in green, it plunged more than 1% in the last minute; the main culprits were Meta Platforms Inc and Spotify Technology SA, which both sank nearly 20% after the forecasts fell short of estimates. Further market movements eye on Thursday and Friday’s economic data.

While the markets closely monitored the possibility hike of interest rates in several countries, a Russian invasion of Ukraine can potentially draw attention as it can possibly send shockwaves through the financial markets. Tensions between two countries have not yet had much impact on the stock markets, however they have impacted some commodities already, such as crude oils. Even though some believes that the invasion might not happen as the US and the UK have promised swift retaliation in the form of economic sanctions, there are still high stakes.


Main Pairs Movement:

The precious metal, gold, advanced as the US economic data showed US’s shedding jobs. Gold received helps as concerns eased over the outlook for a strong hawkish tone on interest rates by the US Fed. Moreover, none of the Fed officials are going to speak this week, gold’s bear gets a temporary relief. Gold was up 0.32% at the end of the day, hovering nearly $1,800.

AUD/USD was up 0.1% as the Australia’s yield curve flattened after RBA speech. From the technical perspective, the currency pair was capped by a critical daily resistance block, which was guarding the double tops neckline near 0.7165.

GBP/USD closed with a positive action as the markets eyed on its interest rates decision. Its rival currency, the US dollar, weakened on Wednesday after the ADP report, showing a surprising decline in January. GBP/USD was up 0.41% at the end of the day.


Technical Analysis:

EURUSD (Daily Chart)

The EUR/USD pair rose above 1.1300 with the initial reaction to the EU inflation data, which showed that the EU CPI edged higher to 5.1% in January from 5% in December. This print surpassed the market expectation of 4.4% by a wide margin and helped Euro gather strength. However, as the Wall Street opening turned out mixed, with NASDAQ opened high but slumped heavily later on, the pair pared some of its intraday gains, and it trades around 1.1310 at the moment.

For technical aspect, the RSI for Euro has finally come back to 50, first time in two weeks, and the price actions has breached the 50 DMA, only one step ahead of the 20 DMA, indicating the improvement of the market sentiments. To the upside, if the pair could close above its 20 and 50 DMAs, then it is expected to knock on its next resistance 1.1400. On the contrary, if the pair fails to cling on the 1.1200 threshold, then a sharp decline to its yearly low is anticipated.

Resistance: 1.1400, 1.1620

Support: 1.12000, 1.1000, 1.0780


GBPUSD (Daily Chart)

Cable currently trades at 1.3580, around 0.40% higher on the day as it tracks down the start of the New York sessions highs of 1.3587 again during midday trade. Sterling is climbing on Wednesday for the fourth session in a row, reaching a 5-day high against its U.S peer. Traders bet the Bank of England (BoE) will raise rates on Thursday, along with a disappointment in US jobs data, softer greenbacks, and rebounding US stocks, supporting Cable to stretch further north.

On the technical front, the RSI for Cable reads 56.09 as of writing, indicating the bulls have outplayed the bears on the spot, depicted as the pair penetrated the 1.3500 psychological resistance/support and is approaching the critical resistance at 1.3600. The pair now trades above its 20 and 50 DMA, but still far away from the pivot point at around 200 DMA to fully reverse to a bullish trend. To the north, Cable is going to face the heavy 1.3600 resistance, followed by the long-tern downtrend, and then the 200 DMA currently at 1.3717; in cases to the south, the pair is underpinned by the year-to-date lows around 1.3400, followed by the December lows around 1.3200.

Resistance: 1.3600, 1.3715, 1.3830

Support: 1.3400, 1.3200


XAUUSD (Daily Chart)

Gold climbs in the North American session as US T-bond yields fall amid risk-on market mood, undermining the greenback. As of writing, XAU/USD is trading at $1,808 a troy ounce, up 0.40% during today’s trades. The market sentiment is mixed, as European bourses remain in the green, while US equity Nas100 indices fluctuate between gains and losses amid the dismal ADP Jobs report. Meanwhile, the Dollar Index extends its losses throughout the week to three straight days, down 0.34%, sitting at 95.94.

As to technical, Gold’s price is again capped by the $1,810 resistance and pulled back, lingering around the $1,800 to $1,810 area. If XAU/USD fails to break the $1,810 area, the upside would remain limited and a break higher could clear the way for a rally initially to the 20 DMA at $1,816.6; above the next key resistance lies in the $1,830 area. On the flip side, a slide back under $1800 would increase the bearish pressure. A daily close under $1,790 is needed to suggest more losses ahead. Key support levels are eyeing on $1,765.

Resistance: 1816.6, 1830, 1860

Support: 1800, 1765, 1720


Economic Data:

Currency

Data

Time (GMT + 8)

Forecast

GBP

Composite PMI (Jan)

17:30

53.4

GBP

Services PMI (Jan)

17:30

53.3

GBBP

BoE Inflation Report

20:00

GBP

BoE Interest Rate Decision (Feb)

20:00

0.5%

GBP

BoE MPC Meeting Minutes

20:00

EUR

Deposit Facility Rate (Feb)

20:45

-0.5%

EUR

ECB Marginal Lending Facility

20:45

EUR

ECB Monetary Policy Statement

20:45

EUR

ECB Interest Rate Decision (Feb)

20:45

0%

USD

Initial Jobless Claims

21:30

245K

EUR

ECB Press Conference

21:30

GBP

BoE Gov Bailey Speaks

22:15

USD

ISM Non-Manufacturing PMI (Jan)

23:00

59.5

What Are Stop Loss and Take Profit Orders in Hong Kong Trading?

Forex Stop Loss and Take Profit in Hong Kong Trading

When trading, you might not always be available to monitor your positions actively. Whether you’re occupied with other tasks or simply away, VT Markets offers tools to help you manage your trades seamlessly. With features like Stop Loss and Take Profit orders, you can set predetermined levels to control losses or lock in profits.


These tools automatically close your positions when your desired profit target or loss limit is reached, ensuring your trades are managed efficiently, even in your absence. On the VT Markets platform, these are commonly referred to as SL (Stop Loss) and TP (Take Profit).


A Stop Loss (SL) order is designed to automatically close a position when it reaches a specific price, helping traders limit their losses. It’s strategically placed in a position where the market is moving against you. For instance, if you’re buying, the SL is set below your entry price; if you’re selling, the SL is placed above the entry price. The goal of a Stop Loss is to protect your capital by capping potential losses.


On the other hand, a Take Profit (TP) order is used to lock in gains by automatically closing a position once it hits your desired profit target. It’s placed in a position that aligns with the anticipated market movement in your favor. For example, when buying, TP is set above the entry price, and when selling, it’s set below the entry price. The purpose of a Take Profit is to ensure you achieve your trading profit goals without needing constant monitoring.


How to Use Take Profit

You can set a Take Profit (TP) order either when entering a trade or modify it while the trade is active. When creating a TP order, ensure that it is placed in a profit position either above or below the entry price, depending on whether you’re buying or selling. If the trade is already running and you haven’t set a TP yet, you can easily add or adjust it. Simply determine the desired TP level relative to the current market price—above for a buy position or below for a sell position.


How to Use Stop Loss

A Stop Loss (SL) order can also be set at the start of a trade or adjusted once the position is active. To set up an SL, ensure it is positioned to limit losses—below the entry price for a buy position or above the entry price for a sell position. If the trade is running and you haven’t added an SL, you can create or modify one to safeguard your position from further loss.

Common Ways to Use Stop Loss:

  1. Set a Standard Stop Loss to Limit Losses:
    This is the most common use of a Stop Loss. When entering a trade on the VT Markets trading platform, input the Stop Loss level in the designated section. If the market moves against you while you’re away, your position will automatically close at the predefined loss limit.

  2. Use a Stop Loss to Lock in Profits:
    You can also use Stop Loss to protect your profits by modifying it as the market moves in your favor. For example, if your trade has reached a profitable level, adjust the Stop Loss to the entry price or a better level. This ensures that even if the market reverses, your position will close at a profit or, at the very least, at breakeven (barring any price gaps). This strategy helps maintain gains while managing risks effectively.


FAQs: Forex Stop Loss and Take Profit in Hong Kong Trading

  1. Why are Stop Loss and Take Profit orders important?
    These tools are your safety net. Stop Loss protects your capital by limiting potential losses, while Take Profit ensures your hard-earned gains are secured without you having to watch the market 24/7.

  2. Can beginners use Stop Loss and Take Profit effectively?
    Definitely! These tools are perfect for beginners as they help remove emotion from trading. Once you set them up, they work automatically, so you can focus on learning the market instead of stressing over every move.

  3. How should I decide where to set my Stop Loss?
    A good rule of thumb is to place it where your trade no longer makes sense according to your plan. This might be below a support level, above a resistance level, or at a percentage of your account balance you’re comfortable risking.

  4. Can I change my Stop Loss and Take Profit after entering a trade?
    Absolutely. You can modify them anytime during the trade. VT Markets makes this easy with its user-friendly platform, so you can adapt quickly as the market evolves.

  5. What happens if the market skips over my Stop Loss?
    In volatile markets, prices can sometimes jump past your Stop Loss level. This might mean a slightly larger loss, but choosing a broker like VT Markets, known for its reliable execution, can help reduce such risks.

  6. Do I have to use Stop Loss and Take Profit for every trade?
    While they’re not mandatory, they’re highly recommended. These tools help protect your account and make trading less stressful, especially when you can’t constantly monitor the markets.


Conclusion: Trade Smarter with Stop Loss and Take Profit

Stop Loss and Take Profit orders are more than just features—they’re essential tools for any trader looking to succeed in the fast-paced world of forex trading. They allow you to manage risk, lock in profits, and stay disciplined, no matter how the market moves.

For traders in Hong Kong, VT Markets provides an advanced platform that makes setting and managing these orders simple and seamless. Whether you’re new to trading or a seasoned pro, these tools ensure you’re always in control of your trades. Start using Stop Loss and Take Profit today, and experience a smarter, stress-free way to trade!

Back To Top
server

Hello there 👋

How can I help you?

Chat with our team instantly

Live Chat

Start a live conversation through...

  • Telegram
    hold On hold
  • Coming Soon...

Hello there 👋

How can I help you?

telegram

Scan the QR code with your smartphone to start a chat with us, or click here.

Don’t have the Telegram App or Desktop installed? Use Web Telegram instead.

QR code