Market Focus
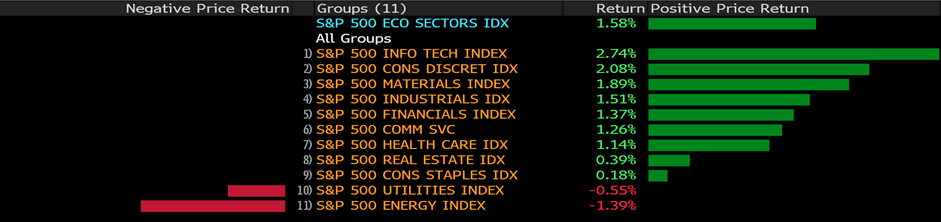
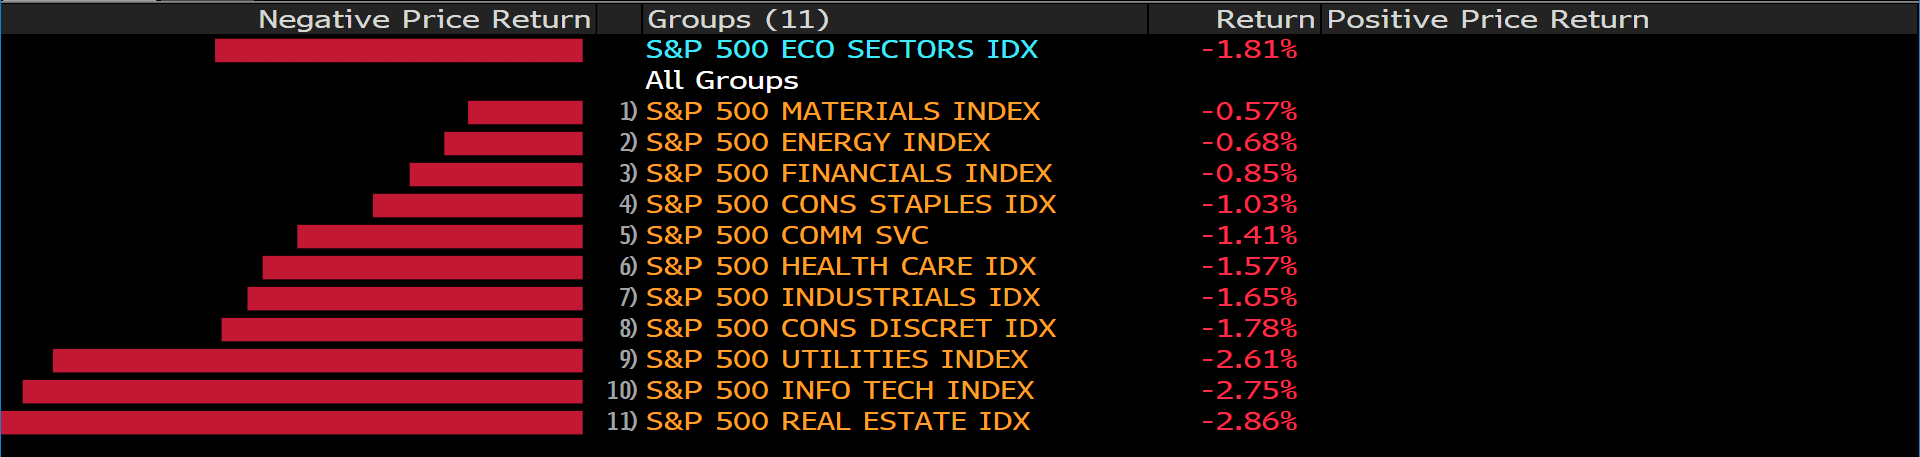
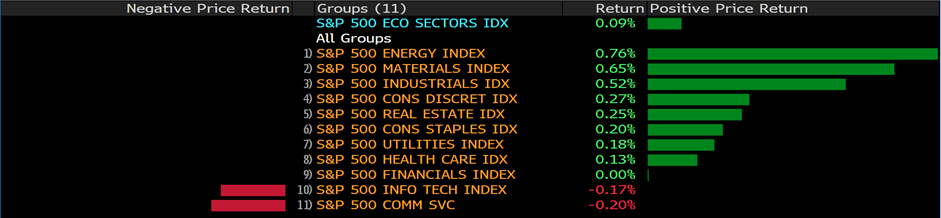
US equities pared most of the earlier losses Wednesday afternoon after the Federal Reserve’s latest meeting minutes provided more clarity on the central bank’s thinking about addressing inflationary pressures. The S&P 500 turned slightly positive and recovered losses after dropping as much as 0.9% earlier. Dow Jones recbounded near 300 points from intraday low, closing merely 0.16% lower, while tech-heavy Nasdaq ended the day 0.11% lower, regained near 200 points from daily lows.
Federal Reserve officials concluded in January that they would start raising interest rates soon and were on alert for persistent inflation that would justify a faster pace of tightening. Minutes of the Jan. 25-26 Federal Open Market Committee meeting, released Wednesday, said most policy makers “noted that, if inflation does not move down as they expect, it would be appropriate for the Committee to remove policy accommodation at a faster pace than they currently anticipate.”
But the minutes preceded data since then showing a roaring job market and a further jump in inflation that’s spurred more hawkish bets in markets. Investors see at least 150 basis points of tightening in 2022, up from 75 basis points just a few weeks ago, as the evidence continues to show a bubbling economy that’s experiencing the fastest price growth in 40 years.
U.S. consumer prices rose to a four-decade high of 7.5% in January. In the labor market, employers added almost half a million new jobs last month despite record Covid-19 cases, and wages surged. Fed officials will have the February data in hand for both reports before it meets next month.
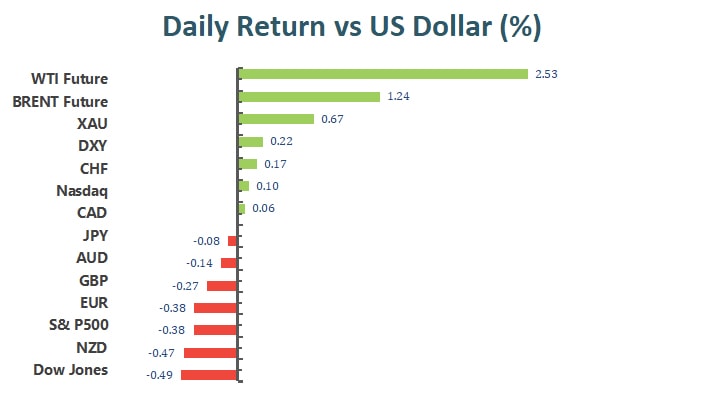
Main Pairs Movement:
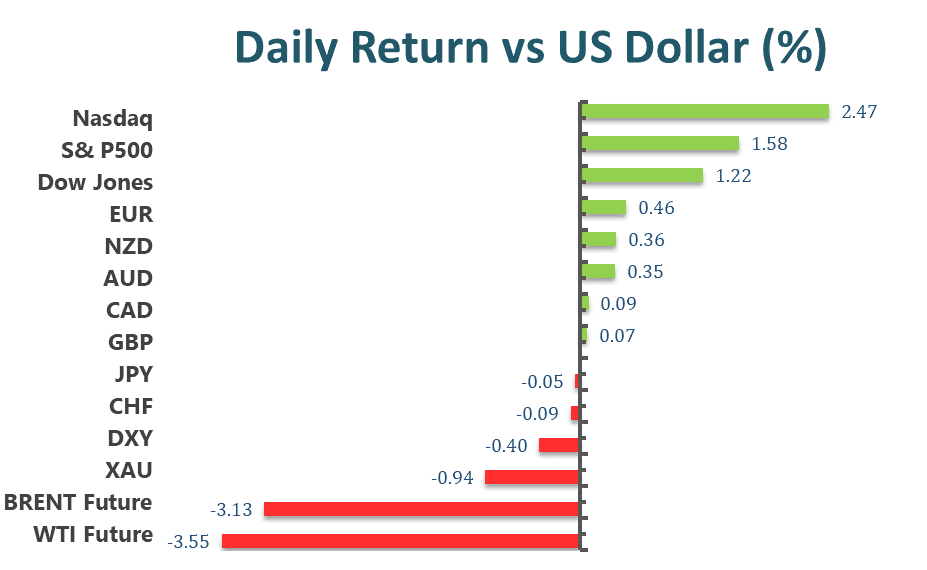
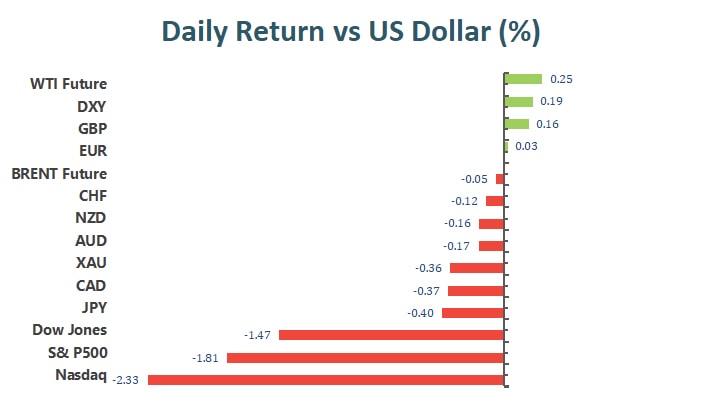
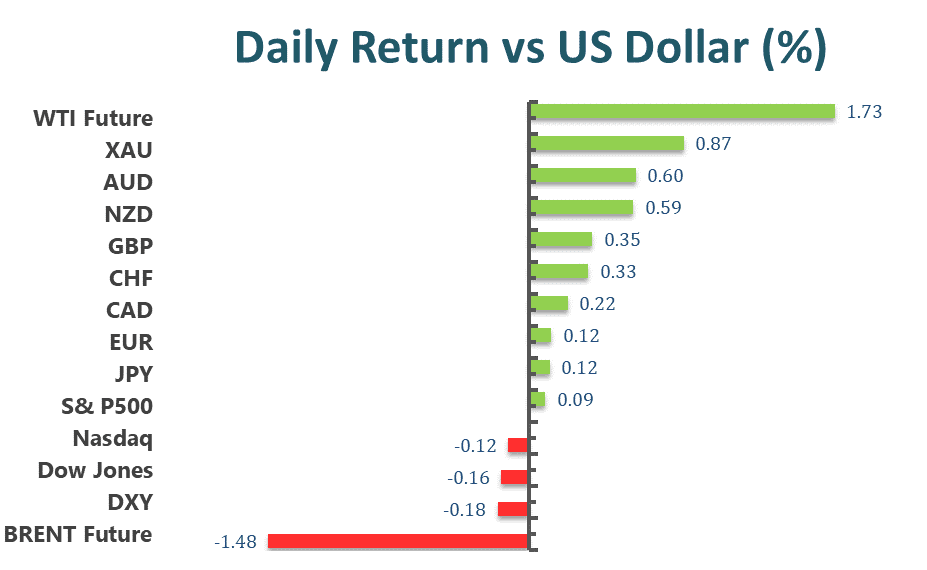
The dollar Index edged further south on Wednesday, despite the release of upbeat US data and uncertainty amid Russian – Ukrainian border tensions. Government bond yields remained up the upper end of their weekly range, with the benchmark 10-year Treasury yield hovering above 2.00%. Also, the Fed released the FOMC meeting Minutes, which indicated that policymakers are willing to hike rates but did not mention a 50 bps move in March. US Retail Sales were up 3.8% in January, much better than anticipated, while Industrial Production in the same month surged by 1.4% vs the 0.4% expected.
EUR/USD trades around 1.1390, while GBP/USD flirts with 1.3600 amid the broad dollar’s weakness. The AUD/USD pair is also up, trading around 0.7200, while USD/CAD lags, hovering around 1.2670, capped by the crude oil prices weakness. Safe-haven currencies managed to advance against the greenback, with USD/CHF down to 0.9210.
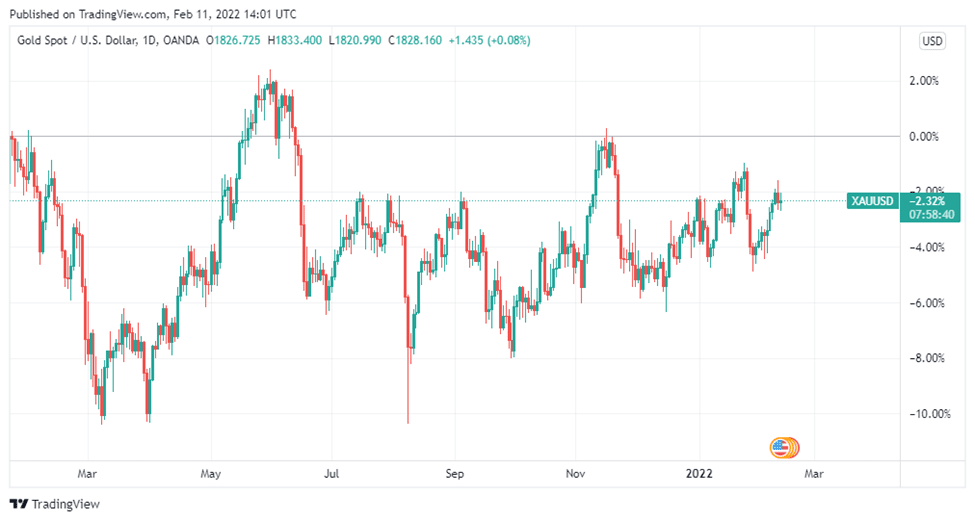
Commodities posted mixed. Gold price regained $1,870 a troy ounce during Wednesday’s trades, recovering most of its Tuesday’s losses. On the other hand, the black gold retreated sharply from its daily high, with WTI trades around $90.60 a barrel, and Brent around $92.70.
EURUSD (4-Hour Chart)
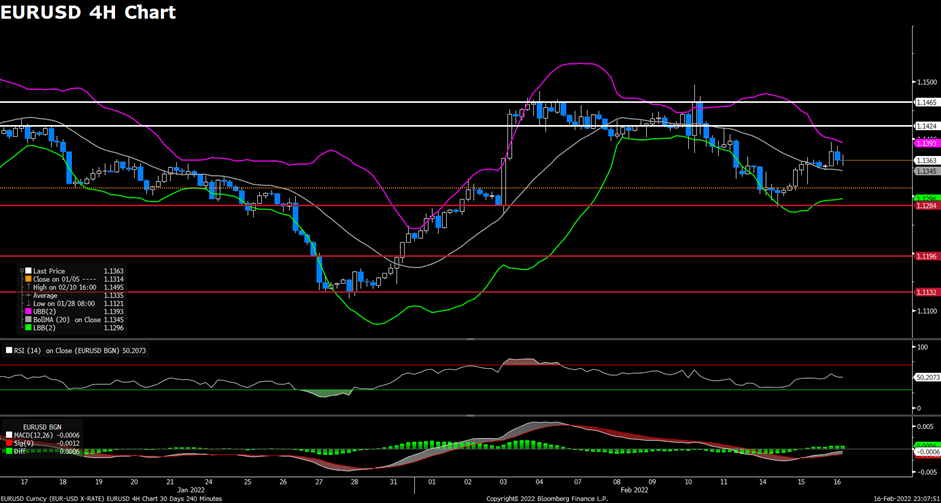
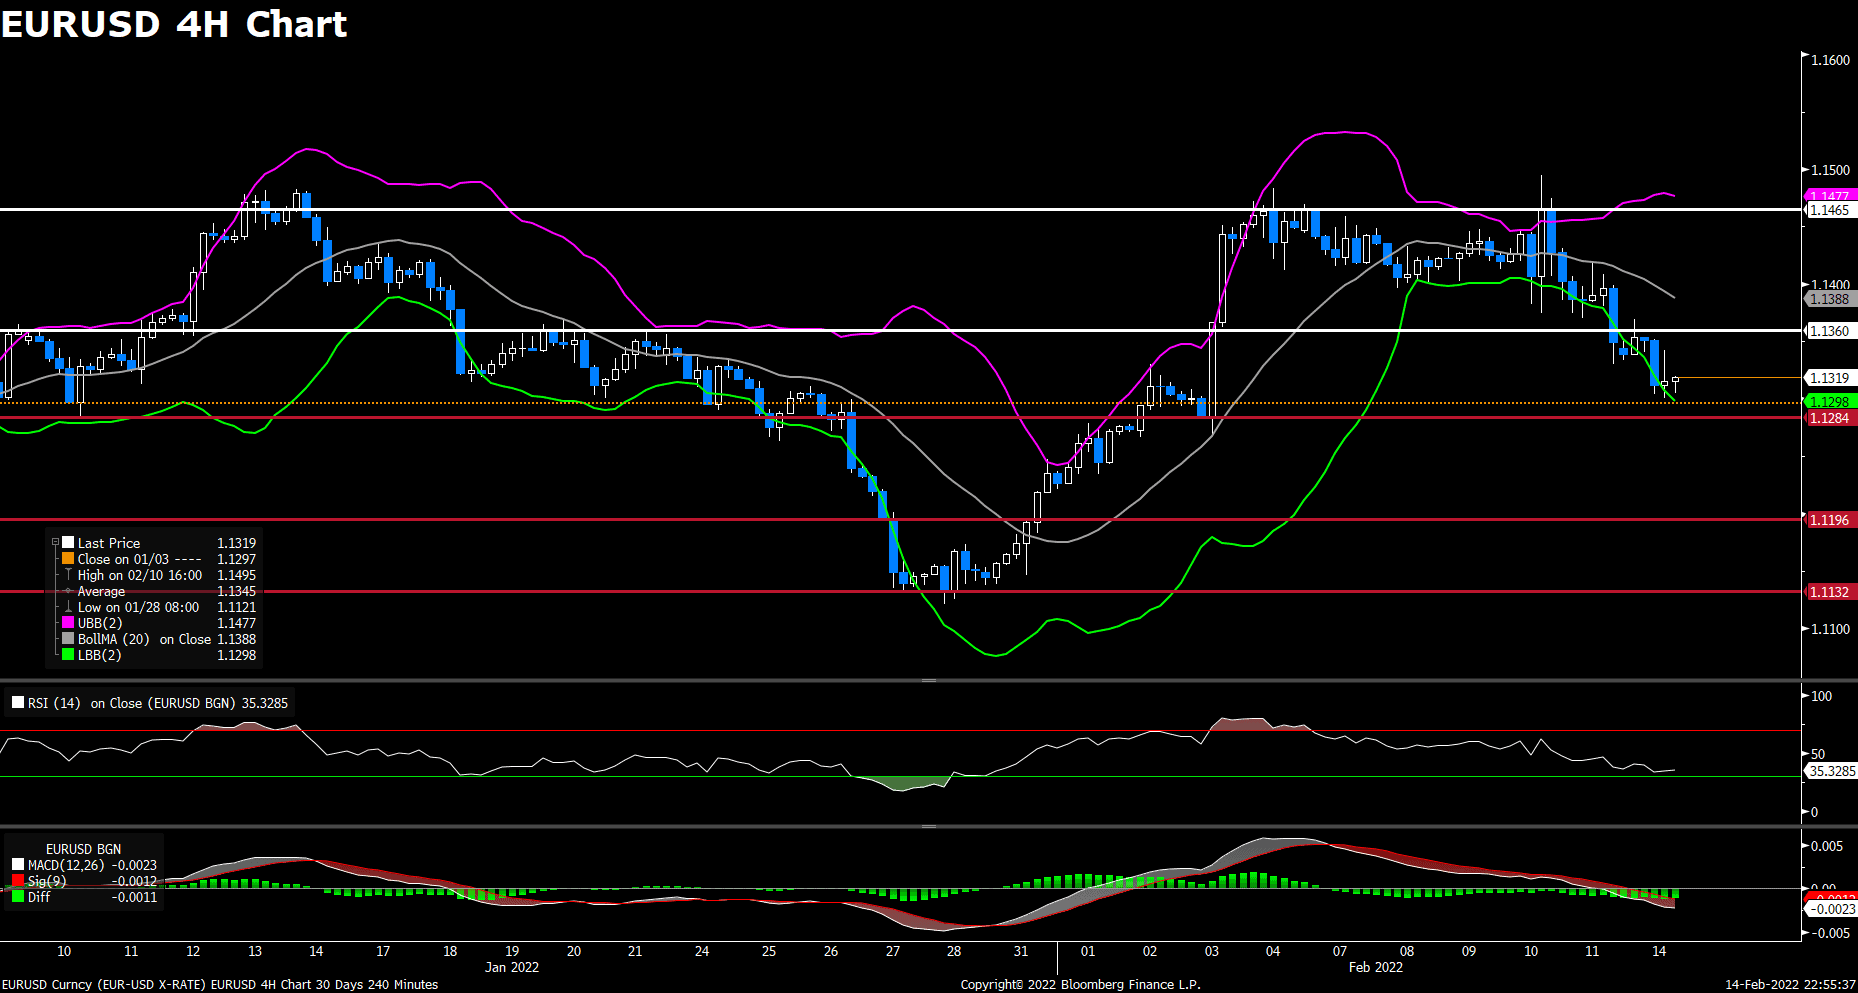
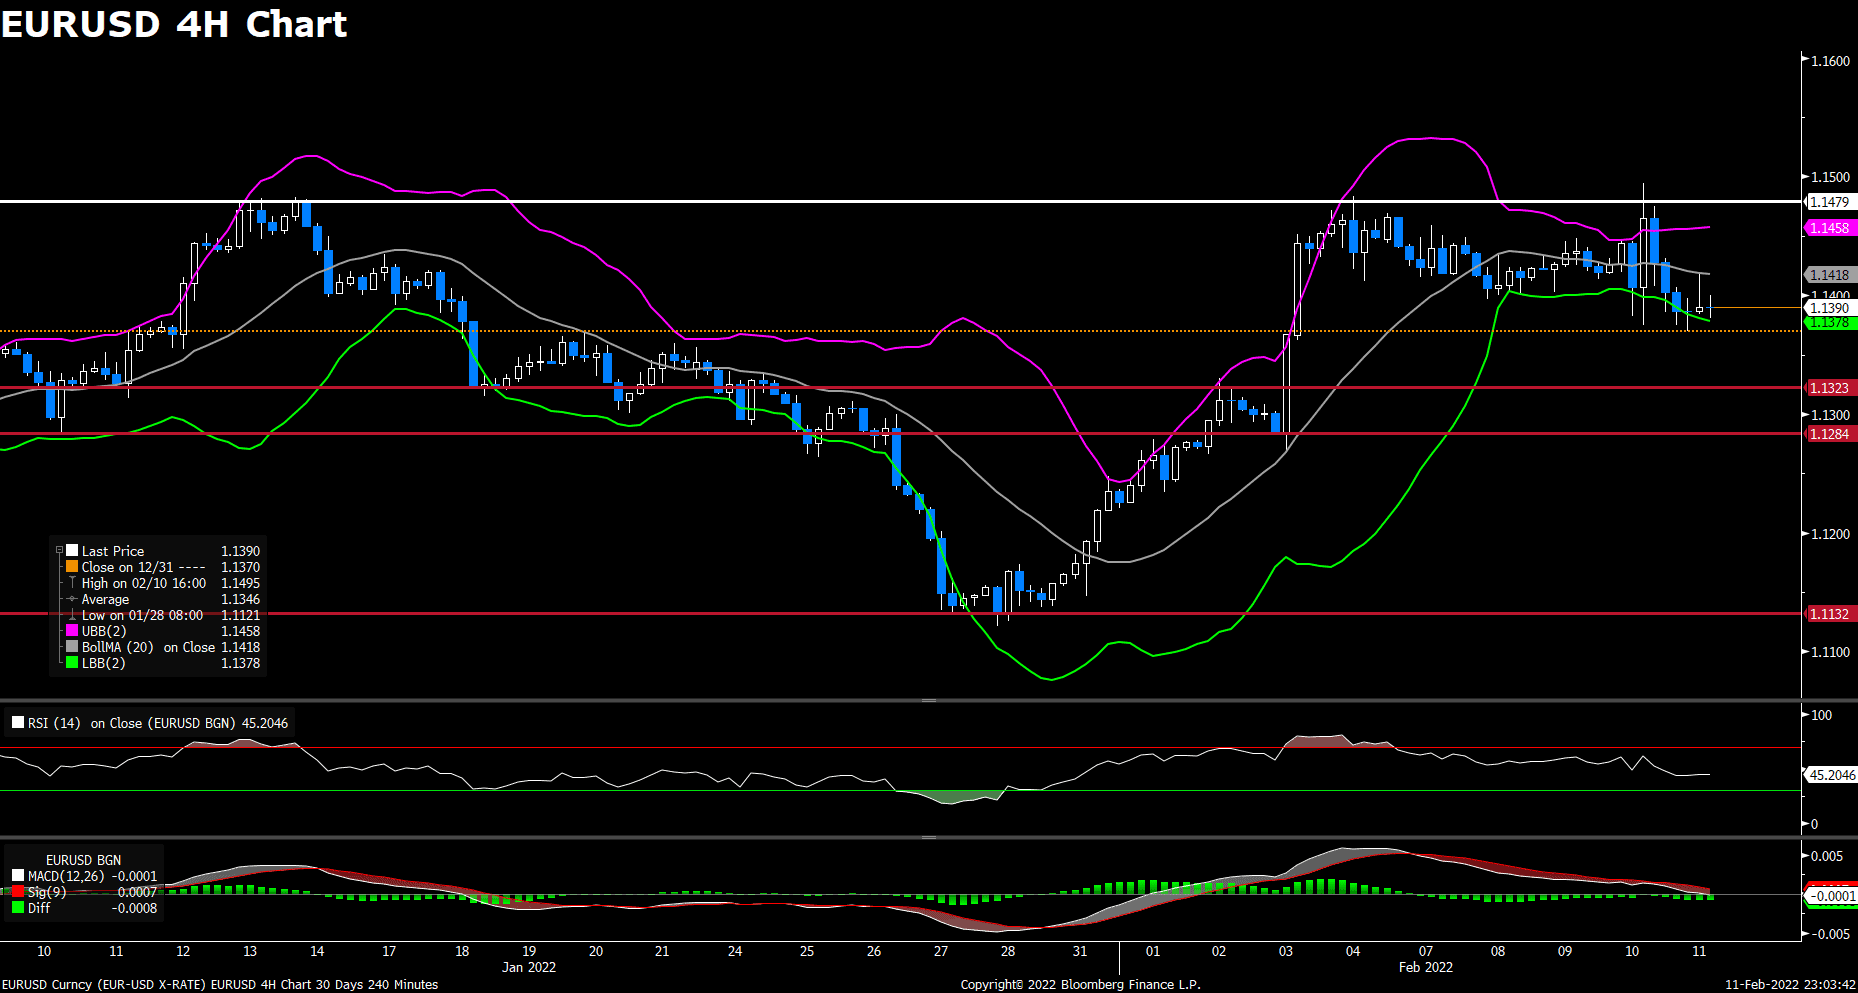
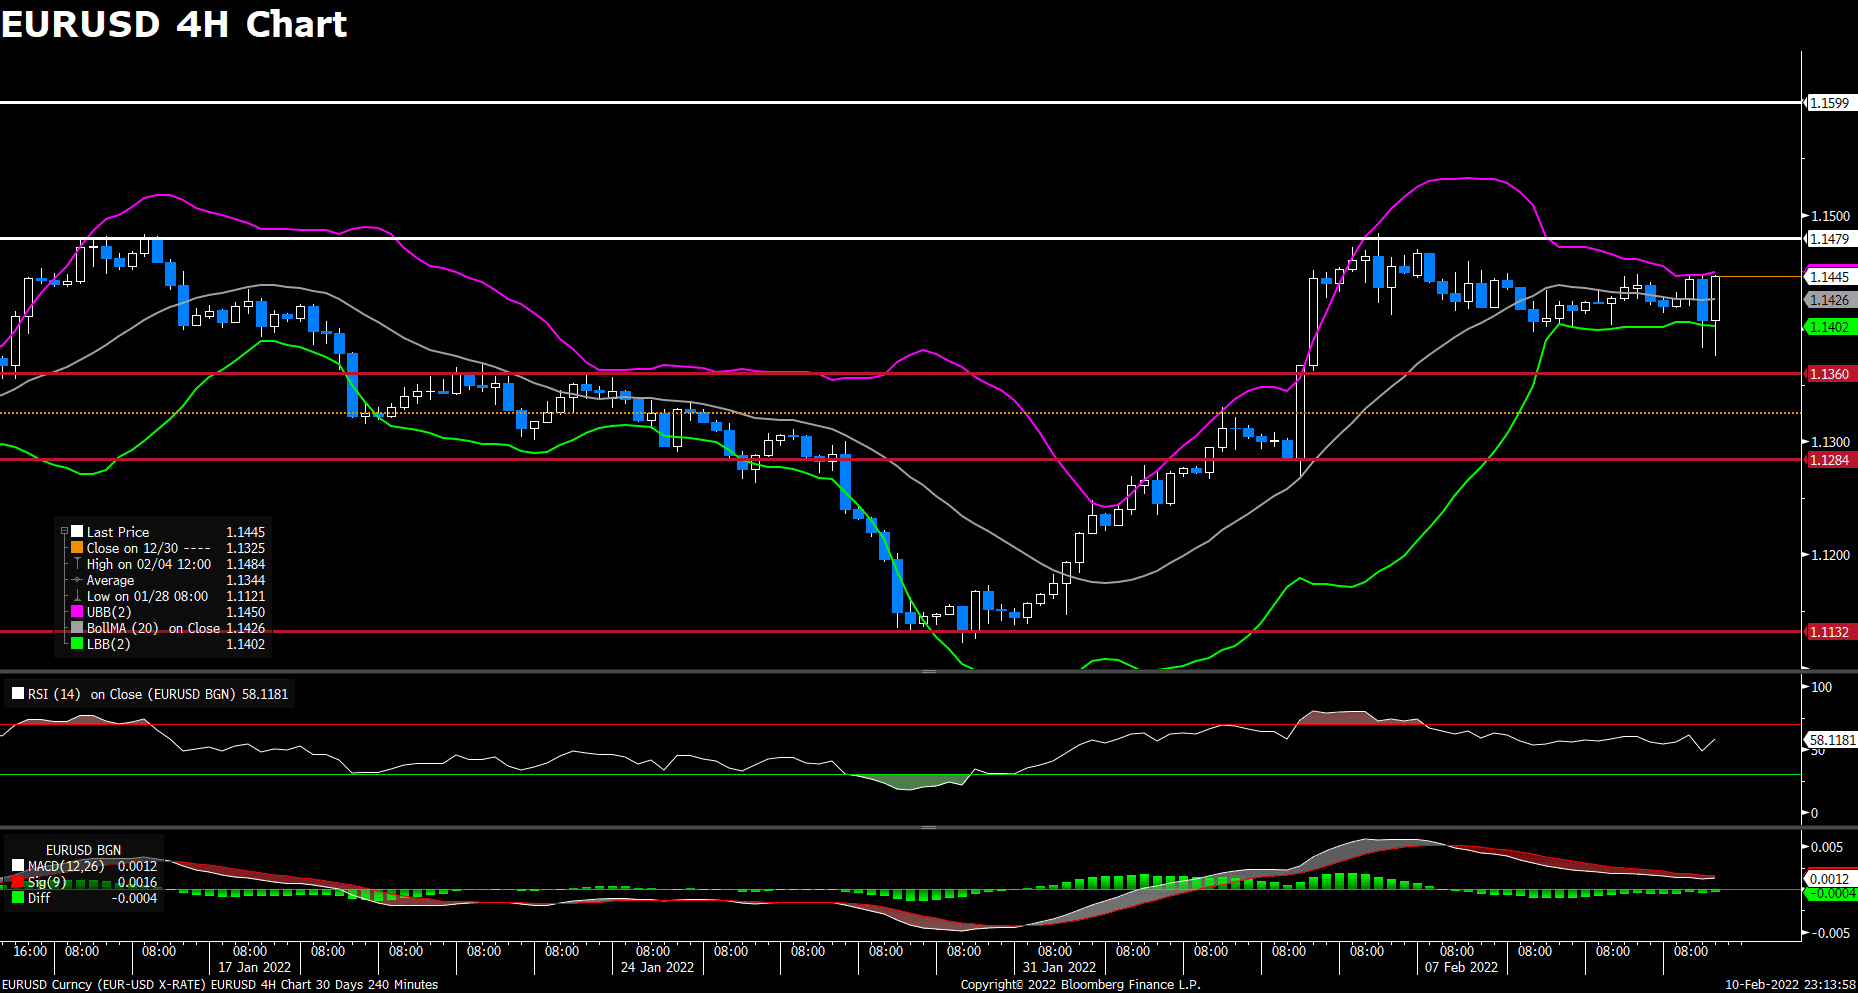
The EUR/USD pair edged higher on Wednesday, continuing to rebound towards 1.1400 area amid modest upbeat market sentiment. The pair started to see fresh buying in early Asian session and touched a daily high near 1.1395 mark during European session, then retreated below 1.1370 level amid rebounding US dollar. The pair is now trading at 1.1362, posting a 0.05% gain on a daily basis. EUR/USD stays in the positive territory amid weaker US dollar across the board, as investors remain mildly optimistic today, expecting the geopolitical tensions between Russia and Ukraine to ease. But hawkish Fed expectations and upbeat US Retail Sales data should help limit any further losses for the greenback. In Europe, Industrial Production in the euro area rises by 1.2% in December, surpassing market expectations of 0.3%.
For technical aspect, RSI indicator 51 figures as of writing, suggesting that there is no obvious direction for the pair now. As for the Bollinger Bands, the price continues to rise towards the upper band, which indicates that the upside traction should persist. In conclusion, we think market is consolidating in 1.1350~1.1400 area as RSI indicator lacks directional strength. The bullish side will become firmer if the pair breaks above the 1.1424 support level.
Resistance: 1.1424, 1.1465
Support: 1.1284, 1.1196, 1.1132
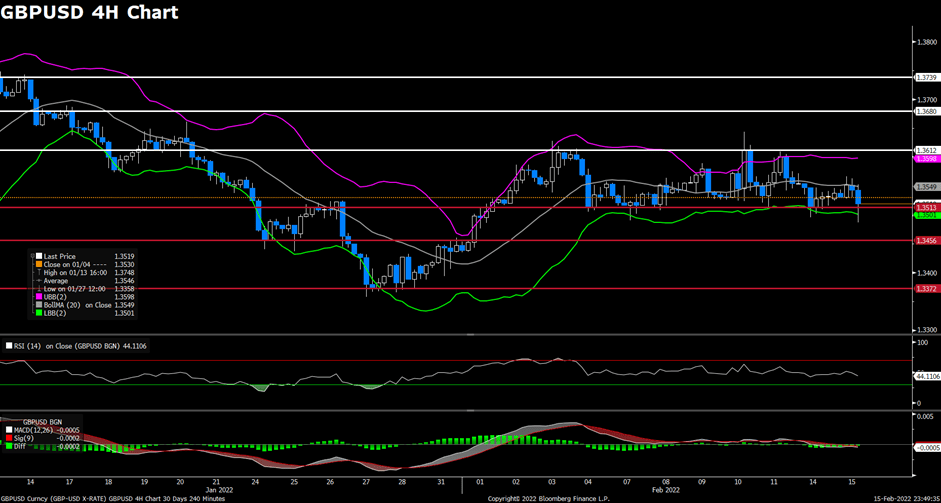
GBPUSD (4-Hour Chart)
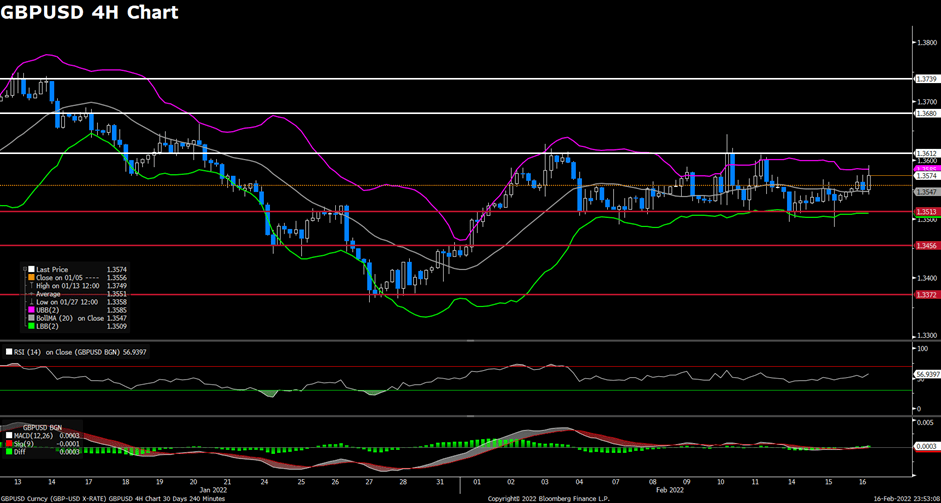
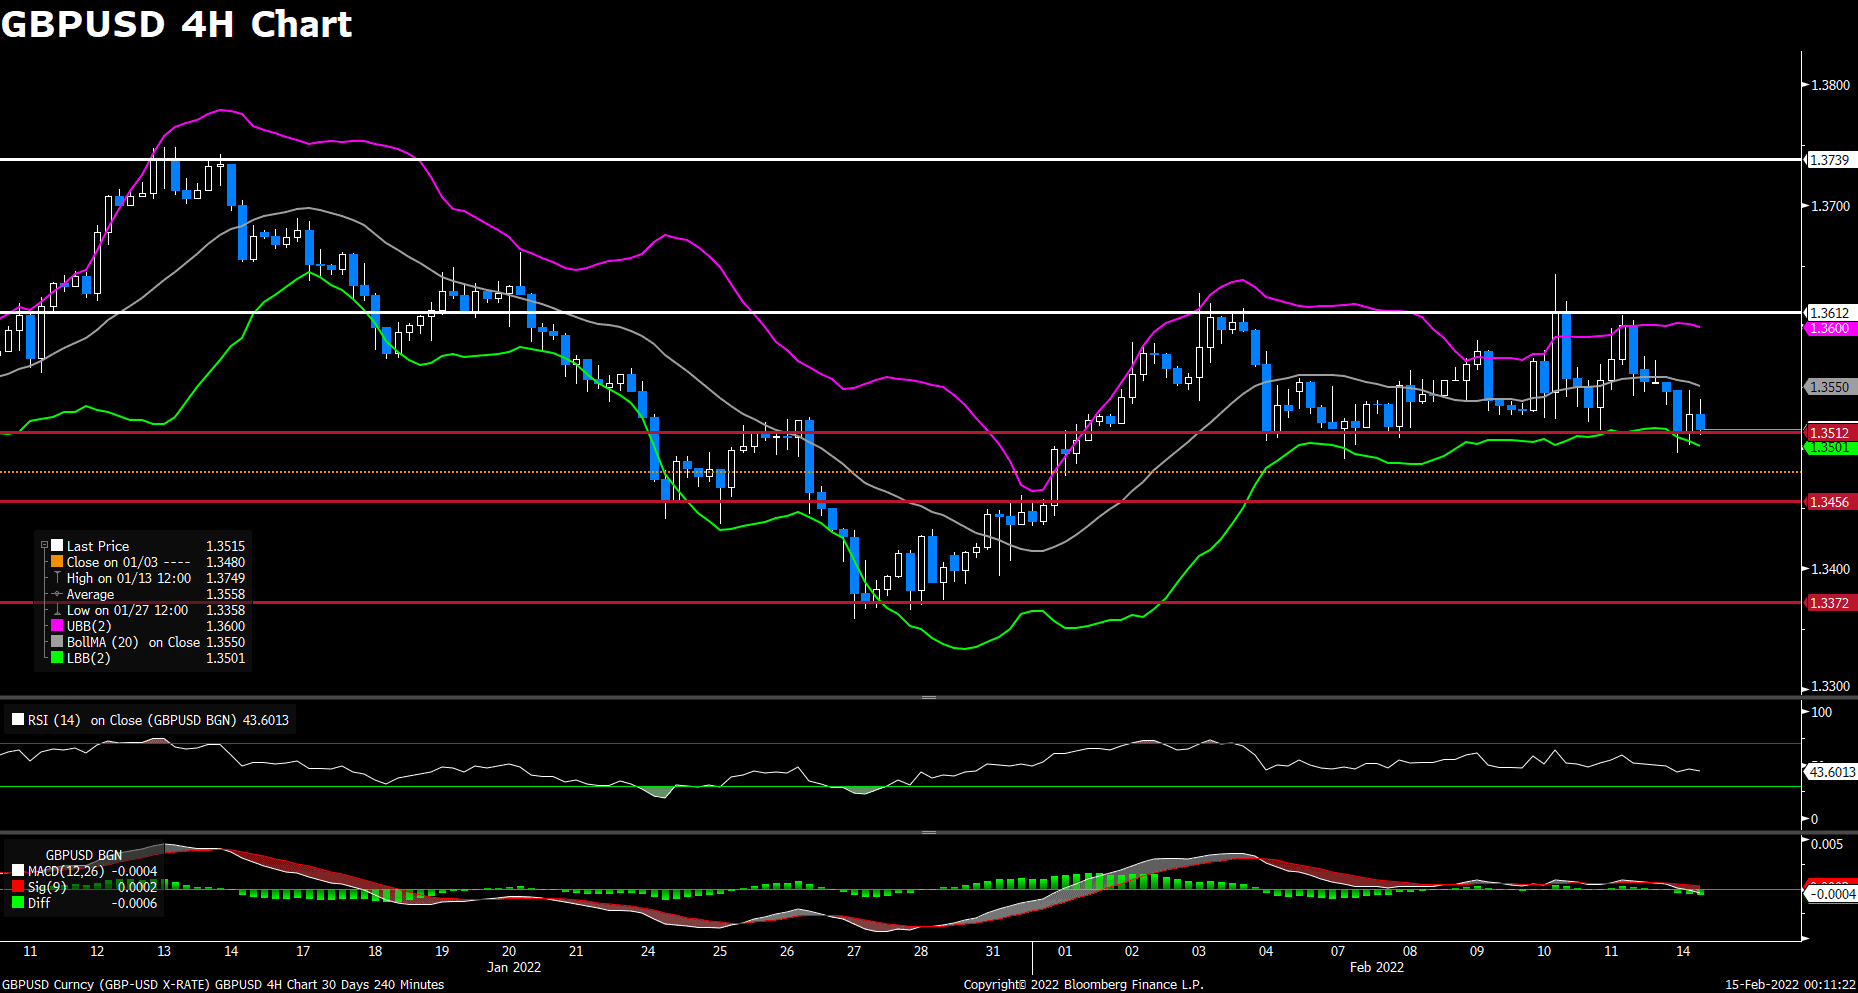
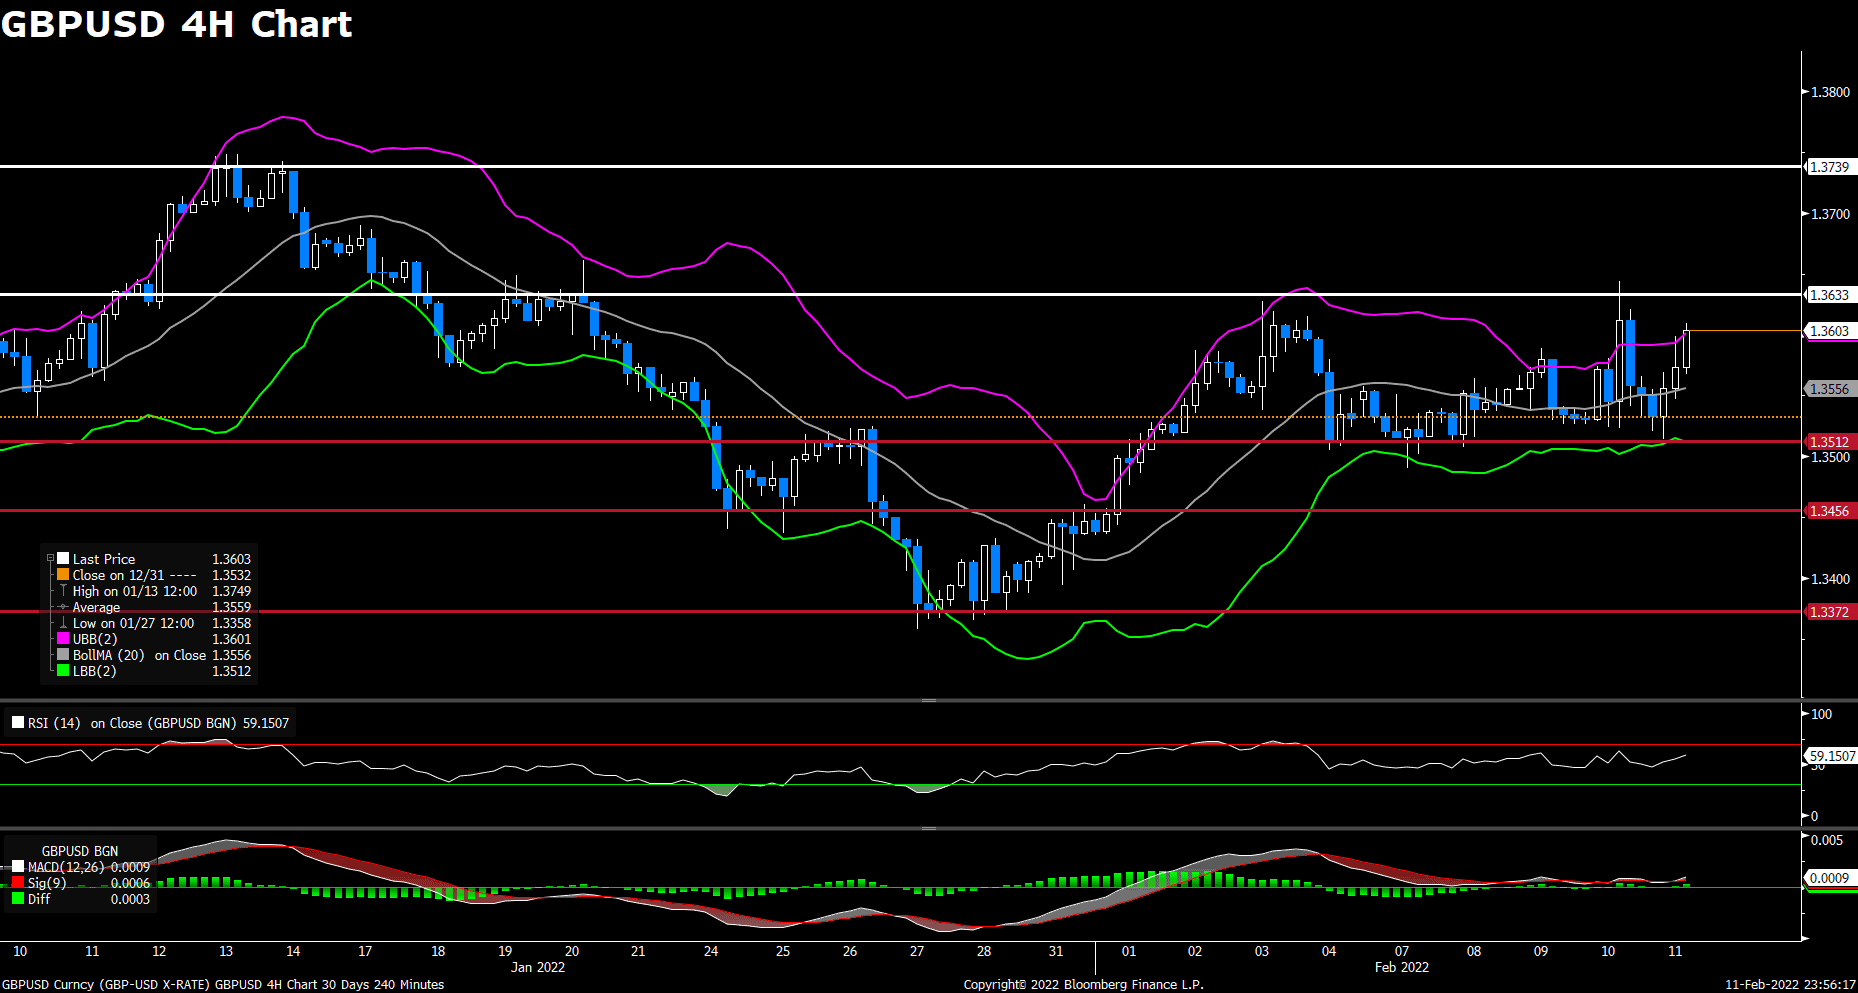
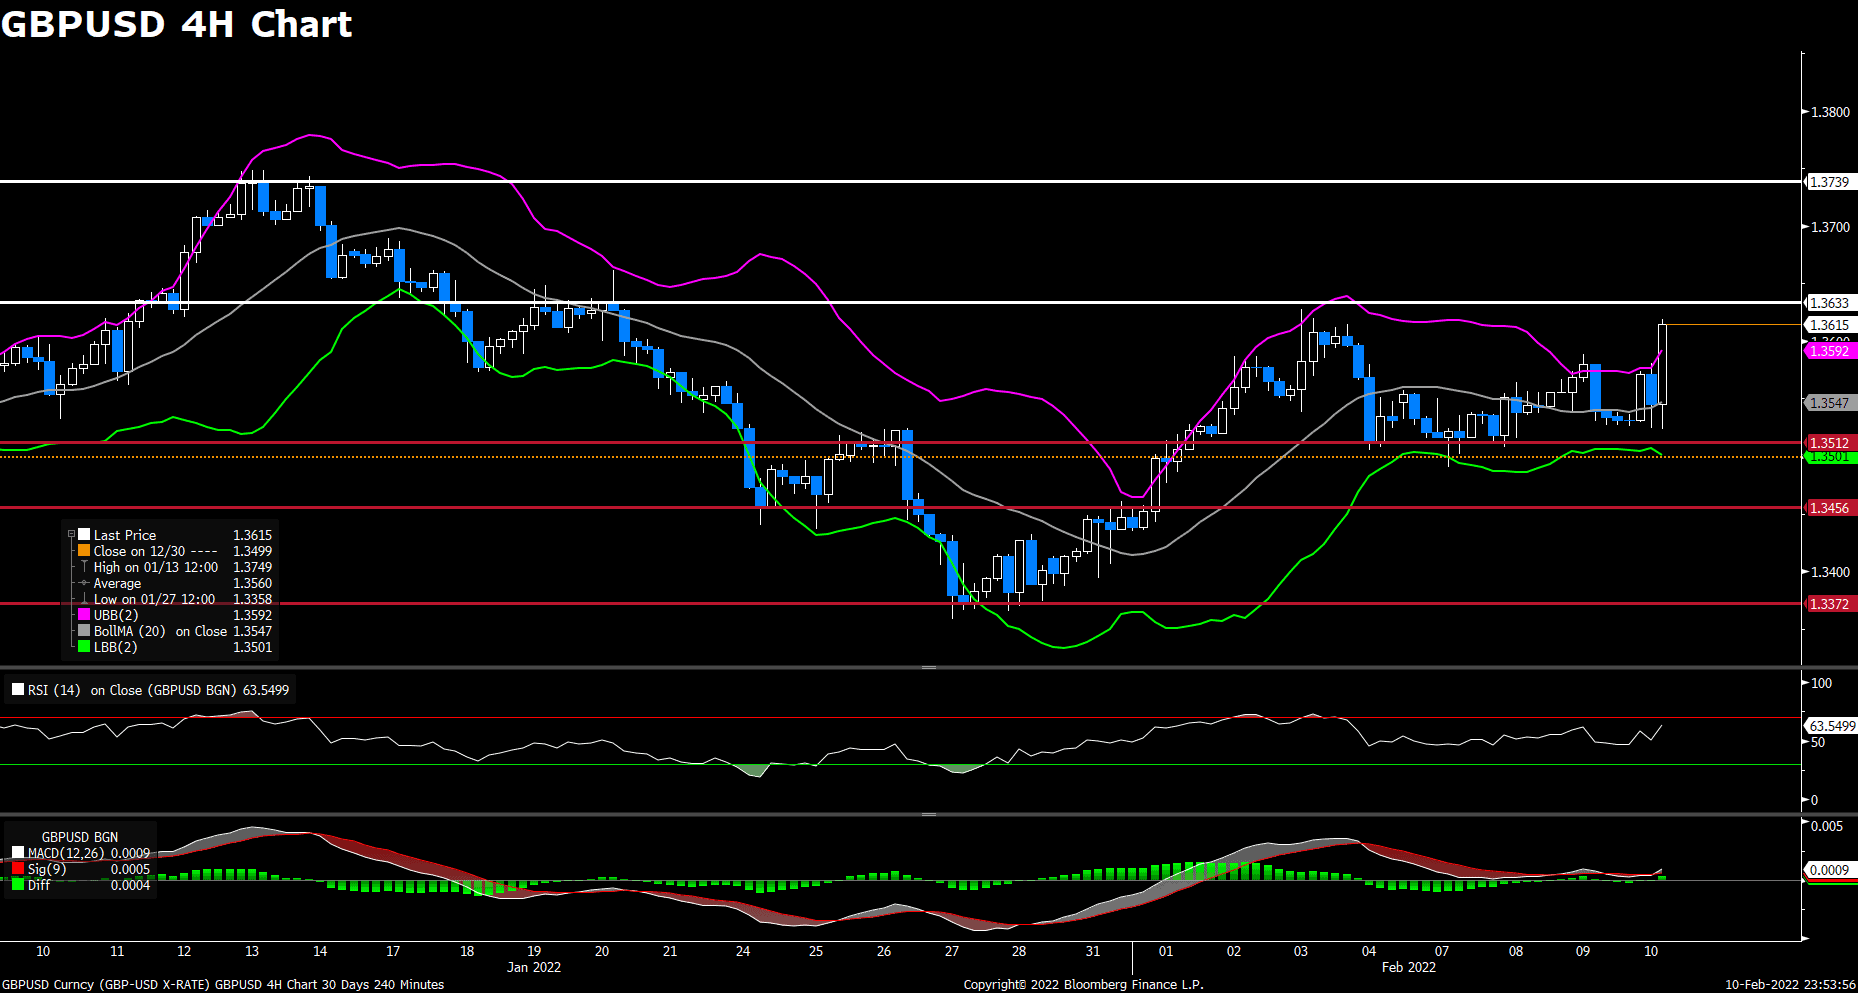
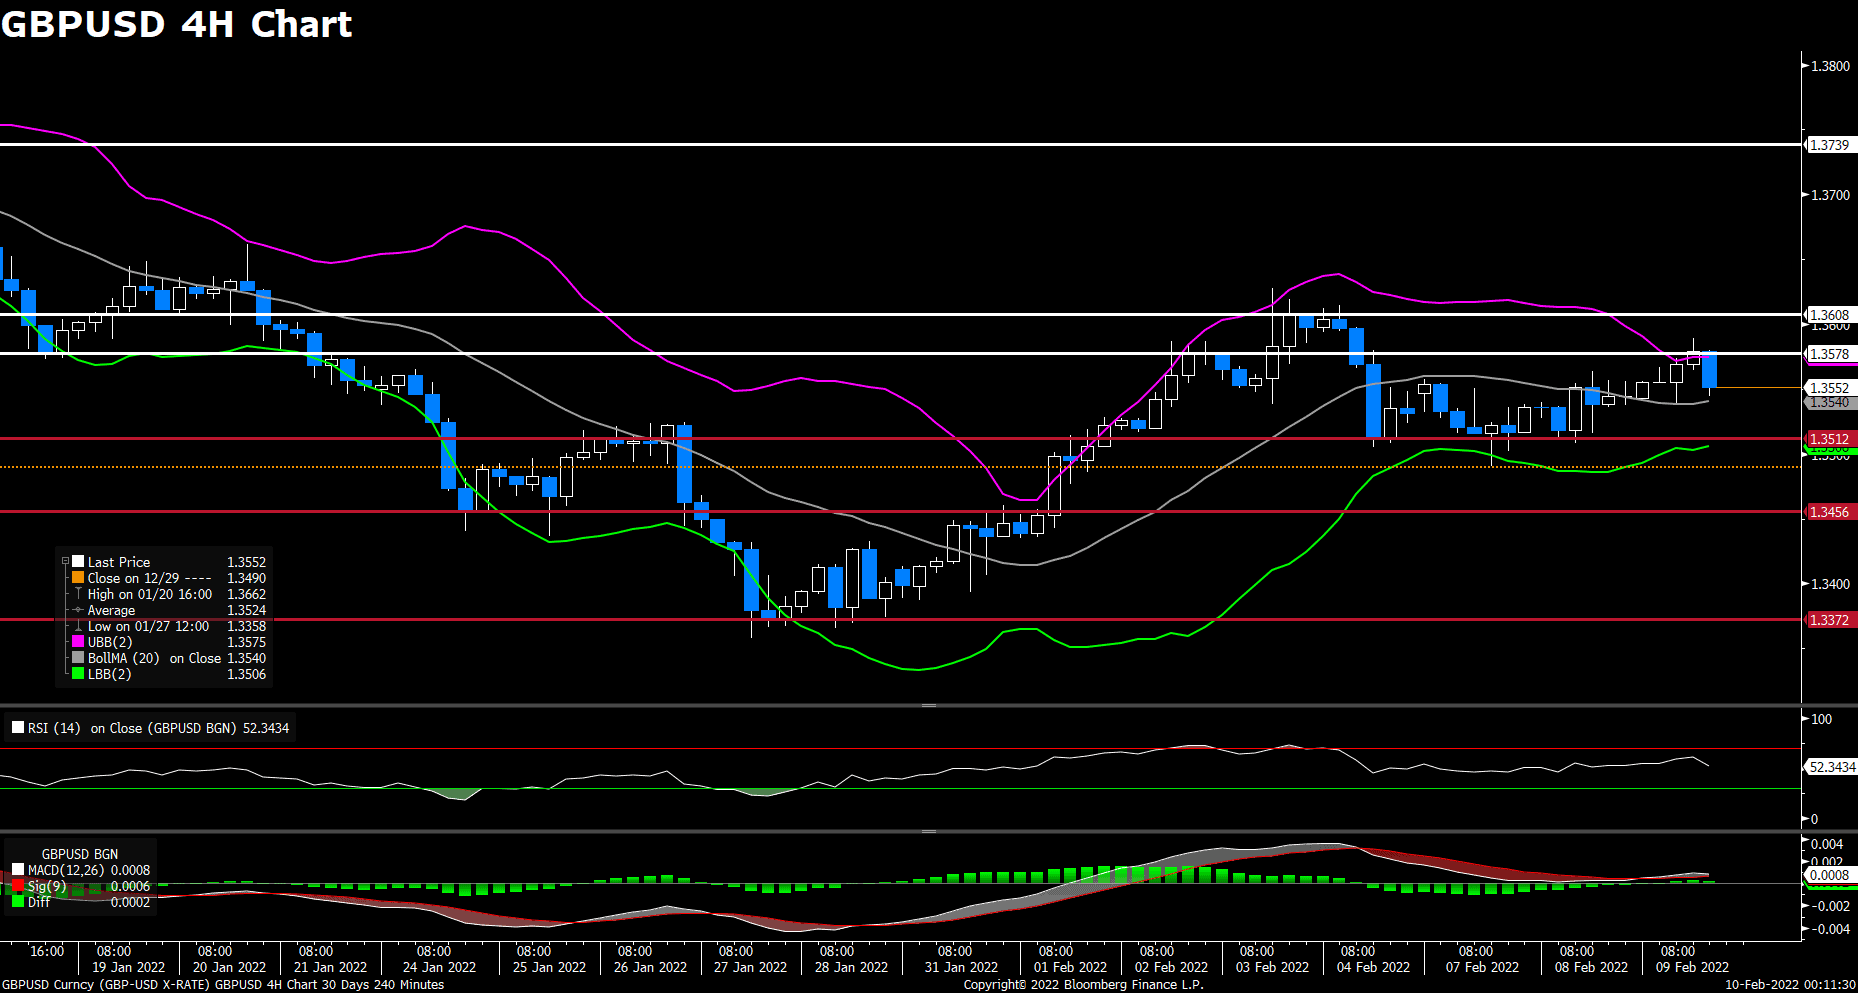
The pair GBP/USD advanced on Wednesday, bouncing back from a two-week low below 1.3500 mark that touched yesterday. The pair was trading higher during Asian session and touched a daily high above 1.3580 level in early American session, preserving bullish traction for the second successive day. At the time of writing, the cable stays in positive territory with a 0.31% gain for the day, flirting with 1.3570~1.3580 area. The receding geopolitical tensions between Russia and Ukraine has lend some supports to the cable, but the data showing that US Retail Sales rise by 3.8% might limit the upside for GBP/USD. For British pound, the UK Consumer Prices Index (CPI) rises by 5.5% in January, which was higher than market’s expectation and strengthened the case for additional rate hikes this year by Bank of England.
For technical aspect, RSI indicator 58 figures as of writing, suggesting that upside is more favored as the RSI stays above the mid-line. As for the Bollinger Bands, the price is rising towards the upper band, indicating that the bullish momentum is gathering strength. In conclusion, we think market will be bullish as the RSI indicator heads towards 60, hinting at a buying interest by investors. If the pair breaks above the 1.3612 resistance and starts using that level as support, short-term gains could be expected.
Resistance: 1.3612, 1.3680, 1.3739
Support: 1.3513, 1.3456, 1.3372
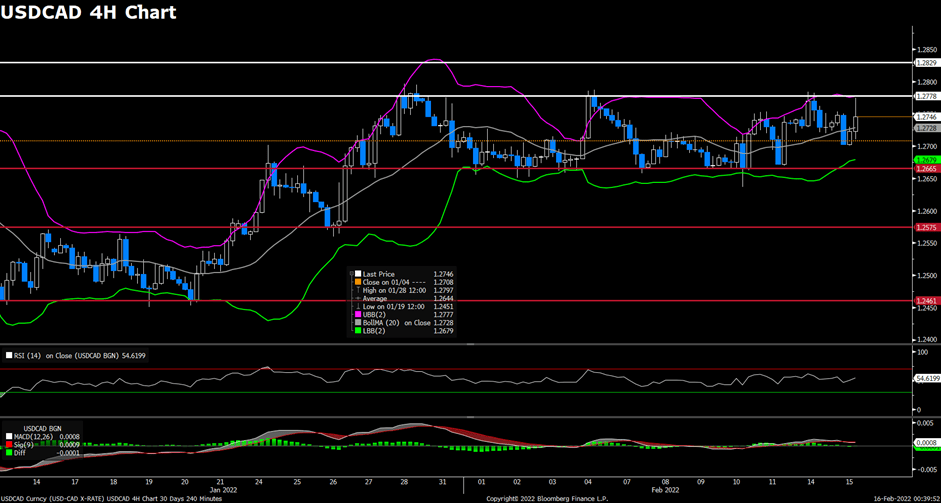
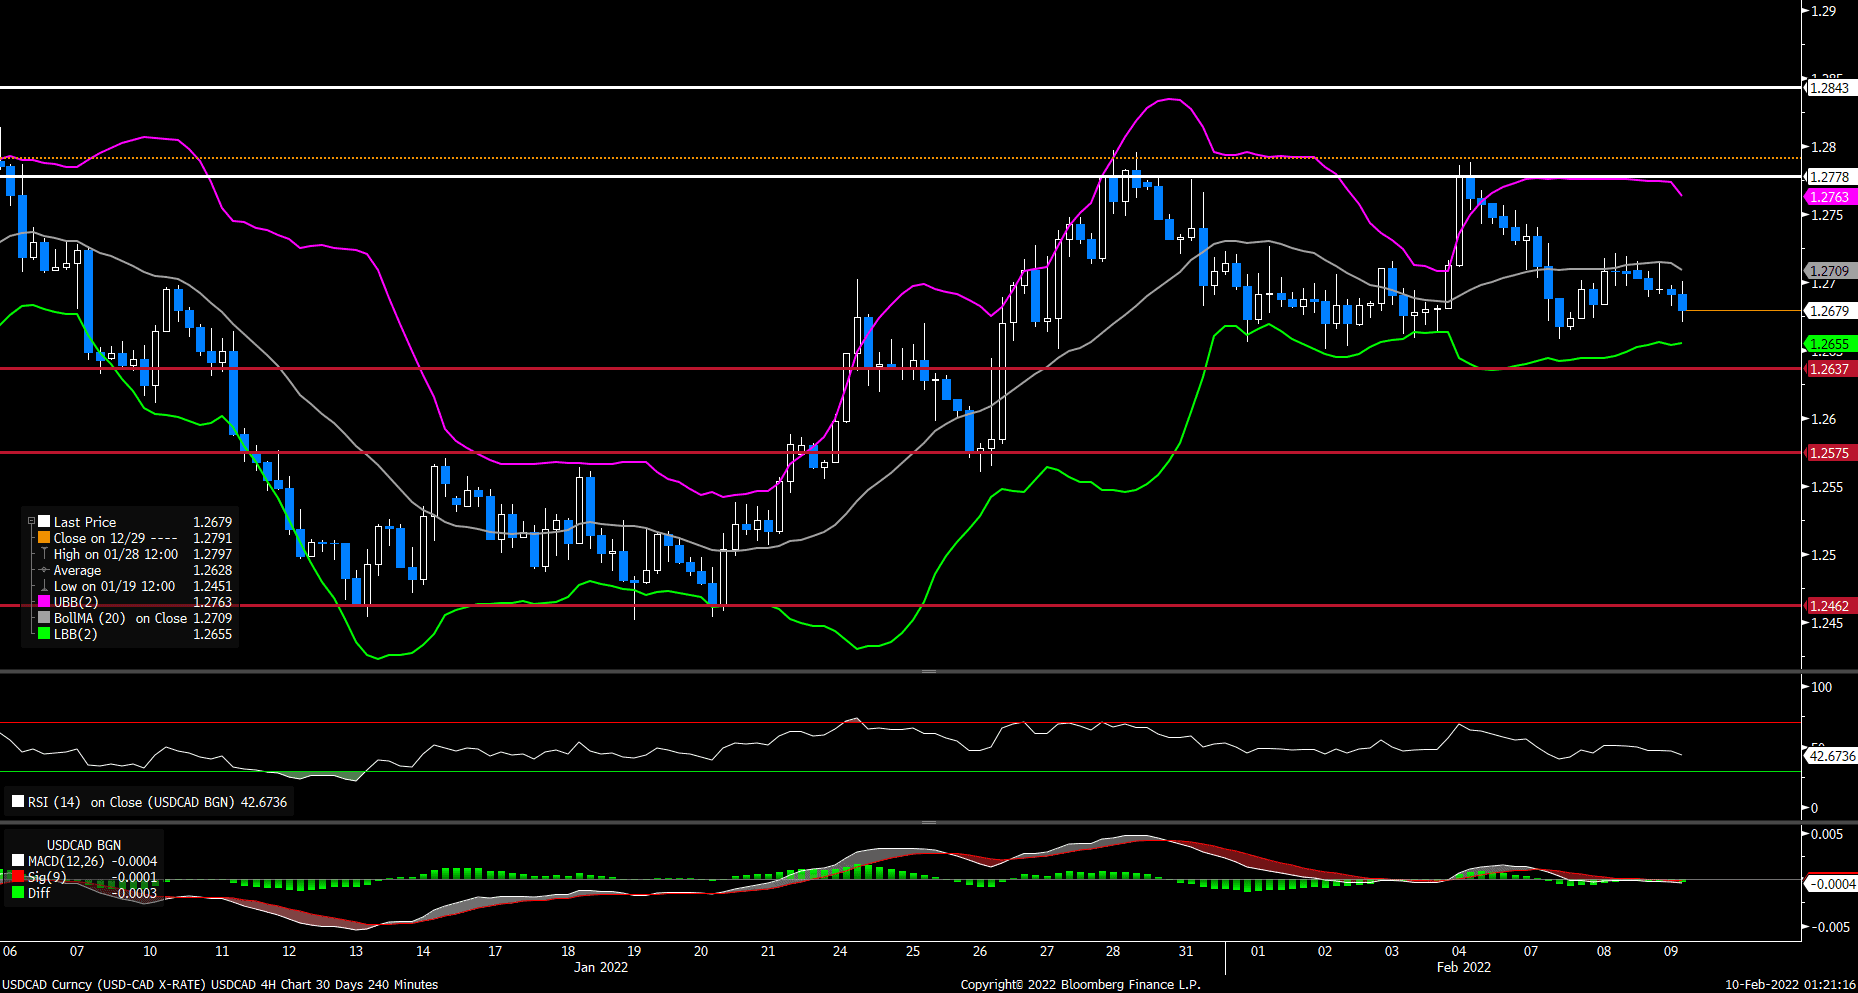
USDCAD (4-Hour Chart)
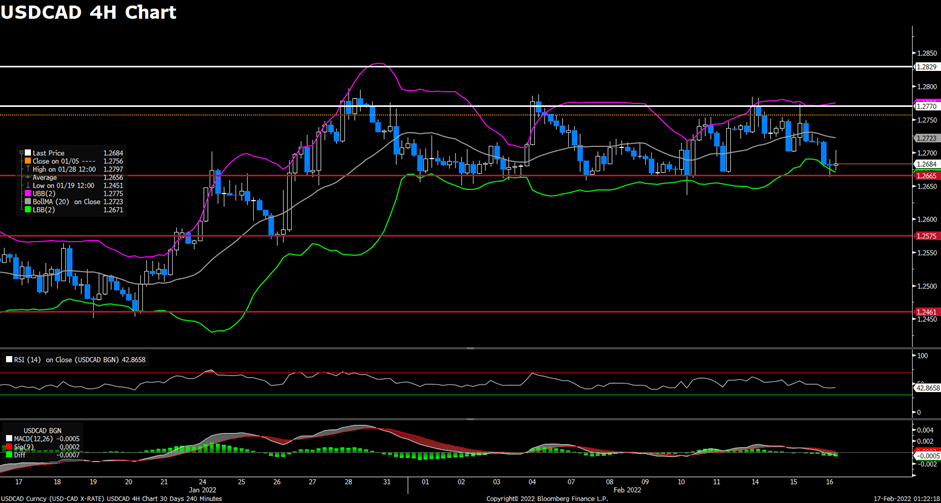
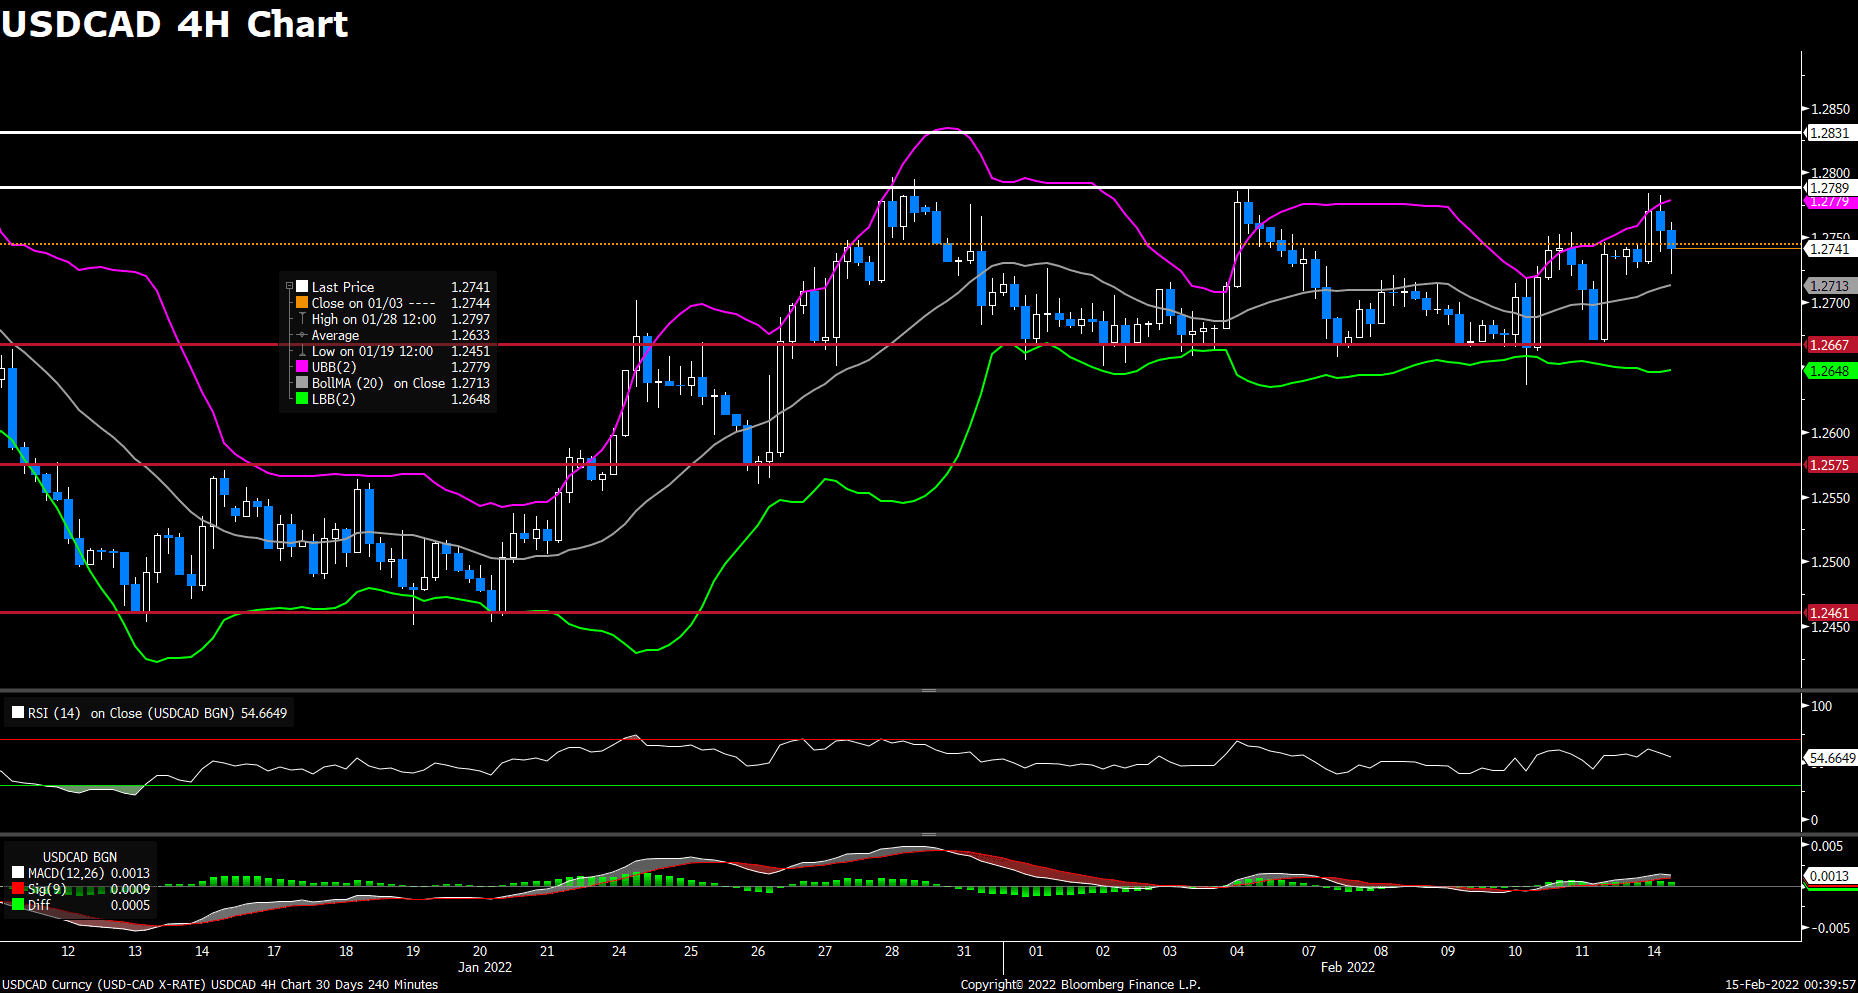
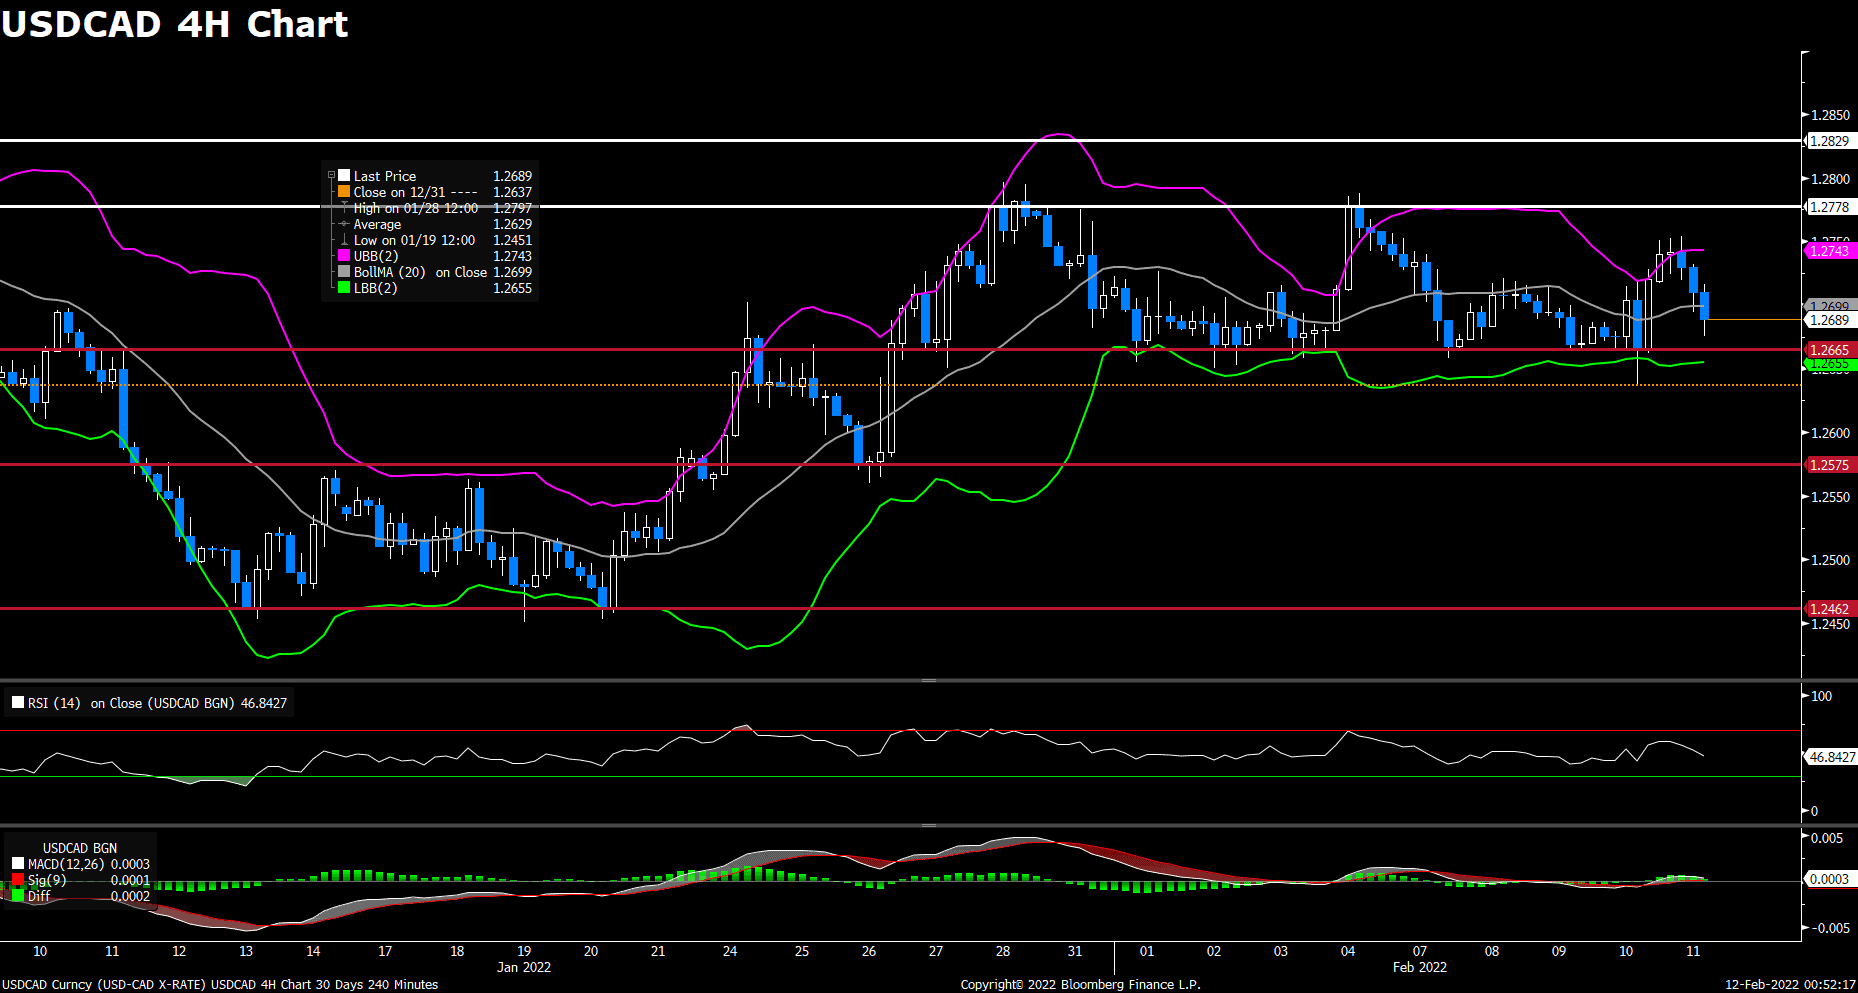
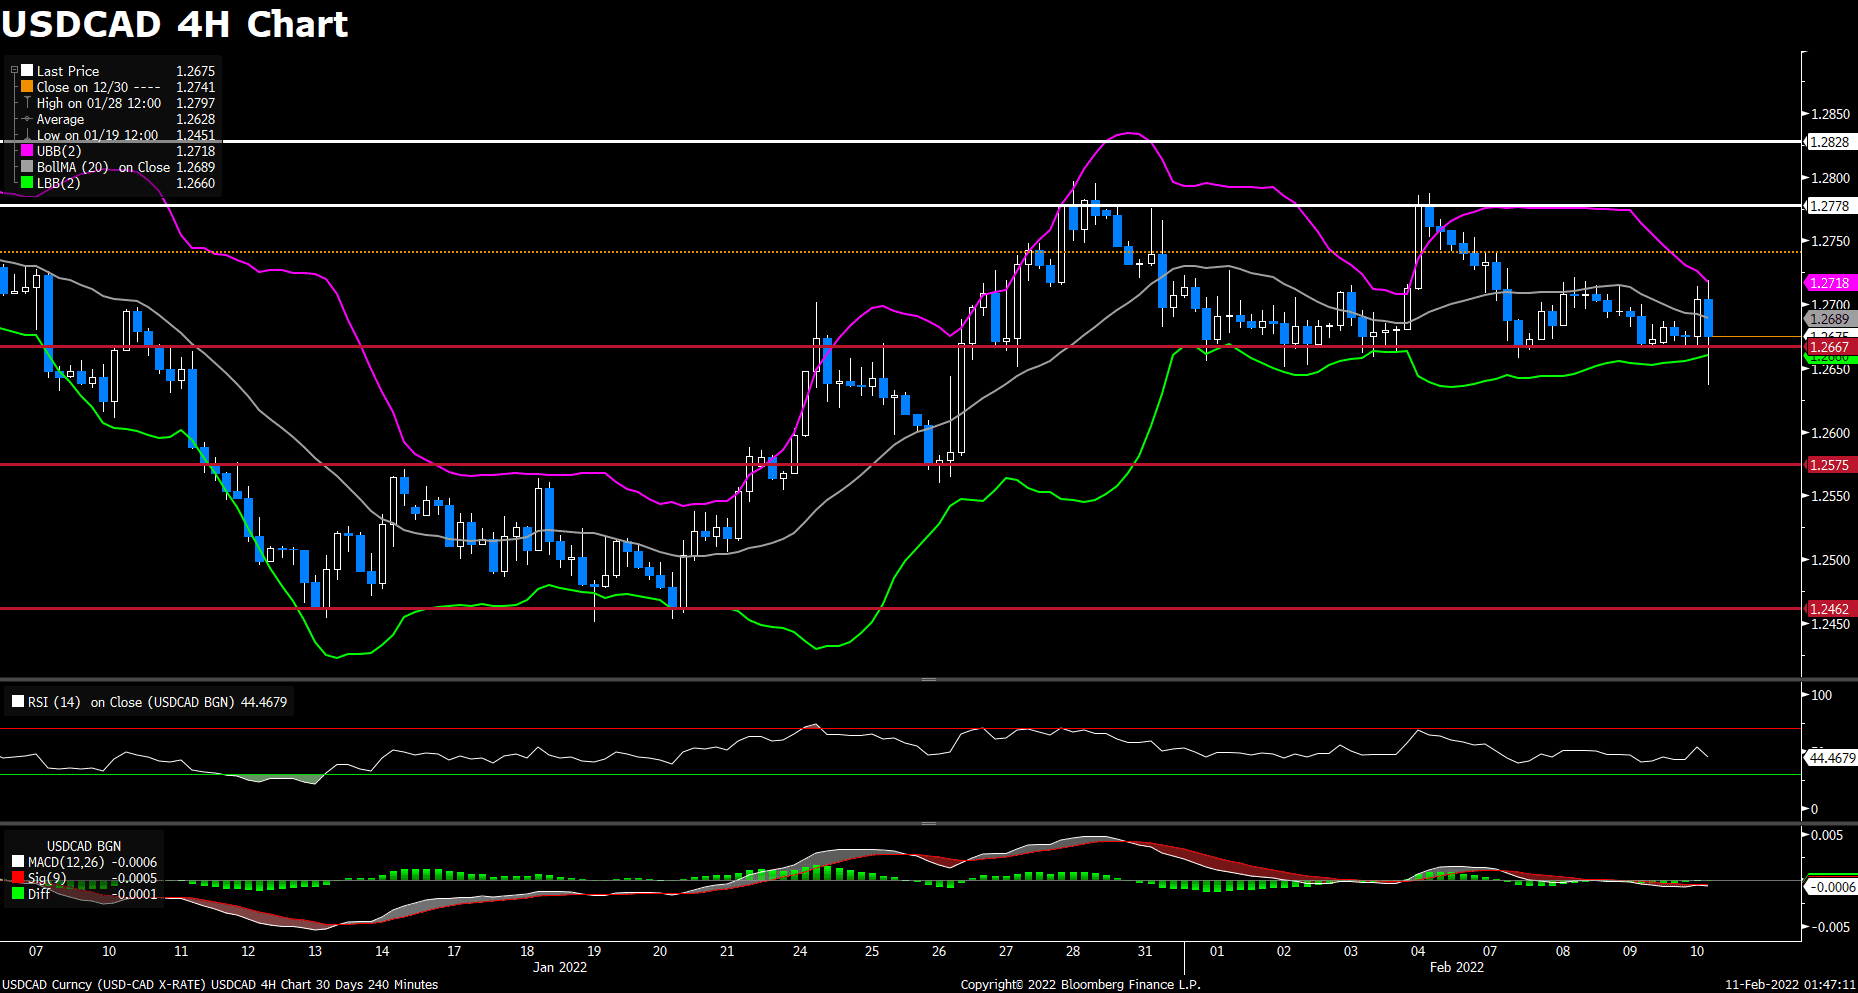
As the market mood keeps swinging between risk-on/off, the pair USD/CAD witnessed downside momentum and extended its intraday losses amid renewed US dollar weakness. The pair was surrounded by bearish momentum most of the day, dropping to a daily low below 1.2670 level in late European session. USD/CAD is trading at 1.2743 at the time of writing, rising 0.13% on a daily basis. Despite yesterday’s news have eased the concern about tensions between Russia and Ukraine, US Secretary of State Blinken said on Wednesday that they continue to see Russian troops moving towards the border and caused a turnaround in market sentiment. On top of that, surging crude oil prices also acted as a headwind for USD/CAD, as WTI rebounded back above $94.00 amid confusion about a troop withdrawing by Russia.
For technical aspect, RSI indicator 43 figures as of writing, suggesting bear movement ahead. As for the Bollinger Bands, the price is now consolidating near the lower band, indicating that a continuation of downside traction could be expected. In conclusion, we think market will be slightly bearish as the pair might re-test the 1.2665 support. Meanwhile the hotter-than-expected Canadian CPI report will keep supporting the commodity-linked loonie.
Resistance: 1.2770, 1.2829
Support: 1.2665, 1.2575, 1.2461
Economic Data:
| Currency | Data | Time (GMT + 8) | Forecast |
| AUD | Employment Change (Jan) | 08:30 | -15.0K |
| USD | Building Permits (Jan) | 21:30 | 1.760M |
| USD | Initial Jobless Claims | 21:30 | 219K |
| USD | Philadelphia Fed Manufacturing Index (Feb) | 21:30 | 20.0 |