Market Focus
Wall street three major indexes tumbled on Tuesday, with the S&P 500 confirming a correction, as the Ukraine-Russia crisis unnerved investors after Russian President Vladimir Putin recognized two expanded borders of Luhansk and Donetsk and ordered troops to the area. In addition, the U.S. outlined new sanctions to prevent Russia from opening up more territory in Ukraine, turning hope into despair and fueling a climate of insecurity. Regarding sanctions, Biden said the US has no intention of fighting Russia. He said the sanctions targeted Russian banks and sovereign debt, among others. At the end of the market, the Dow Jones Industrial Average fell 1.42% to 33,596.61 points, the S&P 500 index lost 1.01% to 4,304.76 and the Nasdaq Composite Index dropped 1.23% to 13,381.52 points.

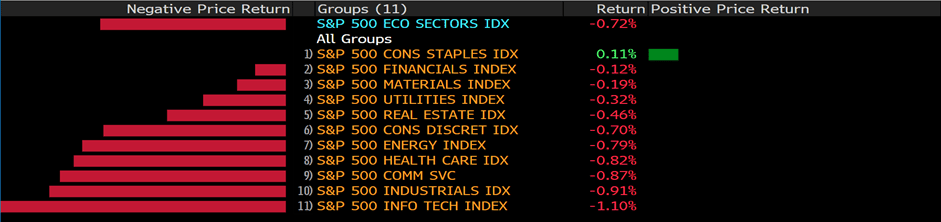
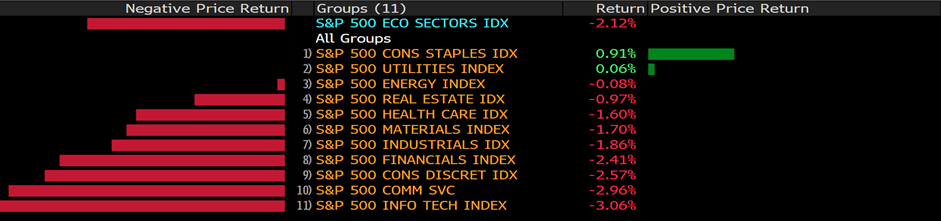
Eleven sectors in the S&P 500 all ended lower, with the consumer discretionary falling the most, down 3.04%, followed by energy and material sectors, down 1.53% and 1.38%, respectively. In the consumer discretionary sectors, Home Depot slumped more than 8% despite better-than-expected fourth-quarter results. Home Depot reported fourth-quarter earnings of $3.21 on revenue of $35.72 billion and comparable sales of 8.1%. The energy sector was dragged down by a drop in oil prices, which retreated from session highs. Pioneer Natural Resources, APA and Devon Energy were the hardest-hit stocks in the energy sector, all down more than 3%. Big tech stocks such as Apple, Amazon, Microsoft, Alphabet and Facebook ended lower, but with smaller losses.
Main Pairs Movement:
The geopolitical tension between Russia and Ukraine continued to ferment, and the three major Wall Street stock indexes continued to fluctuate and fell. Investors paid more attention to defensive sectors and safe-haven products such as bonds and gold.
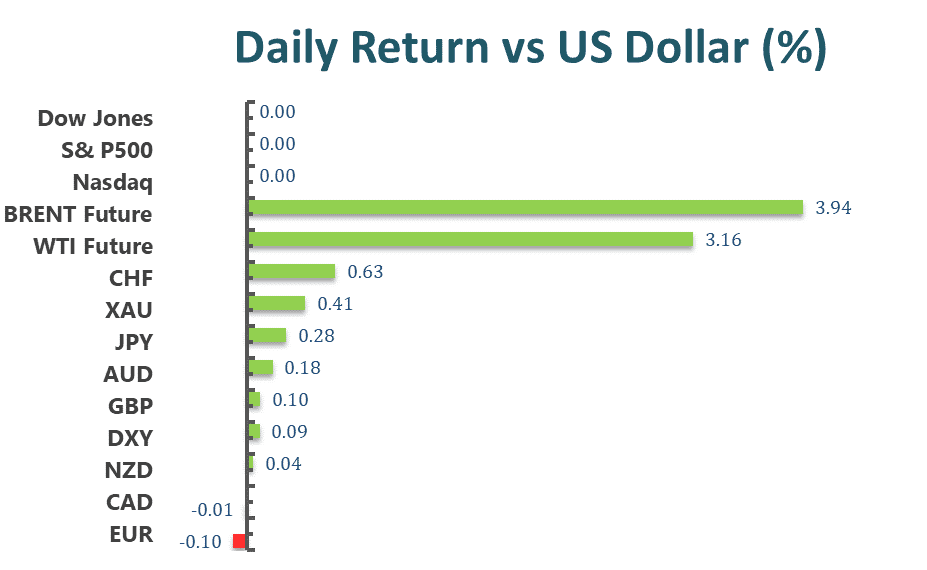
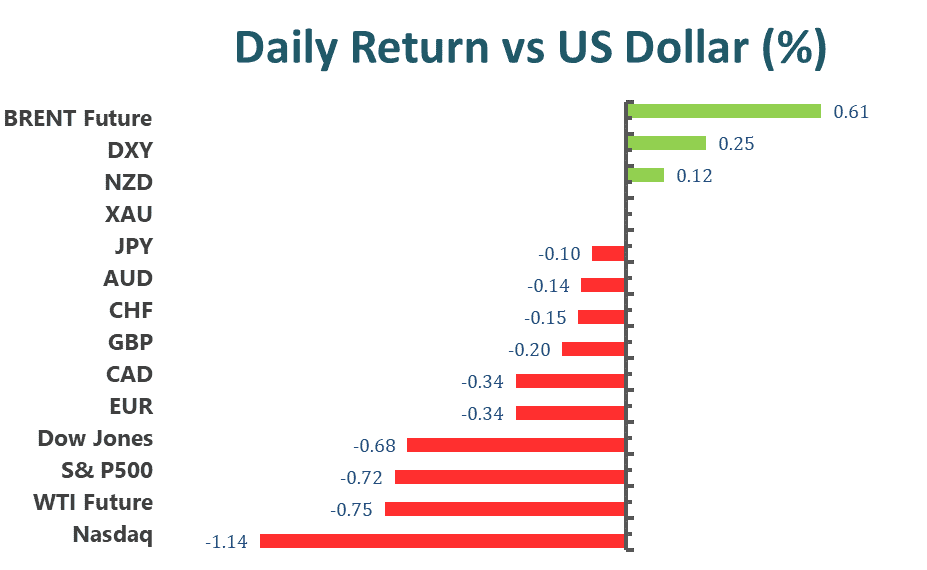
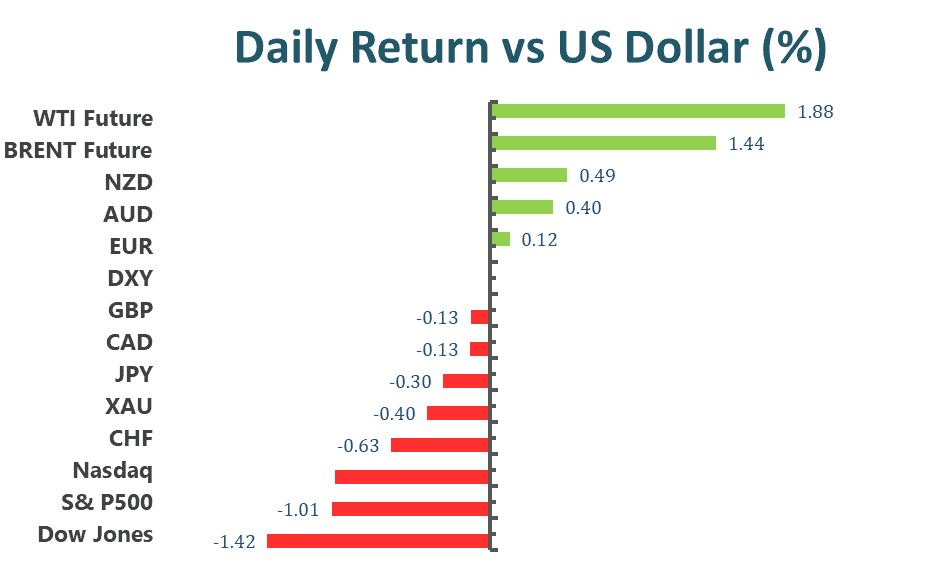
EUR/USD remains in the consolidated range around 1.1350, so does GBP/USD, and it settles around 1.3560. USD/CAD retreated sharply before the close, closing around 1.2740, while AUD/USD rose for the second day in a row, closing around 07220.
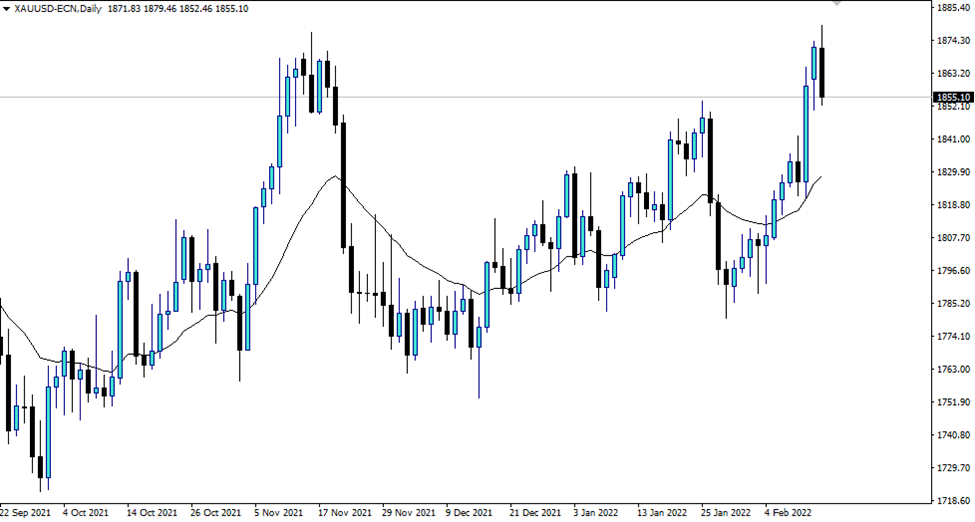
The safe-haven Swiss franc and Japanese yen edged lower against the greenback, while gold prices continued to rise and topped $1,914 an ounce intraday, but then retreated to settle at $1,898.
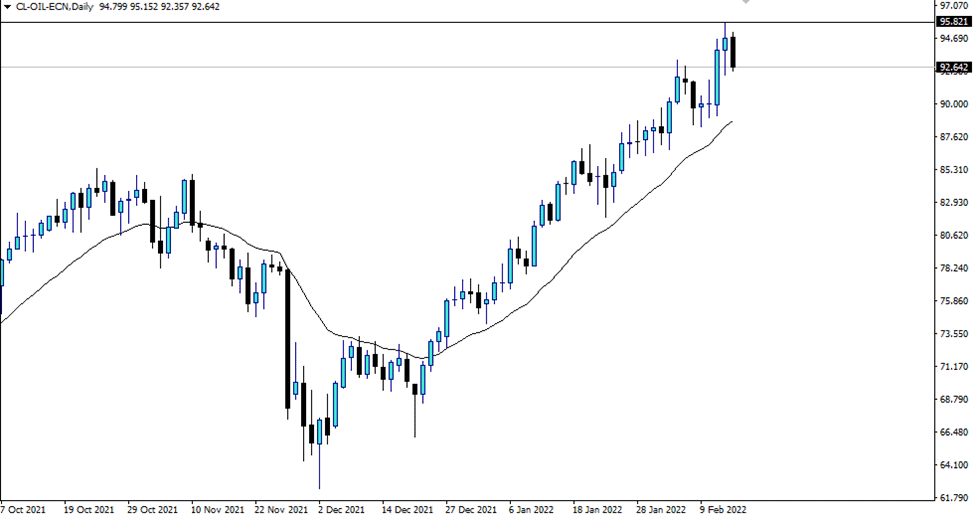
On the other hand, oil prices faced the selling pressure, with WTI lost 2.49% and closing at $91.60 a barrel and Brent lost 0.6% and closing at $96.84 a barrel.
EURUSD (4-Hour Chart)
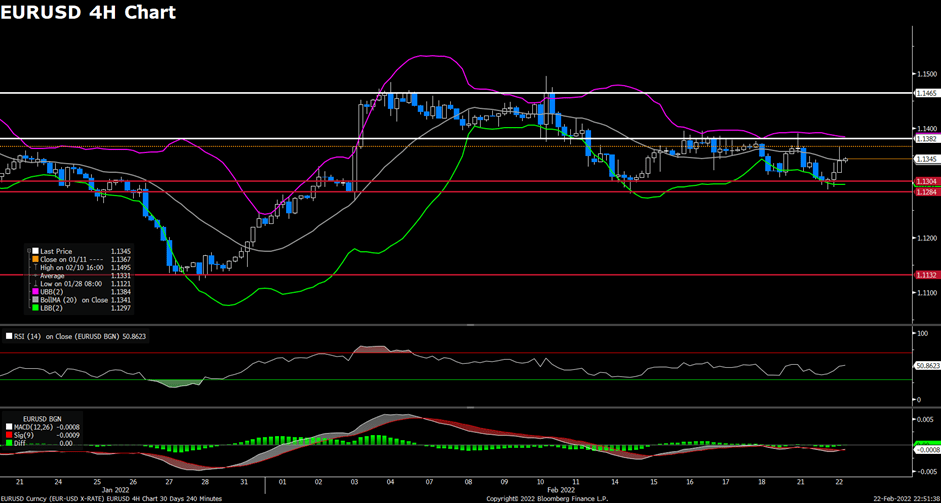
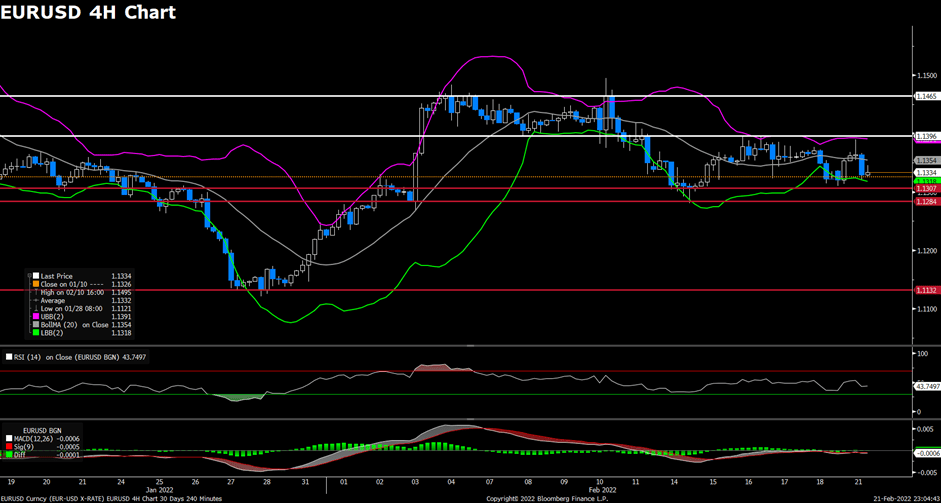
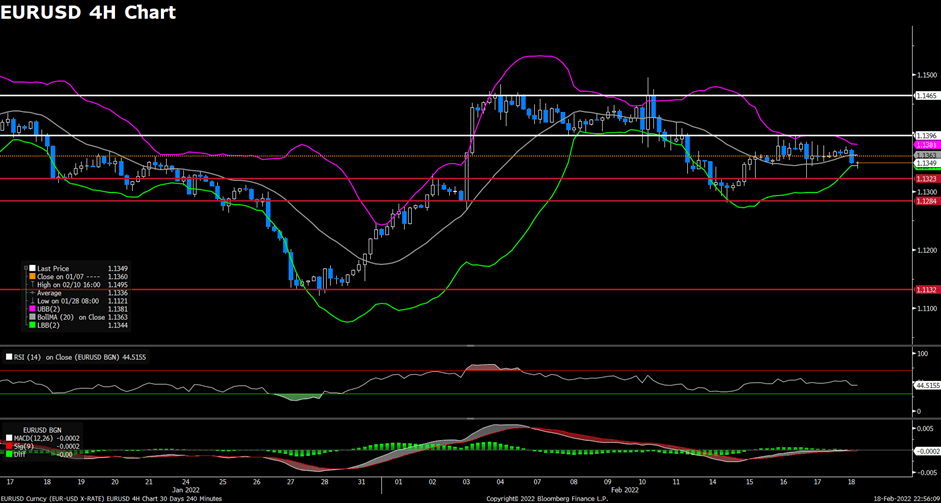
The EUR/USD pair advanced on Tuesday, ending its two-day slide that dropped to 1.1290 area amid improving market mood and upbeat economic data. The pair was trading lower and touched a one-week low in early European session, but then advances to 1.1350 area to erase all of its daily losses. The pair is now trading at 1.1344, posting a 0.33% gain on a daily basis. EUR/USD stays in the positive territory amid weaker US dollar across the board, as Ukraine president Volodymyr Zelenskyy’s comment lend some support to market sentiment and disfavored the greenback. He said that he believes there would not be war nor a wider escalation between Russia and Ukraine. For the Euro, the German IFO Business Climate Index came at 98.9 in February, which beat market’s expectations of 96.5 and acted as a tailwind for the EUR/USD pair.
For technical aspect, RSI indicator 50 figures as of writing, suggesting that the pair is lacking directions at the moment. As for the Bollinger Bands, the price rose from the lower band and touched the moving average, which indicates a continuation of upside action. In conclusion, we think market will be slightly bullish as long as the 1.1304 support line holds. Investors will keep eyeing on the Russia/Ukraine tensions.
Resistance: 1.1382, 1.1465
Support: 1.1304, 1.1284, 1.1132
GBPUSD (4-Hour Chart)
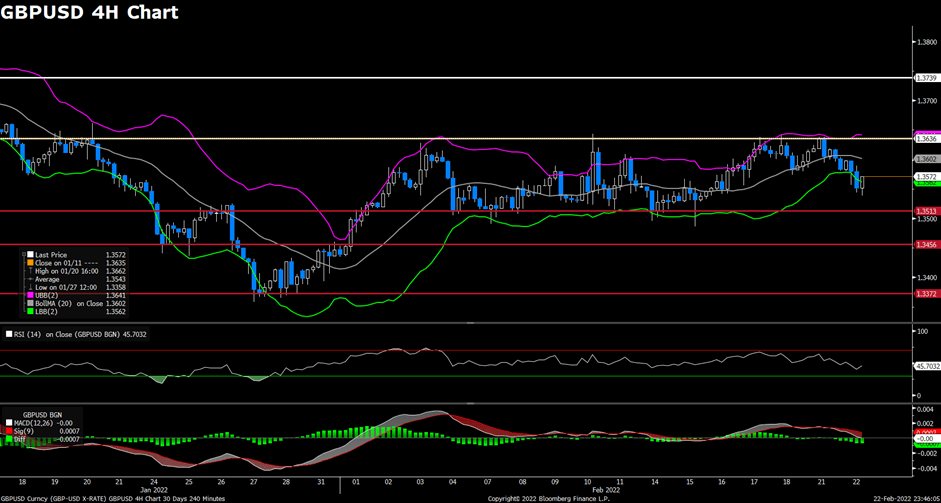
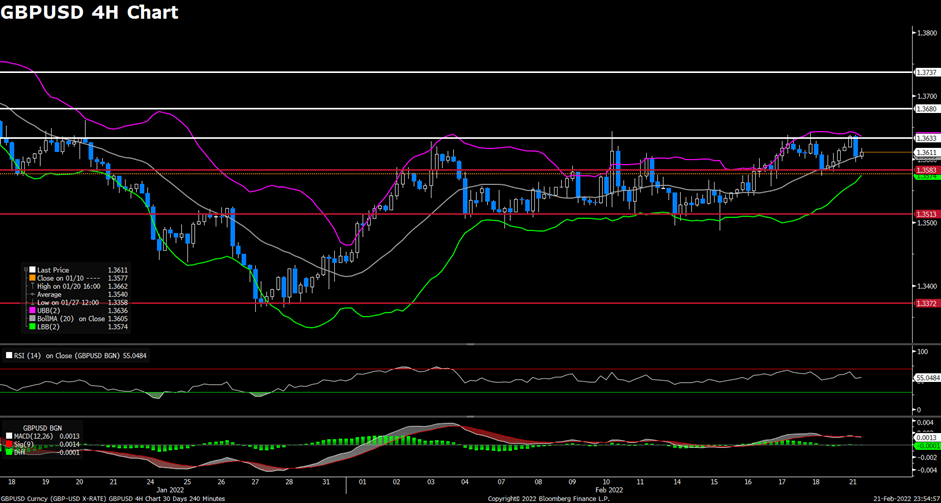
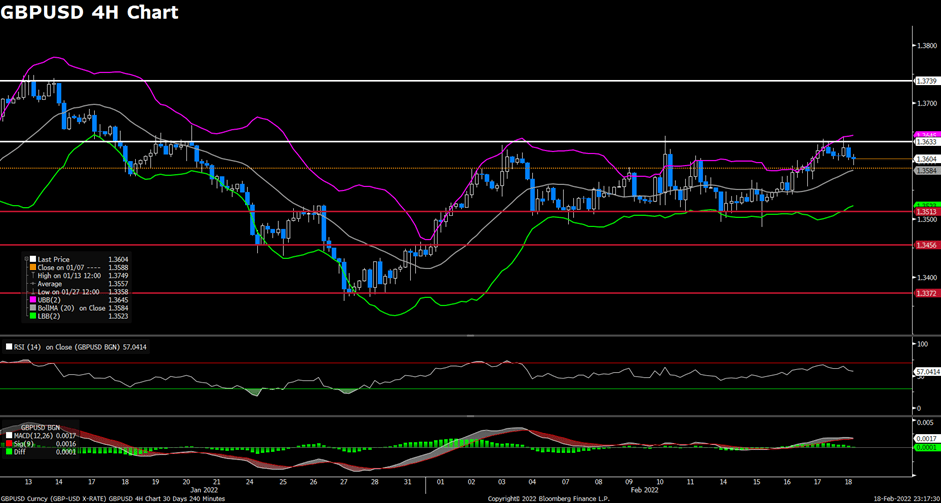
The pair GBP/USD declined on Tuesday, coming under selling pressure and extending the slide that start yesterday despite improving market mood. The pair was surrounded by bearish momentum most of the day, failing to stage a rebound in early European session and retreated to 1.3550 area amid renew selling. At the time of writing, the cable stays in negative territory with a 0.18% loss for the day, remaining under pressure on mixed Russia/Ukraine developments. The weaker US dollar failed to pushed the cable higher, as UK PM Boris Johnson formally announce economic sanctions against Russia for a breach of international law. This has made the British pound the worst performing G10 currency on the day. For British pound, Bank of England Deputy Governor Dave Ramsden said that some further policy tightening seems likely to be need in the near term. The hawkish comment might limit the losses for the cable.
For technical aspect, RSI indicator 43 figures as of writing, suggesting that downside is more favored as the RSI stays below the mid-line. For the Bollinger Bands, the price move immediately back inside the lower band after moving out of it, indicating a possible upside traction for cable. In conclusion, we think market will be bullish as the pair might attract some dip-buying, but a break above 1.3636 resistance is needed for the cable to edge higher.
Resistance: 1.3636, 1.3739
Support: 1.3513, 1.3456, 1.3372
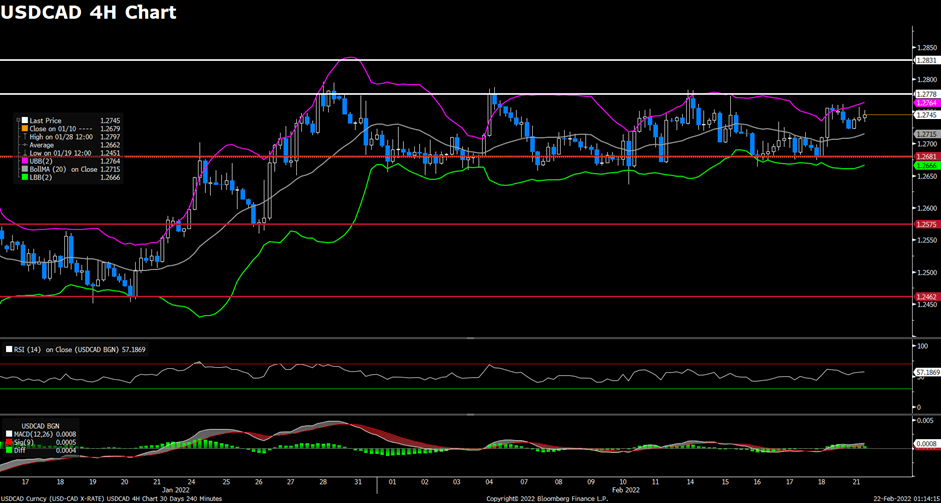
USDCAD (4-Hour Chart)

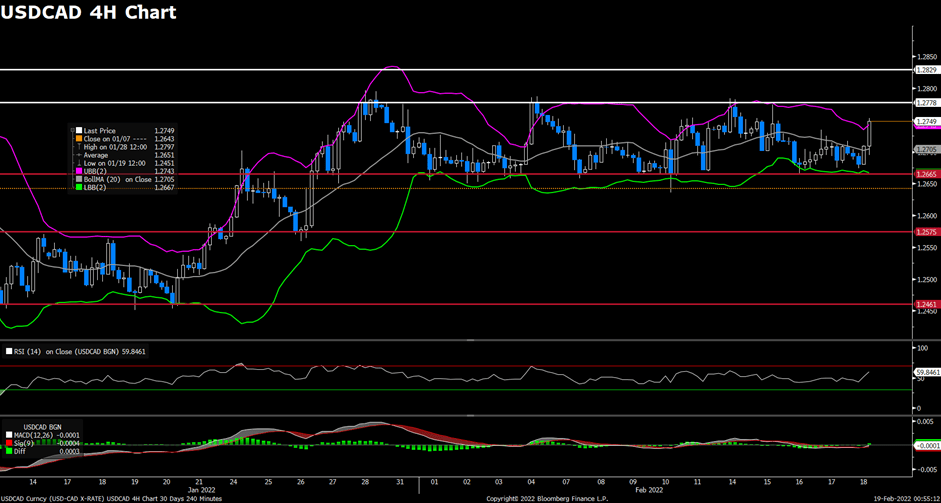
As the market sentiment turned slightly upbeat on Tuesday, the pair USD/CAD witnessed some bearish momentum and failed to extend previous day’s rally amid renewed US dollar weakness. The pair flirted with 1.2750~1.2765 area during Asian session, then started to see fresh selling and refreshed its daily low around 1.2720 level. USD/CAD is trading at 1.2737 at the time of writing, losing 0.13% on a daily basis. Market concerns about the escalating situation in Ukraine had eased after a Kremlin spokesperson said that Russia is still open to diplomacy and has an interest in that. Therefore, the news driving flows away from safe-haven greenback and weighed on USD/CAD pair. However, falling crude oil prices should limit the downside for the pair as WTI retreated to the $91.00 per barrel area. But expectations for a disruption in global oil supply might keep lending support to the black gold.
For technical aspect, RSI indicator 51 figures as of writing, suggesting that upside is gaining some upside strength as the RSI starts to head north. As for the Bollinger Bands, the price bounced back from the moving average, which showed that a trend reversal could be expected. In conclusion, we think market will be bullish as the firmer RSI line keeps buyers hopeful. if the pair manage to conquer the 1.2778 resistance, further upside could be expected.
Resistance: 1.2778, 1.2829
Support: 1.2681, 1.2575, 1.2461
Economic Data:
| Currency | Data | Time (GMT + 8) | Forecast |
| NZD | RBNZ Interest Rate Decision | 09:00 | 1.00% |
| NZD | RBNZ Rate Statement | 09:00 | |
| NZD | RBNZ Press Conference | 10:00 | |
| GBP | Inflation Report Hearings | 17:30 | |
| EUR | CPI (YoY) (Jan) | 18:00 | 5.1% |