Market Focus
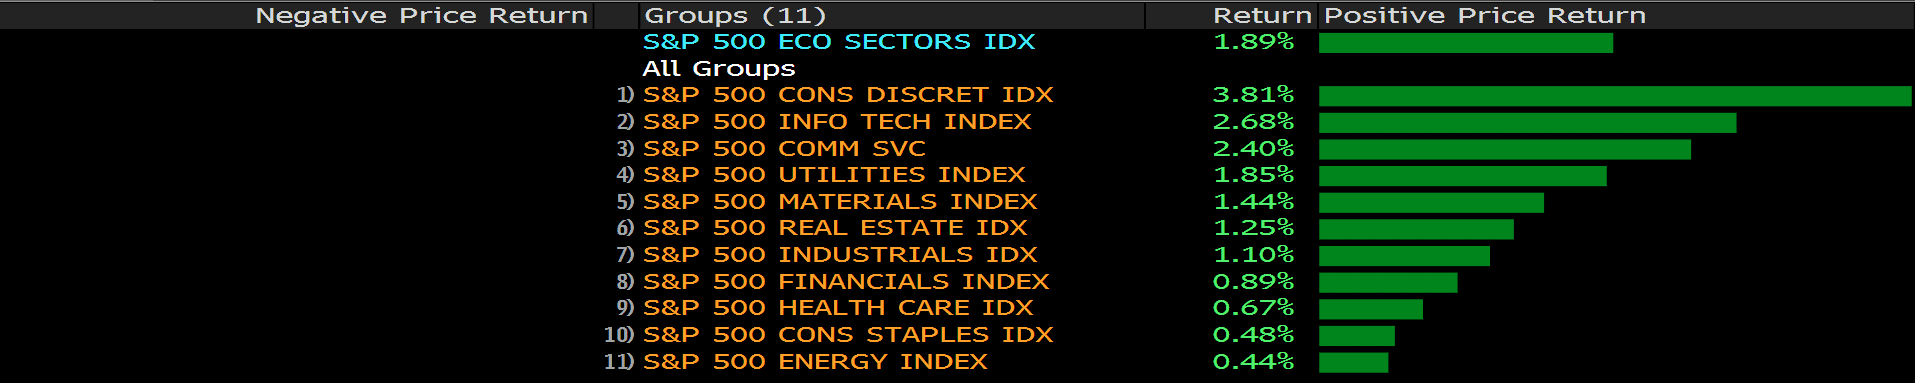
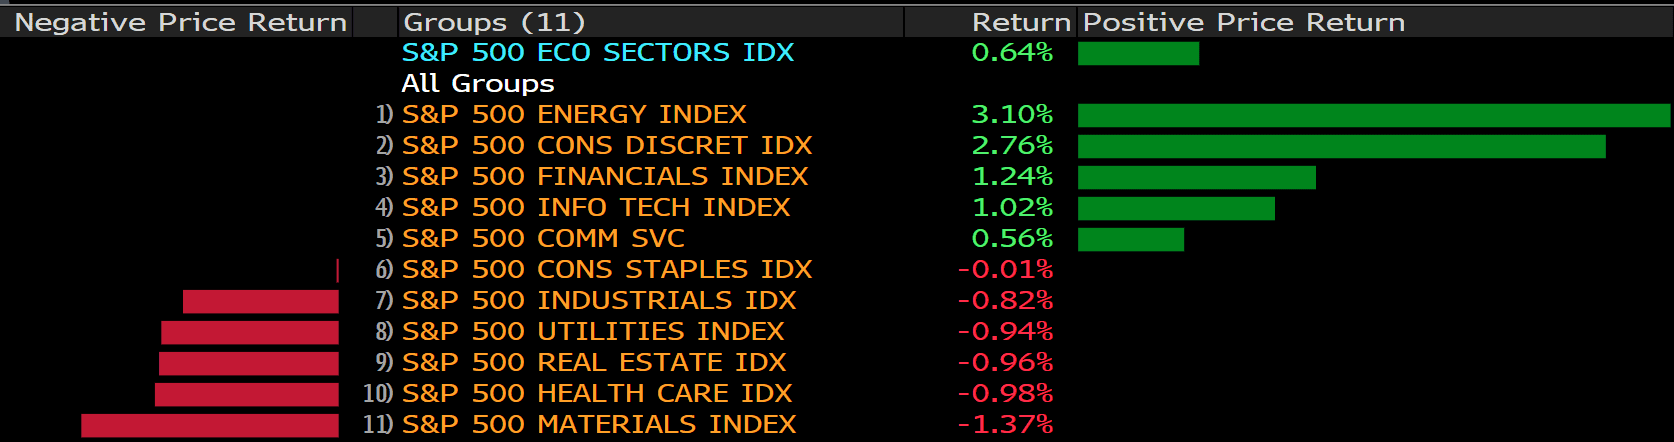
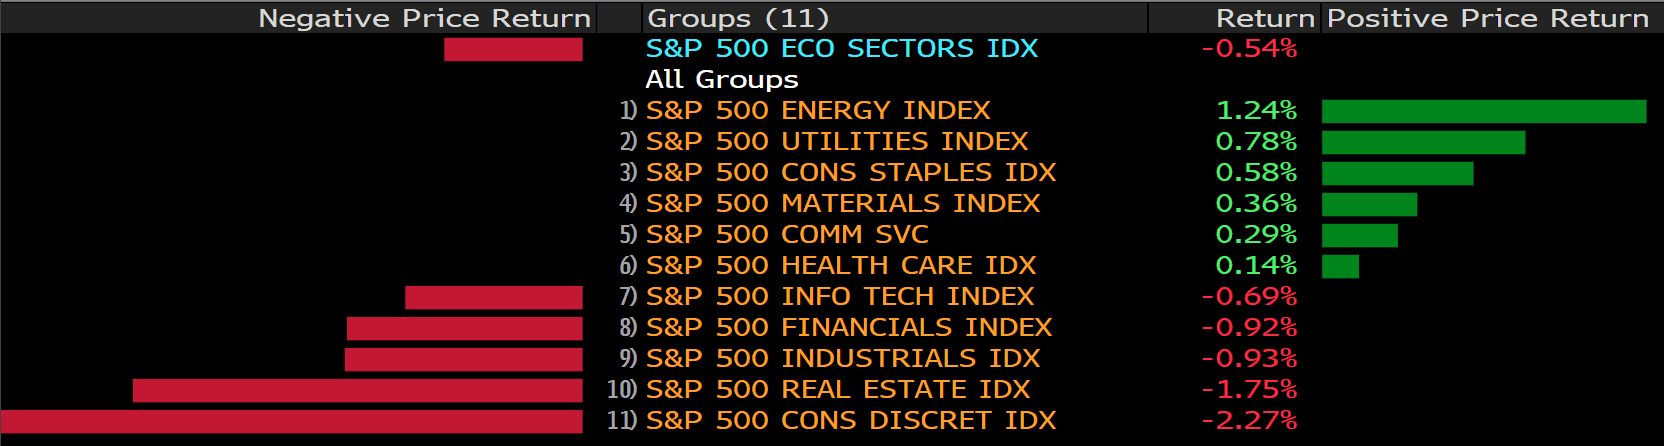
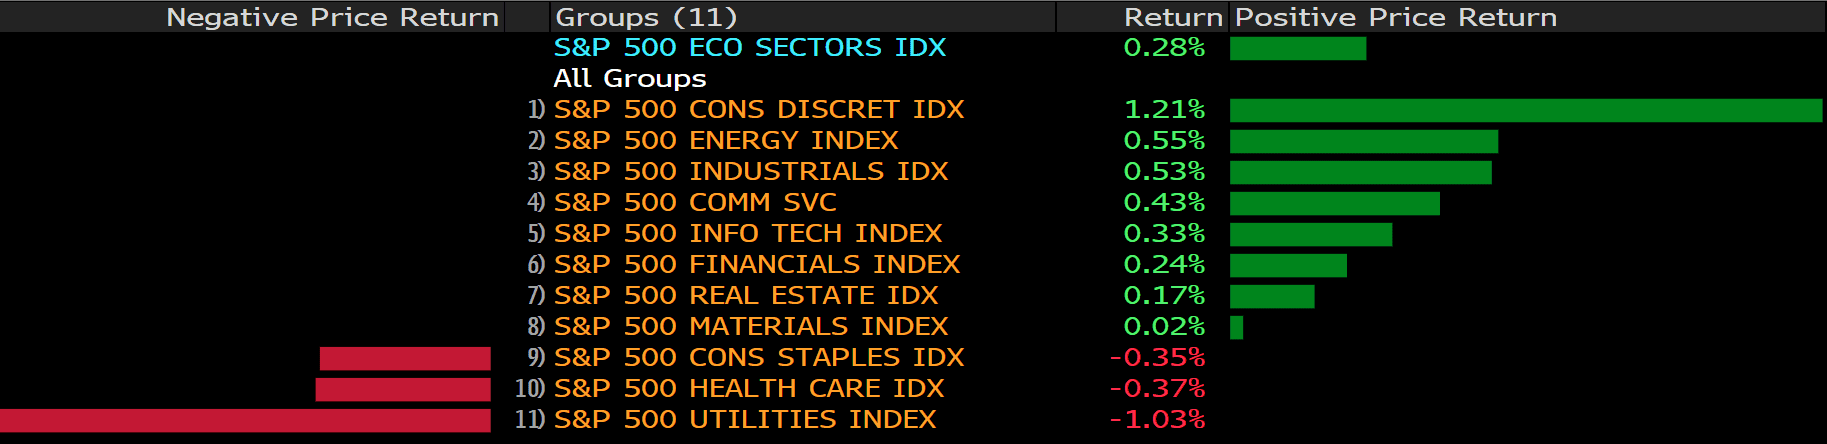
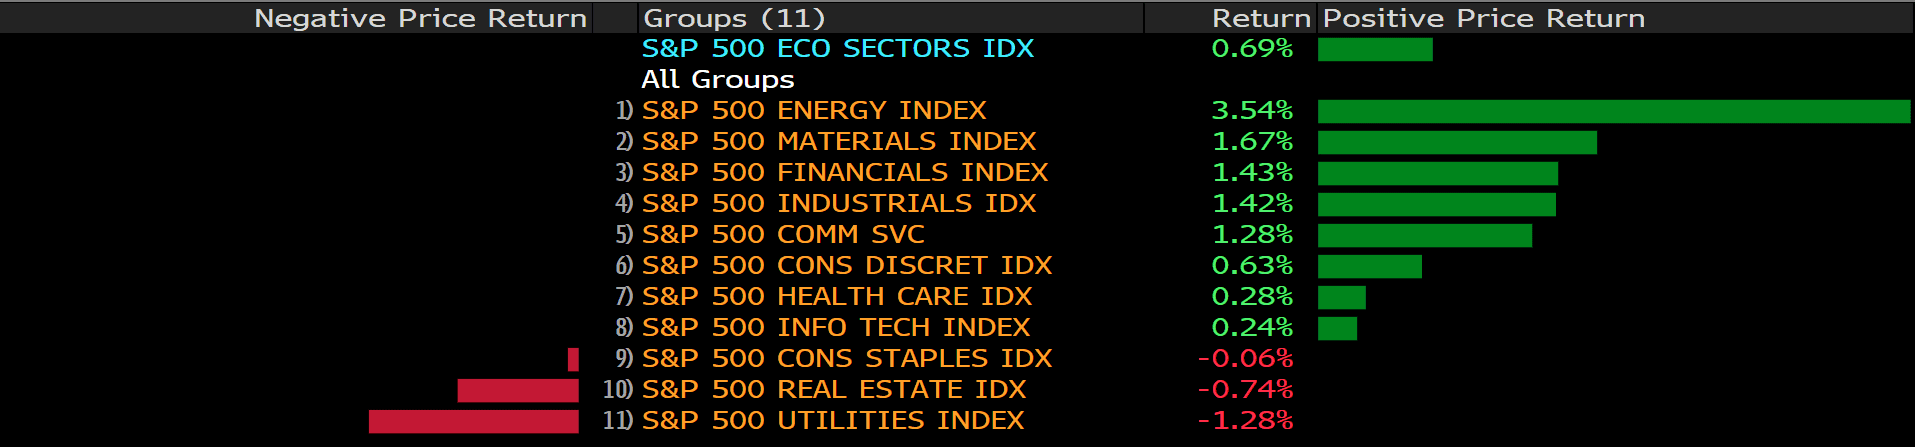
The broad U.S. equity market rallied for the third consecutive trading session. The Dow Jones industrial average rose 0.78% to close at 35,405.24, the S&P 500 climbed 0.69% to close at 4,546.52, and the Nasdaq composite gained 0.75% to close at 14,346. The benchmark U.S. 10 year treasury yield climbed above 1.8% and the 30 year yield sits at 2.117%.
Markets rallied amid strong earnings showings from large technology firms. AMD, who reported a 49% earnings growth, year over year, saw its share price soar more than 10% after the bell. Alphabet also announced better than projected earnings results. The tech giant saw revenue growth of 32% to $75.33 Billion versus the projected $72.17 Billion. During their earnings release, Alphabet also announced a 20 to 1 stock split that will go into effect in July. Shares of Alphabet popped more than 6% during after hours trading.
T-Mobile (TMUS), Facebook (Meta), and Spotify (SPOT) are scheduled to release earnings today after market close.
Main Pairs Movement:
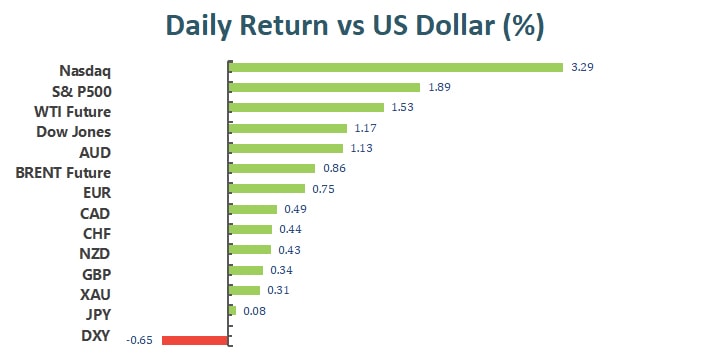
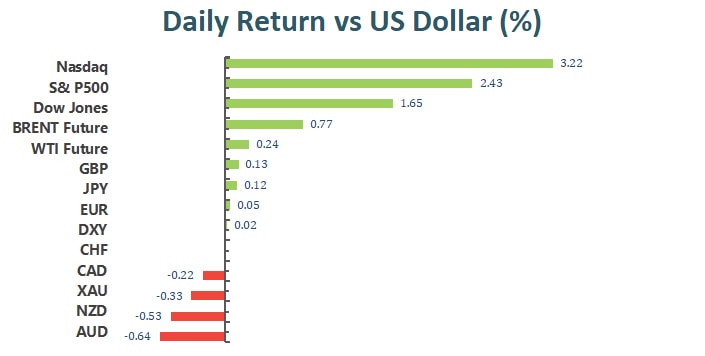
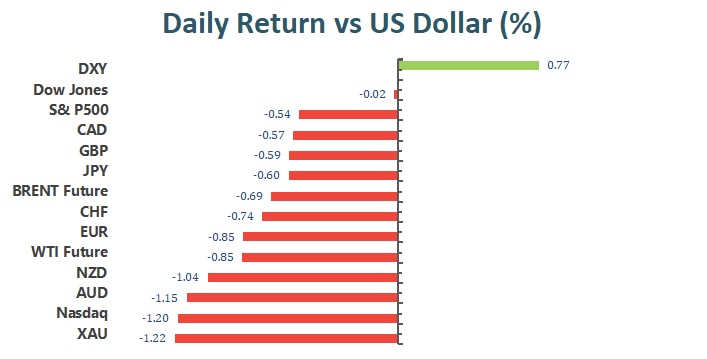
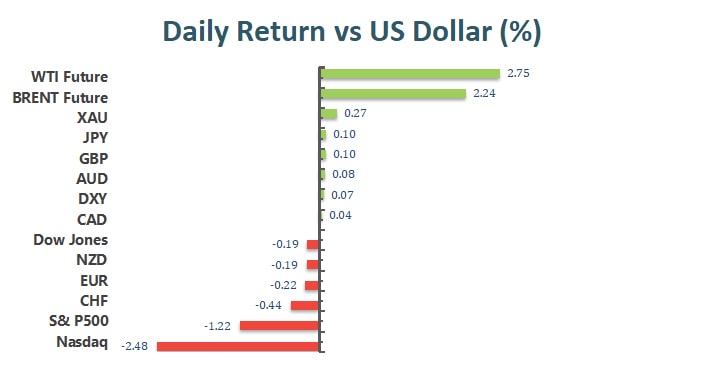
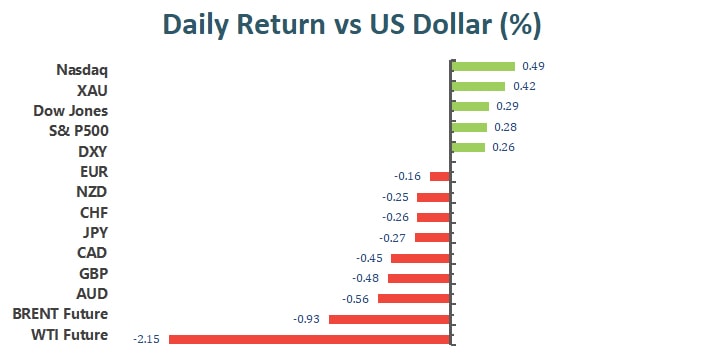
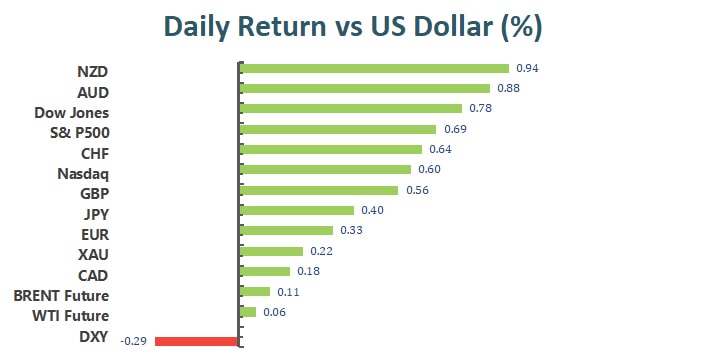
The Dollar Index dropped for the third consecutive day. The benchmark has lost close to 1% since the start of the week. Despite treasury yields edging higher, the Greenback remained weak compared to a basket of other major foreign currencies.
The Euro-Dollar pair gained 0.33% over the course of yesterday’s trading. The Eurozone’s CPI will be release later today and could provide ample price action for EURUSD.
The British Pound gained 0.57% against the Greenback over the course of yesterday’s trading. Expectations of a second rate hike by the BoE has strengthened market participants’ demand for the Sterling.
Gold advanced 0.21% over the Doller during yesterday’s trading; however, the precious metal is finding a lack of momentum in its recovery from last week’s steep selloff. An increasing optimistic outlook for U.S. equities is not helping Gold’s recovery to last week’s highs.
Technical Analysis:
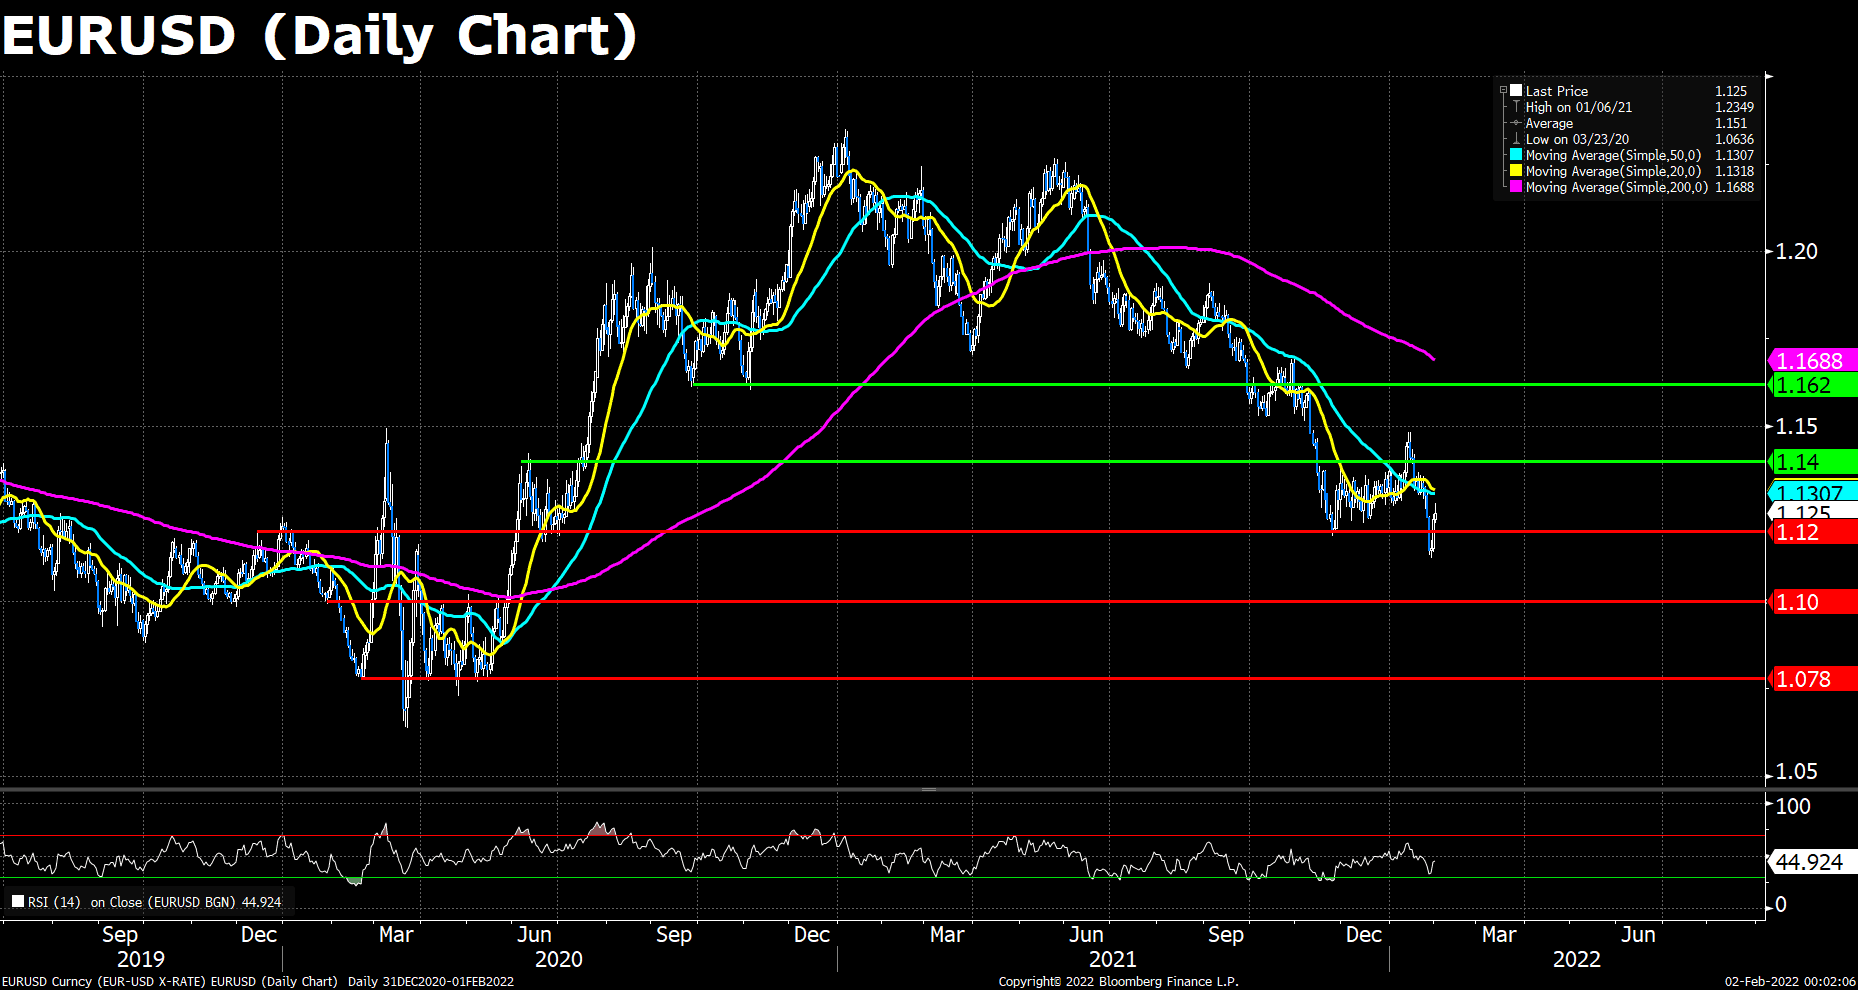
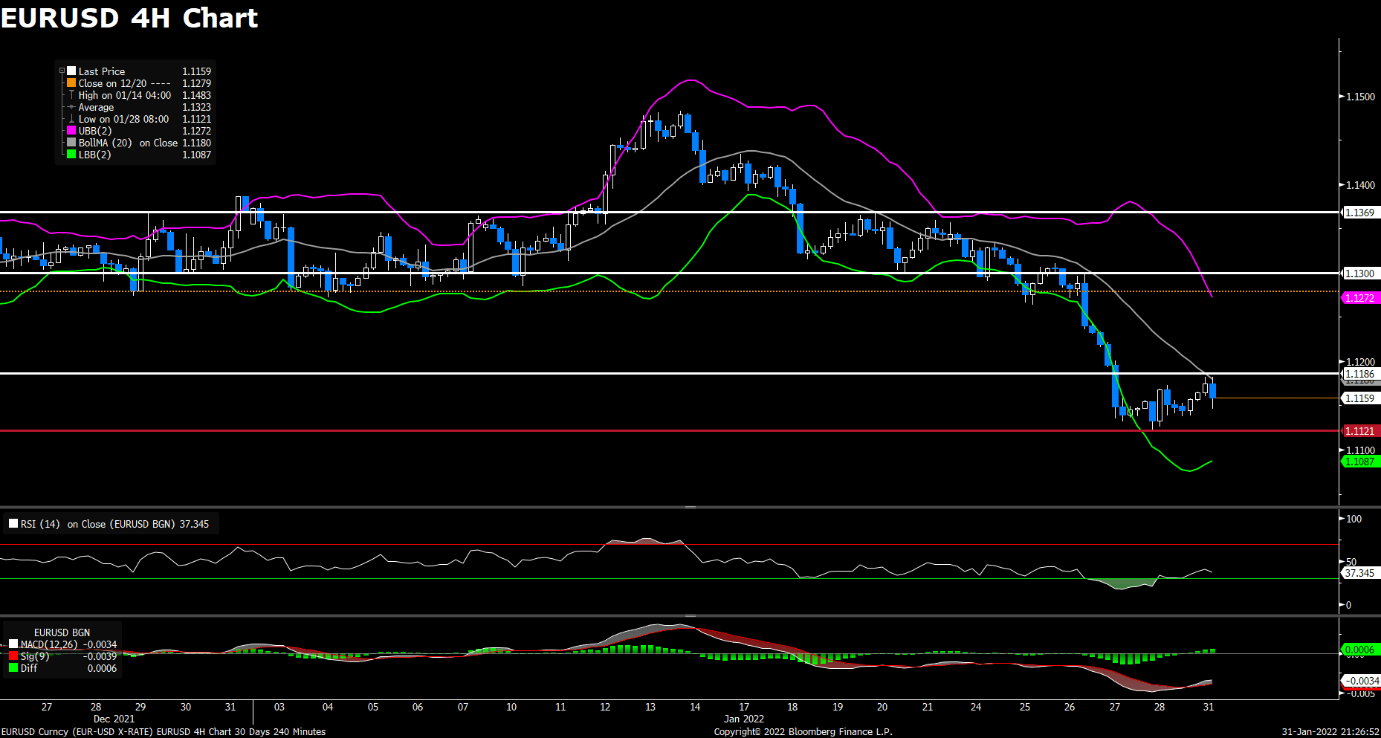
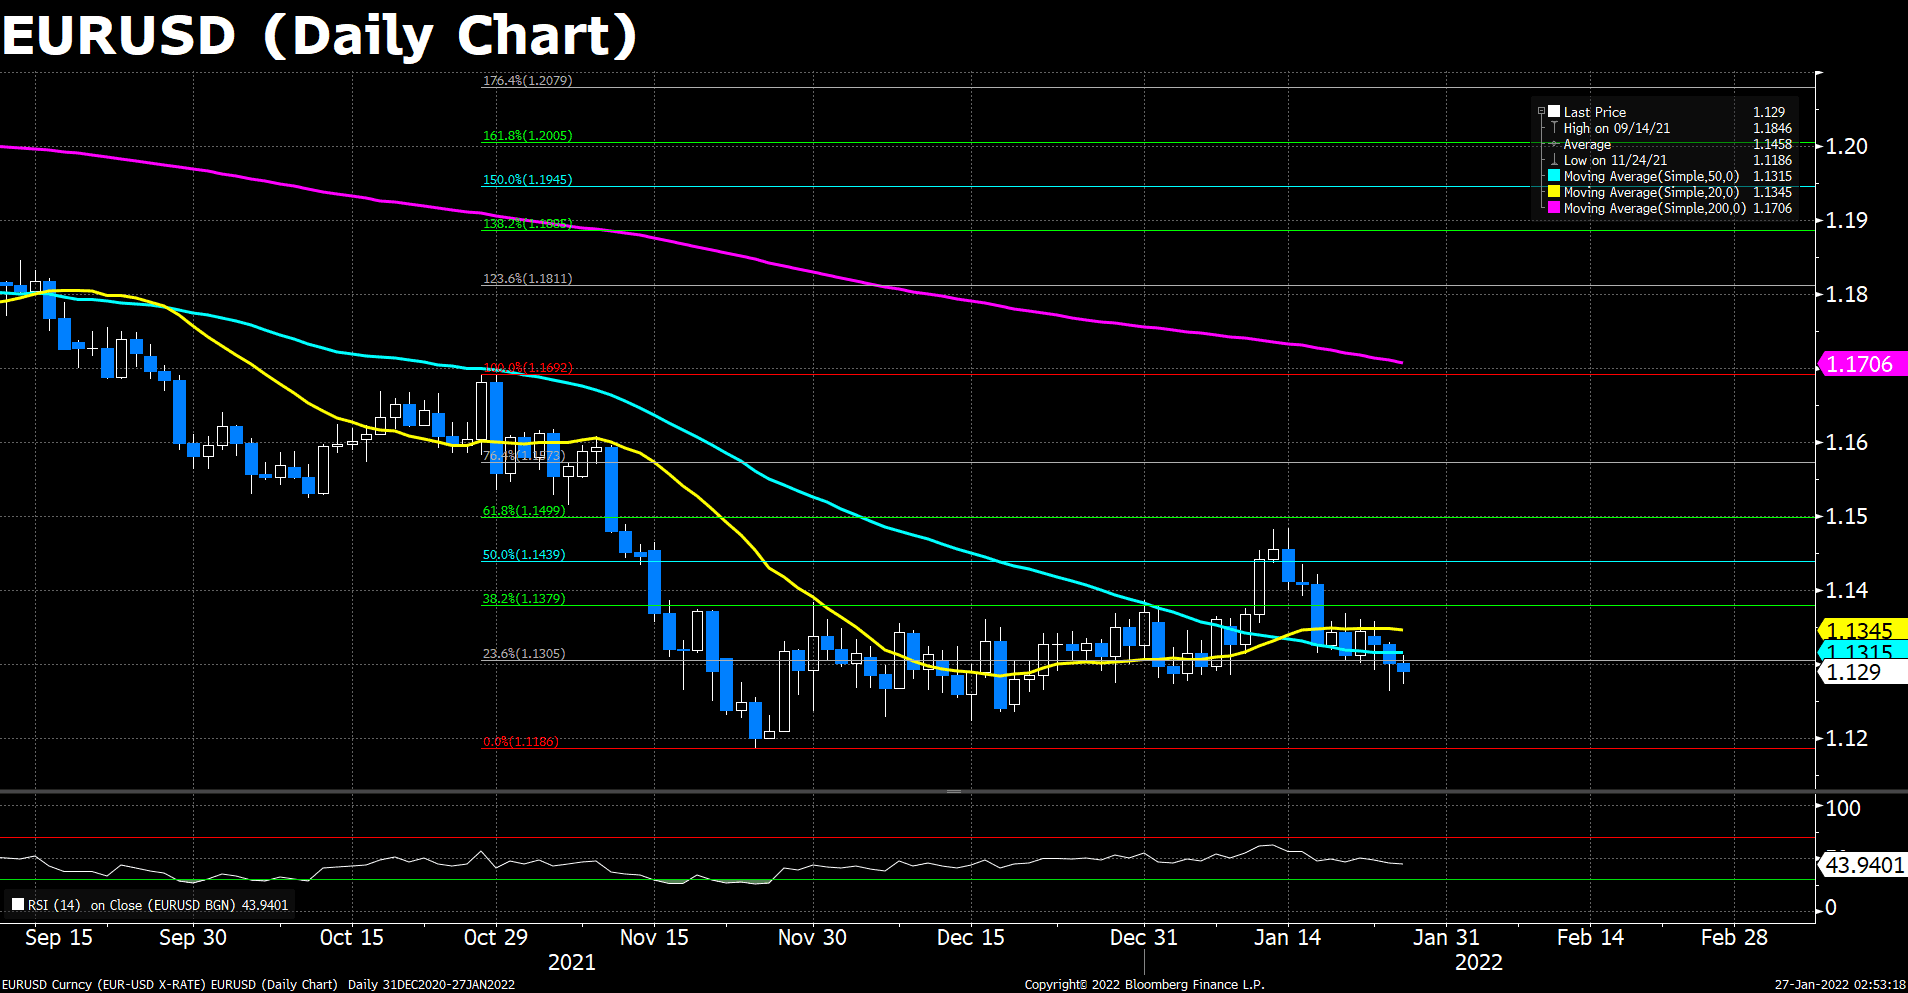
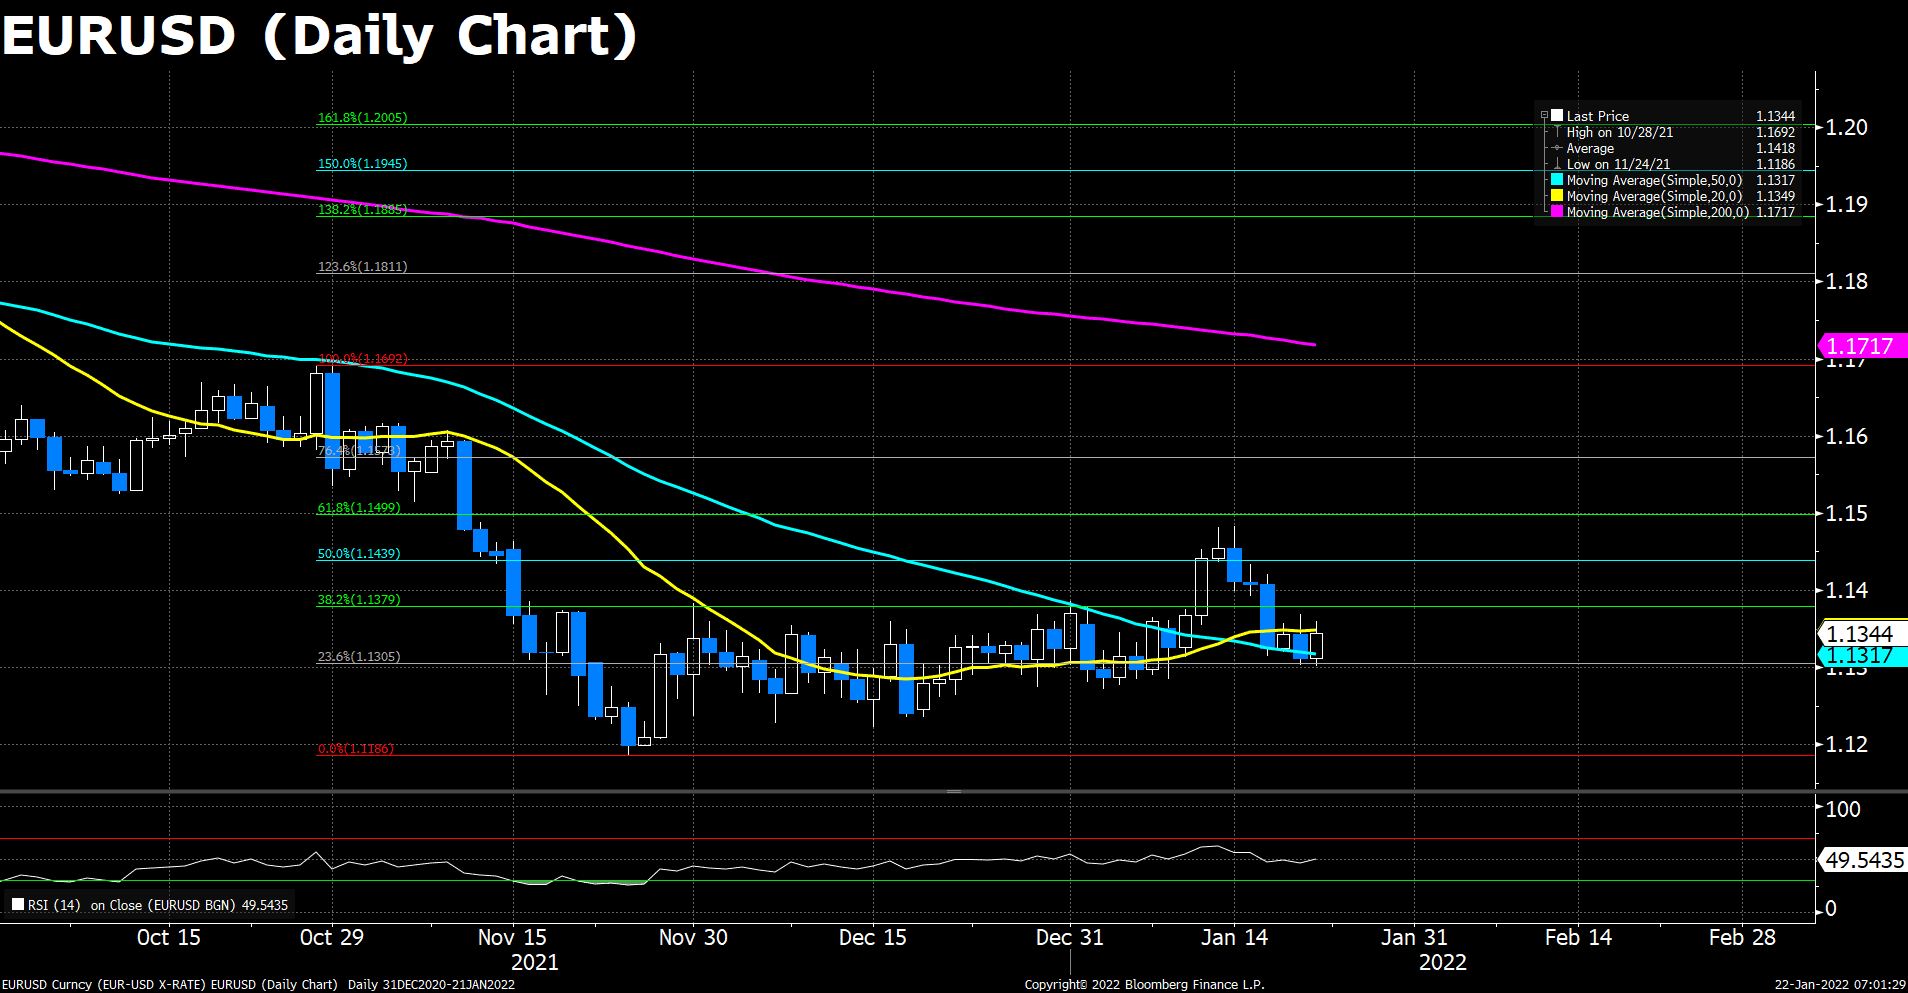
The EUR/USD pair continued to rise on Tuesday, extending its rebound from a yearly low pinned on Friday. The pair started its upside movements during the Asian session, further boosted and hit a daily high near 1.128 level in mid-European session. The pair was last seen trading at 1.1262, posting a 0.28% gain since the beginning of the day. The demand of the shared currency remains robust in the second trading day of the week amid broader dollar weakness, as optimism on big tech’s financial results helped boost the stock market sentiments, which is in favor of the risk-sensitive EUR. However, the dovish ECB monetary policies is still weighing on the Euro pair, we should look carefully on both EU and US central banks’ announcement to see if the rate discrepancies between their currencies will stretch further.
For technical aspect, the RSI for the pair reads 44.92 as of writing, and the price actions remain below all the major moving averages, suggesting bear movement ahead. To the upside, if the pair could close above its 20 and 50 DMAs, then it is expected to knock on its next resistance 1.1400. On the contrary, if the pair fails to cling on the 1.1200 threshold, then a sharp decline to its yearly low is anticipated.
Resistance: 1.1200, 1.1400, 1.1620
Support: 1.1000, 1.0780
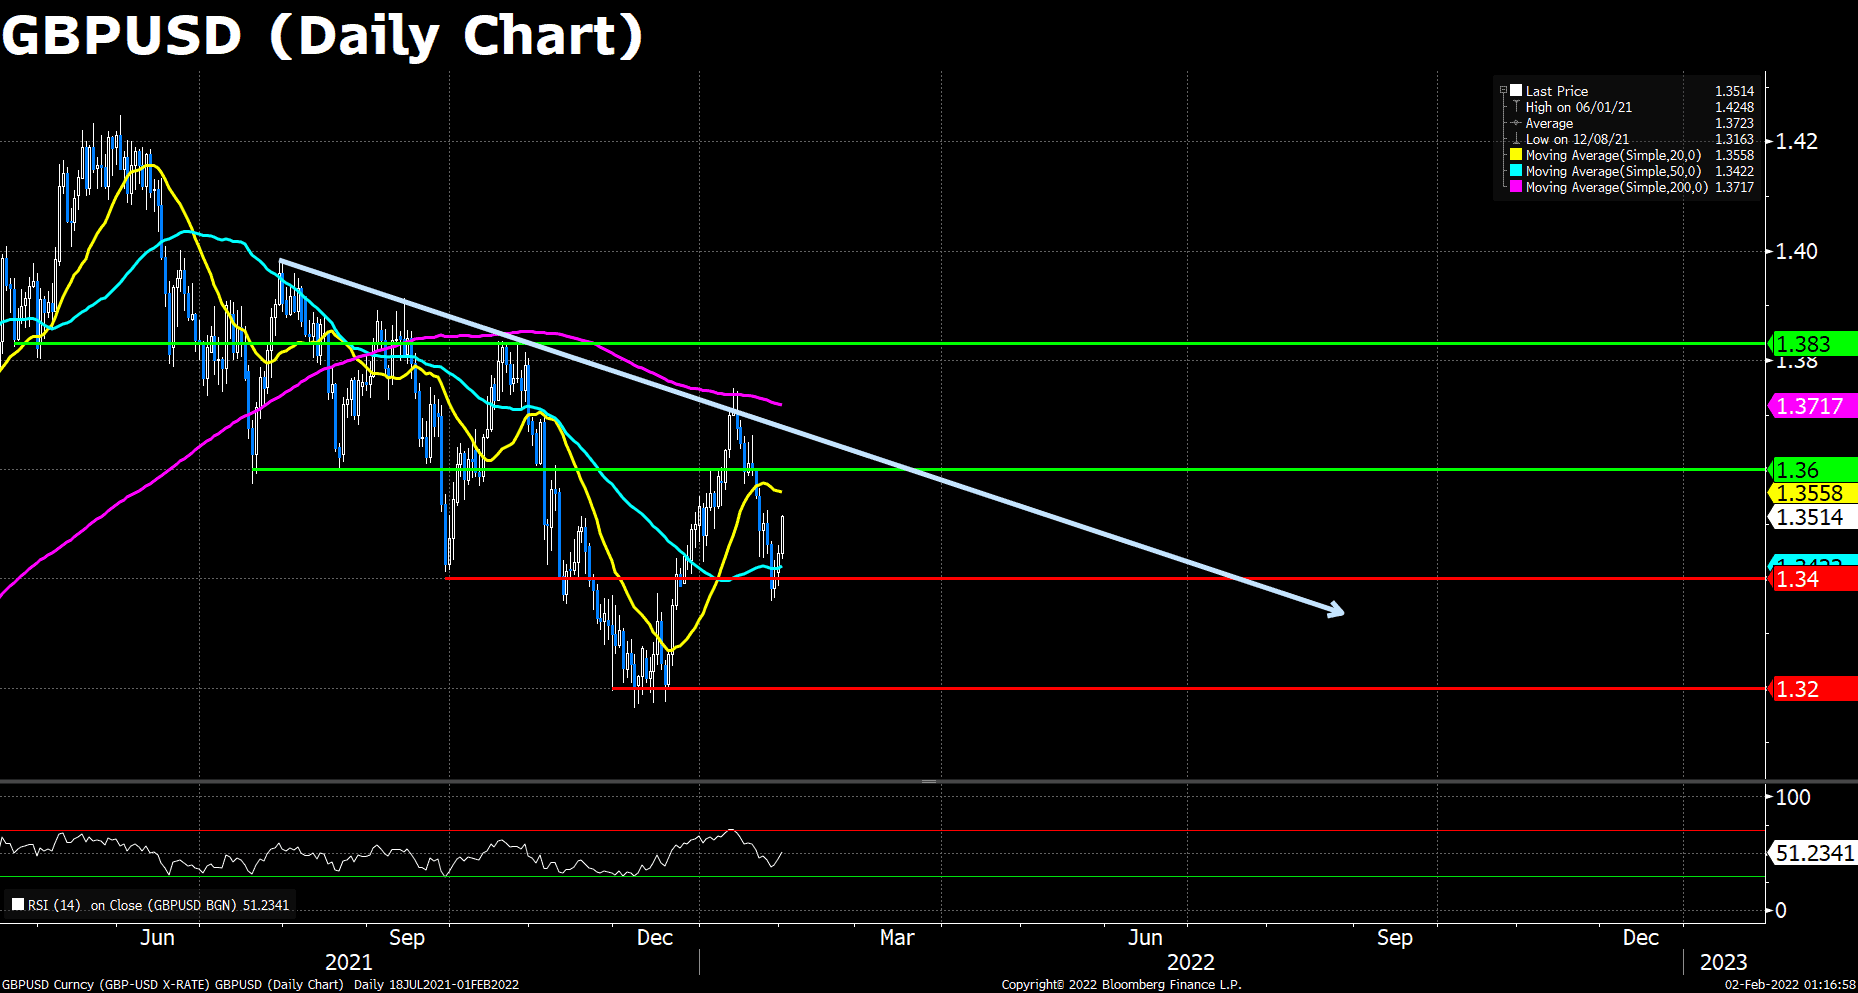
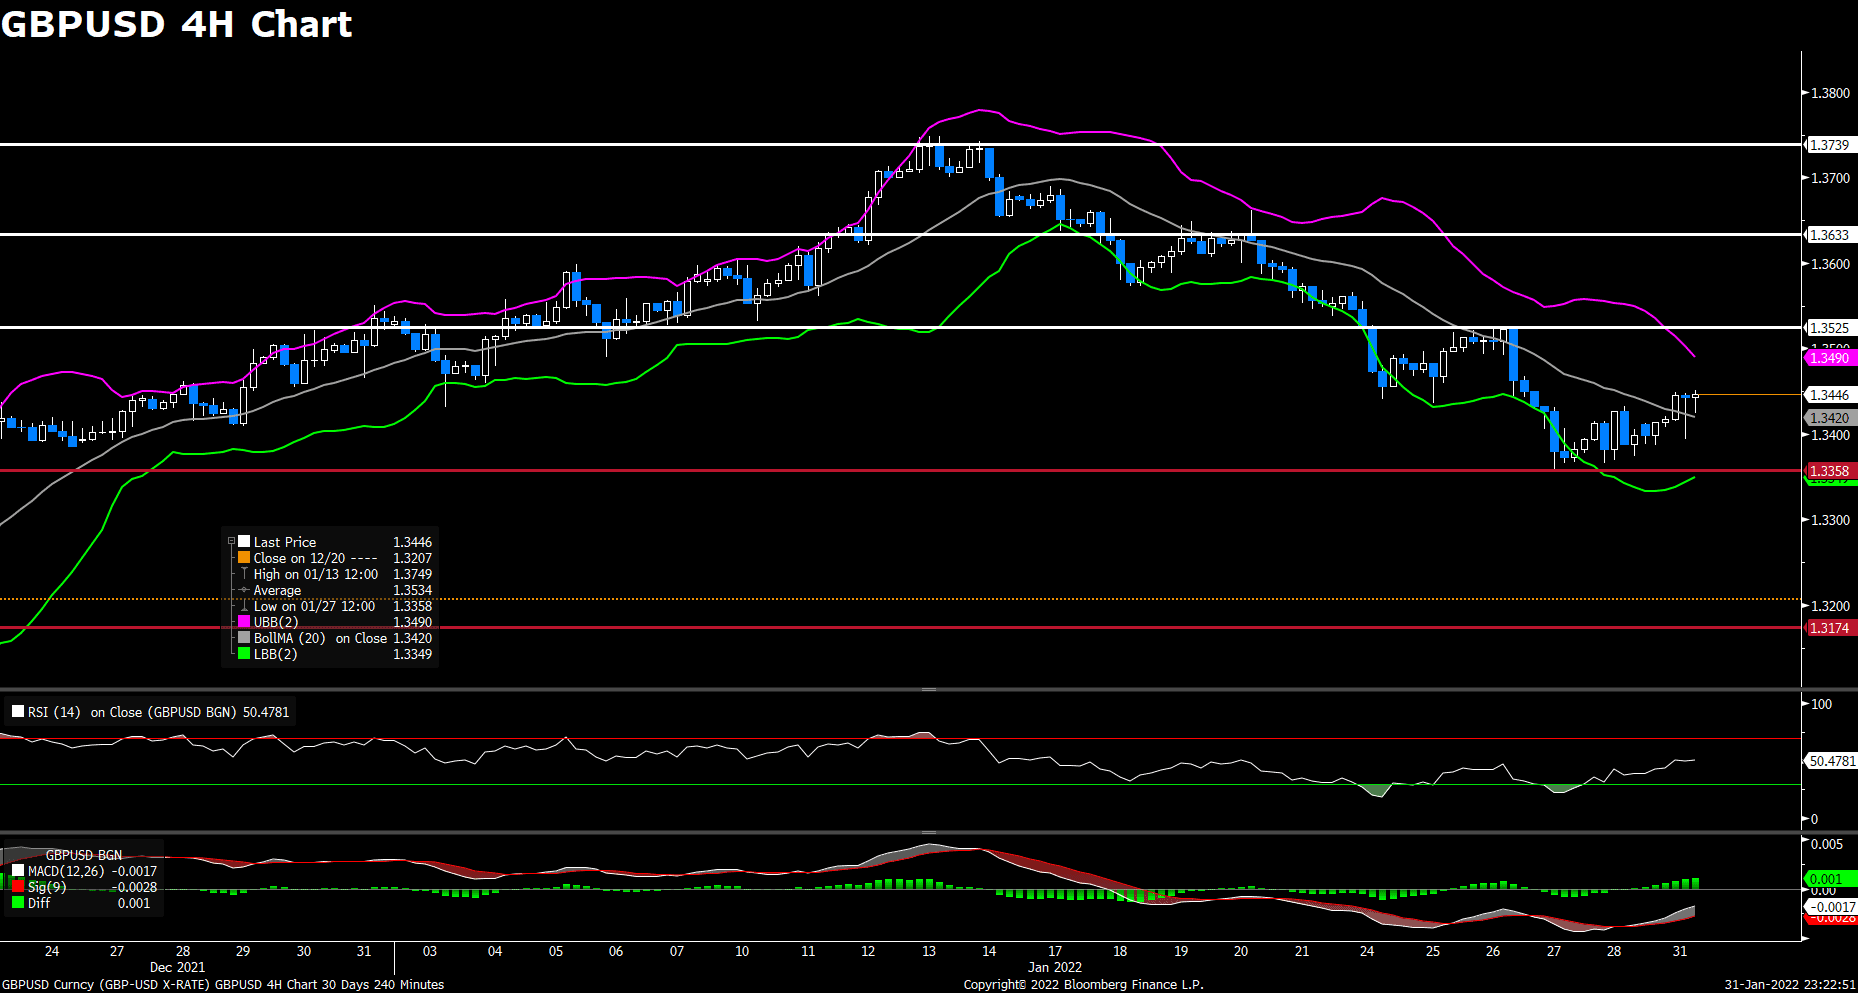
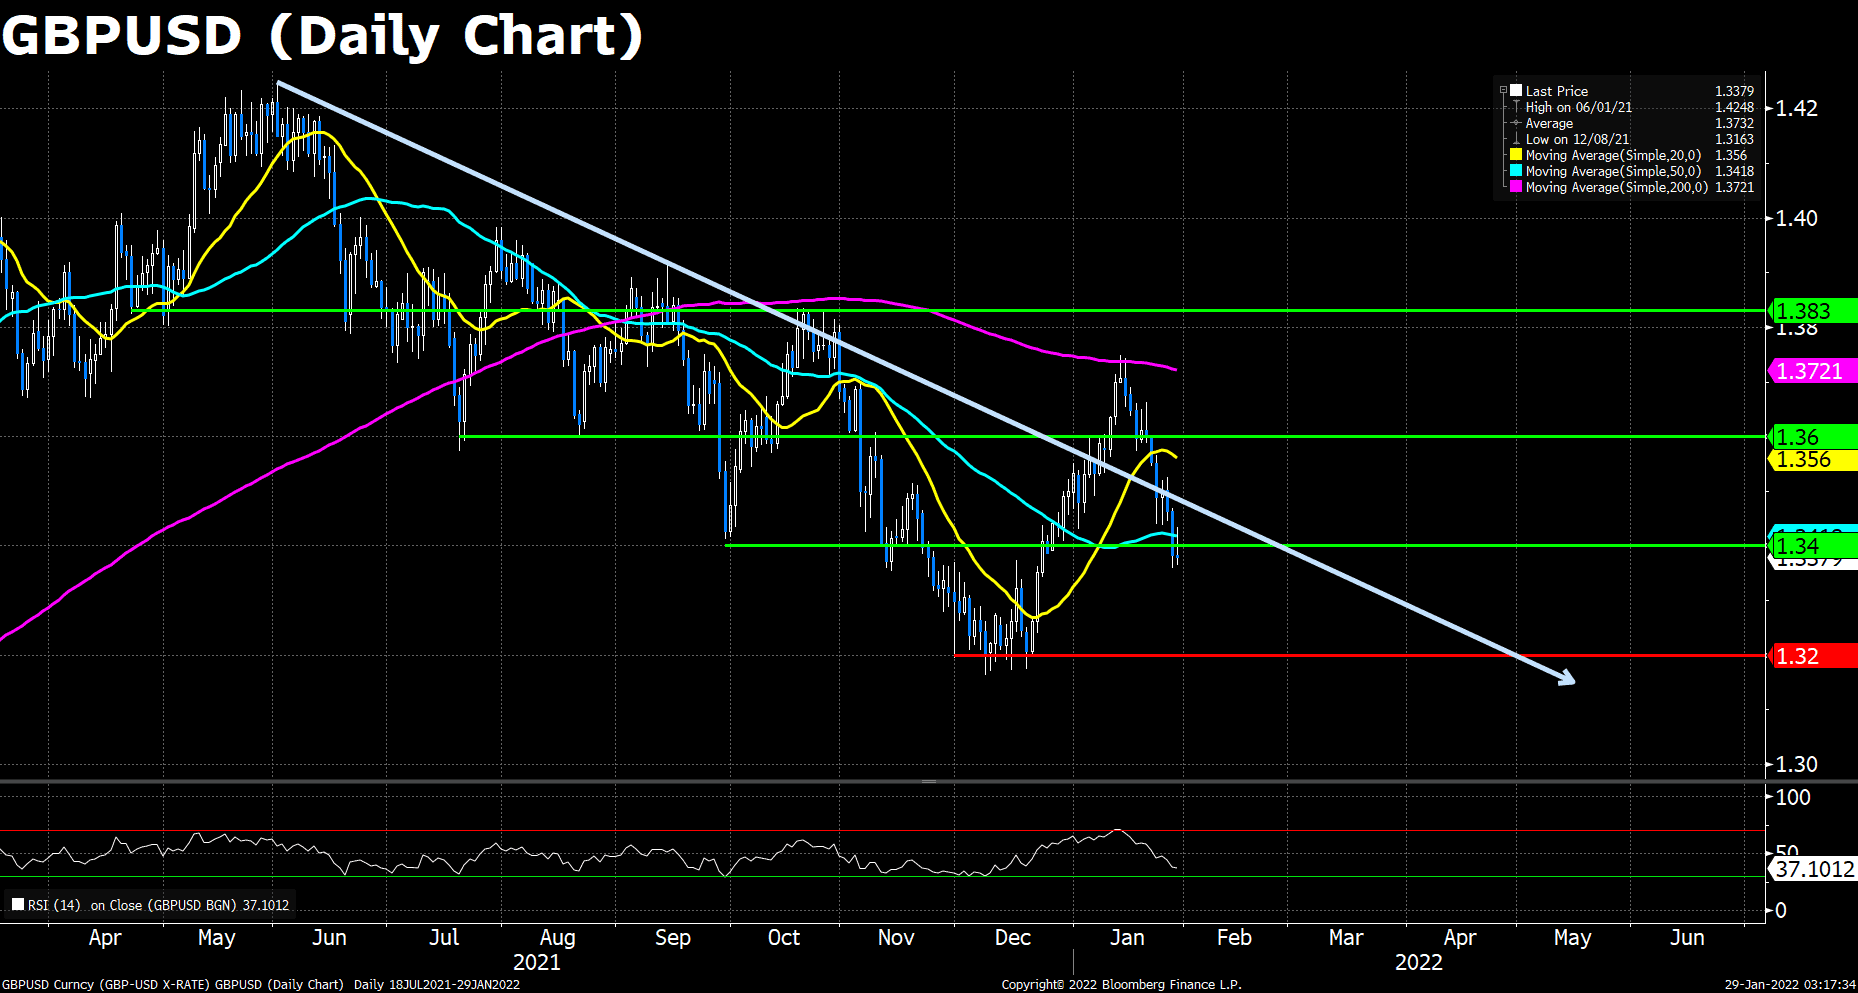
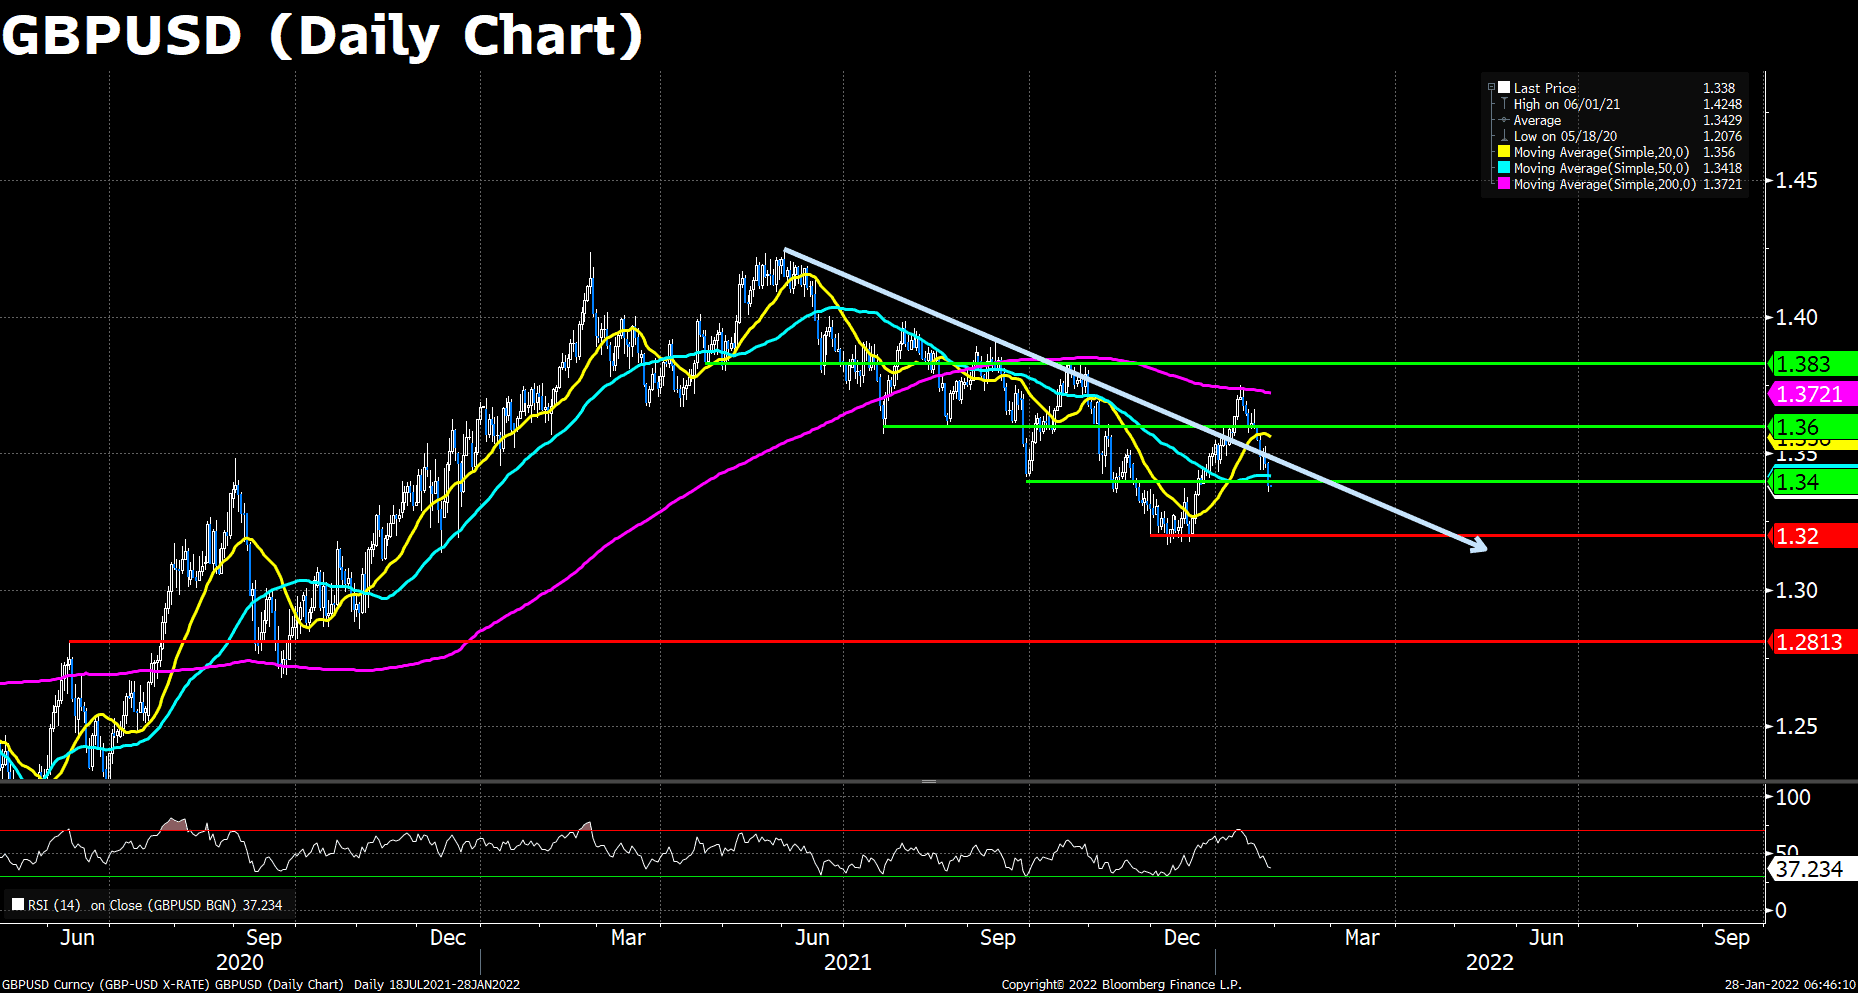
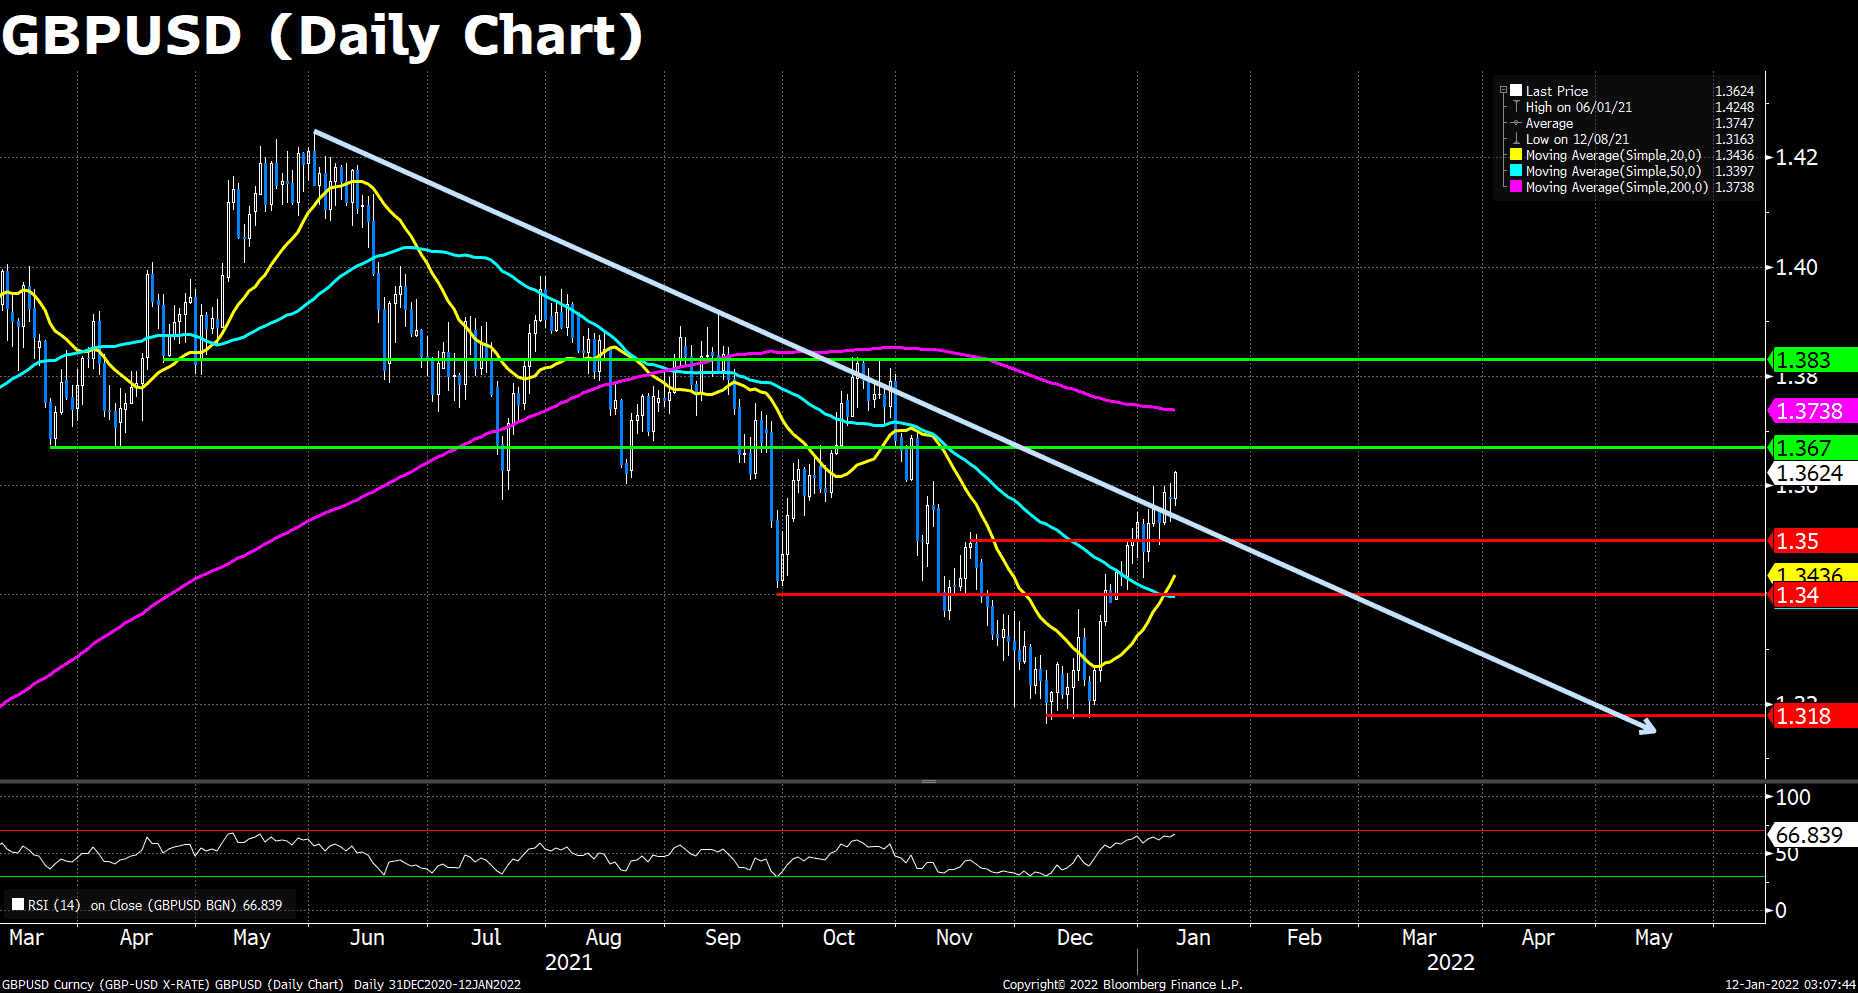
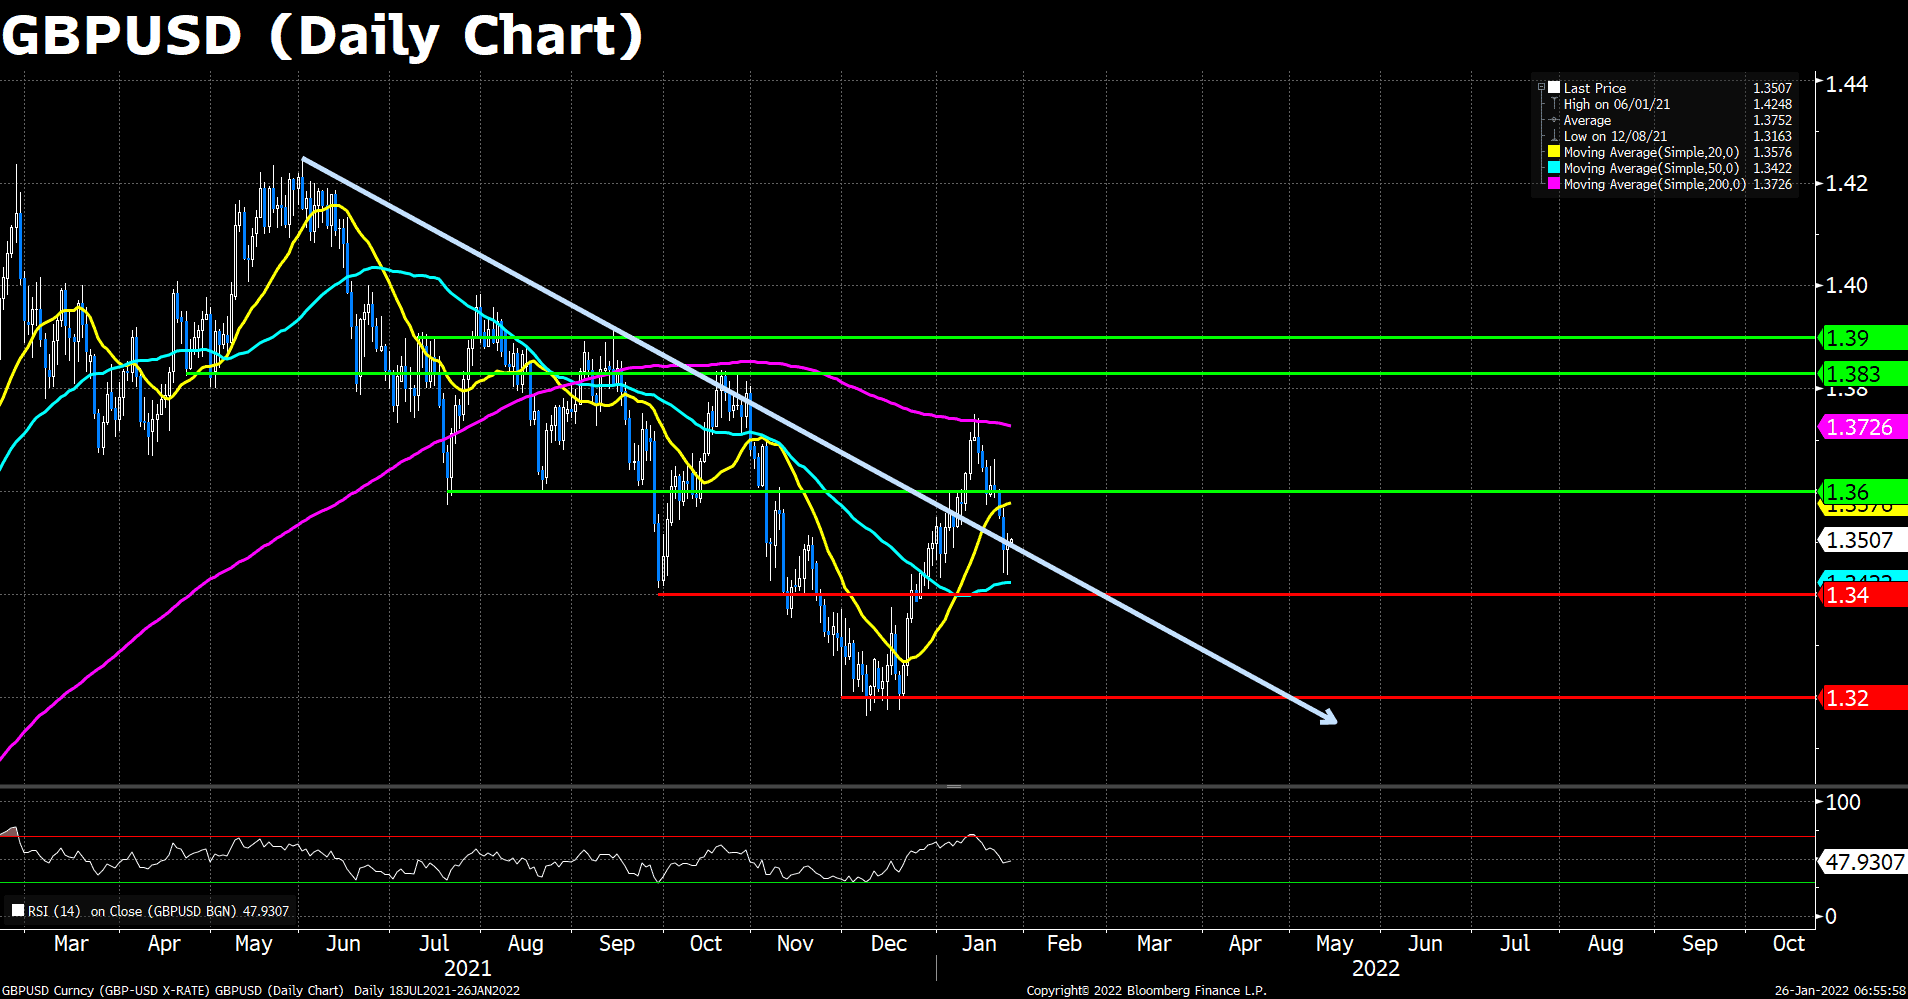
After ending January with losses of 0.66%, the British pound snaps the losing streak, climbing for 3 days and gaining over 1%. At the time of writing, the GBP/USD is trading at 1.3514, approaching the 20 DMA lying at 1.3558. As the January ISM Manufacturing figures turn out green, the US equity opens low but soon jumped back to positive an hour after, which is in favor of the risk-sensitive GBP. Unlike the ECB, Bank of England is more hawkish when it comes to the monetary decisions, thus the investors are more faithful to the British pound than to the Euro.
On the technical front, the RSI for Cable reads 51.23 as of writing, as the bulls and bears are playing tug of war at this crucial 1.3500 psychological resistance/support. The pair now trades above its 50 DMA, but still down around 40 pips to the 20-day one. To the north, Cable is going to face the heavy 1.3600 resistance, followed by the long-tern downtrend, and then the 200 DMA currently at 1.3717; in cases to the south, the pair is underpinned by the year-to-date lows around 1.3400, followed by the December lows around 1.3200.
Resistance: 1.3600, 1.3717, 1.3830
Support: 1.3400, 1.3200
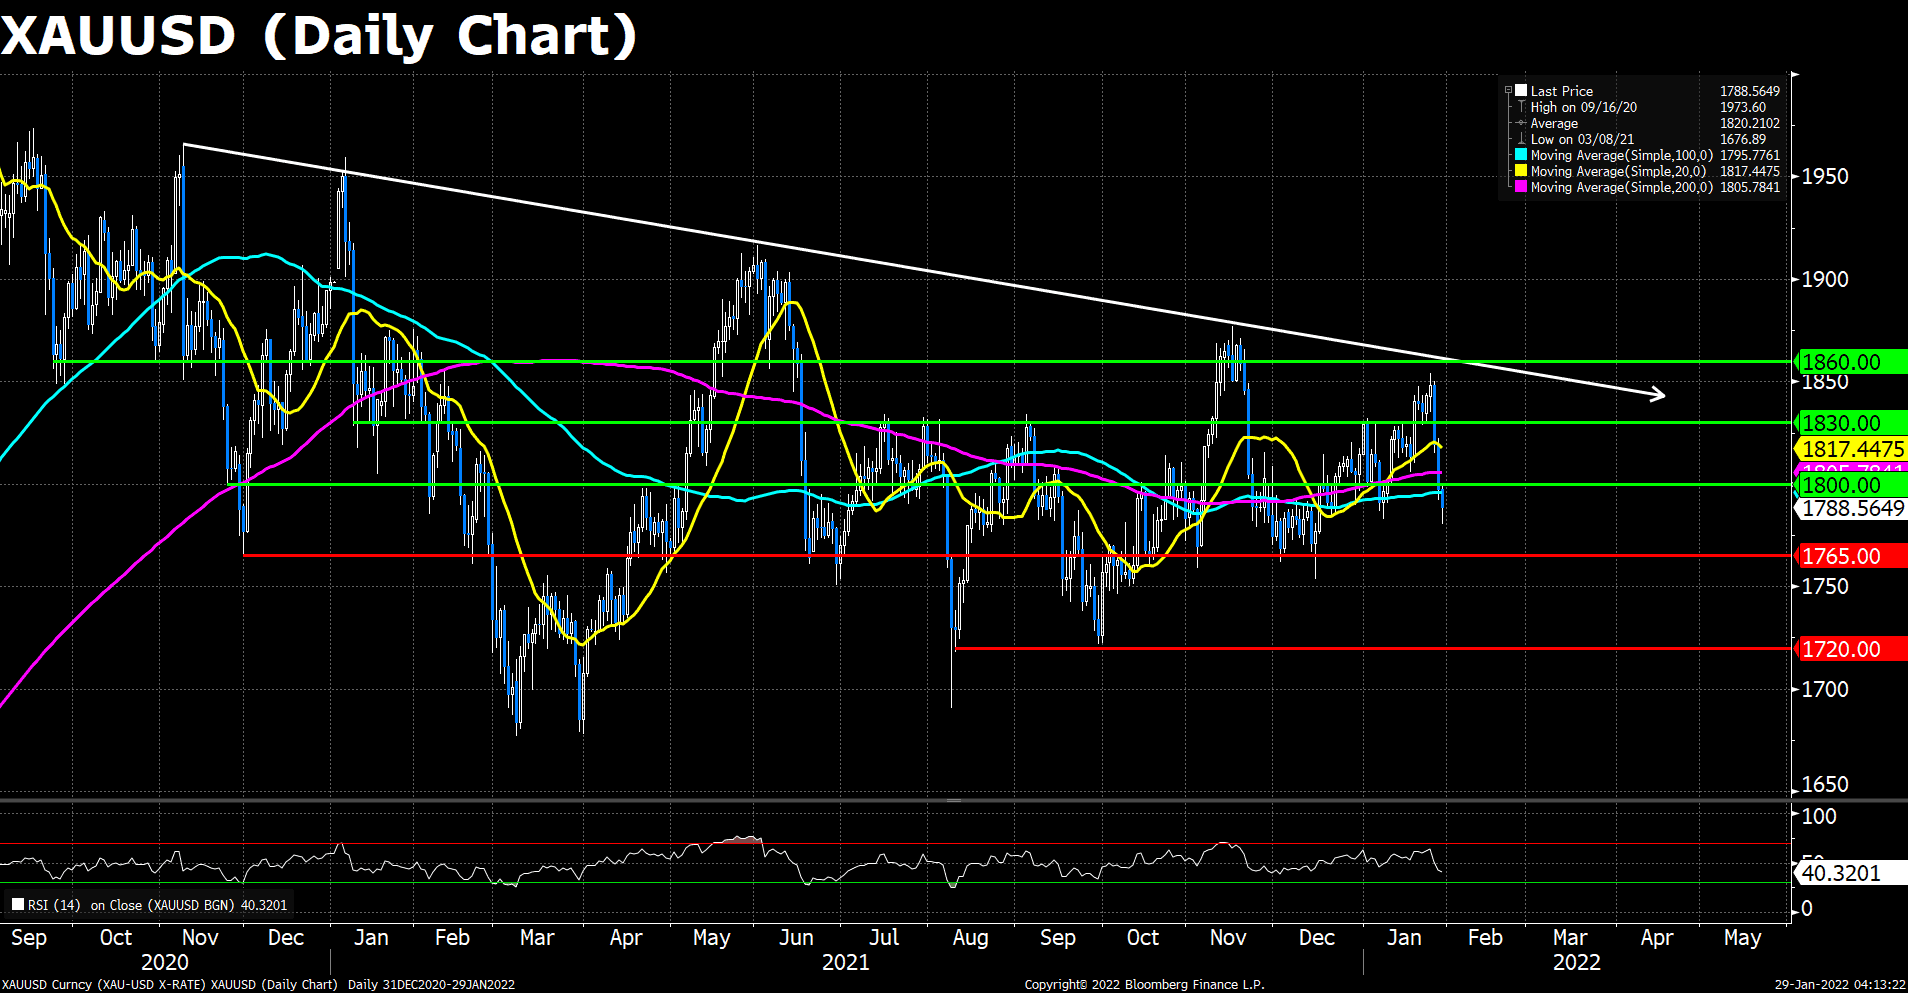
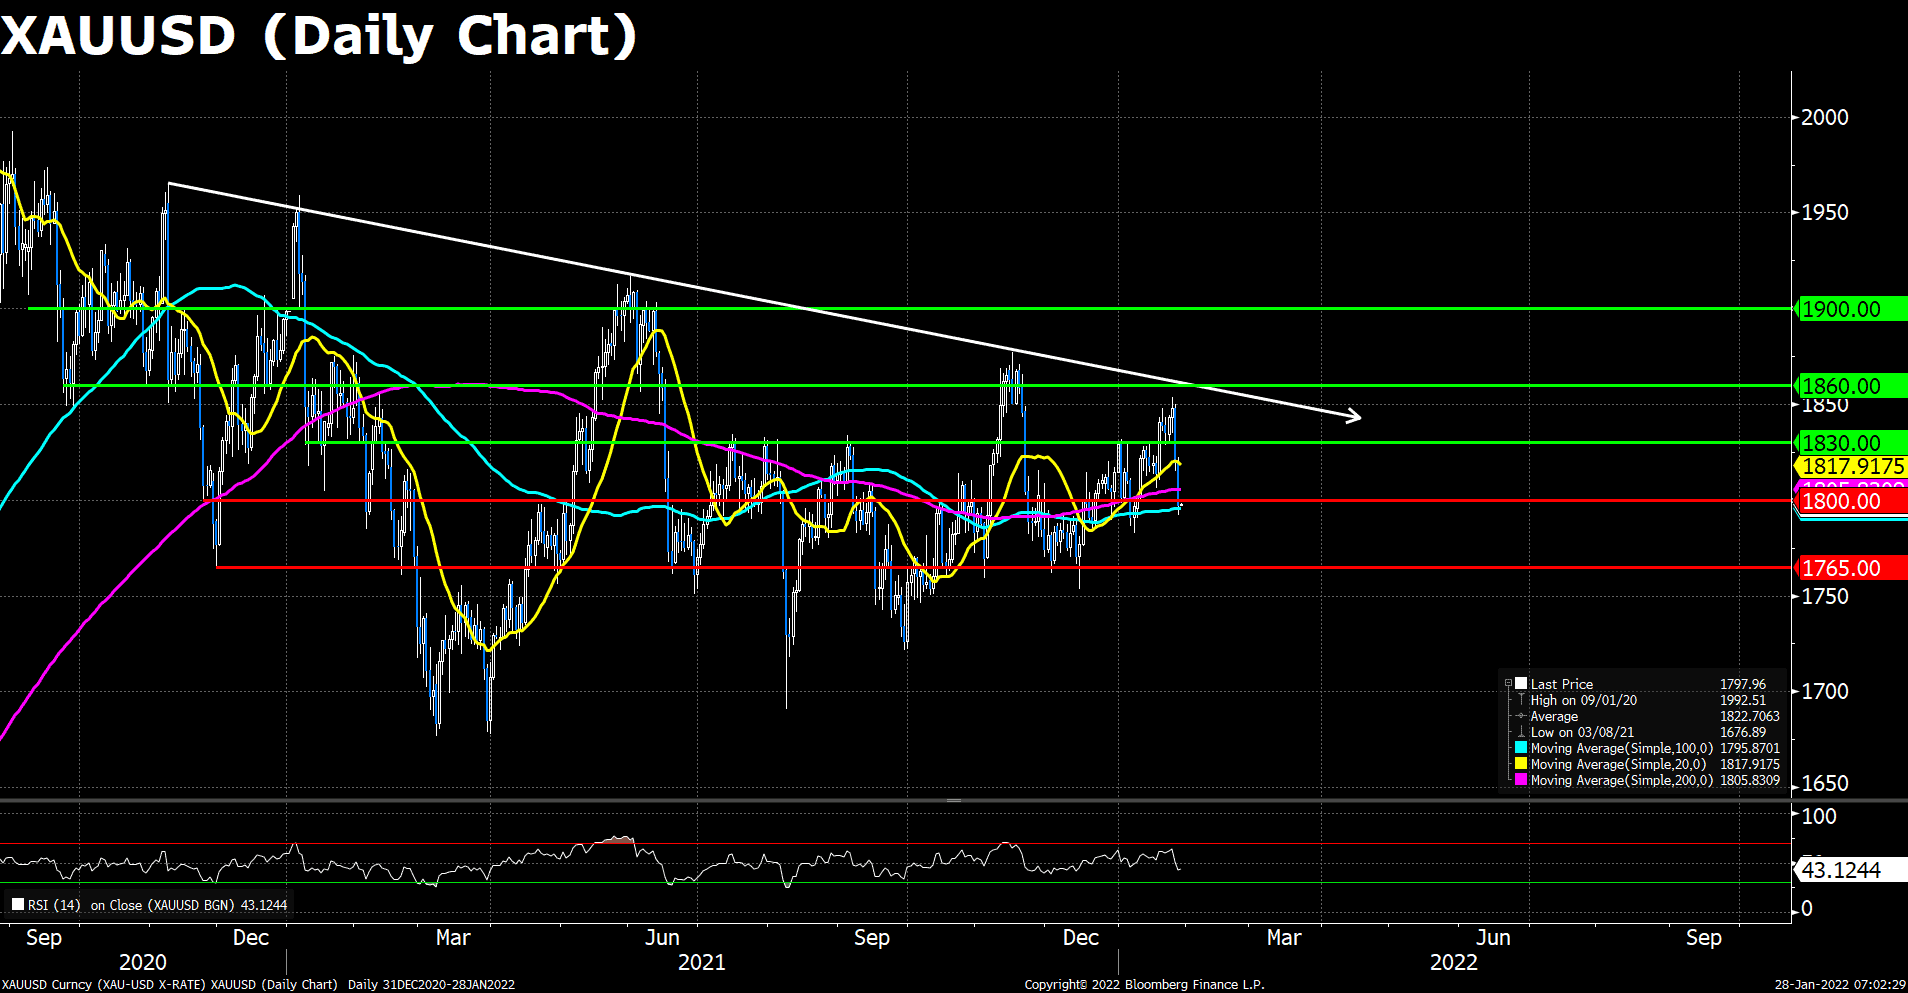
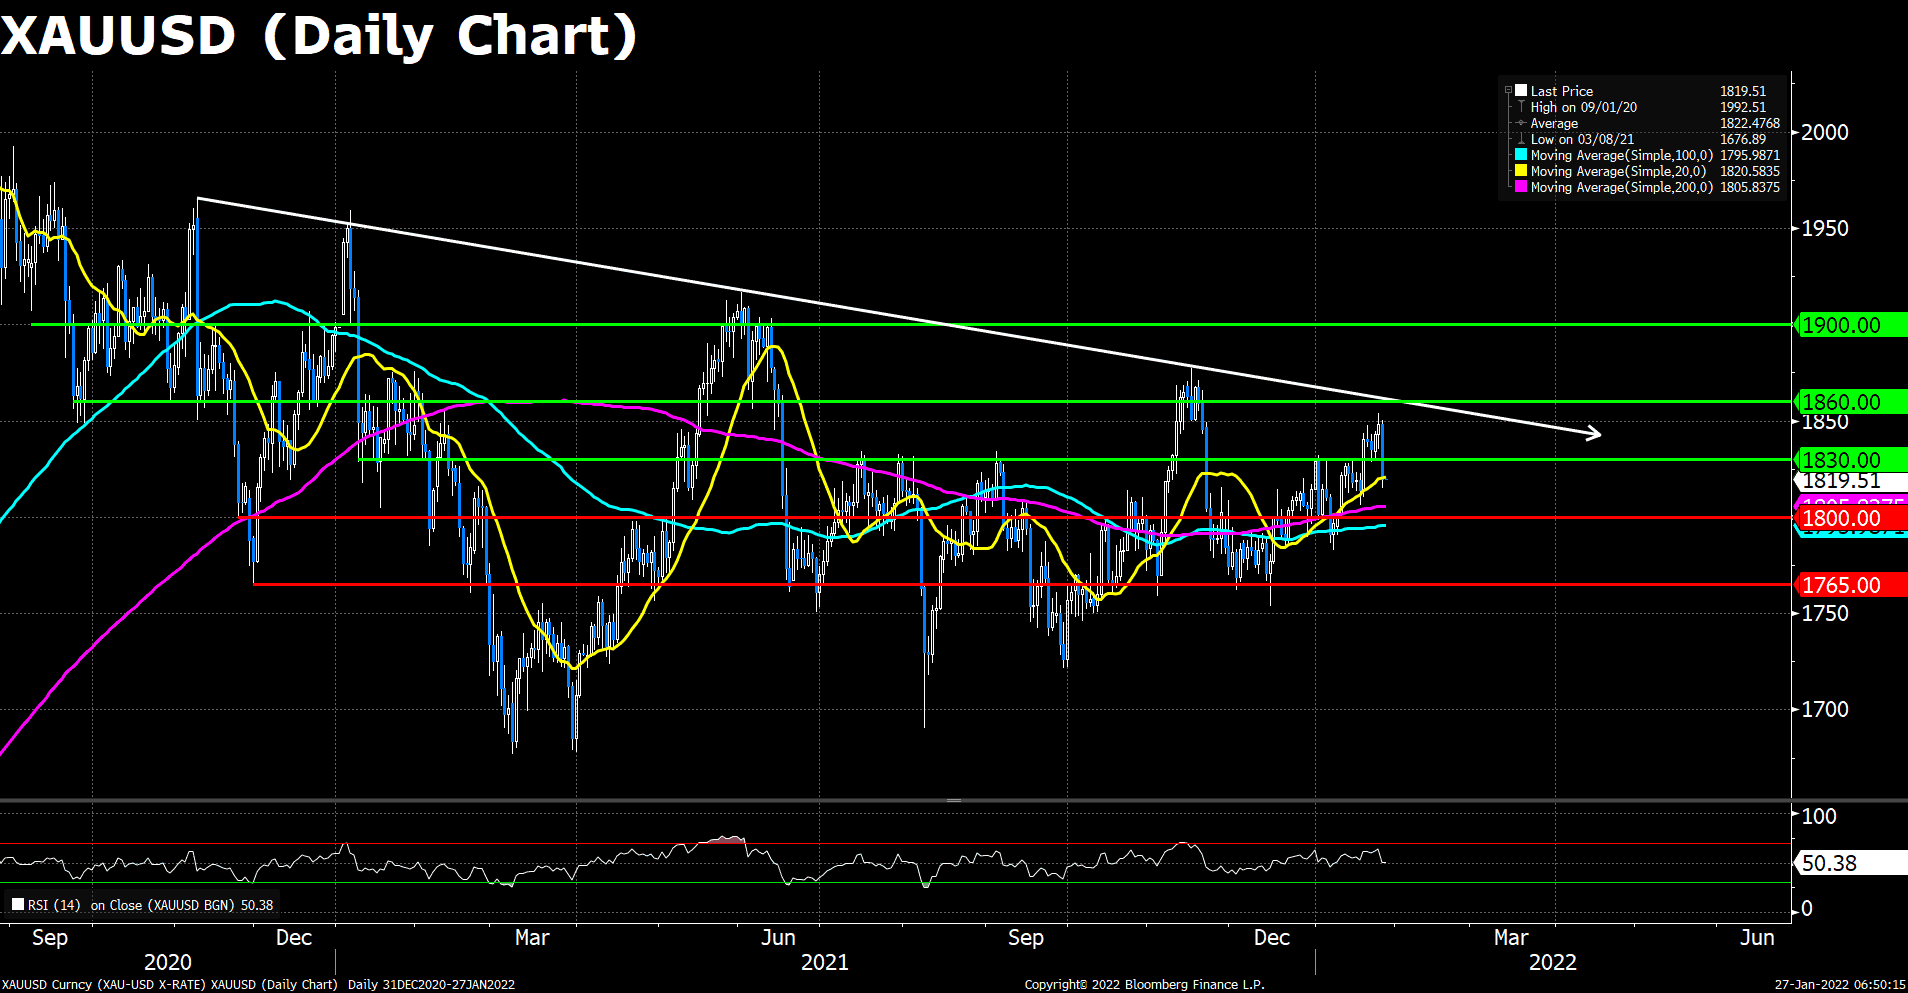
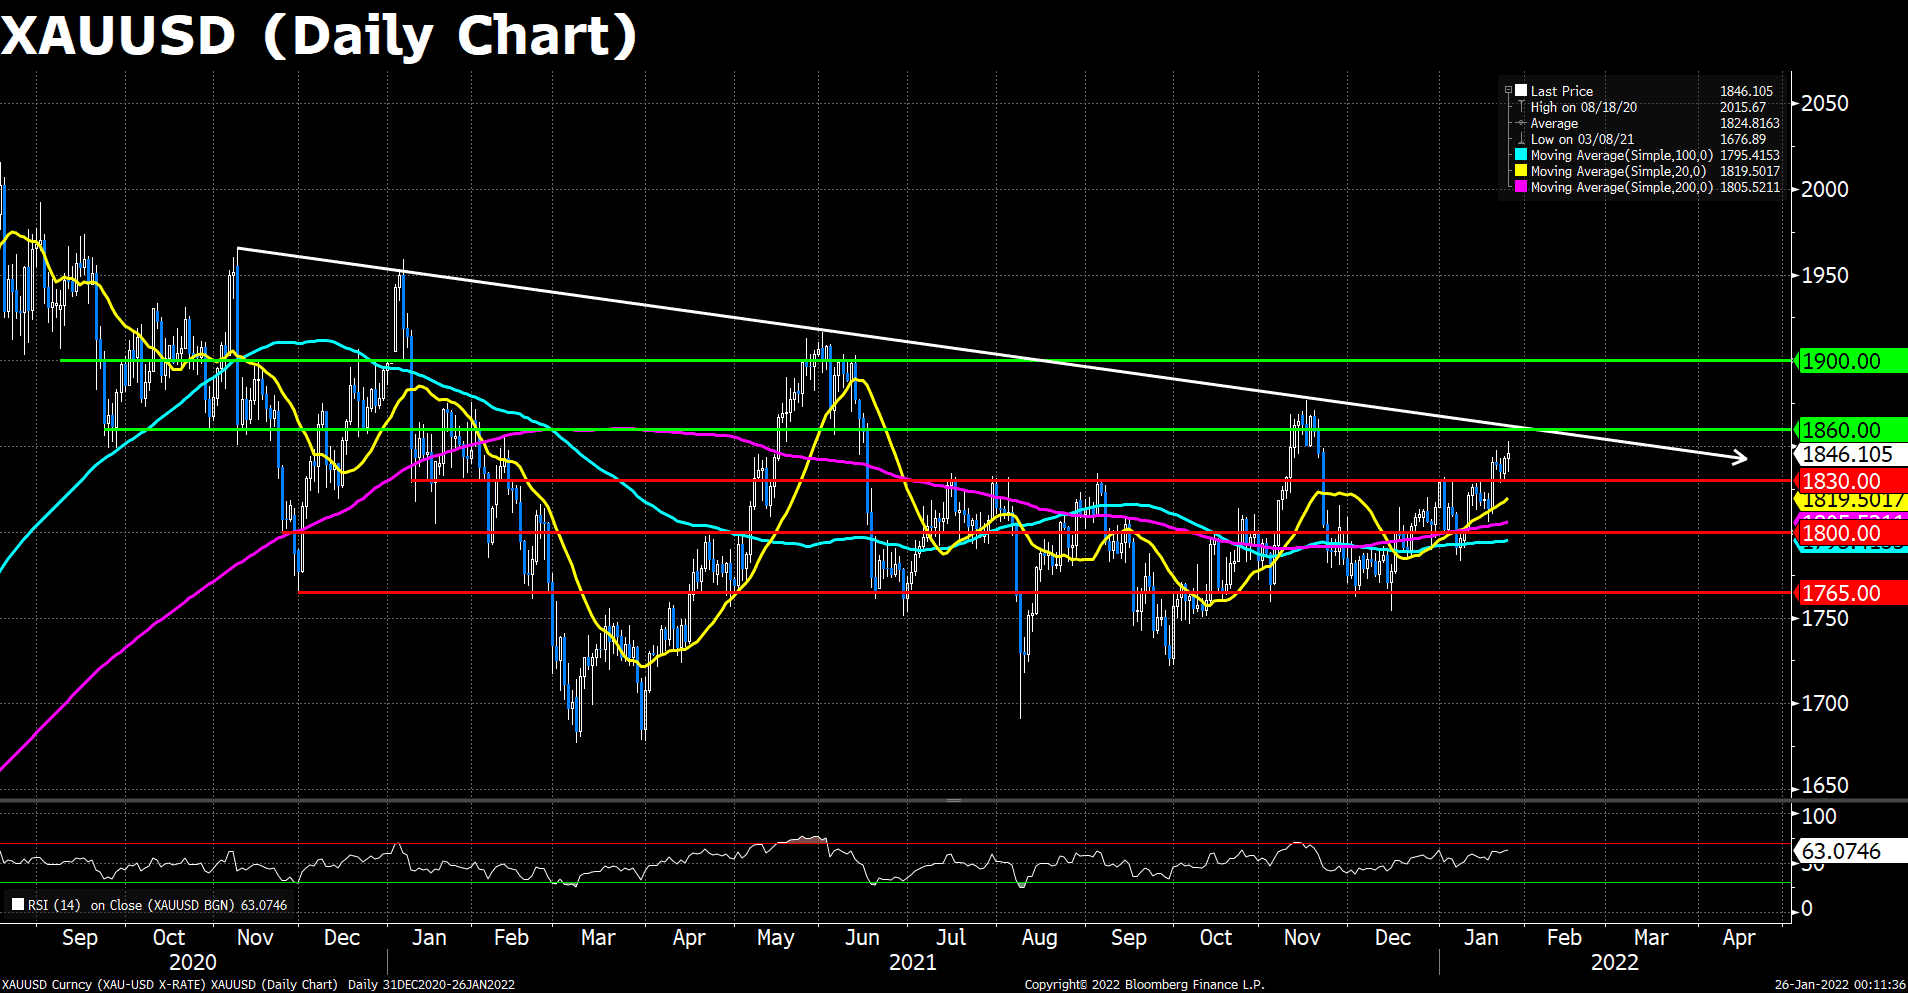
XAUUSD (Daily Chart)

Gold peaked on European hours at $1,809 and then lost strength. It pulled back following the release of US economic data to $1,797 and then rose back above $1,800. XAU/USD is moving sideways on American hours, capped by $1,810 while holding above $1,800. The greenback recovers some strength amid rising US bond yields that rebounded from weekly lows. The dollar index (DXY) is falling for the second day in a row and it stands around 96.42, down 0.23% off lows. The combination of a rebound in yields and also in the DXY weakened XAU/USD that is still in positive ground for the day.
As to technical, Gold’s price recovery found short-term resistance at $1,810 and pulled back. If XAU/USD fails to break the $1,810 area, the upside would remain limited and a break higher could clear the way for a rally initially to the 20 DMA at $1817; above the next key resistance lies in the $1,830 area. On the flip side, a slide back under $1800 would increase the bearish pressure. A daily close under $1790 is needed to suggest more losses ahead. Key support levels are seen at $1765.
Resistance: 1817, 1830, 1860
Support: 1800, 1765, 1720
Economic Data:
|
Currency |
Data |
Time (GMT + 8) |
Forecast |
|
|
NZD |
Employment Change (QoQ) (Q4) |
05:45 |
0.3% |
|
|
EUR |
CPI (YoY) (Jan) |
18:00 |
4.4% |
|
|
USD |
ADP Nonfarm Employment Change (Jan) |
21:15 |
207 K |
|
|
USD |
Crude Oil Inventories |
23:30 |
1.525 M |
|