Back

Oil Rebound Signals Fragile Market Calm

Key Points

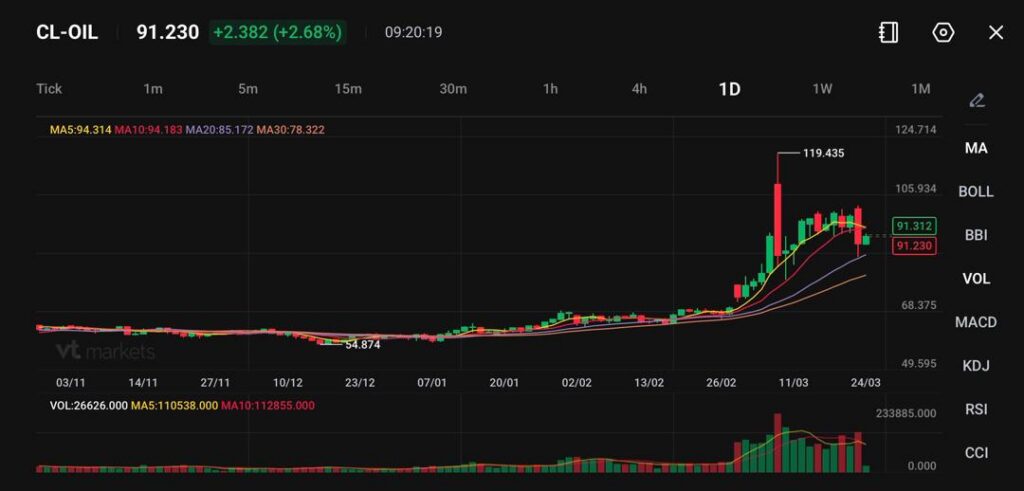
  • WTI trades near 91.23, up +2.382 (+2.68%), while Brent rebounds above $100 per barrel.
  • Risk sentiment remains fragile as Strait of Hormuz disruptions persist and conflict escalates.
  • Governments respond with stockpile releases and demand cuts, highlighting supply stress.

Oil prices pushed higher again after a brief pullback, reinforcing how sensitive markets remain to developments in the Middle East.

WTI crude is trading near 91.23, up +2.68%, while Brent crude has climbed back above $100 per barrel, reversing earlier losses. The rebound follows a short-lived relief rally that faded quickly as geopolitical tensions intensified.

The market reaction shows that any dip in oil prices is being treated as temporary, with traders continuing to price in supply risks.

Oil may remain volatile, with upward pressure persisting as long as supply disruptions are unresolved.

Strait of Hormuz Remains the Core Risk

The situation around the Strait of Hormuz continues to dominate the oil narrative. Despite diplomatic signals, there is little evidence of de-escalation.

The strait remains effectively constrained, limiting the flow of crude and LNG through one of the world’s most critical energy corridors.

Iran’s continued missile activity and the lack of confirmed negotiations have kept markets on edge. Even with a short extension to diplomatic timelines, traders are not pricing in a quick resolution.

This sustained uncertainty is preventing oil from correcting meaningfully lower.

If the strait remains restricted, oil prices could reprice higher as global inventories tighten.

Global Response Highlights Supply Stress

Governments are already taking steps to manage the shock.

Japan has announced plans to release oil from joint stockpiles by the end of March, while South Korea is pushing for nationwide energy-saving measures. These actions reflect growing concern over prolonged supply constraints.

Meanwhile, reports that Iranian oil is being offered to Indian refiners at a premium to ICE Brent suggest that even sanctioned supply is being reintroduced under strained conditions.

These developments underline how tight the global energy market has become.

Risk Sentiment Turns Choppy Across Markets

The oil rebound has weighed on broader market sentiment.

Asian equities saw only a modest recovery, while U.S. and European futures declined, reflecting uncertainty over growth and inflation.

At the same time, the U.S. dollar regained strength, and Treasury yields resumed their climb, signalling a shift back toward defensive positioning.

Higher oil prices raise inflation risks, which in turn complicate central bank policy and pressure risk assets.

Continued energy price strength could weigh on equities and support the dollar in the near term.

Technical Analysis

Crude Oil (CL-OIL) is trading near $91.23, up around 2.68% on the session, showing a short-term rebound after the recent pullback from the $119.43 spike high. The move suggests buyers are stepping back in around key support, though the broader structure is still in a cooling phase after the earlier surge.

From a technical perspective, oil remains in an overall uptrend, but momentum has clearly softened. Price is now sitting just below the 5-day MA (94.31) and 10-day MA (94.18), both of which are turning lower and acting as immediate resistance. Meanwhile, the 20-day MA (85.17) and 30-day MA (78.32) remain well below price and continue to slope upward, indicating that the broader bullish structure is still intact.

Key levels to watch:

  • Support:$90 → $85 → $78
  • Resistance:$94–95 → $100 → $105+

The $90 region is proving to be an important near-term support zone. Holding above this level keeps the structure constructive and supports the idea of consolidation rather than reversal. A break below it, however, could trigger a deeper retracement toward the $85 region, where the 20-day average aligns.

On the upside, price needs to reclaim $94–95 to regain momentum. A sustained move above this area would likely open the path back toward $100, followed by the $105–110 zone, though the $119 high remains a distant and strong resistance level for now.

Overall, oil appears to be transitioning from a parabolic rally into a consolidation phase, with buyers defending key support but struggling to reclaim short-term control. The next move will likely depend on whether price can decisively break back above $95 or lose the $90 floor, which would define the next directional leg.

Macro Data and Central Banks in Focus

Beyond geopolitics, markets are also watching incoming economic data.

Upcoming flash PMI readings for the Eurozone, UK, and U.S. will provide insight into how the energy shock is impacting economic activity.

At the same time, Japan’s core inflation slowing below the 2% target adds another layer of complexity for central banks trying to balance growth and inflation risks.

These macro factors will play a key role in shaping expectations for monetary policy in the coming weeks.

What Traders Should Watch Next

Markets remain driven by a mix of geopolitical and macro forces. Key areas to monitor include:

  • Developments around the Strait of Hormuz
  • Oil price behaviour above the $100 Brent level
  • Government responses to energy shortages
  • Central bank reactions to inflation risks
  • Upcoming PMI data releases

For now, oil’s rebound highlights a market that remains tightly linked to geopolitical developments, with volatility likely to persist as supply risks evolve.

Learn more about trading Energies on VT Markets here.

FAQs

Why Did Oil Prices Rise Again Today?
Oil prices rebounded because geopolitical tensions remain high and supply disruptions through the Strait of Hormuz continue to restrict global energy flows.

Where Are Oil Prices Trading Now?
WTI crude is trading near 91.23, up +2.68%, while Brent crude has climbed back above $100 per barrel.

Why is the Strait of Hormuz So Important for Oil?
The Strait of Hormuz handles roughly 20% of global oil shipments, making it one of the most critical chokepoints for global energy supply.

Is the Oil Rally Likely to Continue?
Oil could remain supported if supply disruptions persist. However, short-term pullbacks may occur as markets react to news and policy responses.

How Are Governments Responding to the Oil Shock?
Countries are releasing strategic reserves and implementing energy-saving measures. Japan plans to release oil from stockpiles, while South Korea is reducing energy usage.

Why Are Markets So Volatile Right Now?
Volatility is driven by uncertainty around the Middle East conflict, fluctuating oil prices, and concerns about inflation and economic growth.

Start trading now – Click here to create your real VT Markets account

Dow Futures undergoes a complex double three Elliott Wave correction, extending the cycle from April 2025 lows

Dow Futures (YM) has been falling since the all-time high on 10 February 2026 at 50,611, as part of a correction that began from the April 2025 low. The decline is described as a double three Elliott Wave pattern, with wave W dropping to 46,333 and wave X rebounding to 48,275 on a one-hour chart. After the wave X peak, wave ((A)) fell to 45,453 and wave ((B)) rose to 47,210, which is treated as complete. The current wave Y is continuing lower with a zigzag-style internal move.

Near Term Technical Levels

Near-term price action is expected to stay weak if rebounds remain below 47,210 and especially below 48,275. Fibonacci extension levels from the 10 February 2026 high give a downside target zone of 41,268 to 43,925, based on the 100% to 161.8% extension range. The move is framed as a corrective phase within the wider cycle. The 41,268–43,925 area is presented as a place where buying could appear after the correction concludes. We are seeing the Dow in a corrective phase, pulling back from the major rally that began in April 2025. This current decline appears to be a complex, structured move rather than a simple dip. The expectation is for more downside as long as the index remains below the key resistance level of 47,210. This technical outlook is reinforced by a rise in market uncertainty, with the VIX volatility index recently climbing above 22 for the first time since October 2025. This move coincides with recent inflation data for February coming in slightly higher than anticipated, which has dampened expectations for near-term interest rate cuts from the Federal Reserve. This broader economic environment supports the case for a continued pullback in equities. For the near term, this suggests that strategies like buying put options or using bear put spreads could be effective. These approaches allow traders to profit from a potential decline toward our target zone. This provides a way to participate in the expected downward move while maintaining a clearly defined risk, should the market unexpectedly rally past resistance.

Positioning And Strategy

Our primary downside target is the zone between 41,268 and 43,925. A drop to this level would represent a market correction of approximately 15% from the February 10th all-time high. Historically, corrections of this magnitude are not uncommon following the kind of significant rally we witnessed over the last year. As the Dow approaches this target area, the strategy should shift from bearish to neutral. We would then look to close short positions and start watching for signs that the correction is complete. At that point, traders can begin to prepare for the next potential long-term move higher by considering strategies like selling cash-secured puts or buying call options. Create your live VT Markets account and start trading now.

Start trading now – Click here to create your real VT Markets account

Amid Iran’s rejection of peace-talk hopes, the Australian Dollar weakens broadly, down 0.6% near 0.6760

The Australian Dollar fell against major peers, down 0.6% to about 0.6760 in Asian trade on Tuesday. Risk aversion returned after Iran said it is not involved in peace talks with the US. On Monday, US President Donald Trump said military attacks on Iran’s power plants were paused for five days. He said talks with Tehran were “very good and productive” and aimed at a “complete and total resolution” of hostilities in the Middle East.

Dollar Strength Returns

The risk-off move supported the US Dollar after it had dropped following Trump’s remarks. The US Dollar Index (DXY) was up 0.25% at around 99.40. The AUD also faced pressure from weak Australian S&P Global PMI figures for March. Composite PMI fell to 47.0 from 52.4 in February, and readings below 50.0 indicate contraction. Markets are also waiting for Australia’s February CPI data on Wednesday. The report is expected to have limited effect on the Reserve Bank of Australia outlook, as it does not capture the recent rise in energy prices linked to the Iran conflict. The renewed risk aversion, driven by Iran’s dismissal of peace talks, is strengthening the US Dollar and directly weighing on risk-sensitive currencies like the Australian Dollar. This geopolitical tension creates a clear “risk-off” environment. We see traders moving capital into safe-haven assets, a trend that is likely to continue as long as the situation in the Middle East remains uncertain.

Options And Volatility Signals

The sharp drop in Australia’s Composite PMI to 47.0 is a significant red flag for the domestic economy, signaling a contraction for the first time in several months. This weak data, which follows last week’s report showing a 0.8% fall in retail sales for February, suggests that the internal economic momentum is fading fast. This provides a fundamental reason for Aussie dollar weakness beyond just global sentiment. Given this dual threat of geopolitical instability and domestic economic slowing, we are positioning for further downside in the AUD/USD pair. Put options offer a defined-risk way to profit from a potential drop towards the 0.6650 support level. We saw a similar dynamic in mid-2025 when concerns about global growth sent the Aussie tumbling, and history suggests these moves can be swift. The conflicting statements from Washington and Tehran are also increasing market uncertainty, which is reflected in the options market. Implied volatility for AUD/USD one-month options has jumped to 12.2%, its highest level this year. This makes strategies like buying straddles or strangles interesting for those expecting a large price move in either direction, though the current bias is clearly to the downside. This economic downturn places immense pressure on the Reserve Bank of Australia, making any future interest rate hikes highly improbable. In fact, overnight index swaps are now pricing in a 35% probability of an RBA rate cut by its June meeting. Any confirmation of this dovish pivot in the coming weeks would act as another catalyst for a lower Australian Dollar. Create your live VT Markets account and start trading now.

Start trading now – Click here to create your real VT Markets account

Dividend Adjustment Notice – Mar 24 ,2026

Dear Client,

Please note that the dividends of the following products will be adjusted accordingly. Index dividends will be executed separately through a balance statement directly to your trading account, and the comment will be in the following format “Div & Product Name & Net Volume”.

Please refer to the table below for more details:

Dividend Adjustment Notice

The above data is for reference only, please refer to the MT4/MT5 software for specific data.

If you’d like more information, please don’t hesitate to contact [email protected].

Amid heightened risk aversion, NZD/USD slips near 0.5830 as the stronger US Dollar weighs

NZD/USD slipped to about 0.5830 in the Asian session on Tuesday, giving back some of the previous day’s gains. The move came as the US Dollar strengthened amid higher risk aversion after Israel said it launched a new wave of strikes on Tehran. Israel carried out the latest strike on Iran after US President Donald Trump indicated a pause in attacks on energy infrastructure following talks he described as productive with Tehran. The Israeli Defense Forces said operations would continue under government directives until further notice.

Geopolitical Tensions Drive Risk Aversion

Iran’s Foreign Minister Abbas Araghchi said there had been no dialogue with Washington. Parliament Speaker Mohammad Bagher Ghalibaf said on Monday that no negotiations had taken place with the US, while adviser Mohsen Rezaei said the conflict would continue until Iran receives full compensation for damage. Reuters reported that San Francisco Fed President Mary Daly said interest-rate prospects remain uncertain unless the conflict eases quickly and the Fed can look past a temporary oil price spike. RBNZ Governor Anna Breman said near-term inflation could rise due to energy shocks and that rate rises may be needed if inflation pressures persist. With risk aversion dominating markets due to the Mideast conflict, we see continued pressure on the NZD/USD pair. The immediate strategy leans towards establishing short positions or buying put options targeting a move towards the 0.5700 handle. Looking back at the volatility in late 2025, we know that support levels can be fragile during periods of intense geopolitical stress. The contradictory statements from Israeli, Iranian, and US officials suggest this situation will not resolve quickly, fueling market uncertainty. We are seeing implied volatility on NZD options spike over 15%, reflecting the high price of uncertainty as Brent crude futures push past $115 a barrel. This environment is well-suited for strategies that profit from large price swings, such as long straddles, though they come at a higher premium.

Central Banks Focus Meets Safe Haven Demand

While both the Fed and the RBNZ are signaling that persistent inflation could force their hand on rates, the US dollar’s safe-haven status is the dominant factor for now. Any hawkish talk from the RBNZ will likely be muted by the global flight to safety, capping any potential upside for the Kiwi dollar. After finally getting core inflation back towards the 3% target in 2025, this new energy shock presents a significant setback for central banks. Create your live VT Markets account and start trading now.

Start trading now – Click here to create your real VT Markets account

Silver’s XAG/USD slips near $66.50; sellers stay dominant under the 100-day SMA after rebounding from $61.00

Silver (XAG/USD) failed to build on Monday’s rebound from $61.00, its lowest level since 12 December, and met new selling in the Asian session on Tuesday. It fell back towards the mid-$66.00s and stayed exposed to a two-week downtrend. Last week, silver broke below the 100-day Simple Moving Average (SMA) and closed under it for the first time since April 2025. The Moving Average Convergence Divergence (MACD) turned negative, stayed below its signal line, and showed an expanding negative histogram.

Key Momentum Signals

The Relative Strength Index (RSI) was near 33, below the 50 mark and close to oversold levels. Initial support sat near $67.00, with further supports at $63.00 and $60.00. On the upside, resistance was seen near $73.00 and around the 100-day SMA near $74.00. A daily close above that area could bring $80.00 into view, followed by resistance near $85.00. The technical analysis was produced with the help of an AI tool. We see silver struggling to gain traction, and this confirms the bearish signals we observed late last year. Looking back at 2025, the breakdown below the 100-day Simple Moving Average was a critical moment that shifted short-term momentum. As of today, the price remains capped below those key resistance levels of $73.00-$74.00, reinforcing the negative outlook.

Macro Drivers And Trade Ideas

The current macroeconomic environment is adding pressure, with the latest US CPI data for February 2026 coming in hotter than expected at 3.4%. This has pushed the US Dollar Index (DXY) to a firm 105.5, making silver more expensive for foreign buyers. Consequently, expectations for Federal Reserve rate cuts are being pushed further out, which is a headwind for non-yielding assets. For the coming weeks, we believe buying put options with strike prices near the old support levels of $63.00 and $60.00 could be a prudent strategy. These levels were highlighted as potential targets during the 2025 downtrend. May 2026 expiry dates would provide enough time for this scenario to potentially unfold. Industrial demand, a key component for silver, also appears weak, providing another reason for caution. Recent data shows China’s industrial production grew slower than forecast in the first two months of 2026, and the latest manufacturing PMI registered at 49.8. A reading below 50 indicates contraction, suggesting that a significant source of silver demand is faltering. Given this backdrop, we should also consider strategies that benefit from range-bound price action or a potential sharp reversal. Selling out-of-the-money covered calls against any physical holdings could generate income while the price stagnates below resistance. Alternatively, for those anticipating an eventual rebound, purchasing long-dated, cheap call options, such as September 2026 $75 calls, offers a low-cost way to participate in a potential recovery later in the year. Create your live VT Markets account and start trading now.

Start trading now – Click here to create your real VT Markets account

Escalating Middle East conflict boosts risk aversion, lifting the dollar and pushing EUR/USD beneath 1.1600

EUR/USD fell below 1.1600 after small gains, trading near 1.1590 in Asian hours on Tuesday. The move came as the US Dollar strengthened amid higher risk aversion linked to the Middle East conflict. The Guardian reported that Israel launched a new wave of strikes on Tehran. US President Donald Trump indicated a pause in US attacks on energy infrastructure after talks with Iran, while Israel said operations would continue under government directives.

Geopolitical Escalation Drives Risk Aversion

Iran’s Foreign Minister Abbas Araghchi said there was “no dialogue” with Washington. Parliamentary Speaker Mohammad Bagher Ghalibaf said “no negotiations have been held with the US”, and adviser Mohsen Rezaei said the war would continue until Iran receives full compensation for damage. Reuters reported that San Francisco Fed President Mary Daly said the next interest-rate move is unclear unless the conflict ends quickly and oil-price rises prove temporary. Rising oil prices have added to inflation concerns and influenced expectations around central-bank policy. The ECB kept rates unchanged last week and cited a “significantly more uncertain” outlook due to the Iran conflict. In 2022, the Euro accounted for 31% of FX transactions, with average daily turnover above $2.2 trillion; EUR/USD is about 30% of trades, with EUR/JPY 4%, EUR/GBP 3%, and EUR/AUD 2%. The escalating Middle East conflict is the main driver, pushing capital towards the safety of the US Dollar. We’ve seen the CBOE Volatility Index (VIX) jump to over 25 in the past week, its highest level since the banking jitters we saw in late 2025. This risk-off environment is the primary force weighing on the EUR/USD pair right now. The immediate economic fallout is clear in energy markets, where Brent crude futures have surged past $110 a barrel. This is fueling inflation expectations, with the latest Eurozone Harmonized Index of Consumer Prices (HICP) for February already ticking up to 2.8%. This puts pressure on the European Central Bank to act, even as the economy slows.

Positioning For Volatility Across Rates And FX

For derivative traders, this creates a complex scenario where central bank policies are diverging. While the market is pricing in the possibility of a hawkish ECB to combat inflation, recent German PMI data from last month showed a dip to 48.5, suggesting a manufacturing contraction. The ECB is being forced to consider tightening policy into a weakening economic backdrop. Given this uncertainty, we believe focusing on volatility is more prudent than making large directional bets. Implied volatility on one-month EUR/USD options has increased significantly, indicating the market expects larger price movements. Strategies like long straddles could be positioned to benefit from a significant price swing, regardless of whether it is driven by war fears or a surprise central bank announcement. We can look back at the market’s reaction to the energy shock in 2022 for a potential roadmap. We saw then how the Euro initially weakened due to Europe’s energy vulnerability and general risk aversion. However, the resulting inflation forced the ECB into a more aggressive rate-hiking cycle than the market expected, which eventually provided strong support for the currency later that year. Create your live VT Markets account and start trading now.

Start trading now – Click here to create your real VT Markets account

Takaichi stated Japan would begin releasing its national oil reserves from Thursday, according to an X post

Japan will begin releasing national oil reserves from Thursday, according to a Tuesday post on X by Prime Minister Sanae Takaichi. The country will also start releasing oil from joint storage with oil-producing countries by the end of March.

Oil Reserve Release Signals

At the time of writing, USD/JPY was up 0.03% on the day at 158.48. Japan’s move to release oil reserves starting this Thursday is a direct response to the high energy prices we’ve been seeing. We saw Brent crude surge past $110 per barrel in late 2025, and this action is clearly intended to put downward pressure on those prices. For traders, this signals a potential near-term top for crude oil. The mention of a joint release with producing countries by the end of March is the most important detail, suggesting a coordinated effort to stabilize the market. This type of official intervention is designed to reduce market volatility, which had spiked over 40% in January 2026. We believe this makes selling volatility on crude oil options an attractive strategy for the coming weeks.

Trading Implications And Strategy

However, we must remember that the impact of reserve releases can be short-lived. Looking back at the major coordinated release in 2022, prices dropped initially but rebounded as fundamental supply and demand issues took over again. The total volume of this release will be critical to determining if the effect will last beyond a few weeks. The currency market reaction is also telling, with USD/JPY holding firm above 158. The yen’s weakness, driven by the ongoing interest rate gap between Japan and the U.S., has made oil imports extremely expensive for Japan. This release is as much about managing domestic inflation and the economic pain of a weak yen as it is about global oil prices. Given these factors, we are positioning for a range-bound or slightly lower oil market. Buying put spreads on WTI futures for the May and June contracts offers a defined-risk strategy to capitalize on this view. This allows us to profit from a modest price drop while being protected if the impact of the release is weaker than expected. Create your live VT Markets account and start trading now.

Start trading now – Click here to create your real VT Markets account

Following February’s four-year-low CPI, the Yen weakens, while USD/JPY remains supported around 158.55 early Asian trading

USD/JPY traded firmer near 158.55 in early Asian trade on Tuesday, as the Japanese Yen weakened after a softer inflation print. Markets are awaiting the preliminary US S&P Global PMI reading for March, due later on Tuesday. Japan’s National CPI rose 1.3% year on year in February, down from 1.5% in the prior reading. This was the lowest level since March 2022 and remained below the central bank’s 2% target.

Japan Inflation Details

National CPI excluding fresh food increased 1.6% year on year in February, easing from 2.0% and below the 1.7% consensus. “Core-core” inflation, which excludes fresh food and energy, rose 2.5% year on year, down from 2.6%. Markets are also watching developments in the Middle East, where higher tensions could affect energy prices and inflation expectations. Bloomberg reported that US President Donald Trump offered Iran a five-day reprieve and referred to possible talks, which Iranian officials denied. Mohsen Rezaei, a senior military adviser to Iran’s Supreme Leader Mojtaba Khamenei, said the war would continue until Iran receives full compensation for damage sustained. The situation remains a focus for near-term currency moves. Looking back at this time in 2025, we remember the concerns about Japanese inflation coming in cooler than expected, which helped push the USD/JPY pair towards 158.55. Today, with the pair now trading near 165.20, that dynamic has only intensified over the past year. The fundamental story of a weak yen remains largely intact, creating specific opportunities.

Policy Divergence Drives Dollar Strength

The core of this trend continues to be inflation and central bank policy divergence. The Japanese CPI data for February 2025 showed a low 1.3% rise, and even now, the most recent numbers for February 2026 show inflation is still struggling at just 1.8%, below the Bank of Japan’s 2% target. This contrasts sharply with the US, where inflation, while down from its peaks, has proven sticky, with the last CPI print for February 2026 coming in at 2.9%. This persistent gap in inflation and interest rates is what derivative traders must focus on. The Bank of Japan has only managed one small rate hike in the past year, while the US Federal Reserve has held rates steady, signaling a very cautious path to any potential cuts. This means the interest rate differential between the two countries remains exceptionally wide, favoring the dollar. For traders, this suggests that the positive carry from holding long USD/JPY positions is still highly attractive. Selling out-of-the-money JPY call options could be a prudent way to generate income, as a sudden and sustained surge in the yen’s value seems unlikely without a major policy shift from the Bank of Japan. This strategy capitalizes on the market expecting the pair to either drift higher or stay within a range. We must also watch for signs of intervention from Japanese officials, which become more likely as the pair stays above the 165 level. This risk is reflected in the options market, where one-month implied volatility has crept up to 9.5% from the 7.8% seen in late 2025. Buying short-term, cheap JPY call options could be a smart hedge against any surprise announcements from Tokyo. While the specific US-Iran talks that were a focus in early 2025 have faded from the headlines, broad geopolitical uncertainty continues to support the US dollar. Any flare-up in global risk tends to send capital towards the greenback. Therefore, holding some exposure to dollar strength against weaker currencies like the yen remains a sound underlying position. Create your live VT Markets account and start trading now.

Start trading now – Click here to create your real VT Markets account

WTI regains the mid-$90s, as Middle East tensions and supply concerns lift prices after $84 low

WTI rose in Asian trade on Tuesday, extending Monday’s rebound from about $84.00, a near two-week low. Prices moved back above the mid-$90.00s on supply risk concerns. Iran said it had not held talks with the US to end the war, after comments from US President Donald Trump on Monday about a deal soon. Iranian adviser Mohsen Rezaei said the war would continue until Iran receives full compensation for damage.

Renewed Pressure On Iran Gas Network

Iran’s gas infrastructure was reported to be under renewed pressure. Iran’s semi-official Fars news agency said a gas company office and a pressure-reduction station were hit in Isfahan. A projectile was also reported to have struck a gas pipeline supplying a power station in Khorramshahr. The Strait of Hormuz was described as effectively closed, disrupting energy trade and supporting oil prices. Markets also tracked concerns that higher energy costs could lift inflation again. Expectations of a possible US Federal Reserve rate rise and higher US Treasury yields supported the US Dollar, which can limit gains in dollar-priced commodities like oil. We remember looking back to late 2025 when WTI crude rallied past the mid-$90s as the market priced in significant supply risks from the Middle East. The escalating conflict involving Iran and the effective closure of the Strait of Hormuz created a very bullish backdrop for oil. Those supply fears proved to be well-founded and have kept a floor under prices ever since.

Supply Tightness And Market Sensitivity

The supply situation remains tight even now in March 2026. Last week’s EIA report showed a surprise inventory draw of 2.8 million barrels, defying forecasts for a build and putting U.S. stockpiles 6% below the five-year average for this time of year. Global spare production capacity is also razor-thin, with recent industry estimates putting it below 2.2 million barrels per day. The market’s sensitivity to these old tensions is still extremely high. We saw a clear example of this just last month when a minor shipping disruption near a key chokepoint caused prices to jump $3 in a single session before correcting. This demonstrates that the geopolitical risk premium that was built up in 2025 is still very much a factor traders must respect. While the threat of Federal Reserve rate hikes was a headwind for oil prices back in 2025, that dynamic has now flipped. After pausing its tightening cycle, the Fed is now signaling a more dovish stance, with Fed funds futures currently pricing in a 70% chance of a rate cut by September 2026. A weaker U.S. dollar, which has fallen 4% against a basket of currencies this year, also provides a tailwind for crude. For derivative traders, this suggests that buying call options to bet on further price upside remains a viable strategy. Given the persistent risk of a sudden price spike, owning long-dated calls in the $100-$110 range could provide significant returns on a geopolitical flare-up. Using bull call spreads can help reduce the initial cost of the trade in an environment of elevated volatility. However, any credible diplomatic progress in the Middle East could rapidly deflate oil prices. To hedge against a sudden de-escalation, traders holding bullish positions should consider purchasing out-of-the-money puts. This can protect profits and limit downside exposure if the supply risk that has defined the market since 2025 begins to fade. Create your live VT Markets account and start trading now.

Start trading now – Click here to create your real VT Markets account

Back To Top
server

Hello there 👋

How can I help you?

Chat with our team instantly

Live Chat

Start a live conversation through...

  • Telegram
    hold On hold
  • Coming Soon...

Hello there 👋

How can I help you?

telegram

Scan the QR code with your smartphone to start a chat with us, or click here.

Don’t have the Telegram App or Desktop installed? Use Web Telegram instead.

QR code