The Japanese Yen recovered early losses against the US Dollar and traded near flat at about 158.50 in the European session on Tuesday. USD/JPY eased as the US Dollar gave up earlier gains amid improved risk appetite.
S&P 500 futures erased earlier declines and moved positive around 6,600.00 during European trade. The US Dollar Index (DXY) slipped from an intraday high of 99.45 to about 99.15.
Risk Appetite Improves
Risk sentiment improved on expectations that conflict in the Middle East may not widen. This followed a statement from US President Trump that he instructed the Department of War to pause attacks on Iran’s power plants for five days.
Iran rejected reports of direct talks with the US on de-escalation. Despite this, comments from Trump supported expectations of a possible resolution.
In Japan, the Yen found support after Bank of Japan remarks pointing to moderately rising inflation pressures. Governor Ueda said underlying inflation is expected to accelerate moderately, citing a tight labour market and wage and price-setting behaviour.
Japan’s National CPI excluding fresh food for February rose 1.6% year-on-year. This was below forecasts of 1.7% and the prior reading of 2%.
Volatility Outlook
The improving risk appetite, driven by the pause in Middle East hostilities, is putting pressure on the Yen’s safe-haven status. We see this renewed confidence in the S&P 500 futures, which indicates capital is flowing away from safety and into riskier assets. This environment typically favors selling the Yen to fund carry trades, especially against currencies with higher interest rates.
However, we must weigh this against the Bank of Japan’s confident stance, which is being backed by real data. Following the recent “Shunto” negotiations where major firms agreed to average wage hikes of over 4.3%, the highest in decades, the BoJ’s inflation narrative is gaining credibility. Traders should consider buying JPY call options or selling USD/JPY futures to position for a potential interest rate hike sooner than the market expects.
Looking back, we saw similar situations in 2025 where strong verbal commitments from Japanese officials led to sharp, but brief, rallies in the Yen. The core driver then, as it could be now, was the wide interest rate gap between Japan and the US. Therefore, using option structures like put spreads on the JPY could protect against a temporary spike while maintaining a bearish outlook if the BoJ fails to act decisively.
The conflicting signals between weak inflation data and strong wage growth suggest a period of high volatility is approaching. One-month implied volatility for USD/JPY has recently fallen to 8.5%, making option straddles relatively inexpensive. We believe this presents an opportunity to trade the impending breakout, as the pair is unlikely to stay in this tight range when monetary policy and geopolitical risks are pulling in opposite directions.
Create your live VT Markets account and start trading now.
Start trading now – Click here to create your real VT Markets account
Written on March 24, 2026 at 12:58 pm, by josephine
Markets were cautious early Tuesday after volatile trading at the start of the week. Preliminary March Manufacturing and Services PMI readings are due from Germany, the Eurozone, the UK and the US.
On Monday, Donald Trump said military strikes against Iran’s power plants would be postponed after “good and productive conversations”. Later, Iran’s foreign ministry said there was “no dialogue”, and the White House said the situation was “fluid”.
Market Focus Shifts To Pmi Releases
Early Tuesday in Europe, US stock index futures were lower and the USD Index held small gains above 99.00. After falling more than 9% on Monday, WTI recovered towards $90, up about 1.5% on the day.
Gold fell to a 2026-low near $4,100 on Monday before ending near $4,400. It traded slightly above $4,400 in a narrow range in the European session.
In Australia, the S&P Global Composite PMI fell to 47 in March’s flash reading from 52.4 in February. AUD/USD traded slightly below 0.7000.
USD/JPY traded near 158.50; Japan’s Manufacturing PMI fell to 51.4 from 53 and Services PMI to 52.8 from 53.8. Japan’s annual CPI rose 1.3% in February after 1.5% in January.
EUR/USD reached 1.1640 on Monday and held above 1.1600 early Tuesday. GBP/USD was above 1.3400 after rising more than 0.6% on Monday.
Volatility Signals Elevated Headline Risk
The extreme volatility driven by the US-Iran situation suggests we should prepare for more sharp, headline-driven moves. The White House calling the situation “fluid” after an initial de-escalation is a classic recipe for uncertainty. We should anticipate that implied volatility on major indices and commodities will remain elevated in the coming days.
Monday’s 9% collapse in WTI crude oil, followed by a partial recovery, is a clear signal of instability. This kind of price action is very similar to what we witnessed during the early stages of the geopolitical conflict in 2022, where daily price swings often exceeded 5%. We see this as an opportunity to structure trades that profit from large moves in either direction, as picking a firm direction is treacherous.
The US Dollar’s sharp decline and subsequent rebound shows the market is torn between risk-on and risk-off sentiment. Upcoming PMI data from the US and Europe will be critical, as weak numbers could quickly shift sentiment back toward the safety of the dollar. We are using options to hedge our currency exposures, particularly in EUR/USD, which is sitting at a key technical level.
Gold’s massive recovery from its 2026 low shows that despite an initial sell-off for liquidity, underlying demand for safe havens is extremely strong. This quick snap-back rally from near $4,100 is a warning that any further signs of conflict or economic weakness will likely send capital rushing into bullion. This makes buying protective puts on equity portfolios a more attractive strategy, even at higher premiums.
The poor PMI readings from Australia and Japan are the first red flags for the global economy this month. If the upcoming European and US figures also show contraction, it will confirm the slowdown fears we saw building throughout 2025. This justifies a cautious stance, and we are looking at weakness in the AUD as a barometer for global risk appetite.
Create your live VT Markets account and start trading now.
Start trading now – Click here to create your real VT Markets account
Written on March 24, 2026 at 11:00 am, by josephine
AUD/JPY fell for a second session and traded near 111.00 in early European dealing on Tuesday. On the daily chart, price is testing the lower edge of an ascending channel.
Near-term direction is neutral with a slight bullish tilt, as the pair is holding above the rising 50-day Exponential Moving Average (EMA). The latest drop followed a pullback from the 113.00 area, while the nine-day EMA is flat near spot.
Rsi Signals Balance Not Momentum
The 14-day Relative Strength Index (RSI) is at 50, after easing from overbought levels above 70 earlier this month. This points to balanced conditions rather than strong buying or selling pressure.
If the pair bounces, it may target 111.50 and then the nine-day EMA at 111.69. A move above 111.69 could open a retest of the all-time high at 113.96, set on March 11.
On the downside, support sits near 110.60 at the channel floor, then the 50-day EMA at 109.60. Below that, 108.00 is the next round-number support.
The technical analysis was produced with the help of an AI tool.
Trading Strategies Around Key Support
Given the current situation with AUD/JPY around the 111.00 mark, we are at a critical decision point. The pair is testing the bottom of its long-standing ascending channel, a technical signal that often precedes a move lower. This suggests that positions betting on a continued uptrend face immediate risk.
Fundamentally, the pressure is mounting from both sides of the pair. Recent data from early this month showed Australian inflation softened to 3.2%, reducing the urgency for the Reserve Bank of Australia to maintain its hawkish stance. Meanwhile, market chatter is growing louder about the Bank of Japan potentially signaling another small rate hike in its April meeting, which would strengthen the yen.
This divergence in central bank outlooks supports a move down in the pair. For traders anticipating a breakdown, buying put options with a strike price below 110.50 could be a strategy to profit from a drop towards the 50-day EMA near 109.60. Selling futures contracts is another direct way to position for this potential decline.
However, we must acknowledge that the broader uptrend is still technically intact as long as we hold above that 50-day EMA. Looking back to the fourth quarter of 2025, we saw a similar dip below 109.00 get aggressively bought, reminding us that bearishness can be premature. This balanced RSI reading near 50 also signals indecision rather than outright selling pressure.
For those who believe the support will hold, a strategy could involve selling put options with a strike price around the 109.50 level, collecting premium on the expectation that the pair will not fall that far. Alternatively, a bull call spread could offer a low-cost way to bet on a rebound toward the recent highs near 113.00. This approach would benefit if the current test of support is just a temporary pause.
Create your live VT Markets account and start trading now.
Start trading now – Click here to create your real VT Markets account
Written on March 24, 2026 at 11:00 am, by josephine
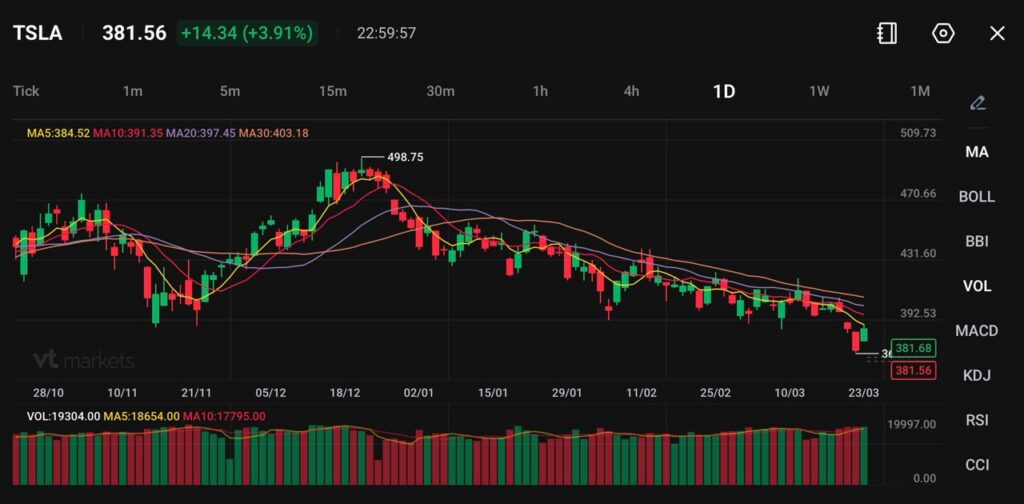
TSLA trades near 381.56, up +14.34 (+3.91%), after the Terafab announcement.
Tesla plans $20 billion in equipment spending for 2026, on top of a separate Terafab investment.
Production is targeted for late 2027, with volume output expected in 2028.
Tesla shares moved higher after Elon Musk unveiled plans for Terafab, a semiconductor manufacturing facility positioned as a cornerstone of a broader AI ecosystem.
Elon Musk said his Terafab project — a grand plan to eventually manufacture his own chips for robotics, artificial intelligence and space data centers — will be built in Austin and jointly run by Tesla and SpaceX https://t.co/c0bXI7mLZt
TSLA is trading near 381.56, gaining +3.91%, as investors reacted positively to the scale and ambition of the project.
The announcement adds a new dimension to Tesla’s story, shifting part of the narrative from electric vehicles toward infrastructure for artificial intelligence.
The rally reflects optimism around long-term growth, but near-term price action may remain volatile as execution risks are assessed.
$20 Billion Spend Signals Aggressive Expansion
Tesla plans to allocate approximately $20 billion toward new equipment in 2026, a sharp increase from less than $9 billion in 2025. Importantly, Terafab spending sits on top of this figure, implying an even larger capital commitment.
This level of investment highlights Tesla’s intent to secure control over critical components in the AI supply chain, particularly semiconductors.
However, the scale also raises questions around funding, capital allocation, and potential pressure on margins.
Continued investor support will likely depend on clarity around financing and return on investment.
Terafab Targets Unprecedented Scale
The concept behind Terafab centres on extreme scale. Musk aims to produce chips capable of supporting one terawatt of computing demand, equivalent to roughly one billion Nvidia Blackwell chips per year.
A terawatt equals one trillion watts, underscoring how far the project extends beyond current semiconductor manufacturing capabilities.
Exclusive: Tesla is looking to buy equipment worth $2.9 billion for manufacturing solar panels and cells from Chinese suppliers including Suzhou Maxwell Technologies, as CEO Elon Musk aims to add 100 gigawatts of solar capacity in the United States https://t.co/dNXIOUNyNa
Initial production is targeted for late 2027, with full-scale output in 2028. This timeline is ambitious, given that typical semiconductor facilities require around three years from construction to production.
Delays are a key risk. Any slippage in the timeline could weigh on sentiment and valuation.
AI Integration Expands Tesla’s Strategic Scope
Terafab is not a standalone project. It forms part of a broader ecosystem involving Tesla, xAI, and SpaceX, following their closer integration earlier this year.
The structure suggests a vertically integrated model where one group designs AI systems, manufactures the chips, deploys them in vehicles and robotics, and processes data via satellite infrastructure.
Musk has indicated that around 80% of Terafab’s chip output could be used in space, where SpaceX would handle AI computation.
Elon Musk’s bold vision for putting AI data centers in space, tapping into solar power and bypassing terrestrial worries such as electric grids and neighbors’ opposition, hinges on SpaceX’s ability to perfect its Starship booster. https://t.co/Oa04P3752U
This vision extends beyond traditional semiconductor strategies and into a fully integrated AI infrastructure model.
While the concept is expansive, execution across multiple industries introduces complexity that may take years to resolve.
Technical Analysis
Tesla (TSLA) is trading near 381.56, up around 3.91% on the session, showing a short-term bounce after an extended downtrend that has been in place since the 498.75 peak. Despite the recovery, the broader structure still reflects sustained bearish pressure.
From a technical standpoint, Tesla remains below all key moving averages, reinforcing the dominant downward trend. The 5-day MA (384.52) sits just above current price and is flattening, while the 10-day (391.35), 20-day (397.45), and 30-day (403.18) are all trending lower and stacked above price. This alignment suggests that rallies may continue to face selling pressure unless the structure shifts.
Key levels to watch:
Support:375 → 360 → 340
Resistance:385 → 390–400 → 430
The current bounce is approaching immediate resistance around 384–390, where the short-term moving averages cluster. A failure to break and hold above this zone would likely reinforce the ongoing downtrend. On the downside, 375 is acting as near-term support, with a break potentially exposing further weakness toward 360.
Volume has remained relatively steady, without a strong surge in buying interest, which suggests this move may be more of a technical rebound rather than a trend reversal.
Overall, Tesla appears to be attempting to stabilise after a prolonged decline, but the trend remains bearish unless price can reclaim the 390–400 region. A sustained move above that zone would be the first signal of a potential shift in momentum, while rejection could lead to continued downside pressure in the sessions ahead.
What Traders Should Watch Next
Tesla’s next phase will depend on both execution and communication. Key factors include:
Details on Terafab funding and timelines
Updates on integration with xAI and SpaceX
Broader AI infrastructure demand trends
Tesla’s core EV performance and margins
For now, the market is reacting to vision and scale, but sustained upside will likely require clearer evidence that execution can match ambition.
Create a live VT Markets account today to access our platform features, including market insights and educational content.
FAQs
Why Did Tesla Stock Rise After the Terafab Announcement? Tesla gained as investors reacted positively to the Terafab chip factory plan, viewing it as a long-term growth driver in AI and semiconductor infrastructure.
What is Terafab? Terafab is a proposed semiconductor manufacturing facility backed by Tesla, xAI, and SpaceX, aimed at producing chips at an unprecedented scale for AI applications.
How Much is Tesla Planning to Invest? Tesla plans to spend around $20 billion on equipment in 2026, up from less than $9 billion in 2025, with Terafab costs on top of that.
When Will Terafab Start Producing Chips? Initial production is targeted for late 2027, with full-scale output expected in 2028, although this timeline is considered ambitious.
What Makes Terafab Different From Other Chip Projects? The project aims to support one terawatt of computing demand, equivalent to roughly one billion Nvidia Blackwell chips per year, far exceeding current industry norms.
How Does SpaceX Fit Into the Terafab Plan? SpaceX is expected to use around 80% of Terafab’s chip output, potentially running AI computations in space rather than traditional data centres.
Start trading now – Click here to create your real VT Markets account
Written on March 24, 2026 at 10:59 am, by josephine
GBP/JPY recovered from an intraday dip to 212.30–212.25 and moved to the top of the day’s range before the European session on Tuesday. It then stalled near 212.65–212.70, little changed on the day, as markets awaited flash UK PMI readings.
The PMIs provide a monthly snapshot of activity in UK manufacturing and services. They are used to gauge economic conditions amid supply chain risks linked to conflict in the Middle East.
BoE BoJ Divergence And War Driven Inflation
Support for the pound came from expectations that the Bank of England could raise rates as early as April, due to inflation concerns tied to the Iran war. The yen weakened after National CPI fell to its lowest level since March 2022, reducing expectations of an immediate Bank of Japan rate rise.
Higher energy prices linked to the war were also seen as a headwind for Japan’s growth and the yen. Potential intervention by Japanese authorities was cited as a factor limiting further gains in GBP/JPY.
The pair has rebounded from 100-day SMA support near 207.25, last tested in February. A sustained move above 213.00 was referenced as a possible trigger for further upside.
S&P Global’s Composite PMI ranges from 0 to 100, with 50.0 indicating no monthly change. Readings above 50 suggest expansion, while below 50 indicate contraction.
Looking Back At March 2025
Looking back at the analysis from this time last year, in March 2025, the bullish sentiment for GBP/JPY was strong as it approached the 212.70 area. The core belief then was that a hawkish Bank of England would continue to diverge from a dovish Bank of Japan. This view was heavily reliant on inflation fears stemming from the Middle East conflict at the time.
We recall the Bank of England’s hawkish stance in early 2025, which did lead to a rate hike that April. However, inflation has since cooled significantly, with the latest UK CPI figures from February 2026 showing a drop to 2.5%, and the S&P Global Composite PMI has softened to 51.5, indicating slowing growth. This shift has led markets to price in potential rate cuts later this year, capping the Pound’s upside.
Conversely, the situation in Japan has evolved from the persistent weakness we saw in early 2025. With core inflation remaining above the 2% target for eighteen straight months, the Bank of Japan has finally shifted, raising its policy rate to 0.1% last quarter. This marks a significant departure from the dovish expectations of last year.
The concerns from 2025 about Japanese authorities intervening proved to be well-founded, as we saw several rounds of intervention in the latter half of that year when the cross threatened the 215.00 level. Those war-driven energy price spikes also moderated faster than anticipated, removing a key source of pressure on the Japanese economy. This has created a more stable, two-way market compared to the one-sided bullishness of last year.
Given this new environment, the aggressive bullish bets on GBP/JPY from early 2025 are no longer justified. Traders should now consider strategies that benefit from range-bound price action or a potential decline, such as selling out-of-the-money call options to collect premium. The previous upward momentum has clearly stalled, and the policy divergence that once drove the pair higher is now reversing.
Create your live VT Markets account and start trading now.
Start trading now – Click here to create your real VT Markets account
Written on March 24, 2026 at 10:58 am, by josephine
Global equities rebounded after US President Donald Trump indicated talks had started and announced a five-day pause in strikes on Iranian energy assets. European markets reversed earlier losses, and US indices finished higher.
Gains eased after Iranian officials said no negotiations had taken place. Even so, the S&P 500 closed up 1.2%, the Russell 2000 rose 2.3%, and the Stoxx 600 gained 0.6%.
Rotation Toward Cyclicals
The move was led by cyclicals, with growth-linked areas such as technology and consumer discretionary outperforming as yields fell. Futures later dipped into negative territory the next morning.
Real estate did not recover despite lower yields and remained among the weakest sectors after a poor week. Consumer staples also failed to rebound, after falling more than industrials over the past month.
The price action suggested reduced recession concerns, while inflation and interest-rate expectations showed little change. The article notes the market response as a reversal of trades linked to geopolitical risk.
The report was produced using an AI tool and reviewed by an editor.
Lessons From The 2025 Playbook
We saw last year in 2025 how markets reacted when hopes of de-escalation between the US and Iran surfaced, causing a sharp rebound. A similar dynamic could play out in the coming weeks, as any sign of easing geopolitical tensions often triggers a rapid rotation in the market. The CBOE Volatility Index (VIX), which often spikes during conflict, has historically dropped over 15-20% in the week following de-escalation announcements, signaling a quick return of risk appetite.
Based on the 2025 playbook, the immediate response was a rally in cyclical growth sectors like technology and consumer discretionary. Derivative traders should therefore consider buying call options on the Nasdaq 100 or specific tech ETFs to capture this potential upside. Recent trading data already shows that options volume on the Invesco QQQ Trust has increased by nearly 25% on days with positive diplomatic news flow.
It is equally important to notice what underperformed during that 2025 relief rally. Real estate and consumer staples lagged significantly, indicating that the market was still worried about inflation and interest rates. With the latest core Consumer Price Index (CPI) still stubbornly above the central bank’s target at 3.1%, these sectors remain vulnerable to persistent rate concerns.
For derivative traders, this suggests a paired strategy could be effective. One could go long on growth by purchasing call spreads on tech indices while simultaneously considering put options on rate-sensitive sectors like the Real Estate Select Sector SPDR Fund (XLRE). This approach aims to capitalize on the relief rally while hedging against the underlying inflation risk that has not gone away.
Create your live VT Markets account and start trading now.
Start trading now – Click here to create your real VT Markets account
Written on March 24, 2026 at 10:58 am, by josephine
AUD/USD fell to about 0.6980 in early European trade on Tuesday, down 0.45% on the day and below 0.7000. The move followed rising Middle East tension, with the US delaying its deadline for Iran to reopen the Strait of Hormuz by five days.
The US said it had “productive conversations” with Tehran, while Iran said there was no dialogue. Continued US-Iran conflict risk can support the US Dollar and weigh on AUD/USD.
Australia Rate Decision And Initial Market Reaction
In Australia, the Reserve Bank of Australia lifted its Official Cash Rate by 25 basis points to 4.10% at its March meeting. This was the second straight rise this year, after a 25 bps increase in February.
On the daily chart, price slipped from the 0.71 area and is now below the 20-day middle Bollinger Band near 0.7070. The Bollinger Bands are flattening and narrowing, and the RSI is in the mid-40s, below the midline.
Resistance is at 0.7065, then 0.7100, with 0.7150 above that. Support is at 0.6920, then 0.6880, with the 100-day EMA near 0.6860, and 0.6800 lower.
We recall that back in March 2025, the AUD/USD was facing pressure below the 0.7000 level due to a mix of geopolitical risks and a hawkish Reserve Bank of Australia. The situation today, March 24, 2026, presents a different dynamic for the pair, which is currently trading much lower, around 0.6540. The strong support for the Aussie we saw from the RBA last year has since faded.
The RBA’s aggressive hiking cycle of 2025, which took the cash rate to 4.10%, is now a thing of the past. The central bank has held the rate steady at 3.60% for its last three meetings, and with the latest quarterly inflation figures slowing to 3.8%, the market is no longer pricing in further hikes. This removes a key pillar of support that was present for the Australian dollar last year.
Us Dollar Strength And Broader Macro Headwinds
On the other side of the pair, the US Dollar remains strong, buoyed by a Federal Reserve that has kept its policy rate in the 4.75-5.00% range. While last year’s market driver was a specific geopolitical event, today’s concern is a broader slowdown in global growth, particularly in China, Australia’s largest trading partner. This environment generally favors the safe-haven status of the US Dollar.
Given this backdrop, we should consider strategies that benefit from further downside or range-bound price action. Buying put options with a strike price below 0.6500 could be a viable strategy to position for a potential break of recent lows. Looking at historical price action, the 0.6800 level, which was seen as a deeper retracement target in 2025, now acts as a significant long-term resistance level.
The technical picture also supports a bearish bias, similar to what we observed last year, though at lower levels. The daily RSI is struggling to climb above the 50 midline, indicating weak upward momentum. Derivative traders should watch for increases in implied volatility ahead of the upcoming Australian CPI and US employment data, as this could present opportunities to enter positions before options become more expensive.
Create your live VT Markets account and start trading now.
Start trading now – Click here to create your real VT Markets account
Written on March 24, 2026 at 9:59 am, by josephine
The US Dollar Index (DXY) traded near 99.40 in early European hours on Tuesday after recovering the prior day’s losses. Markets awaited the flash S&P Global US PMI for March for more clues on US economic conditions.
Demand for the US Dollar rose as uncertainty around the Iran conflict increased and attention turned to possible disruption of energy infrastructure. Gulf states aligned with the US were reported to be moving closer to direct involvement.
Geopolitical Risk Lifts Dollar Demand
A Wall Street Journal report said Saudi Arabia signalled a possible move towards more direct military engagement. Israel and the United States carried out further strikes on Iran, while Iran stepped up attacks on Gulf neighbours and issued threats against regional assets.
Israel said it carried out a second round of strikes on infrastructure in Tehran. Iranian military adviser Mohsen Rezaei said the conflict would continue until Iran is compensated for damages.
On Monday, the Dollar rose after President Donald Trump delayed planned strikes on Iranian energy infrastructure by five days and referred to talks with Tehran. Iran’s Foreign Minister Abbas Araghchi said no engagement with Washington had taken place.
Reuters reported that Fed official Mary Daly said sustained oil price rises could complicate the policy outlook. The US Dollar is involved in over 88% of global FX turnover, with an average of $6.6 trillion per day in 2022.
Markets Focus On Policy And Volatility
We are seeing a familiar pattern of safe-haven demand for the US Dollar, reminiscent of the tensions with Iran back when we were looking at it in 2025. At that time, geopolitical uncertainty pushed the Dollar Index to around 99.50. Today, with the index trading significantly higher near 104.20, the stakes are elevated due to renewed tensions in Eastern Europe.
The recent rise in WTI crude to over $88 a barrel directly echoes the concerns Fed officials voiced in 2025 about energy prices complicating monetary policy. The latest FOMC minutes from early March 2026 already showed a committee hesitant to signal rate cuts. This sustained price pressure will only reinforce the hawkish stance of several members.
This environment suggests traders should consider using options to manage risk and express a view on dollar strength. With the VIX index climbing back above 18, buying call options on dollar-related ETFs like UUP offers a defined-risk way to profit from further upside. This is a prudent strategy given the conflicting signals from a strong dollar and softening domestic economic data.
Traders must also watch the economic calendar, as the dollar’s strength is not guaranteed. For instance, the flash S&P Global US Services PMI for March dipped to 51.8, indicating a potential slowdown that could eventually weigh on the currency. This creates a challenging dynamic where geopolitical safety competes with underlying economic performance.
The core of the current market is uncertainty, which makes trading volatility itself an attractive strategy. Long volatility positions through VIX futures or options could perform well if geopolitical headlines continue to dominate. This allows for a market-neutral approach, betting on sharp price swings in either direction rather than just dollar strength.
Create your live VT Markets account and start trading now.
Start trading now – Click here to create your real VT Markets account
Written on March 24, 2026 at 9:59 am, by josephine
India’s HSBC Services PMI was 57.2 in March, down from 58.1 previously.
The reading remained above 50, which indicates growth in services activity.
Services Growth Moderates
The March services PMI reading of 57.2 indicates that while the services sector is still growing strongly, the pace has moderated slightly from February’s 58.1. We see this as a signal that the recent powerful upward trend in the market may be losing some momentum. This slight cooling could temper bullish enthusiasm in the coming weeks.
For equity index derivatives, this suggests that outright bullish positions might carry more risk. We believe selling out-of-the-money Nifty call options or implementing covered call strategies could be prudent to capitalize on potential range-bound price action. After the Nifty 50 rallied over 7% in the first quarter of 2026, this data supports a period of consolidation rather than continued aggressive gains.
This data also eases pressure on the Reserve Bank of India to take a more hawkish stance on interest rates. We saw how persistent inflation was a major concern for the RBI throughout 2025, but this moderating growth figure could shift their focus. This outlook makes receiving fixed rates in Overnight Index Swaps (OIS) look more appealing, pricing in a less aggressive central bank.
In the currency markets, the strong PMI number continues to provide underlying support for the Indian Rupee. However, the deceleration means that the explosive INR appreciation we witnessed earlier in the year is less likely to continue. With USD/INR one-month implied volatility now hovering around a low 4.8%, selling options to collect premium might be a more effective strategy than buying for a directional breakout.
India’s HSBC Manufacturing Purchasing Managers’ Index (PMI) fell to 53.8 in March. It had been 56.9 in the previous reading.
A PMI figure above 50 indicates expansion in manufacturing activity. The March result therefore still shows growth, but at a slower pace than before.
Manufacturing Growth Losing Steam
The drop in India’s manufacturing PMI to 53.8, while still in expansion territory, signals a significant loss of momentum from the previous month’s 56.9. This deceleration suggests that the rapid growth seen earlier in the year is now cooling, which could lead to downward revisions in corporate earnings estimates. We expect this to introduce a more cautious or bearish sentiment into the equity markets.
Considering this slowdown, traders may anticipate a pullback in equity indices like the NIFTY 50. This view is supported by recent government data showing that the Index of Industrial Production (IIP) for January 2026 also underperformed, growing by only 3.8%. A prudent strategy would be to buy put options on the NIFTY to hedge against or speculate on a potential market correction in the next few weeks.
This weaker economic data could also exert pressure on the Indian Rupee. We have already seen foreign portfolio investors turn net sellers in the first half of March 2026, pulling out approximately $500 million from Indian equities, which weakens the currency. Traders should consider buying USD/INR call options to position for a potential depreciation of the Rupee.
Looking back at a similar PMI drop in the second quarter of 2025, the market saw a rise in volatility, with the India VIX index jumping nearly 15% over the following month. This historical pattern suggests that even if the market’s direction isn’t clear, an increase in price swings is probable. This makes option strategies that profit from rising volatility, such as long straddles, more attractive.
The Reserve Bank of India will certainly take note of this slowdown ahead of its next policy meeting. While February’s consumer inflation rate of 5.1% prevents any immediate consideration of rate cuts, this report could prompt the RBI to soften its hawkish stance. Any signal of a prolonged pause in rate hikes could influence interest-rate-sensitive derivatives and banking sector stocks.