Start trading now – Click here to create your real VT Markets account
Back
Start trading now – Click here to create your real VT Markets account
Start trading now – Click here to create your real VT Markets account


Key Points
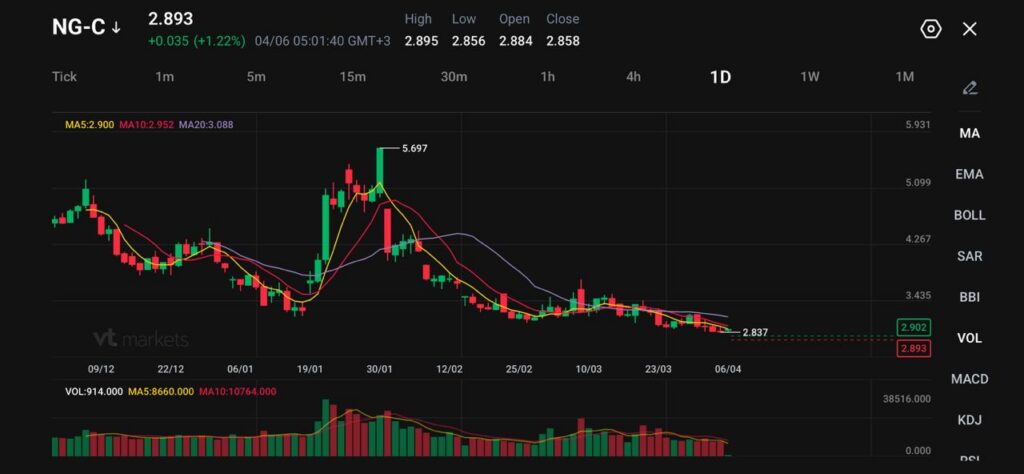
US natural gas is trying to bounce, but the broader tone remains soft. NG-C trades at 2.893, up 0.035 or 1.22%, while broader pricing sits around $2.84 to $2.89 per MMBtu. Even with the small uptick, futures are still sitting close to the weakest levels since August 2025.
Spring weather is doing most of the work. Mild temperatures are cutting heating demand just as the market shifts from winter withdrawals into refill season. That soft demand backdrop is strong enough to overpower a large part of the geopolitical premium.
A cautious near-term view still favours a heavy market unless weather turns hotter or supply tightens more clearly.
The latest storage report reinforced the bearish setup. Working gas in storage rose by 36 Bcf in the week ending March 27, taking inventories to 1,865 Bcf. For the same week, the five-year average shows a 4 Bcf withdrawal.
That contrast is the key point. At this stage of the calendar, the market would usually still be drawing gas from storage. Instead, inventories are already building. That tells traders supply is outrunning current demand by a wide enough margin to keep pressure on prices.
That is why natural gas has struggled to rally even while broader energy markets remain tense.
The geopolitical threat is still real. Trump warned that the US could strike Iranian infrastructure if the Strait of Hormuz is not reopened, and that has kept oil and global LNG markets on edge.
Henry Hub reacts differently. Oil is directly exposed to Hormuz. US natural gas is much less exposed because domestic production remains abundant and LNG export terminals are already operating near practical limits.
A global gas shock can lift sentiment, but it does not automatically create room for materially higher US exports when the export system is already close to full.
That caps the international spillover into US gas pricing.
A cautious forecast still allows for short-lived spikes on war headlines, but the market needs a domestic tightening signal before it can hold them.
The export ceiling is what keeps the market grounded. A disrupted Hormuz route threatens a large share of global crude, products, and LNG flows, which supports international gas prices. US natural gas still cannot fully capture that upside when liquefaction capacity is already near max.
Without a meaningful new export outlet, extra overseas demand does not translate into the same kind of runaway move seen in crude. Domestic balances still matter more than foreign panic.
That leaves US gas in a different category from oil. Oil is trading on the shipping shock directly. Natural gas is trading with weather, storage, and export bottlenecks first, then adding a modest geopolitical premium on top.
Natural gas (NG) is trading near 2.89, hovering just above recent lows as the market continues to struggle for direction following its sharp decline from the 5.69 peak earlier in the year. Price action remains subdued, with the latest candles reflecting weak rebounds and a lack of sustained buying interest.
The recent low around 2.83–2.84 is holding for now, but the broader structure still shows a series of lower highs and lower lows, keeping pressure on the downside.
From a technical standpoint, the trend remains bearish. Price is trading below all key moving averages, with the 5-day (2.90) and 10-day (2.95) acting as immediate resistance, while the 20-day (3.08) continues to slope downward, reinforcing the underlying weakness. The compression of price near recent lows suggests consolidation, but without a clear reversal signal, this appears more like a pause within a broader downtrend.
Key levels to watch:
In the near term, price is consolidating just above 2.84, a level that has provided recent support. A break below this zone could trigger another leg lower toward 2.80 and potentially 2.70 if selling accelerates.
On the upside, 2.95 is the first level to reclaim. A move above this could lead to a short-term recovery toward 3.10, though any upside is likely to remain corrective unless price breaks and holds above the 3.40 region.
Overall, natural gas remains under sustained bearish pressure, with weak rallies and persistent selling defining the structure. Unless buyers can reclaim key resistance levels, the bias stays tilted to the downside, with consolidation near current levels likely preceding the next directional move.
The next move depends more on domestic balance than on foreign headlines. Weather comes first, then the next EIA storage report, then any change in LNG feedgas flows.
If injections keep running this far above normal, the market can stay pinned near the lows even with oil and global LNG under pressure. If hotter forecasts arrive or output slips enough to tighten balances, natural gas can recover from the $2.84 to $2.89 area. If mild weather persists and storage continues to build early, the market may remain trapped near the recent floor at around 2.837.
Learn more about trading Energies on VT Markets here.
Why is US Natural Gas Weak Even With Iran Risk in the Background?
US natural gas is trading more off domestic fundamentals than Middle East headlines. Mild weather has reduced heating demand, storage is building early, and LNG export capacity is already near full use. That combination has limited the risk premium.
What is the Main Reason Prices Are Near Their Lowest Since August 2025?
The biggest reason is loose supply-demand balance. The market is moving out of winter with weak weather demand, while inventories are already rising instead of falling.
What Did the Latest Storage Report Show?
The latest EIA data showed a 36 Bcf injection for the week ending March 27, compared with a five-year average 4 Bcf withdrawal for the same period. That is a much looser result than normal for this time of year.
Why Does a 36 Bcf Injection Matter So Much?
It shows supply is comfortably outpacing demand. At this stage of the calendar, traders would usually expect storage to still be drawing down or at least building more slowly.
Why is Natural Gas Not Rallying Like Oil?
Oil is directly exposed to Hormuz disruption. US natural gas is less exposed because domestic production is strong and LNG export terminals are already operating near maximum capacity. Global gas stress helps sentiment, but it does not translate into unlimited extra US demand.
Start trading now – Click here to create your real VT Markets account
Start trading now – Click here to create your real VT Markets account
Start trading now – Click here to create your real VT Markets account
Start trading now – Click here to create your real VT Markets account
Start trading now – Click here to create your real VT Markets account
Dear Client,
Please note that the dividends of the following products will be adjusted accordingly. Index dividends will be executed separately through a balance statement directly to your trading account, and the comment will be in the following format “Div & Product Name & Net Volume”.
Please refer to the table below for more details:
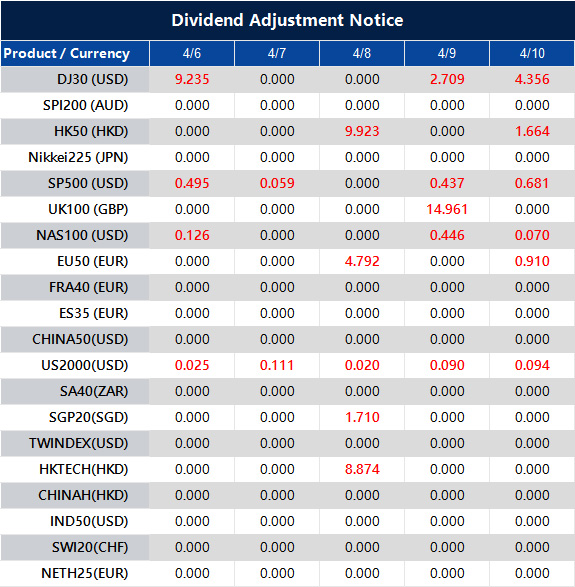
The above data is for reference only, please refer to the MT4/MT5 software for specific data.
If you’d like more information, please don’t hesitate to contact [email protected].
Start trading now – Click here to create your real VT Markets account
Start trading now – Click here to create your real VT Markets account
Hello there 👋
Hello there 👋
Scan the QR code with your smartphone to start a chat with us, or click here.
Don’t have the Telegram App or Desktop installed? Use Web Telegram instead.


