The US, Iran and regional mediators are discussing terms for a possible 45-day ceasefire that could lead to an end of fighting, Bloomberg reported on Monday, citing Axios. The report said the chance of reaching a deal over the next 48 hours is low.
US President Donald Trump extended his deadline by 20 hours. He set a new deadline for Tuesday at 8:00pm EST.
At the time of press, WTI was down 0.95% on the day at $102.85.
Ceasefire Talks And Near Term Oil Reaction
We are seeing a familiar pattern with the current Mideast peace talks. Looking back at a similar situation in 2025, we saw that even the remote possibility of a ceasefire caused WTI to dip below $103 a barrel. This precedent suggests that any credible sign of de-escalation will put immediate downward pressure on crude prices in the coming weeks.
With WTI currently trading around $95 a barrel as of April 2026, the market is already pricing in a significant geopolitical risk premium. The latest EIA report showed a surprise crude inventory build of 2.1 million barrels, a bearish signal that would amplify any price drop caused by a peace deal. A successful agreement would likely remove the risk premium on top of an already softening physical market.
Options Positioning And Volatility Signals
The market’s nervousness is reflected in the CBOE Crude Oil Volatility Index (OVX), which is trading near 45, well above its historical average. This makes buying put options on WTI or Brent futures an attractive strategy to profit from a sudden price drop if a deal materializes. Selling out-of-the-money call spreads is another way to capitalize on falling prices while benefiting from the high implied volatility.
However, we must also weigh the significant risk of talks collapsing, which could send prices surging back above $100 almost instantly. The failure of the 2025 talks ultimately led to a sharp rally in the following quarter. Therefore, maintaining some exposure through long-dated call options could serve as a crucial hedge against a sudden breakdown in negotiations.
Create your live VT Markets account and start trading now.
Start trading now – Click here to create your real VT Markets account
Gold prices in Malaysia fell on Monday, based on FXStreet data. Gold was priced at MYR 602.19 per gram, down from MYR 606.60 on Friday, and at MYR 7,023.76 per tola, down from MYR 7,075.24.
Other listed prices were MYR 6,021.98 for 10 grams and MYR 18,730.08 per troy ounce. FXStreet calculates Malaysian gold prices by converting international prices using the USD/MYR rate and local units, with daily updates at publication time.
Gold As A Store Of Value
Gold has long been used as a store of value and as a medium of exchange, and it is commonly bought during periods of market stress. It is also used as a hedge against inflation and currency weakness.
Central banks are the largest holders of gold and may buy it to diversify reserves. In 2022, central banks added 1,136 tonnes of gold worth about $70 billion, the highest annual purchase on record.
Gold often moves in the opposite direction to the US Dollar and US Treasuries. It can also move with changes in interest rates, geopolitical risk, recession concerns, and shifts in the US Dollar because gold is priced in dollars (XAU/USD).
While gold saw a minor price drop in Malaysian Ringgit, we see this as short-term noise within a much larger bullish trend. Broader market forces, including shifting interest rate expectations and ongoing geopolitical tensions, are the key drivers to watch. Derivative traders should focus on these macro indicators rather than daily fluctuations in a single currency.
Trading Outlook And Strategy
The US Federal Reserve’s dovish pivot, which we observed intensifying after its March 2026 meeting, is crucial for gold’s outlook. As a non-yielding asset, gold becomes more attractive when interest rates fall, reducing the opportunity cost of holding it. This environment suggests that buying call options or establishing long futures positions could be favorable strategies in the coming weeks.
We must not ignore the relentless demand from central banks, which provides a strong price floor. Looking back from our current perspective, they added a record-breaking 1,037 tonnes in 2023, a trend that continued strongly through 2024 and 2025 with emerging economies leading the purchases. This consistent buying pressure suggests any significant price dips will likely be viewed as buying opportunities by major institutions.
The inverse relationship with the US Dollar remains a key factor for traders to consider. The Dollar Index has recently fallen below 102 as rate cut expectations solidify, providing a direct tailwind for gold, which is now trading near $2,450 per ounce. With the latest Q1 2026 US inflation data remaining sticky around 3.1%, gold’s role as an inflation hedge is also supporting its price.
Implied volatility in gold options has been elevated, reflecting ongoing uncertainty in several global hotspots. Traders could consider strategies like bull call spreads to capitalize on expected upside while defining their risk and capping their initial cost. This approach allows participation in a rally while managing risk in what has been a volatile market since the run-up we saw in 2024.
Create your live VT Markets account and start trading now.
Start trading now – Click here to create your real VT Markets account
The US, Iran and regional mediators are discussing terms for a possible 45-day ceasefire that could lead to an end of fighting, Bloomberg reported on Monday, citing Axios. The report said the chance of reaching a deal within the next 48 hours is low.
US President Donald Trump extended his deadline by 20 hours, setting a new deadline for Tuesday at 8:00pm EST.
Ceasefire Talks And Market Reaction
At the time of publication, WTI was down 0.95% on the day at $102.85.
We recall the tensions in 2025 when WTI crude pushed past $102 amid talk of a direct conflict between the US and Iran. The possibility of a 45-day ceasefire introduced immense volatility as traders priced in a sudden collapse of the war risk premium. This serves as a key reminder of how quickly Middle East diplomacy can whipsaw energy markets.
As of today, with WTI trading at a more subdued $92.50, the market appears less concerned but we see this as a warning. The CBOE Crude Oil Volatility Index (OVX) is hovering near 35, significantly below the peaks above 50 that we saw during last year’s diplomatic deadlines. This suggests options are relatively cheap for hedging against a sudden return of hostilities.
Given the recent shipping disruptions near the Strait of Hormuz and OPEC+ maintaining its production cuts of 2.2 million barrels per day, the fundamental support for oil remains strong. We should consider buying out-of-the-money call options expiring in the next 60 to 90 days. This strategy offers a low-cost way to capture significant upside if geopolitical tensions flare up unexpectedly.
Hedging Strategy And Macro Risks
However, we must also watch for signs of weakening global demand, as the Federal Reserve appears committed to its 5.25% interest rate to fight persistent inflation. This economic pressure could place a ceiling on any potential rally, making bull call spreads a prudent way to structure a trade. This approach would help finance the position and define risk in case a diplomatic breakthrough sends prices lower.
Create your live VT Markets account and start trading now.
Start trading now – Click here to create your real VT Markets account
Crude remains the lead signal, Brent trades near $107 and WTI near $112 after an 11% weekly surge.
Tuesday 8pm ET Iran peace talks set the first directional move across USOil, USDX, SP500, XAUUSD and BTCUSD.
US Core PCE on Thursday and US CPI on Friday decide whether inflation fears harden into tighter rates pricing.
March NFP beat expectations at 178,000 versus 65,000, but revisions and household data still signal an uneven trend.
Markets are not treating this as a one-day headline spike. Traders keep pricing the Strait of Hormuz as the transmission channel for the entire macro story. Partial vessel passage does not equal a stable reopening of commercial energy flows, so the risk premium stays embedded in crude.
The clearest consequence shows up in the oil tape. Brent trades near $107 heading into the week, while WTI settled near $112 after a holiday-shortened week that delivered a gain of a little under 11%. The directional bias stays upward on any escalation headline, with the strike pause set to expire Tuesday evening ET and no ceasefire framework in place.
When oil stays elevated, traders stop reading the conflict as a standalone geopolitical story. The market begins to price second-order effects, higher transport costs, stickier inflation prints, and less room for policy relief.
Trump has made the timing harder for markets to dismiss. His latest comments tied the next phase of the conflict directly to the Strait of Hormuz, with a Tuesday evening deadline and the threat of fresh strikes on Iranian infrastructure if passage is not restored.
President Trump threatened to rain ‘hell’ on Tehran if it did not make a deal and reopen the Strait of Hormuz by his April 7 deadline, as he praised US special forces who rescued an airman in a high-risk mission from deep inside Iran https://t.co/1D0whPbsMRpic.twitter.com/sCCcAEcDBj
At the same time, he kept the door open to a deal. That mix of pressure and conditional diplomacy helps explain why traders are reluctant to fade the oil premium too quickly. Every hint of negotiation offers temporary relief, but each harder line pulls crude, the dollar and broader risk sentiment back toward defence.
Markets recoiled as war jitters over Iran deepened, with stocks sliding, oil surging well over $100 per barrel and the dollar firming after US President Trump dashed hopes for clarity on when the Middle East conflict might end https://t.co/O6kuzQd3d4pic.twitter.com/jkY8zyPZ8K
That also sharpens the sequence for the rest of the week. The focus is no longer just the war in broad terms, but whether the Strait itself becomes the trigger for the next move. If the rhetoric cools and diplomacy gains traction, crude can unwind and risk assets can stabilise.
If the deadline passes with the same aggressive tone, the market is more likely to treat elevated oil as a lasting inflation problem rather than a short-lived geopolitical spike. That keeps pressure on equities, supports USDX, and gives Core PCE and CPI even more weight than usual.
A Jobs Beat That Calms Growth Fear, but Tightens the Policy Setup
March nonfarm payrolls printed at 178,000 versus a 65,000 median expectation. January was revised up to 160,000, while February was revised down to negative 133,000. The headline looks strong, but the internal picture looks mixed. Combined revisions read uneven rather than accelerating.
Household data adds friction. The labour force fell, and total employment declined, while unemployment dipped slightly. Wage growth continued, but slowed, and the average workweek slipped, a pattern often seen before layoffs rise.
This setup shifts the macro balance. Payroll growth remains positive, and unemployment remains low, so the imminent labour-driven recession risk falls. At the same time, an energy shock raises inflation risk and complicates any near-term easing narrative.
Tuesday’s 8 pm ET Deadline is the First Gate for Risk
Tuesday’s Iran peace talks at 8pm ET act as the first event that can reset the week’s tone. Four broad paths sit in front of markets:
De-escalation and improved Hormuz signals can drive crude sharply lower and lift equity futures.
A status quo open allows a brief relief bid off the NFP headline, while energy stays elevated.
Escalation into the deadline can push crude higher again and pressure risk assets, particularly rate-sensitive and consumer areas.
A nervous, weaker open can develop even without new escalation as traders fade risk into the deadline.
This week does not begin with CPI. It begins with whether the oil premium expands or contracts.
Read more about Trump and how his statements have been affecting market movements here.
Core PCE and CPI Decide Whether the Oil Shock Spreads
Thursday brings US Core PCE Price Index m/m at 0.4% forecast versus 0.4% previous, alongside final GDP q/q at 0.7% forecast versus 0.7% previous. Friday follows with US CPI y/y at 3.4% forecast versus 2.4% previous.
Inflation data sits in a different context when crude stays bid. A firm print can harden rates pricing and keep the dollar supported. A softer print can open the door for risk assets to stabilise, but that relief tends to fade if oil remains elevated.
Cross-Asset Read Heading Into the Week
The dollar stays the cleanest read on defensive positioning when the market prices conflict risk and higher-for-longer policy bias. Gold stays pulled between safe-haven demand and a firmer dollar backdrop. Equities attempt to rebound, but oil and inflation risk keep pressure on the follow-through. Crypto behaves like risk, with the next impulse tied to whether the week opens with relief or stress.
Key Symbols to Watch
USDX | USOil | XAUUSD | SP500 | BTCUSD
Key Events of the Week
Date
Currency
Event
Forecast
Previous
Analyst Remarks
07 Apr
USD
Result of Iran Peace Talks (8pm EST)
N/A
N/A
Oil reaction sets the week’s tone for USDX and risk.
08 Apr
NZD
Official Cash Rate
2.25%
2.25%
Watch guidance for NZD volatility, not the hold itself.
09 Apr
USD
Core PCE Price Index m/m
0.40%
0.40%
A firm print supports USDX and keeps rates sticky.
09 Apr
USD
Final GDP q/q
0.70%
0.70%
Confirms the growth pulse entering the oil shock.
10 Apr
USD
CPI y/y
3.40%
2.40%
Hot CPI can harden the higher-for-longer tone quickly.
For a full view of upcoming economic events, check out VT Markets’ Economic Calendar.
Key Movements Of The Week
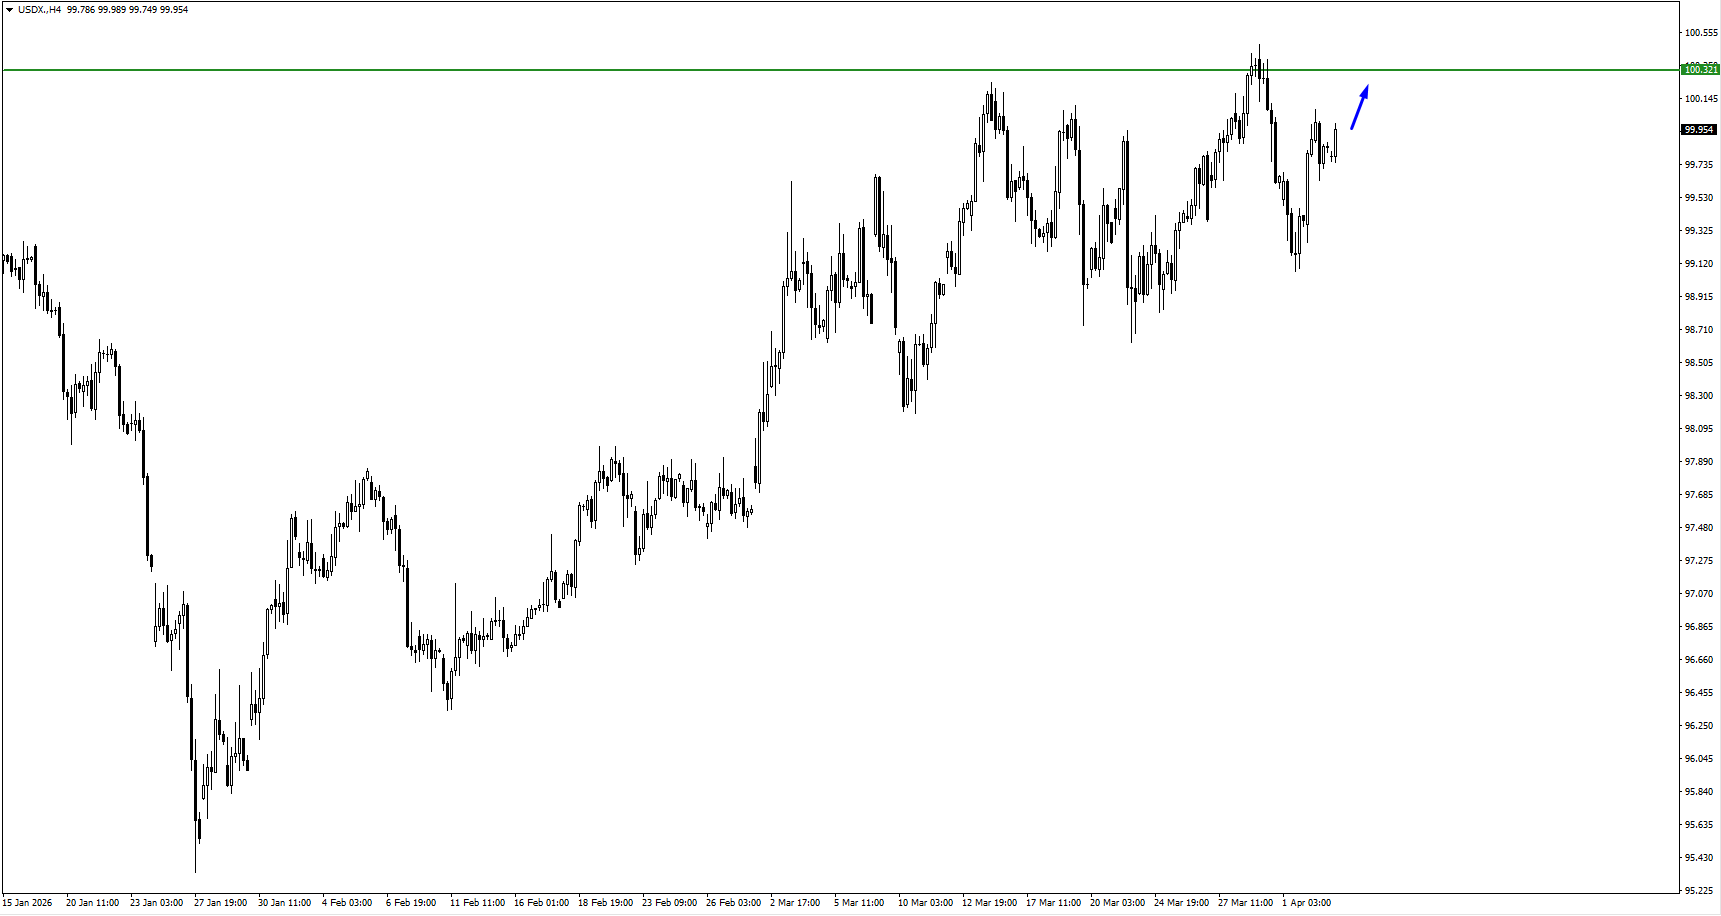
USDX
Price holds firm as traders price the Tuesday 8pm EST deadline into rates expectations.
Thursday’s Core PCE is the first inflation checkpoint before CPI resets the week.
A calmer oil tape after peace talks would be the clearest way to soften the bid.
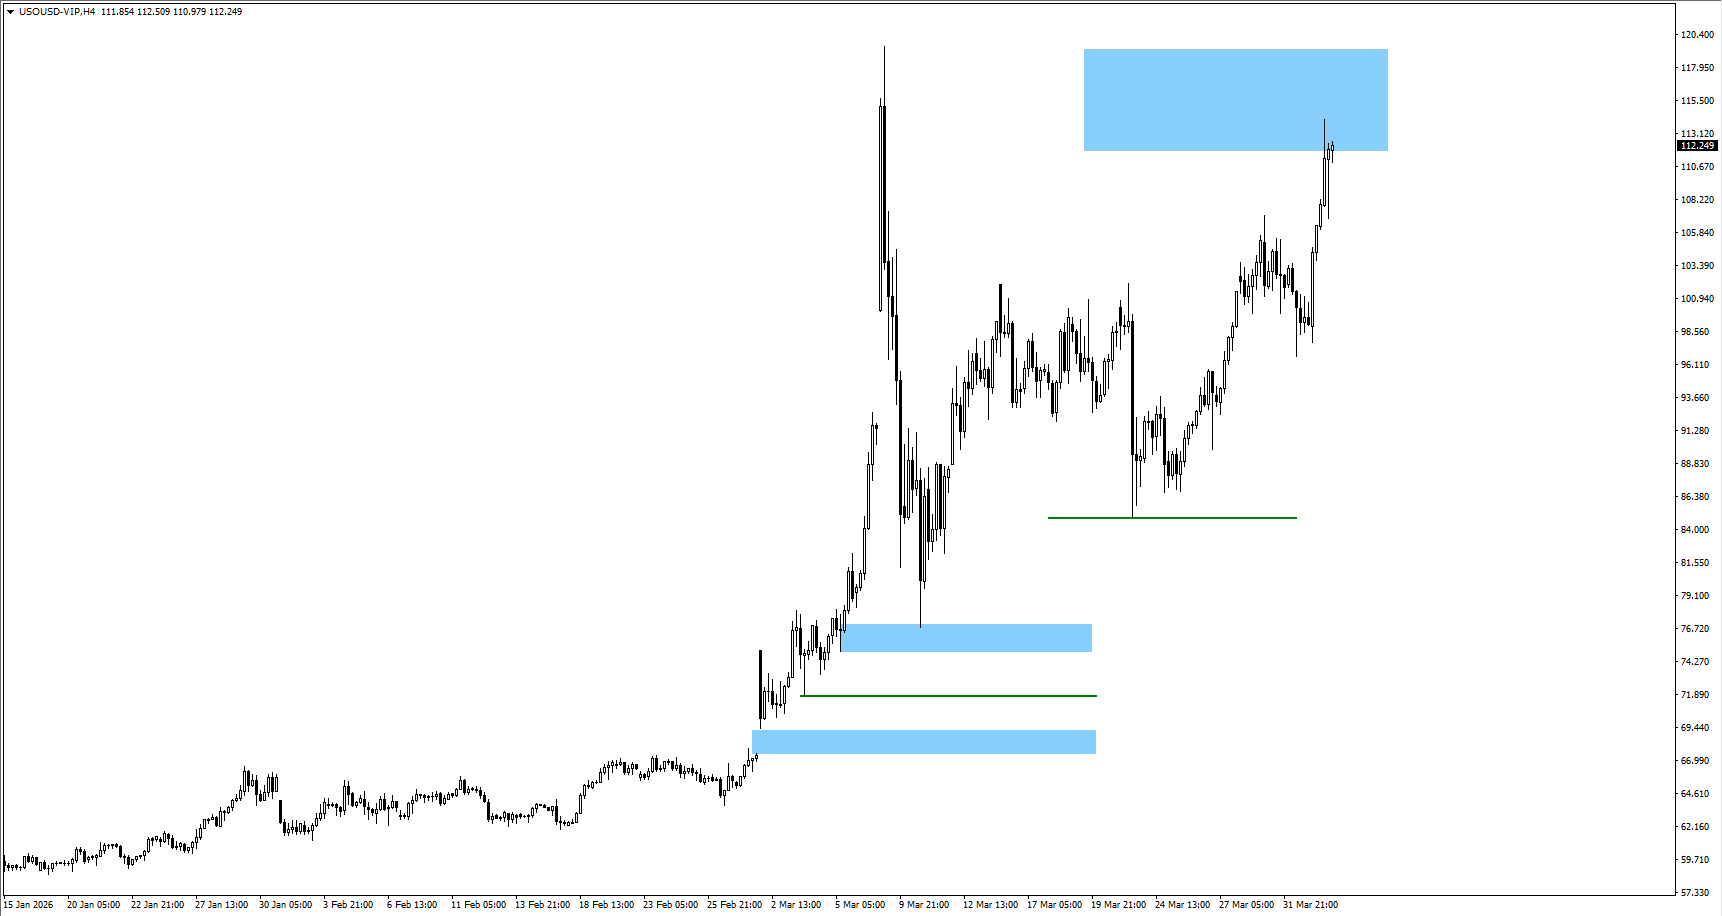
USOil
Price stays elevated with supply fears tied to Hormuz and the Tuesday deadline.
A de-escalation headline can trigger a fast retracement, but it needs follow-through.
If crude holds above $110 into CPI, inflation risk stays live across assets.
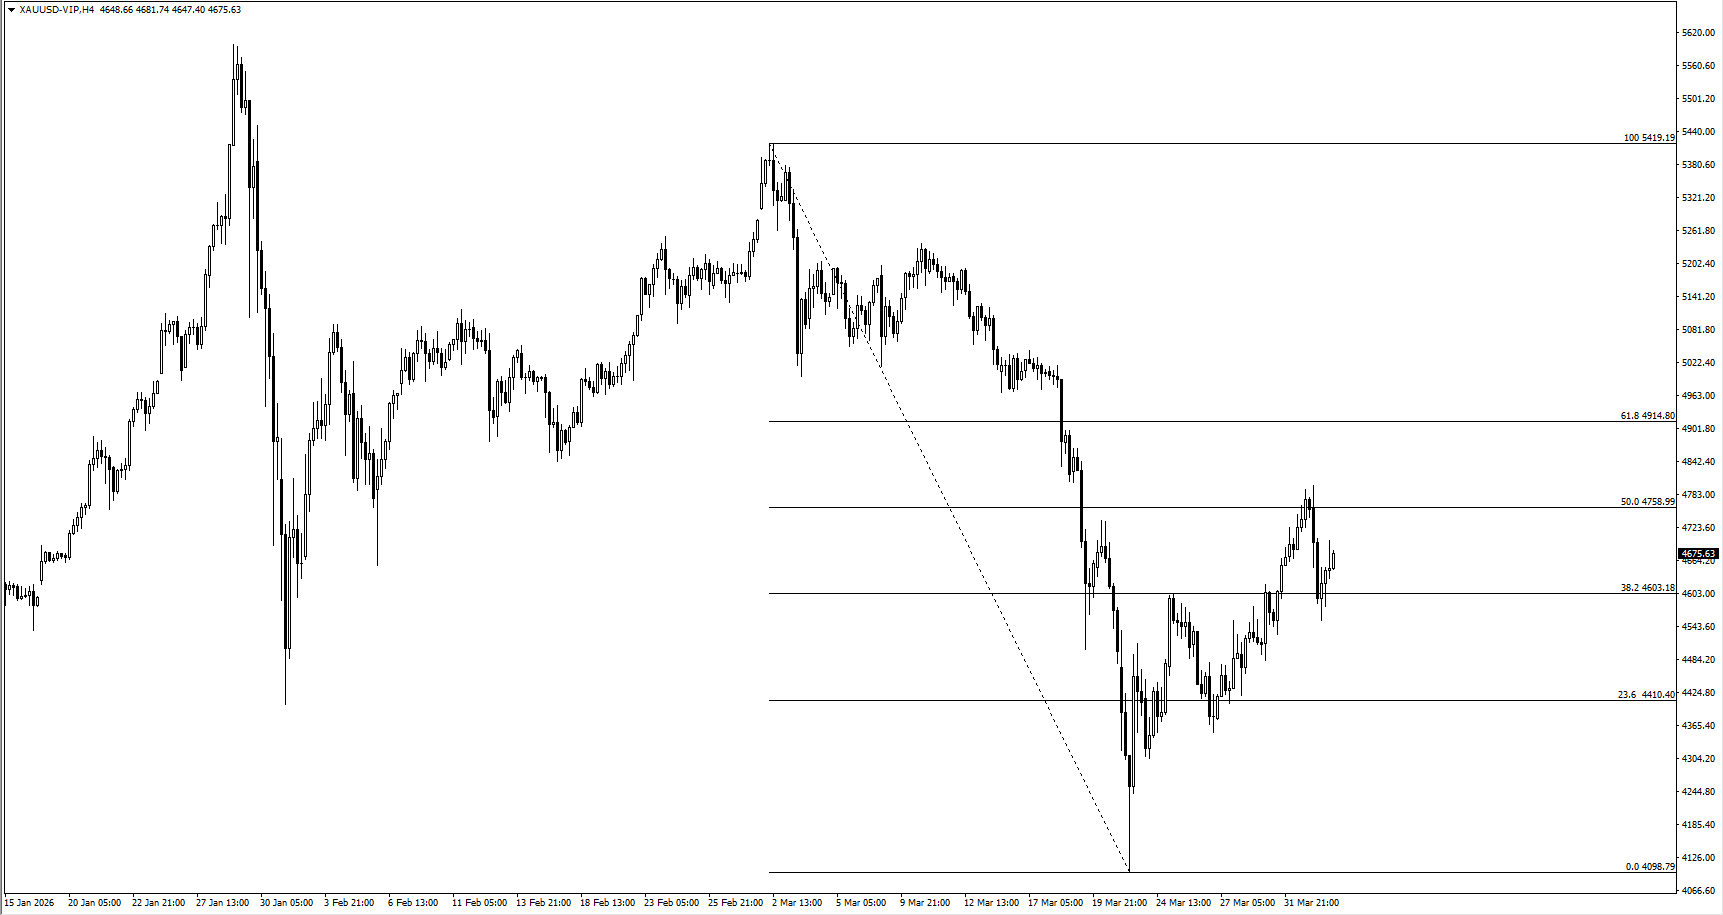
XAUUSD
Gold softened as USD strength and yields reduced rate-cut hopes.
Tuesday headlines matter because oil drives the inflation hedge impulse.
CPI can quickly change demand if it validates broader inflation pressure.
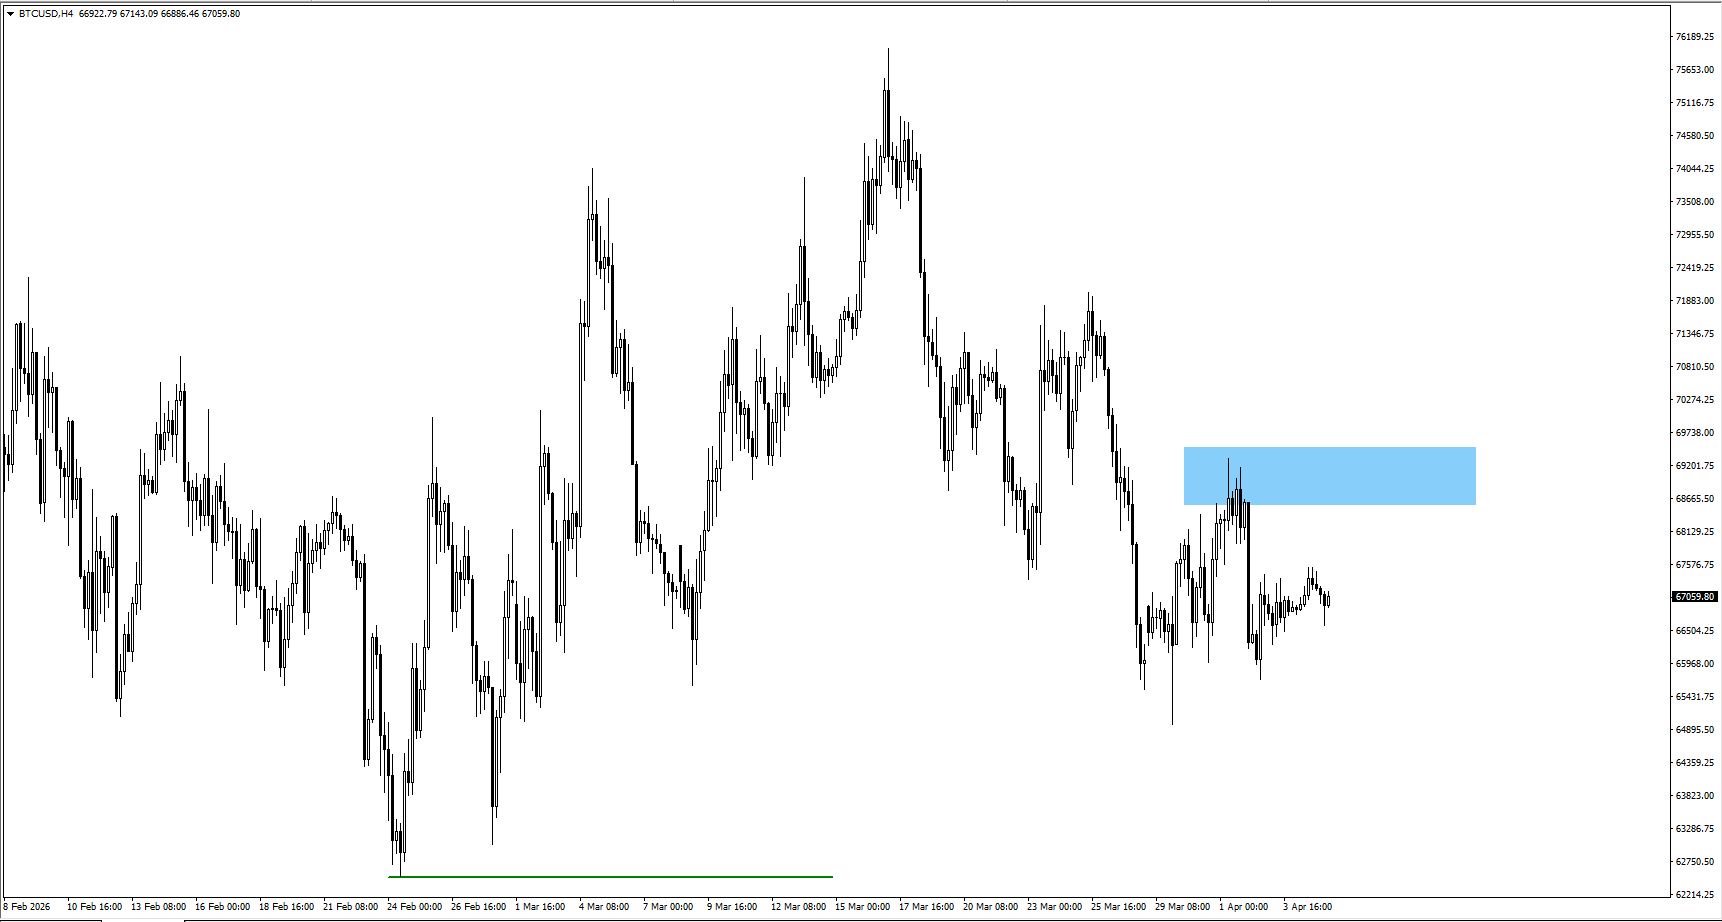
BTCUSD
BTCUSD remains headline-sensitive as macro risk swings liquidity appetite.
A softer inflation tone after CPI would be a tailwind if oil also eases.
A renewed oil spike tends to tighten conditions and pressure risk exposure.
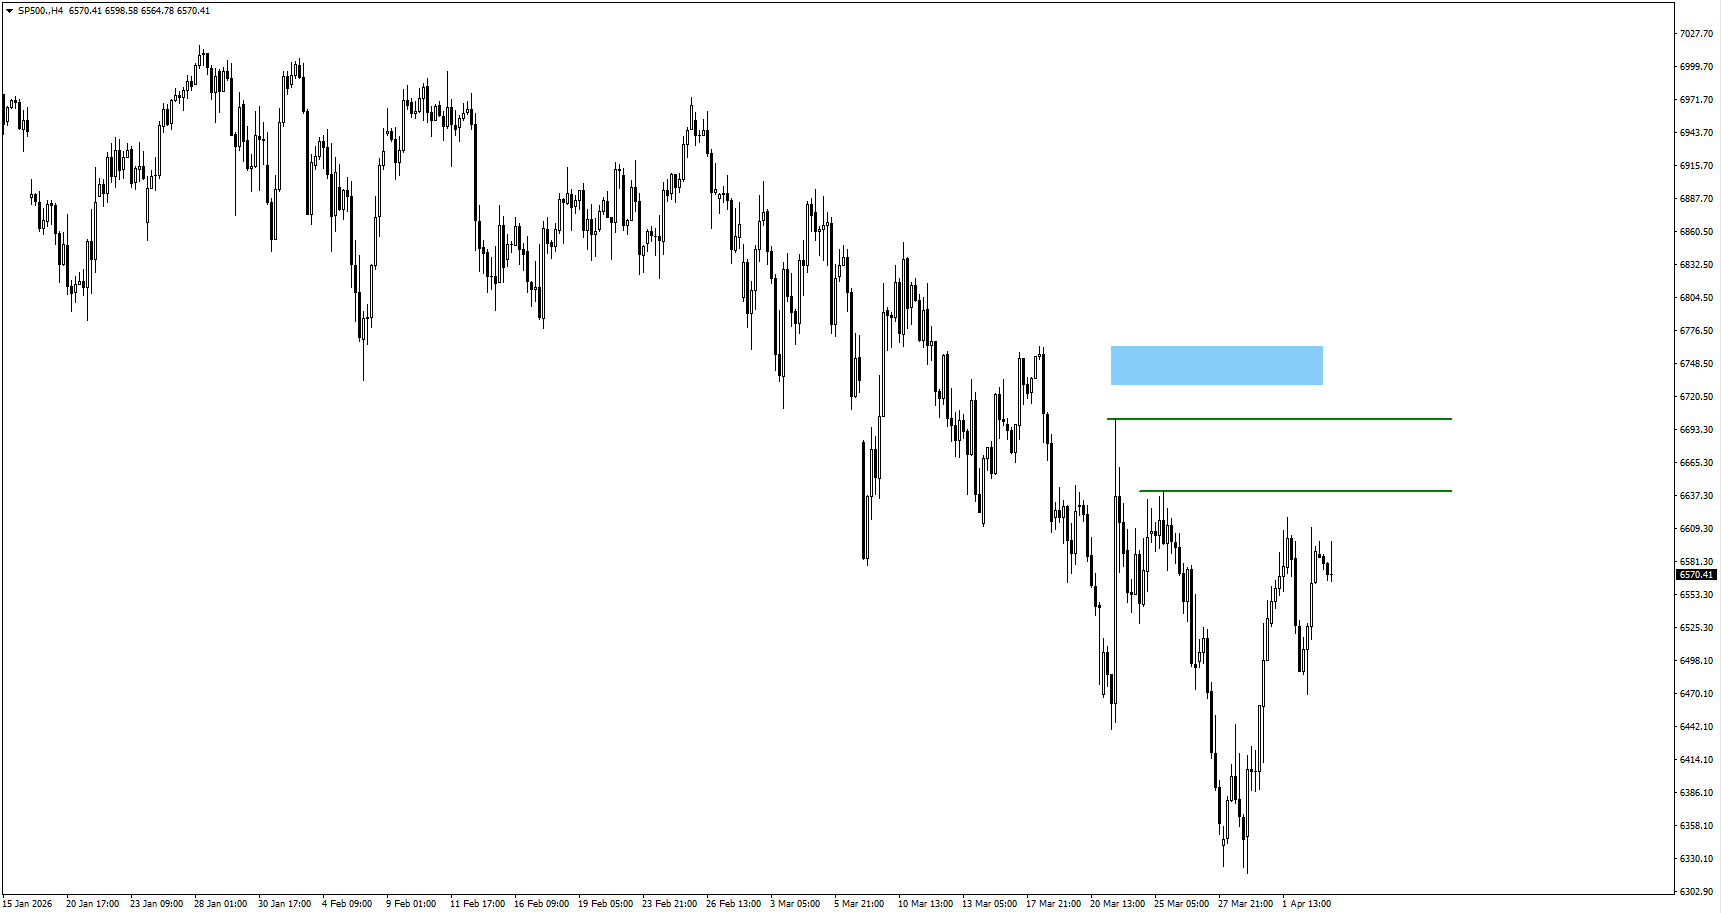
SP500
Rebound attempts face a simple ceiling while crude stays high and CPI looms.
A relief path starts with oil cooling after Tuesday’s peace talk outcome.
Hot CPI can revive the higher-for-longer trade and cap equity follow-through.
Bottom Line
This week still runs through the same sequence: oil first, then inflation, then rates. Tuesday’s 8pm EST Iran peace talks are the first real trigger because they can unwind or extend the crude risk premium that is driving the broader cross-asset tone.
If oil stays elevated into Thursday’s Core PCE and Friday’s CPI, markets will find it harder to price a clean easing path, which keeps USDX supported and caps confidence in SP500 and higher-beta risk.
If headlines cool and inflation data comes in calmer than feared, the market gets room to pivot toward relief, but the burden of proof sits with crude and the inflation prints.
Create a live VT Markets account today to access our platform features, including market insights and educational content.
Trader Questions
What Is The Market Actually Pricing Around The Iran Peace Talks?
Markets are pricing the risk premium in crude first. If the talks reduce supply anxiety, USOil can retrace and SP500 can breathe. If they fail, elevated oil keeps inflation expectations firm and supports USDX.
Why Do Core PCE And CPI Matter More When Oil Is High?
Higher oil feeds headline inflation quickly and can spill into inflation expectations. Core PCE helps show whether underlying price pressure is cooling or staying sticky. If both Core PCE and CPI run firm, traders tend to push back rate-cut bets and keep the dollar bid.
How Can Traders Read The Cross-Asset Signal Without Overthinking It?
Start with USOil, then check USDX, then SP500. If oil stays high and USDX stays firm, conditions are still defensive and risk rallies struggle to follow through. If oil cools and USDX softens, SP500 and BTCUSD usually get cleaner upside air.
What Are The Key Levels Traders Usually Watch This Week?
Traders will keep an eye on whether BTCUSD can accept above 71,000, whether USDX can hold around the 100 area, and whether USOil can stay supported near 112. XAUUSD tends to react most sharply after CPI when the market reprices inflation and rates.
Start trading now – Click here to create your real VT Markets account
Asian share markets began the week mixed, with trading cautious due to the risk of wider tensions in the Middle East. US President Donald Trump said the US could destroy Iran’s civilian infrastructure, including power plants and bridges, if the Strait of Hormuz is not reopened by Tuesday.
Iran said transit through the Strait of Hormuz could resume if part of the revenue is used to compensate Iran for war-related damages. Ali Akbar Velayati, an adviser to Supreme Leader Mojtaba Khamenei, said the Bab el-Mandeb Strait in the Red Sea could be targeted, raising concerns about disruption to major trade routes.
Higher crude oil prices have continued amid geopolitical uncertainty, adding to inflation concerns. A strong US Nonfarm Payrolls report on Friday reduced expectations of near-term US interest rate cuts, and markets are now pricing a higher chance of a rise in borrowing costs by the end of this year.
Japan’s Nikkei 225 and South Korea’s Kospi were up about 1% at the time of writing. Indonesia’s IDX Composite and Malaysia’s KLCI were lower, with thinner liquidity linked to the Easter Monday holiday in many global markets.
We remember the tensions surrounding the Strait of Hormuz in 2025, which serve as a key reminder of how quickly geopolitics can impact markets. That situation, coupled with the Red Sea disruptions we’ve seen since, creates a foundation of persistent risk. This background of instability is why the CBOE Crude Oil Volatility Index (OVX) is currently elevated, trading near 35, indicating trader expectations for significant price swings.
Given this environment, a primary focus should be on crude oil derivatives. With Brent crude holding firm around $88 per barrel, purchasing long-dated call options offers a hedge against a sudden supply shock that could send prices over $100. This provides upside exposure while defining risk, a prudent strategy when tensions could flare up without warning.
This uncertainty extends to the broader equity markets, keeping the VIX hovering around a nervous level of 18. We saw how the market reacted to the strong NFP data last year, which pushed back rate cut expectations, and that sentiment lingers. Traders should consider buying protective put options on major indices like the S&P 500 to safeguard portfolios against a sudden risk-off move.
The Federal Reserve’s position remains a critical factor, as last year’s events helped solidify a higher-for-longer rate environment. With the latest March CPI data showing inflation remains sticky at 3.1%, the market is now pricing in less than a 40% chance of a rate cut before the third quarter. This outlook supports strategies using interest rate futures to bet on rates remaining at their current cycle highs through the summer.
This dynamic continues to strengthen the US dollar, which acts as a safe haven during global uncertainty. The combination of geopolitical risk and a hawkish Fed makes long positions on the dollar attractive. We can express this view through call options on the U.S. Dollar Index (DXY) or by shorting currencies sensitive to energy prices and risk sentiment.
Start trading now – Click here to create your real VT Markets account
AUD/USD traded near 0.6910 during Asian hours on Monday, after two days of losses. The daily chart shows the pair remains in a descending wedge, with lower highs and lower lows narrowing, which can point to easing selling pressure and a potential upside break.
The 14-day RSI is near 43, which keeps the tone bearish. The pair is also below the nine-day EMA and the flatter 50-day EMA, adding to the near-term downside bias.
Support is at the 11-week low of 0.6833, set on 30 March, followed by the wedge floor near 0.6810. If price breaks below the wedge, focus may shift towards the 0.6400 rebound support zone.
Resistance sits at the nine-day EMA of 0.6918, then the 50-day EMA at 0.6958 near the wedge top. A sustained break above this area may open a move towards 0.7187, the highest level since June 2022, reached on 11 March.
We recall watching this exact setup back in March 2025, where the AUD/USD was coiling within a descending wedge around the 0.6900 level. The conflicting signals from the RSI and the moving averages at that time created significant uncertainty for the pair’s direction.
That pattern ultimately resolved to the downside later in 2025, with the pair breaking below the 0.6810 wedge support and eventually finding a floor near the 0.6450 level in the fourth quarter. The bearish momentum we saw a year ago played out as concerns over global growth weighed on the Aussie dollar. We have since seen a slow grind higher, bringing us to today’s price of around 0.6750.
Looking at today, April 6, 2026, the key driver is now central bank policy divergence. The latest Australian CPI data for March 2026 came in at a stubborn 3.1%, keeping the Reserve Bank of Australia hesitant to signal any rate cuts. Meanwhile, U.S. inflation has cooled to 2.8%, prompting Federal Reserve officials to guide the market towards a possible rate cut in the third quarter.
This divergence in policy suggests potential strength for the AUD relative to the USD in the coming months. Therefore, buying out-of-the-money call options could be a prudent strategy to capture this expected upside with limited risk. For example, traders could look at June 2026 calls with a strike price of 0.6850.
Conversely, downside risks from slowing Chinese industrial demand, which has kept iron ore prices from rallying, cannot be ignored. To hedge against a sudden drop, purchasing put options with a 0.6600 strike for May 2026 would offer protection. This strategy becomes more attractive if the pair fails to break above the recent resistance at 0.6780 this week.
Start trading now – Click here to create your real VT Markets account
Asian equities started the week mixed as traders monitored the chance of extra conflict in the Middle East. US President Donald Trump said Iran’s civilian infrastructure, including power plants and bridges, could be destroyed if the Strait of Hormuz is not reopened by Tuesday.
Iran said traffic through the Strait of Hormuz could resume if part of the revenue is set aside to cover war-related damages. Ali Akbar Velayati, an adviser to Iran’s Supreme Leader Mojtaba Khamenei, said the Bab el-Mandeb Strait in the Red Sea could also be targeted.
Market Impact And Risk Sentiment
These developments raised concerns about disruption to major trade routes and pressured risk appetite. Elevated crude oil prices continued to add to inflation worries.
A strong US Nonfarm Payrolls report on Friday reduced expectations for a near-term Federal Reserve rate cut. Markets moved towards a higher probability of a US rate rise by the end of the year.
Japan’s Nikkei 225 and South Korea’s Kospi were about 1% higher. Indonesia’s IDX Composite and Malaysia’s KLCI were lower, with thinner liquidity due to Easter Monday holidays in many global markets.
Given the rising tensions surrounding key maritime chokepoints, market volatility is our primary concern and opportunity. The current environment, driven by geopolitical threats and hawkish central bank signals, suggests we should prepare for significant price swings across asset classes. We will need to use derivatives to both hedge existing risk and position for these expected movements.
Energy Exposure And Hedging
The threats to the Strait of Hormuz, through which over 20% of global petroleum liquids pass, make energy markets particularly sensitive. Looking back to the attacks on Saudi oil facilities in 2019, we saw how quickly crude prices can spike over 15% in a single day on supply disruption fears. We should consider long positions in WTI or Brent crude futures, or use call options to capitalize on potential price surges while defining our risk.
This combination of potential oil shocks and the prospect of a Fed rate hike is a significant headwind for equities. Higher energy costs squeeze corporate margins, while higher interest rates make future earnings less valuable. We should therefore consider buying protective put options on broad market indices like the S&P 500 to hedge our long-only portfolios against a potential downturn.
The market’s fear gauge, the VIX, is already elevated and could climb higher if threats escalate into action. We saw the VIX surge above 40 during past periods of intense geopolitical stress, and similar levels are possible now. Using VIX call options or futures allows for a direct bet on rising market anxiety and can serve as an effective portfolio hedge.
Friday’s strong NFP report has completely altered the interest rate outlook, removing expectations for any near-term cuts. Current pricing in the Fed funds futures market now shows a greater than 65% probability of a rate hike by the end of the year, a stark reversal from just weeks ago. This outlook suggests we should consider strategies that benefit from rising yields, such as shorting 10-Year Treasury note futures.
Create your live VT Markets account and start trading now.
Start trading now – Click here to create your real VT Markets account
AUD/USD traded near 0.6910 in Asian hours on Monday after two days of losses. The daily chart shows the pair still moving within a descending wedge, with lower highs and lower lows drawing closer together.
The 14-day RSI is near 43, pointing to a bearish tilt. The pair remains below the nine-day EMA and the flatter 50-day EMA, which keeps the near-term direction negative.
Key Support Levels
Support is at the 11-week low of 0.6833 set on March 30, then the wedge base near 0.6810. A drop below the wedge could push the pair towards the 0.6400 rebound support area.
Resistance is at the nine-day EMA at 0.6918, then the 50-day EMA at 0.6958 near the wedge top. A clear move above this area could open a test of 0.7187, the highest level since June 2022, reached on March 11.
Looking back at the analysis from early April 2025, we saw the AUD/USD pair trapped in a descending wedge pattern around 0.6910. The conflicting signals from the chart pattern and momentum indicators like the RSI suggested the market was at a critical inflection point. This period of indecision highlighted a market that was building energy for a significant move.
That wedge formation ultimately resolved to the upside later in 2025, a move driven by consistently strong iron ore prices and a Reserve Bank of Australia that remained more hawkish than anticipated. We have since left those levels far behind, with the pair now trading around 0.7350 as of today, April 6, 2026. This history shows how a technical setup, once decisively broken, can initiate a long-term trend.
Options Strategy Considerations
With Australia’s Q1 2026 inflation recently reported at a stubborn 3.5%, we believe the RBA will maintain its firm policy stance, providing a tailwind for the Aussie dollar. Derivative traders should consider buying call options with strike prices near 0.7450 to position for further upside in the coming weeks. This strategy provides a defined-risk way to capture potential gains if the trend continues.
However, we must acknowledge the uncertainty surrounding the US Federal Reserve after last week’s mixed jobs report showed slowing wage growth. To hedge against a potential surprise strengthening of the US dollar, purchasing out-of-the-money put options with a strike price around 0.7200 offers a cost-effective insurance policy. This protects against a sharp reversal in the AUD/USD pair.
For those who simply expect a big move but are unsure of the direction, implied volatility is a key consideration. Given the policy tension between the RBA and the Fed, establishing a long strangle by buying both a call option and a put option could be effective. This strategy will profit from a significant price swing in either direction before the options expire.
Create your live VT Markets account and start trading now.
Start trading now – Click here to create your real VT Markets account
USD/JPY dipped slightly to about 159.55 in Monday’s Asian session as the US Dollar eased, with the US Dollar Index near 100.15. The move came as market focus stayed on Middle East tensions and upcoming US data.
US President Donald Trump said Iran would face attacks on infrastructure if it does not reopen the Strait of Hormuz by Tuesday, 7 April at 9:00 PM Eastern time. Rising war concerns also supported demand for the Japanese Yen as a safer asset.
Us Data In Focus
Attention is on the US ISM Services PMI for March, due at 14:00 GMT. It is forecast at 55.0, down from 56.1 in February.
Technically, USD/JPY remains above the 20-day EMA near 158.90 within an ascending channel, with the channel floor near 158.10. Resistance is seen at 160.45 and near 161.00, with levels beyond 162.00 if 161.00 breaks, while a daily close below 158.10 would point towards the mid-157.00s.
The US Dollar is the world’s most traded currency, making up over 88% of global FX turnover, or about $6.6 trillion per day (2022). The Federal Reserve influences it mainly through interest rates, its 2% inflation target, and tools such as quantitative easing and quantitative tightening.
The immediate focus for us is the looming April 7th deadline regarding the Strait of Hormuz. Geopolitical risk is causing a sharp rise in the cost of options, with one-week implied volatility for USD/JPY climbing above 12% for the first time this year. This environment suggests traders should consider strategies that profit from a large price swing in either direction, as the outcome remains highly uncertain.
Usd Jpy Volatility And Positioning
Underlying this tension, the US Dollar remains supported by a strong fundamental backdrop. The Federal Reserve held interest rates steady in its March 2026 meeting, citing stubborn core inflation which, according to the latest data, has remained above 3% since late last year in 2025. This policy divergence with the Bank of Japan continues to provide a strong tailwind for the USD/JPY pair.
From a technical standpoint, we see the pair coiling tightly below the 160.45 resistance level, a zone that reminds us of the highs from late 2024 which drew verbal warnings from Tokyo. A breakout above this level, potentially triggered by an escalation in the Middle East, could be a trigger for those holding call options with strikes at 161.00 or higher. Conversely, a de-escalation could see the pair test the channel support near 158.10, making put options below that level a relevant hedge.
While the upcoming US ISM Services PMI is on the calendar, its impact will likely be muted by the geopolitical headlines. Even so, after a stronger-than-expected March jobs report which showed the addition of 210,000 jobs, a significant miss in the PMI data would be needed to alter the dollar’s underlying strength. A slight dip on a weak PMI reading might simply offer a better entry point to position for continued dollar dominance.
Create your live VT Markets account and start trading now.
Start trading now – Click here to create your real VT Markets account
Gold (XAU/USD) started the week lower after rebounding on Friday from near $4,550. It has fallen for a second day as expectations of higher global interest rates and a firmer US Dollar weigh on non-yielding gold.
Energy prices have risen on supply risk linked to the war, which has fed expectations of renewed inflation pressure and tighter central bank policy. Crude Oil reached a nearly four-week high after US President Donald Trump threatened to target Iran’s power plants and bridges if the Strait of Hormuz is not reopened by Tuesday.
Geopolitical Supply Risks
Iran said transit could resume if part of the revenue is used to compensate for war-related damage. Ali Akbar Velayati, an adviser to Iran’s new Supreme Leader Mojtaba Khamenei, said the Bab el-Mandeb Strait could also be targeted, raising concerns over trade disruption.
A strong US Nonfarm Payrolls report on Friday supported views that the Federal Reserve may keep rates higher for longer. Gold has held above support near $4,600, and markets are watching the US ISM Services PMI, with Easter Monday reducing liquidity.
Technically, $4,600 is the 38.2% Fibonacci retracement of the March fall, while price remains below the 200-period EMA. MACD is below its signal and under zero, RSI is 52, resistance sits at $4,758, then $4,791 and $4,913, with support at $4,411 and $4,300.
We see gold struggling as the market prioritizes the threat of higher interest rates over the clear geopolitical risks from Iran. The strength in the US dollar, reinforced by Friday’s strong jobs report, is building the case for a more aggressive Federal Reserve. For now, this suggests the path of least resistance for gold is to the downside.
We believe that positioning for a move below the $4,600 support level is the most direct strategy for the next few weeks. The March Federal Open Market Committee minutes confirmed this hawkish bias, with a majority of members anticipating at least two more rate hikes in 2026. Considering the latest CPI data for March 2026 showed inflation remains sticky at 3.8%, conditions are not favorable for non-yielding assets.
Options Strategy Outlook
Given this outlook, buying put options with strike prices near $4,500 and $4,400 seems appropriate to capitalize on a potential break of current support. This setup reminds us of the price action in the third quarter of 2025, when an initial geopolitical rally in precious metals was quickly erased by central bank hawkishness. For those wanting to reduce premium costs, a bear put spread could achieve a similar directional exposure.
However, the threats to the Strait of Hormuz and the Bab el-Mandeb strait introduce a high degree of uncertainty that could cause a violent price reversal. The Cboe Gold Volatility Index (GVZ) has already climbed to 18.5, up from the low 14s earlier in the year, indicating the market is bracing for larger swings. Therefore, a long strangle strategy, which profits from a significant move in either direction, could be a valuable position to hold.
Create your live VT Markets account and start trading now.
Start trading now – Click here to create your real VT Markets account