Gold prices in the Philippines fell on Monday, based on FXStreet data. Gold was priced at PHP 9,078.41 per gram, down from PHP 9,115.74 on Friday.
Gold also dropped to PHP 105,889.60 per tola from PHP 106,324.20 per tola on Friday. Other listed prices were PHP 90,785.16 for 10 grams and PHP 282,366.10 per troy ounce.
How FXStreet Calculates Local Gold Prices
FXStreet derives Philippine gold prices by converting international prices using the USD/PHP rate and local measurement units. Prices are updated daily at the time of publication and are provided as reference, with local rates able to differ slightly.
Central banks are the largest holders of gold and reported purchases totalled 1,136 tonnes worth about $70 billion in 2022, according to the World Gold Council. This was the highest annual total since records began.
Gold prices can move with the US Dollar, interest rates, and market conditions, as it is priced in dollars (XAU/USD). Gold is described as inversely correlated with the US Dollar, US Treasuries, and risk assets, and it can rise during geopolitical instability or recession fears.
The post notes that an automation tool was used to create it.
Macro Drivers To Watch
We are seeing a small dip in gold prices today, but this is likely minor noise in a larger trend. The key drivers for the coming weeks will not be daily fluctuations but macroeconomic factors like interest rate policy and central bank demand. We believe the broader environment remains supportive for gold.
The market’s attention is focused on the U.S. Federal Reserve, which is expected to begin cutting interest rates later this year. As we saw during the tightening cycle of 2024-2025, higher rates weigh on gold, so this anticipated policy pivot is creating a positive outlook for the metal. A weaker dollar often follows rate cut expectations, providing another tailwind for gold prices.
We must also watch the central banks, who continue to be major buyers and provide a strong floor for the market. After adding a near-record 1,037 tonnes in 2023, reports show this trend of de-dollarization continued through 2024 and 2025, particularly from emerging market banks. This steady, large-scale buying limits the downside for any price corrections.
Persistent geopolitical instability also supports gold’s role as a safe-haven asset. Lingering global tensions mean that any unexpected flare-up could trigger a rapid flight to quality, causing sharp upward price movements. We saw this pattern multiple times last year, where stock market volatility directly benefited gold holdings.
For derivative traders, this small price drop could present a tactical opportunity to build long positions. We view buying call options or establishing long futures contracts as a reasonable strategy over the coming weeks. One might also consider strategies that benefit from increased volatility, as the lead-up to Fed decisions often makes the market jumpy.
Create your live VT Markets account and start trading now.
Start trading now – Click here to create your real VT Markets account
Singapore’s retail sales rose 8.3% year on year in February. This was up from -0.4% in the previous period.
The latest figure shows a rebound in annual retail sales growth. It marks an 8.7 percentage point change from the prior reading.
The sharp rebound in Singapore’s retail sales for February 2025, from a contraction to an 8.3% year-on-year expansion, is a powerful signal of renewed consumer strength. We see this as being driven by the continued recovery in tourism, with visitor arrivals in early 2025 now consistently above one million per month, and resilient domestic demand. This economic momentum is stronger than many had anticipated.
This data significantly raises the stakes for the upcoming Monetary Authority of Singapore (MAS) policy meeting this month. Stronger domestic demand could lead to persistent inflation, which we’ve seen hover around 3% in recent months, pressuring the central bank to consider a tightening move. However, looking back at a similar situation in April 2023, the MAS chose to hold policy steady despite high inflation, so we should not assume an aggressive response is guaranteed.
For foreign exchange traders, this uncertainty creates an opportunity in the Singapore dollar. We believe positioning for SGD strength through short-dated call options is a prudent strategy, particularly against currencies with softer economic data. This allows us to capitalize on a potential hawkish surprise from the MAS while capping our risk if they decide to wait and see.
In the interest rate markets, we are seeing expectations for a policy tightening get priced in, which is steepening the front end of the yield curve. Traders should consider using instruments like short-term interest rate swaps to position for higher rates in the coming months. This trend will likely accelerate if upcoming March inflation data also shows an unexpected increase.
This robust consumer activity is also a clear positive for equities, especially for banks and retail-focused companies on the Straits Times Index (STI). We saw a similar pattern in early 2023, where the STI gained over 3% in the weeks following a strong retail sales report. Buying call options on the STI or a basket of consumer stocks provides direct exposure to this domestic growth narrative.
Start trading now – Click here to create your real VT Markets account
Gold prices in the Philippines fell on Monday, based on FXStreet data. Gold was priced at PHP 9,078.41 per gram, down from PHP 9,115.74 on Friday.
Gold dropped to PHP 105,889.60 per tola from PHP 106,324.20 on Friday. Listed prices also include PHP 90,785.16 for 10 grams and PHP 282,366.10 per troy ounce.
How Local Gold Prices Are Computed
FXStreet derives local gold prices by converting international prices using USD/PHP exchange rates and local measurement units. Prices are updated daily using market rates at the time of publication, and local rates may differ slightly.
Central banks are the largest holders of gold, and they added 1,136 tonnes worth about $70 billion in 2022, according to the World Gold Council. This was the highest annual total since records began, with China, India, and Turkey among those increasing reserves.
Gold often moves inversely to the US Dollar and US Treasuries, and it can also move opposite to risk assets such as equities. Prices can be influenced by geopolitical events, recession fears, and interest rate changes, and gold is priced in US dollars (XAU/USD).
The small dip in local gold prices is just noise against a much larger backdrop. We see the market looking past these daily moves and focusing on the Federal Reserve’s next steps. With inflation now consistently below 3%, traders are pricing in potential rate cuts later this year, which is typically bullish for a non-yielding asset like gold.
What This Means For Traders
Central bank demand remains a critical floor for the price. Looking back, we saw them add a massive 1,037 tonnes in 2023, nearly matching the 2022 record, and data showed 2025 was another strong year of accumulation, particularly from emerging economies. This institutional buying provides a strong tailwind and absorbs physical supply from the market.
The inverse relationship with the US Dollar is playing out exactly as expected. The Dollar Index (DXY) is holding in the low 100s, well below the highs we saw back in 2022, and the prospect of lower US interest rates is likely to keep a lid on its strength. A stable to weaker dollar makes gold more attractive for holders of other currencies.
Given this environment, any price weakness should be viewed as a potential entry point for long positions. For derivative traders, this could mean buying call options to speculate on a move back towards the all-time highs we saw last year in 2025. Selling cash-secured puts below the current price is another strategy to consider, taking advantage of any dips to collect premium.
We cannot ignore the persistent geopolitical tensions that continue to simmer in the background. This uncertainty underpins gold’s role as a primary safe-haven asset for diversifying portfolios away from riskier equities. Even if a major conflict doesn’t escalate, the underlying risk helps prevent any significant, sustained sell-offs in the metal.
Create your live VT Markets account and start trading now.
Start trading now – Click here to create your real VT Markets account
Singapore’s retail sales rose 8.3% year on year in February. This followed a -0.4% year-on-year change in the previous month.
The data shows a sharp shift from a fall to growth within one month. It adds to recent figures on consumer spending in Singapore.
Retail Sales Surge Signals Stronger Demand
The recent jump to 8.3% year-on-year for February’s retail sales confirms a significant revival in consumer demand. This strong domestic consumption provides a solid foundation for economic growth moving into the second quarter. We should now anticipate that the Monetary Authority of Singapore (MAS) will have less reason to consider easing its policy stance in its upcoming meeting.
This data reinforces the case for a firm Singapore Dollar, especially as core inflation also remained persistent at 3.1% in the latest readings. Consequently, we are looking at strategies that benefit from currency strength, such as buying SGD/USD call options expiring after the April MAS meeting. This is a marked change from the more neutral stance we held at the end of 2025 when global economic data was less certain.
For the local stock market, this is supportive for the Straits Times Index (STI), which has already seen a 4% rise since the start of the year. We believe this momentum can continue, making call spreads on the STI an efficient way to position for further upside in consumer discretionary and banking stocks. The strength contradicts the more cautious outlook we held during the final quarter of 2025.
With a clearer economic picture, implied volatility on STI options may begin to soften, creating opportunities to sell premium through strategies like cash-secured puts on fundamentally sound companies. We are also watching Singapore government bond yields closely, as this economic strength could put upward pressure on them. This would impact pricing on interest rate swaps, suggesting a steeper yield curve than anticipated just a few months ago.
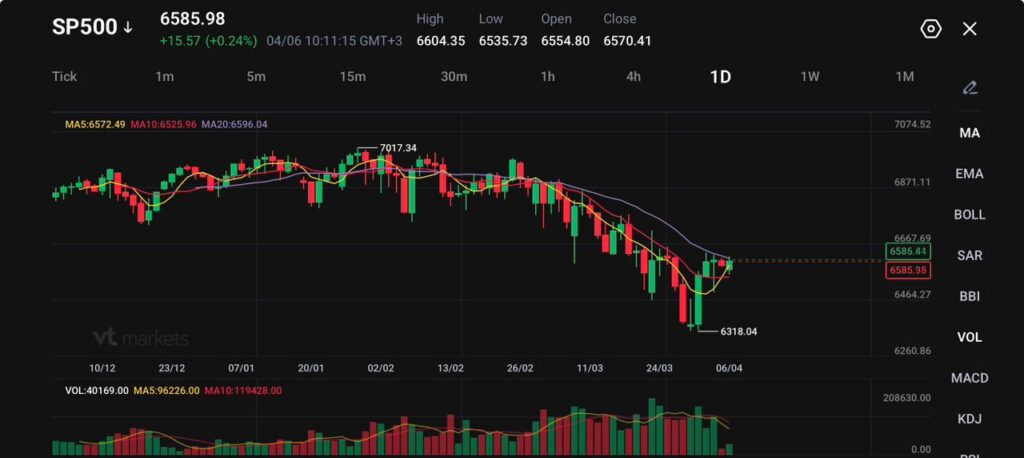
S&P 500 trades at 6585.98, up 15.57 (+0.24%), after last week’s nearly 6% rally, its best weekly gain since late November.
Futures turned softer on Monday, with Dow futures down 105 points (-0.2%), S&P 500 futures down 0.1%, and Nasdaq futures down 0.2%.
March payrolls came in at 178,000, well above the 59,000 consensus, which improved the growth picture but made rate-cut hopes harder to rebuild.
US equities opened the week trying to hold onto a powerful rebound, but the tone stayed cautious. A report that US, Iranian, and regional mediators were discussing a potential 45-day ceasefire helped trim the earlier losses in futures, yet markets did not move into a clean risk-on mode because the chances of a full deal before Trump’s deadline were still seen as slim.
The market is still trading the gap between headline optimism and the reality that shipping, energy flows, and military threats remain unresolved.
That left the S&P 500 in a familiar spot. Buyers are willing to defend part of last week’s rally, but they are not treating the ceasefire story as a full resolution. Any rebound built on diplomacy alone still has to survive the next oil move and the next political headline.
The Tuesday Deadline Keeps Pressure on Sentiment
The market is also reacting to a very specific risk marker. Trump said Tuesday would be “Power Plant Day, and Bridge Day” in Iran if the Strait of Hormuz is not reopened, which gave traders a hard deadline to price. That kind of event risk keeps traders defensive because it compresses the window for negotiation and increases the chance of another sharp move in oil or yields.
US allies are reportedly pressing for a last-minute deal with Iran, as Trump extended his deadline to Tuesday for Tehran to reopen the Strait of Hormuz, keeping markets on edge over whether a breakthrough can be reached https://t.co/MvIddpnZNa
That is why futures only partly recovered. Traders are not just asking whether talks are happening. They are asking whether a deal arrives in time to stop another escalation in infrastructure attacks and another jump in crude.
Last Week’s Rally is Now Being Properly Tested
The S&P 500 surged nearly 6% last week, while the Dow rose 3% and the Nasdaq jumped 4.4%. That rebound snapped a five-week losing streak and gave the market its strongest weekly performance since late November.
Monday’s session became the first real test of whether traders would defend those gains once geopolitical risk returned to the front of the tape.
US stocks ended slightly mixed after paring deeper losses, as diplomatic signals from the Middle East helped calm markets rattled earlier by Trump's threats of tougher action against Iran ahead of a long holiday weekend https://t.co/B2FFpClOD7pic.twitter.com/jis72uD61S
That test matters because sharp weekly rebounds inside unstable macro conditions often fail unless the market gets confirmation from lower oil, calmer yields, or stronger growth data. Right now, traders only have one of those three in partial form.
Payrolls Improved the Growth Story, but Tightened the Rate Debate
The March jobs report added another layer of tension. Payrolls rose 178,000, triple the 59,000 consensus. That reduced the fear of an immediate growth rollover, but it also made it harder to argue for faster Fed easing. In this environment, better growth data is supportive for earnings, but it also works against valuation support if it keeps yields firm and delays rate cuts.
That leaves the S&P 500 balancing two opposing forces. The labour market is holding up better than feared, which helps the economic backdrop. At the same time, oil remains the bigger variable, and a stronger growth print does not help if it keeps the Fed cautious while energy prices stay elevated.
SP500 Technical Outlook
The S&P 500 is trading near 6586, attempting a modest rebound after the sharp sell-off that drove price down to the 6318 low. Recent price action shows a short-term recovery, with buyers stepping in after the decline, but the move higher remains tentative.
The broader structure still reflects a loss of momentum from the earlier highs near 7017, with the market now trying to stabilise rather than fully reverse.
From a technical standpoint, the trend has shifted to a more neutral-to-bearish tone. Price is still trading below the 20-day moving average (6596), which is flattening and acting as overhead resistance, while the 5-day (6572) and 10-day (6526) have started to turn higher, supporting the current bounce. This suggests short-term recovery momentum is building, but the broader trend has yet to confirm a reversal.
Key levels to watch:
Support: 6535 → 6464 → 6318
Resistance: 6600 → 6675 → 6870
The immediate focus is on the 6600 level, which aligns with the 20-day average and recent rejection zone. A sustained break above this area could extend the recovery toward 6675, where stronger resistance is likely to emerge.
On the downside, 6535 is acting as near-term support. A break below this level could see price retest the 6464 region, with further weakness exposing the 6318 low.
Overall, the S&P 500 is in a corrective phase following its earlier uptrend. The current rebound looks like an early-stage recovery, but unless price can reclaim and hold above 6600–6675, the risk remains tilted toward further consolidation or another leg lower.
What Traders Should Watch Next
The next move depends on whether diplomacy produces a real pause before Tuesday’s deadline, whether oil stays contained, and whether yields react more to jobs strength or war risk. If crude stays calm and the market keeps absorbing the 178,000 payroll print without a sharp rise in yields, the S&P 500 can keep defending last week’s gains. If the deadline passes without progress and oil jumps again, the index may struggle to hold the 6570 to 6600 area.
Why Are S&P 500 Futures Soft Again After Last Week’s Strong Rally?
Futures turned lower because the market is trying to price two opposing forces at once: a possible 45-day ceasefire and Trump’s Tuesday deadline tied to Iran and the Strait of Hormuz. That kept traders from chasing risk higher even after last week’s nearly 6% S&P 500 rally.
What is the Main Risk the Market is Watching Right Now?
The main risk is whether diplomacy arrives before the deadline or whether the conflict widens and hits energy infrastructure again. Markets are treating that as an oil-and-yields problem first, not just a geopolitical headline problem.
Why Does the Tuesday Deadline Matter So Much for Stocks?
A fixed deadline compresses the market’s window for optimism. If no deal emerges before then, traders may quickly reprice the odds of another escalation in oil, inflation, and risk aversion.
How Does the Strait of Hormuz Feed Into the S&P 500?
The Strait affects energy supply. If flows stay constrained, oil prices stay high, inflation pressure lingers, and companies face higher input and transport costs. That usually weighs on margins and makes equities harder to support.
Why Does the Jobs Report Complicate the Market Outlook?
March payrolls came in at 178,000 versus a 59,000 consensus. That supports the growth outlook, but it also makes Fed rate cuts harder to justify quickly, which limits valuation support for stocks.
Start trading now – Click here to create your real VT Markets account
Singapore’s retail sales fell by 4.1% month on month in February. This was down from a 6.1% rise in the previous month.
The monthly change moved from positive growth to a decline. The February result shows weaker retail activity compared with January.
Cooling Consumer Demand Signal
The reversal in February’s retail sales, dropping to -4.1% after a strong 6.1% in January, is a clear signal of cooling consumer demand. While some of this is seasonal due to the timing of Chinese New Year festivities boosting January figures, the steepness of the fall is concerning. We see this as an indicator that household spending is becoming more cautious.
This sharp slowdown suggests potential weakness for the Singapore Dollar. A struggling domestic economy makes it harder for the Monetary Authority of Singapore (MAS) to justify tightening its policy, especially with their next meeting later this month. We can position for this by considering options that would profit from a weaker SGD against the US dollar.
On the equities side, we should expect retail-focused stocks on the Straits Times Index (STI) to face headwinds. Using derivatives, we can express this bearish view by acquiring put options on companies highly exposed to consumer spending. This allows us to manage risk if the upcoming March retail data also disappoints.
We saw a similar, though less severe, pattern back in early 2025 following the holiday season, which ultimately proved to be a temporary dip. However, current Q1 2026 GDP growth forecasts have already been trimmed by major banks, adding weight to this recent negative data point. This suggests the market may react more strongly this time around.
Key Data And Volatility Watch
In the coming weeks, our focus must be on the release of March inflation and retail sales data to confirm if a trend is forming. Until then, the sharp swing in sentiment has increased implied volatility in the market. This environment makes strategies like straddles on the STI attractive, as they can benefit from significant price moves in either direction.
Create your live VT Markets account and start trading now.
Start trading now – Click here to create your real VT Markets account
Gold prices in the United Arab Emirates fell on Monday, based on FXStreet data. Gold was priced at AED 549.58 per gram, down from AED 552.41 on Friday.
Gold also eased to AED 6,410.21 per tola from AED 6,443.14 previously. Other listed prices were AED 5,495.81 for 10 grams and AED 17,093.74 per troy ounce.
Uae Gold Price Snapshot
FXStreet calculates UAE gold prices by converting international prices using the USD/AED rate and local measurement units. Prices are updated daily at the time of publication and are for reference, as local rates may differ slightly.
Central banks are the largest holders of gold. They added 1,136 tonnes worth about $70 billion to reserves in 2022, the highest annual total on record, and China, India and Turkey have been increasing reserves.
Gold often moves differently from the US Dollar and US Treasuries, and it can also move opposite to risk assets such as equities. Prices may change with geopolitical risks, recession fears, interest rates, and shifts in the US Dollar, since gold is priced in dollars.
This minor dip in gold prices should be seen as a potential entry point rather than a sign of weakness. The slight decrease is largely tied to daily currency fluctuations against a generally weaker US Dollar. We see this as noise in a broader uptrend, especially as the dollar index has fallen over 2% since the start of this year.
Market Outlook And Positioning
The key driver for gold is the shift in central bank policy. After the aggressive rate hikes of 2023-2024, the Federal Reserve has clearly signaled a more accommodative stance, with markets now pricing in at least two more rate cuts by the end of 2026. As of April 2026, the current Fed funds rate sits at 4.50%, making a non-yielding asset like gold far more attractive than it was a year ago.
Furthermore, central bank demand continues to provide a strong floor for prices. Looking back at 2025, central banks added over 950 tonnes to their reserves, continuing the record-breaking buying trend we witnessed in the preceding years. This institutional demand, particularly from emerging market banks, insulates gold from short-term market volatility.
Geopolitical instability and stretched equity valuations are also pushing capital towards safe-haven assets. After the S&P 500 gained nearly 18% in 2025, we are seeing increased caution among investors, with many seeking to hedge their portfolios. This rotation into defensive assets provides a steady tailwind for gold.
For derivative traders, this environment suggests positioning for upside in the coming weeks. Buying call options on major gold ETFs or futures contracts could capture potential upward price movements driven by expected rate cuts. Volatility is also expected to rise, so strategies like straddles could be considered to play on a significant price move in either direction.
Create your live VT Markets account and start trading now.
Start trading now – Click here to create your real VT Markets account
Singapore’s retail sales month on month fell to -4.1% in February. This was down from 6.1% in the previous period.
The data points to a reversal in short-term retail momentum. It shows sales decreased compared with the prior month.
Seasonal Lunar New Year Effects
We see the February month-on-month retail sales figure as a significant drop, reversing a strong January. This reversal, however, is largely expected due to the timing of the Lunar New Year in mid-February 2026. Much of the holiday-related spending was likely pulled forward into the January data, making this February decline appear more severe than the underlying trend.
This weak headline number could still put short-term pressure on the Singapore Dollar. Derivative traders may look at this as an opportunity to position for a weaker SGD against the US dollar, especially as the latest data from the US shows core inflation remains stubborn at 3.7%. A potential strategy involves buying call options on the USD/SGD pair, targeting resistance levels we last saw in the fourth quarter of 2025.
However, the weakness seems concentrated in domestic spending, particularly in motor vehicles which saw a 14.6% slump. In contrast, tourist arrivals have continued their steady recovery, climbing to nearly 1.3 million in the first two months of 2026, bolstering spending in accommodation and food services. This suggests the Monetary Authority of Singapore will likely look through the seasonal noise and maintain its modest currency appreciation policy for now.
For equity markets, this data points to near-term weakness for consumer discretionary stocks on the Straits Times Index (STI). We anticipate traders may use this as a chance to buy put options on specific retail-focused REITs ahead of their first-quarter earnings announcements. This pattern mirrors what we observed in the period following the Lunar New Year in 2025, where these specific sectors lagged the broader market for several weeks.
Rising Volatility And Options Positioning
The conflicting signals between a sharp headline drop and its seasonal explanation will likely increase uncertainty. This environment is favorable for volatility traders who can use options strategies like straddles on the STI. Such positions would profit from a significant market move in the coming weeks, regardless of whether it is up or down.
Create your live VT Markets account and start trading now.
Start trading now – Click here to create your real VT Markets account
Gold prices in the United Arab Emirates fell on Monday, based on FXStreet data. Gold was priced at AED 549.58 per gram, down from AED 552.41 on Friday.
Gold dropped to AED 6,410.21 per tola from AED 6,443.14 per tola on Friday. Other listed prices were AED 5,495.81 for 10 grams and AED 17,093.74 per troy ounce.
How UAE Gold Prices Are Calculated
FXStreet calculates UAE gold prices by converting international prices using the USD/AED rate and local measurement units. Prices are updated daily using market rates at the time of publication, and local rates may vary.
Central banks added 1,136 tonnes of gold worth around $70 billion to reserves in 2022, according to the World Gold Council. This was the highest annual purchase since records began, with buying reported from emerging economies such as China, India and Turkey.
Gold often moves inversely to the US Dollar and US Treasuries, and it can also move opposite to risk assets such as shares. Prices can also react to geopolitical stress, recession fears, and interest rate changes, while gold is priced in US dollars (XAU/USD).
The recent small dip in gold prices, as we saw this past Monday, should be seen as a consolidation phase rather than the start of a new downtrend. This slight pullback offers a tactical opportunity to position for the next move higher. The fundamental reasons for gold’s strength remain intact, suggesting that buying on weakness is the prudent strategy for the coming weeks.
Central Bank Demand And Market Strategy
We must consider the persistent demand from central banks, which provides a strong price floor. Looking back from our perspective in 2026, we saw this trend accelerate after they bought over 1,000 tonnes in 2023, and reports from late 2025 confirmed that emerging markets are still diversifying away from the dollar. This steady institutional buying is a powerful structural support that is unlikely to disappear.
The inverse relationship with the US Dollar is a key factor right now, as the dollar has softened following the Federal Reserve’s guidance in the first quarter of 2026. As a non-yielding asset, gold performs well in an environment of falling real interest rates, which we anticipate for the remainder of the year. Any data suggesting a weaker economy will likely pressure the dollar further and push gold higher.
Geopolitical instability remains a significant catalyst, ensuring gold maintains its safe-haven appeal. Tensions have not eased, meaning any unexpected flare-up could cause a rapid price spike. Derivative traders should consider holding long-dated call options to capture this potential upside volatility while clearly defining their maximum risk.
Given the current stability, selling cash-secured puts below the current market price is an attractive strategy for the next few weeks. This allows us to collect premium from the still-elevated volatility while establishing a lower potential entry point if the price dips further. This approach benefits from both price consolidation and potential upward moves.
We should also monitor gold’s inverse correlation with risk assets like stocks. Equity markets have shown signs of fatigue recently, and any significant sell-off would likely trigger a flight to safety, directly benefiting gold. Watching for weakness in major indices can act as a forward-looking indicator for strength in the precious metal.
Create your live VT Markets account and start trading now.
Start trading now – Click here to create your real VT Markets account
Gold prices in Pakistan fell on Monday, based on FXStreet data. Gold was priced at PKR 41,618.79 per gram, down from PKR 41,868.55 on Friday.
The price per tola dropped to PKR 485,431.80 from PKR 488,346.60 on Friday. Other listed rates were PKR 416,189.20 for 10 grams and PKR 1,294,430.00 per troy ounce.
FXStreet converts international gold prices into Pakistani rupees using the USD/PKR exchange rate and local units. The figures are updated daily at the time of publication and are for reference, as local prices may differ.
Gold is widely used as a store of value and for jewellery, and is often treated as a safe-haven asset and an inflation hedge. Central banks are the largest holders, adding 1,136 tonnes worth about $70 billion in 2022, the highest annual purchase on record.
Gold often moves inversely to the US Dollar and US Treasuries and can also move against risk assets. Prices are affected by factors including geopolitical stress, recession fears, interest rates, and the strength of the US Dollar, as gold is priced in dollars.
An automation tool was used to create the post.
Given the current market environment on April 6, 2026, the key factor for gold is the widespread anticipation of interest rate cuts from the U.S. Federal Reserve later this year. As a non-yielding asset, gold tends to perform well when interest rates fall, reducing the opportunity cost of holding it. This outlook suggests a potential upward trend for gold prices in the coming weeks and months.
The U.S. Dollar has also started to soften from the highs we saw during the rate-hiking cycle of 2023-2025. A weaker dollar typically has an inverse correlation with gold, making the metal cheaper for holders of other currencies and boosting its price. We are watching for this trend to accelerate as rate cut expectations become more firm.
A major underlying support for gold remains the aggressive purchasing by central banks, a trend we have seen consistently grow since 2022. The World Gold Council confirmed that net purchases by central banks exceeded 1,000 tonnes in both 2023 and 2024, with emerging markets leading the way to diversify reserves away from the dollar. This consistent demand creates a strong price floor for the metal.
For derivative traders, this environment makes long positions attractive. Buying call options on gold futures or major gold ETFs offers a way to capitalize on potential price increases with a defined risk. Upcoming U.S. inflation and employment data will be critical, as any sign of economic weakness could hasten the timeline for Fed rate cuts and trigger a sharp move higher.
Furthermore, persistent geopolitical instability continues to underscore gold’s role as a safe-haven asset. Any unexpected flare-up in global tensions could lead to a flight to safety, adding another layer of potential demand. This provides a fundamental reason to maintain some bullish exposure to gold as a portfolio hedge.
Start trading now – Click here to create your real VT Markets account