Back

USDCNH Slips as Hormuz Hopes Lift Yuan

Key Points

  • USDCNH trades at 6.88362, down 0.00544 (-0.08%), while the offshore yuan edges firmer around 6.88 per dollar.
  • China’s composite PMI fell to 51.5 in March from 55.4 in February 2026, with manufacturing at 50.8 versus 52.1 and services at 52.1 versus 56.7.
  • The yuan is set for a weekly gain after four straight weekly losses, helped by hopes that pressure on the Strait of Hormuz may ease.

The offshore yuan edged higher on Friday, with USDCNH at 6.88362, as traders trimmed some of the safe-haven demand that had pushed the dollar higher through the Middle East crisis. The immediate shift came from improving sentiment around the Strait of Hormuz. Iran and Oman may begin monitoring transit through the waterway, which gave markets a reason to ease back from the most defensive positions.

That does not mean the risk has gone away. The market is still treating the Strait as a live threat to energy flows. The move in the yuan reflects a softer dollar tone and a little more confidence that the worst-case supply shock may not deepen straight away.

A cautious path from here still depends on shipping. If the Strait stays open enough to reduce oil panic, USDCNH can keep drifting lower. If the route tightens again, the dollar may regain support quickly.

China’s PMI Data Limits the Upside

The yuan’s gains have run into a softer domestic growth signal. The figures you shared showed China’s composite PMI at 51.5 in March, down from 55.4 in February 2026. The slowdown was broad, with manufacturing at 50.8 versus 52.1 and services at 52.1 versus 56.7.

Weaker domestic demand and slower export momentum have added to the downturn of private-sector and industrial services.

That leaves the currency in a narrow balance. Better sentiment around Hormuz supports the yuan. Softer Chinese activity keeps that support from becoming a stronger trend.

External Diplomacy Is Doing Part Of The Work

The broader backdrop has become more multipolar. India and the Philippines are reportedly negotiating with Tehran on vessel safety, while China and Pakistan are pushing their own diplomatic framework. That matters for the yuan because Beijing is not only exposed to oil prices.

It also has a direct interest in keeping trade lanes functional and freight costs contained.

China is one of the largest importers of oil moving through Hormuz, but it is also better placed than many peers to absorb some disruption through diverse supply sources, large inventories, and state-directed controls.

That gives the yuan some resilience when markets calm, but it does not turn the currency into a clean winner. China can absorb stress better than some importers, yet it still pays a growth cost when energy and logistics stay expensive.

Technical Analysis

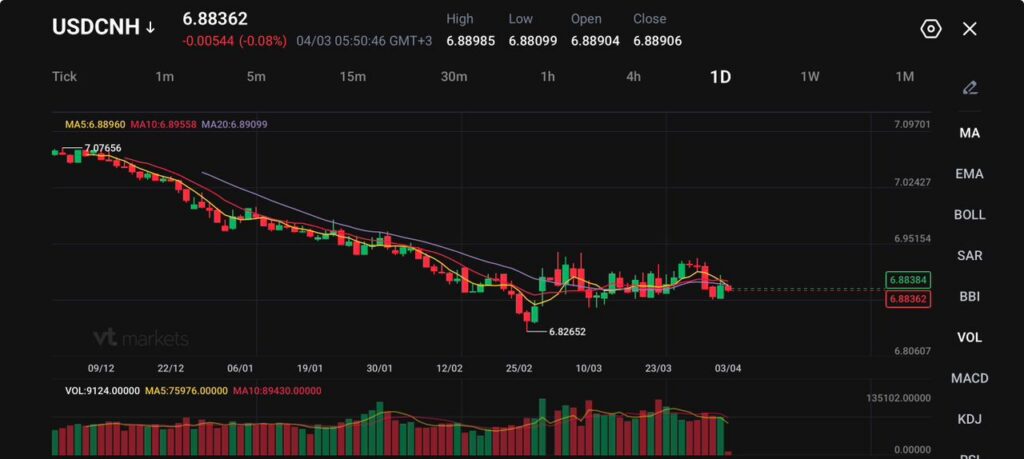
USDCNH is trading near 6.8836, holding within a tight consolidation range after a prolonged downtrend from the 7.07 highs.

Price action shows the pair attempting to stabilise following the sharp decline into the 6.82 low, with recent candles reflecting indecision rather than strong directional conviction. The market is now moving sideways, suggesting a pause in bearish momentum as traders assess the next macro driver.

From a technical standpoint, the broader structure still leans bearish. Price remains capped below the key moving averages, with the 5-day (6.8896) and 10-day (6.8956) acting as immediate resistance, while the 20-day (6.8910) continues to flatten, signalling a loss of trend strength but not yet a reversal.

The inability to reclaim and hold above these levels keeps downside pressure intact, even as short-term momentum stabilises.

Key levels to watch:

  • Support: 6.8800 → 6.8260 → 6.8000
  • Resistance: 6.8950 → 6.9200 → 6.9500

In the near term, price is compressing around the 6.88–6.89 zone, with neither buyers nor sellers fully in control. A break below 6.8800 would likely reopen the move toward the 6.82 lows, while a sustained push above 6.8950 could trigger a short-term recovery toward 6.92.

Overall, USDCNH remains in a soft downtrend, but the current consolidation suggests momentum is fading. Traders should watch for a breakout from this narrow range, as it will likely dictate the next directional move.

What Traders Should Watch Next

The next move in USDCNH depends on whether Hormuz relief turns into actual flow stability and whether China’s softer March private PMI becomes a one-month pause or the start of a broader slowdown.

The latest China PMI reporting already showed weaker domestic demand and slower export orders in services, while manufacturing faced sharper input costs and longer delivery times.

A cautious forecast suggests that the exchange rate will remain within a narrow range around current levels. A significant decrease in USDCNH is likely to depend on a combination of calmer oil prices, stronger economic data from China, and a weaker dollar. However, any new disruptions in shipping could quickly push the pair back under upward pressure.

Learn more about trading Forex Pairs on VT Markets here.

Trader Questions

Why is USDCNH falling toward 6.88?

USDCNH eased because sentiment improved around the Strait of Hormuz and traders pulled back some defensive dollar positions. Reuters reported that hopes of monitored transit through the waterway helped support the yuan after four straight weekly losses.

What is supporting the offshore yuan right now?

The yuan is getting support from a softer dollar tone and from hopes that oil-shipping risks may ease. Reuters said the currency was heading for a weekly gain as markets reacted to signs that pressure around Hormuz could moderate.

Why has China’s PMI data limited yuan gains?

China’s March data showed slower momentum. The figures you provided showed the composite PMI at 51.5 versus 55.4 in February, with manufacturing at 50.8 versus 52.1 and services at 52.1 versus 56.7. Reuters also reported weaker private-sector demand and softer export momentum, which capped yuan upside.

Does a PMI above 50 still support the yuan?

Yes, but only partly. Readings above 50 still point to expansion, yet the slowdown from February means growth is losing speed. Currency markets usually reward improving momentum more than simple expansion.

Why does the Strait of Hormuz matter for USDCNH?

China imports a large amount of oil that moves through Hormuz. If the route stays disrupted, energy costs rise, freight costs stay high, and growth pressure builds. Reuters reported that China can absorb some of the shock through inventories and diversified supply, but it still faces a real economic cost.

What is the difference between the private PMI and China’s official PMI?

The private readings in your note softened sharply, while China’s official March data looked firmer. Reuters reported official manufacturing PMI at 50.4 and non-manufacturing PMI at 50.8, which suggests the economy is still expanding even though private surveys point to slower demand and rising cost pressure.

What does the USDCNH chart show right now?

The chart shows USDCNH at 6.88362, below the short-term moving averages at MA5 6.88960, MA10 6.89558, and MA20 6.89099. That keeps the short-term bias slightly softer for the dollar, though the move still looks like a cautious drift rather than a strong breakdown.

Start trading now – Click here to create your real VT Markets account

ORCL Stock: How Oracle Is Positioning Itself in the AI Boom

Key Points:

  • ORCL stock is increasingly being revalued through an AI lens, driven by the growth of its cloud infrastructure business and its positioning within enterprise data environments.
  • Oracle is emerging as an AI infrastructure enabler, not just a legacy software provider.
  • Its cloud platform is benefiting from rising enterprise demand for AI workloads.
  • ORCL offers lower-volatility exposure to the AI theme compared to high-momentum names.

Oracle has long been associated with databases and enterprise software, but that identity is evolving. As artificial intelligence (AI) reshapes how companies operate, the market is beginning to reassess where ORCL fits within this new landscape.

The AI boom is not just about models or chips. It is about the infrastructure that allows those systems to run at scale. This includes compute, storage, and data environments—areas where Oracle is becoming increasingly relevant.

  • AI adoption is driving demand beyond just software.
  • Infrastructure providers are gaining importance alongside chipmakers.
  • Enterprise data is becoming central to how AI is deployed.

This shift is what is quietly bringing ORCL stock back into focus.

From Legacy Software to Cloud Infrastructure

Oracle’s transformation begins with its move away from traditional licensing and toward cloud-based services. Historically, the company generated most of its revenue from database licences and enterprise software contracts. These provided stability, but limited growth.

The pivot to Oracle Cloud Infrastructure (OCI) changes that trajectory.

OCI is designed to support modern workloads, particularly those tied to AI and large-scale data processing. These workloads are far more demanding than traditional enterprise applications, requiring both scale and performance.

  • AI workloads require high compute density and fast data access.
  • Enterprises need secure, scalable environments to run models.
  • Cloud infrastructure turns usage into recurring, scalable revenue.

Oracle has responded by expanding its data centre footprint and investing heavily in performance optimisation. As a result, cloud revenue has become one of the fastest-growing parts of the business, often delivering double-digit growth.

This is not just a business shift. It is a valuation shift. The more Oracle looks like a cloud infrastructure provider, the more it gets compared to growth-driven tech names rather than legacy software firms.

Oracle’s Role in the AI Stack

The AI ecosystem is layered, even if the market often simplifies it.

At a high level, it can be broken into three parts:

  • Hardware layer: Led by companies like NVIDIA, supplying the chips that power AI systems
  • Infrastructure layer: Where Oracle operates, hosting and scaling AI workloads
  • Application layer: Companies like Microsoft are integrating AI into their products

Oracle’s positioning sits in that middle layer, and that is where its advantage lies.

Many enterprises already store critical data in Oracle systems. As AI adoption grows, companies want to run models on that data without migrating everything elsewhere.

  • Data already lives within Oracle environments
  • AI workloads tend to follow where data is stored
  • Infrastructure demand increases as usage scales

This creates a natural pathway for Oracle to capture AI-related demand without needing to dominate the entire cloud market.

How ORCL Compares to Other AI Stocks

Oracle is part of the AI trade, but it behaves differently from the names that typically dominate headlines.

A company like NVIDIA offers direct exposure to chip demand. Its growth is closely tied to how quickly AI infrastructure is being built out, which makes it highly sensitive to expectations and sentiment.

Meanwhile, Microsoft and Amazon combine infrastructure with platform and application layers, giving them broader exposure across the AI value chain.

Oracle may not lead the AI headlines, but it sits within the same infrastructure cycle driving the broader tech rally. Track AI-linked equities, cloud providers, and semiconductor names through CFD Shares on the VT Markets app.

Oracle sits in a narrower but still important position.

  • More enterprise-focused than consumer-facing.
  • More infrastructure-driven than application-led.
  • Less dependent on short-term AI hype cycles.

This gives ORCL a different trading profile. It tends to move with the broader AI theme, but with less extreme volatility.

For traders, that creates a second-order opportunity. ORCL may not lead rallies, but it can benefit from the same structural drivers.

Oracle’s Position in Geopolitics and Sovereign AI

One of the more underappreciated aspects of Oracle’s positioning in the AI race is its deep and long-standing relationship with governments and defence institutions.

While much of the market focuses on commercial AI adoption, a growing share of demand is coming from what is often referred to as sovereign AI. Sovereign AIs are systems developed and deployed at a national level for security, intelligence, and infrastructure resilience.

Oracle is already embedded in this space.

The company has long been a cloud and database provider to the US government and continues to expand its footprint across defence and public-sector contracts. More recently, Oracle has been rolling out dedicated cloud regions and AI-capable infrastructure designed specifically for government and military use.

This includes deployments and partnerships across:

  • The US Department of Defence (DoD).
  • Branches such as the US Air Force and the US Army.
  • Allied defence institutions, including the UK Royal Navy.
  • International government partners, such as Singapore’s defence sector.

These contracts are not just incremental revenue streams. They represent high-trust, long-duration agreements that often involve mission-critical systems. That creates a different type of demand profile compared to commercial cloud usage.

From a market perspective, this matters for two reasons.

First, government and defence contracts tend to be:

  • Longer-term.
  • Less sensitive to economic cycles.
  • Tied to national budgets rather than corporate spending.

Second, sovereign AI is becoming a strategic priority. Countries are increasingly looking to build:

  • Domestic AI capabilities
  • Secure data environments
  • Independent cloud infrastructure

Larry Ellison has been particularly vocal about this shift. He emphasised that AI will require not just software innovation, but secure, large-scale infrastructure capable of handling sensitive data.

This focus on security and sovereign capability sets Oracle apart from some of its competitors, particularly in highly regulated or defence-related use cases.

Unlike newcomers in the AI boom, Oracle has years of state-backed demand. In the commercial AI space, traders will likely see more stable, persistent growth from the company over time.

  • Sovereign AI demand is structural, not cyclical.
  • Defence contracts provide revenue visibility and durability.
  • Government adoption reinforces Oracle’s role in high-trust infrastructure environments.

As geopolitical tensions rise and countries prioritise technological independence, this segment of the market is likely to become increasingly important.

ORCL is just one piece of a much wider AI and cloud ecosystem. Build a broader watchlist of related tech stocks and trade them through CFD Shares on the VT Markets app.

What Oracle’s Earnings Are Really Showing

Oracle’s earnings are increasingly reflecting structural demand rather than cyclical growth.

The key is not just revenue, but where that revenue comes from. In recent quarters, Oracle has reported total revenue growth in the high single digits to low double digits, but the composition of that growth tells a much clearer story. Cloud infrastructure, particularly OCI, has been expanding at a much faster pace than the rest of the business.

  • OCI growth is leading overall performance. Oracle Cloud Infrastructure has been growing at roughly 30%–50% year-on-year, significantly outpacing total company revenue. This highlights how demand for AI-related compute and enterprise cloud workloads is driving the top line.
  • Legacy segments are becoming less dominant. Traditional licensing and on-premise software have grown at a much slower pace, often in the low single digits, meaning their contribution to overall growth is steadily declining.
  • Recurring revenue is increasing visibility. Cloud services and support now account for over 70% of Oracle’s total revenue, giving the company a more predictable and scalable earnings profile compared to its historical model.

At the same time, capital expenditure is rising sharply as Oracle builds out the infrastructure needed to support AI demand.

  • Higher capex signals confidence in long-term demand: Oracle has significantly increased investment into data centres and cloud capacity, with capital expenditure rising into the multi-billion dollar range annually, reflecting strong forward demand for AI workloads.
  • It can also create short-term margin pressure: Despite strong revenue growth, operating margins have faced pressure at times due to higher infrastructure costs, as the company invests ahead of demand.

For traders, this is where interpretation matters. Strong investment is typically viewed as bullish when it is backed by sustained demand, but the market will closely watch whether that capex translates into continued OCI growth and long-term revenue expansion.

The Hidden Driver: Data and Enterprise Lock-In

One of Oracle’s strongest advantages is not always obvious in headlines. It is the concept of data gravity.

Large organisations store critical data within Oracle systems. Moving that data is difficult, expensive, and risky. This creates a form of embedded positioning.

As AI adoption increases, companies need to run models on that data. This creates a natural dynamic:

  • Data remains within existing Oracle systems.
  • AI workloads are built on top of that data.
  • Infrastructure demand grows within the same ecosystem.

This is not driven by hype. It is driven by operational efficiency. And over time, that can be more durable than sentiment-driven narratives.

What Traders Should Watch

For traders, ORCL is less about headlines and more about confirmation of trends.

The first signal is cloud growth. Sustained strength in OCI indicates that AI infrastructure demand is translating into real revenue.

The second is capital allocation. Investment into data centres and infrastructure needs to be matched by long-term usage and contracts.

Beyond that, several indicators can help frame the trade:

  • OCI growth consistency: Confirms whether AI demand is sustaining.
  • Enterprise deal flow: Signals real adoption rather than narrative.
  • Capex vs revenue balance: Shows whether investment is being monetised.
  • Relative performance vs AI leaders: Helps identify rotation or lag effects.

ORCL often follows the broader AI trade, even if it does not lead it.

How ORCL Fits Into a Broader Trading Strategy

ORCL is rarely the headline trade, but that is part of its value.

It offers exposure to the AI theme without relying entirely on high-momentum sentiment. For traders, this can make it a useful complement within a broader portfolio.

  • Can balance higher-volatility AI names
  • Offers exposure to enterprise AI adoption
  • Provides a way to track infrastructure demand trends

It also creates natural links to other tradable assets. Traders watching ORCL often track related names across semiconductors, cloud, and tech indices, building a broader view of how the AI cycle is evolving.

Bottom Line

Oracle is not the loudest name in the AI boom, but it is becoming one of the more important supporting players.

Its role in infrastructure, data, and enterprise systems places it in a position to benefit from long-term AI adoption. For traders, ORCL offers a way to participate in that trend without relying entirely on short-term hype cycles.

Create a live VT Markets account today to access our platform features, including market insights and educational content.

Article Recap

What is ORCL stock?

ORCL stock represents shares of Oracle Corporation, a technology company focused on cloud infrastructure, enterprise software, and database systems.

Is Oracle an AI stock?

Oracle is increasingly viewed as an AI-related stock because its cloud infrastructure supports enterprise AI workloads.

Why is ORCL stock gaining attention?

Growth in Oracle Cloud Infrastructure and rising demand for AI computing are driving renewed interest.

How does Oracle compare to Nvidia or Microsoft?

Oracle focuses on infrastructure and enterprise systems, while Nvidia leads in hardware and Microsoft in software integration.

Is ORCL a high-growth AI stock?

It offers AI exposure, but with a more moderate and stable growth profile compared to leading AI stocks.

Start trading now – Click here to create your real VT Markets account

Elliott Wave analysis suggests QQQ completed wave ((1)) at $637.01, ending the prior cycle correction phase

The Nasdaq-100 ETF (QQQ) made a major high on 29 October 2025 at $637.01, labelled wave ((1)) from the 7 April 2025 low. It then moved into wave ((2)) as a correction built as a double three Elliott Wave pattern. From the 29 October high, wave (W) ended at $580.74 and wave (X) rose to $636.60. Wave (Y) then fell to $555.55, completing wave ((2)), as seen on the one-hour chart.

Wave Structure And Near Term Outlook

QQQ has since moved higher in wave ((3)), but a break above $637.01 is still needed to rule out a double correction. From $555.55, wave ((i)) reached $564.45, wave ((ii)) dipped to $557.86, and wave ((iii)) rose to $587.74. Wave ((iv)) pulled back to $582.33. A further rise is expected to form wave ((v)) and finish wave 1 at the larger degree. After that, wave 2 is expected to retrace the move from the 31 March low before the uptrend continues. In the short term, while $555.47 holds, pullbacks may find support in three or seven swings. We are observing the market’s recovery from the corrective low of $555.55 set earlier this year. Looking back, the Nasdaq-100 ETF peaked on October 29, 2025, and the subsequent pullback appears to have established a solid base for the next major advance. This formation suggests the primary trend has turned upward again. Recent economic data supports a bullish outlook, making the case for a new upward wave more compelling. The March 2026 Consumer Price Index report showed inflation cooling to a 2.8% annual rate, slightly below consensus expectations and fueling hopes for a more accommodative Federal Reserve stance later this year. We’ve also seen the CBOE Volatility Index (VIX) fall below 15, indicating reduced fear among investors and making options premiums relatively cheaper.

Options Positioning And Key Levels

For derivative traders, this environment suggests using pullbacks as buying opportunities for call options or bull call spreads. The expected minor correction, wave 2, should be viewed as a chance to establish long positions at favorable prices before the next significant leg up begins. This pattern is similar to what we saw in the first half of 2023, when shallow dips were aggressively bought during the start of a new bull cycle. The critical level to watch is the pivot at $555.47, which represents the recent major low. Selling out-of-the-money put credit spreads with strike prices below this level could be a viable strategy to collect premium, capitalizing on the expectation that this support will hold firm. As long as this floor remains intact, the path of least resistance is to the upside. The key resistance remains the October 2025 high of $637.01; a decisive breakout above this price is needed to confirm the bull trend. Traders could structure trades like debit spreads that profit from a move toward and through this level in the coming weeks. The low implied volatility makes buying these directional spreads more attractive than in a high-volatility environment. Create your live VT Markets account and start trading now.

Start trading now – Click here to create your real VT Markets account

Dutch retail sales annual growth slowed from 2.2% to 1.3%, with February showing weaker consumer spending overall

Dutch retail sales rose 1.3% year on year in February. This was down from 2.2% in the previous period. The latest figure shows slower growth in retail sales compared with the prior reading. No further breakdown was provided in the data shared.

Consumer Spending Momentum Weakens

The recent drop in Dutch retail sales growth to 1.3% for February is a clear signal that consumer spending is losing momentum. This slowdown points to potential headwinds for the wider Dutch economy as we head into the second quarter. For us, this is an early indicator that growth forecasts for the region might be too optimistic. This data aligns with the latest Eurostat flash estimate showing Eurozone inflation remaining sticky at 2.4%, complicating the European Central Bank’s next move. We’re also seeing similar softness in German factory orders, which fell 0.8% last month, reinforcing a theme of a broader European slowdown. This puts pressure on the ECB to consider a more dovish stance, which may not have been priced in by the market. Given this, we should consider buying put options on the AEX index as a hedge against a potential market dip in the coming weeks. We should also expect implied volatility to rise on Dutch consumer-focused stocks, like Ahold Delhaize and Just Eat Takeaway. This environment could be favorable for strategies like put spreads to manage costs while positioning for a downside move.

Historical Parallels And Market Positioning

Looking back from 2025, we saw a similar dynamic during the energy price shock of 2022, where a sharp drop in retail sales preceded a six-month period of market stagnation. That period taught us that consumer sentiment can turn quickly, and initial data points like this are often the first warning. Back then, positioning in defensive assets and shorting cyclical indices proved to be a successful strategy. This slowdown in a core EU economy also adds weight to a bearish outlook on the Euro currency. Options strategies targeting a move lower in the EUR/USD pair may become more attractive, especially as US economic data appears more resilient. We are watching the key 1.0700 level in the EUR/USD spot market, as a firm break below could trigger further selling. Create your live VT Markets account and start trading now.

Start trading now – Click here to create your real VT Markets account

Dividend Adjustment Notice – Apr 02 ,2026

Dear Client,

Please note that the dividends of the following products will be adjusted accordingly. Index dividends will be executed separately through a balance statement directly to your trading account, and the comment will be in the following format “Div & Product Name & Net Volume”.

Please refer to the table below for more details:

Dividend Adjustment Notice

The above data is for reference only, please refer to the MT4/MT5 software for specific data.

If you’d like more information, please don’t hesitate to contact [email protected].

According to FXStreet data, gold prices in India declined, with values compiled showing a fall today

Gold prices in India fell on Thursday, based on FXStreet data. Gold was priced at INR 14,163.99 per gram, down from INR 14,439.80 on Wednesday. Gold was priced at INR 165,188.20 per tola, down from INR 168,415.90 a day earlier. Other published rates were INR 141,622.40 for 10 grams and INR 440,561.30 per troy ounce. FXStreet derives India gold prices by converting international pricing using USD/INR and local units. The figures are updated daily at the time of publication and are provided as reference, as local market rates may vary slightly. Central banks held the largest gold reserves and added 1,136 tonnes worth about $70 billion in 2022, according to the World Gold Council. This was the highest annual purchase since records began. Gold prices can move with changes in the US Dollar, US Treasuries, and broader risk assets, and are quoted as XAU/USD. Prices can also be affected by geopolitical events, recession fears, and interest rate changes. The recent drop in gold prices presents a critical decision point for us. We need to determine if this is a temporary dip within a larger bull market or the beginning of a sustained downturn. The key lies in understanding the competing forces of monetary policy and safe-haven demand. The US Dollar is strengthening on the back of renewed inflation fears, with recent data showing CPI ticking up to 3.1% in the first quarter. This has led to expectations that the Federal Reserve might delay further rate cuts planned for this year, making non-yielding gold less attractive. A stronger dollar and the prospect of higher-for-longer interest rates create significant headwinds for the precious metal. However, we must not ignore the relentless demand from central banks, which has continued unabated since the record buying we saw back in 2022. Looking at the data from 2023 and 2024, central banks consistently added over 1,000 tonnes to their reserves annually, providing a strong floor for prices. This strategic accumulation, coupled with ongoing geopolitical instability, suggests powerful underlying support. We should also remember the significant rally gold experienced throughout 2025, which built on the record highs first set in 2024. From that perspective, this current weakness could simply be profit-taking rather than a fundamental shift in the long-term upward trend. Such corrections are healthy and have historically presented buying opportunities during sustained bull markets. This conflict between hawkish monetary policy and strong physical demand is likely to increase market volatility in the coming weeks. For derivative traders, this suggests that option premiums may become more expensive, reflecting the uncertainty. Strategies that account for a potential sharp move in either direction, rather than a simple directional bet, could prove prudent.

Start trading now – Click here to create your real VT Markets account

Back To Top
server

Hello there 👋

How can I help you?

Chat with our team instantly

Live Chat

Start a live conversation through...

  • Telegram
    hold On hold
  • Coming Soon...

Hello there 👋

How can I help you?

telegram

Scan the QR code with your smartphone to start a chat with us, or click here.

Don’t have the Telegram App or Desktop installed? Use Web Telegram instead.

QR code