Market Focus
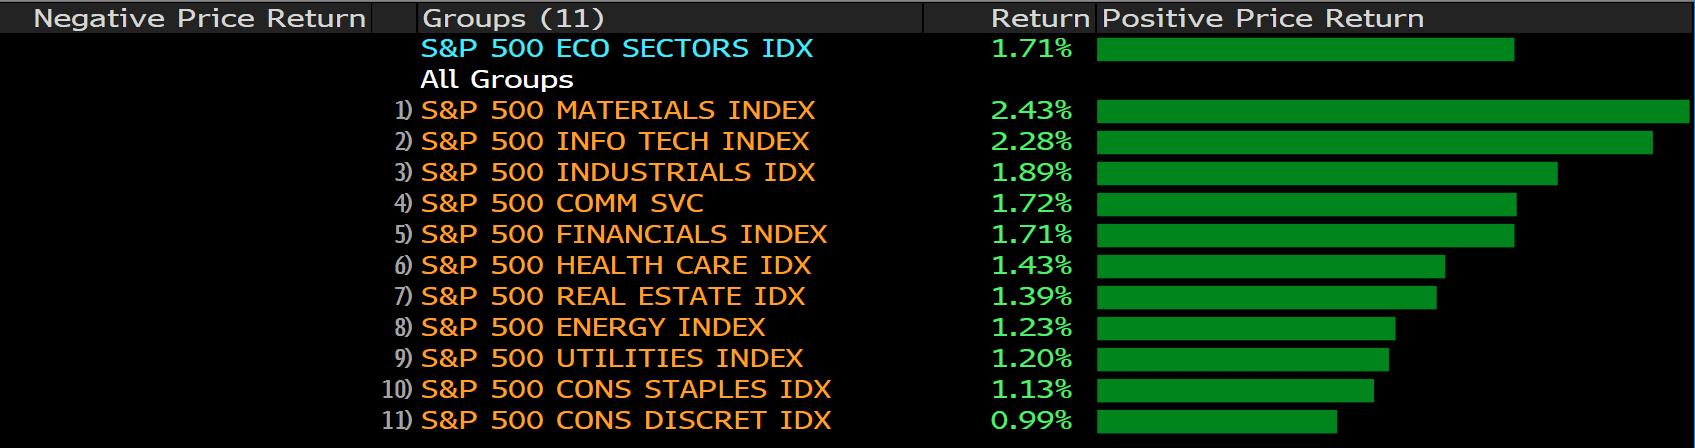
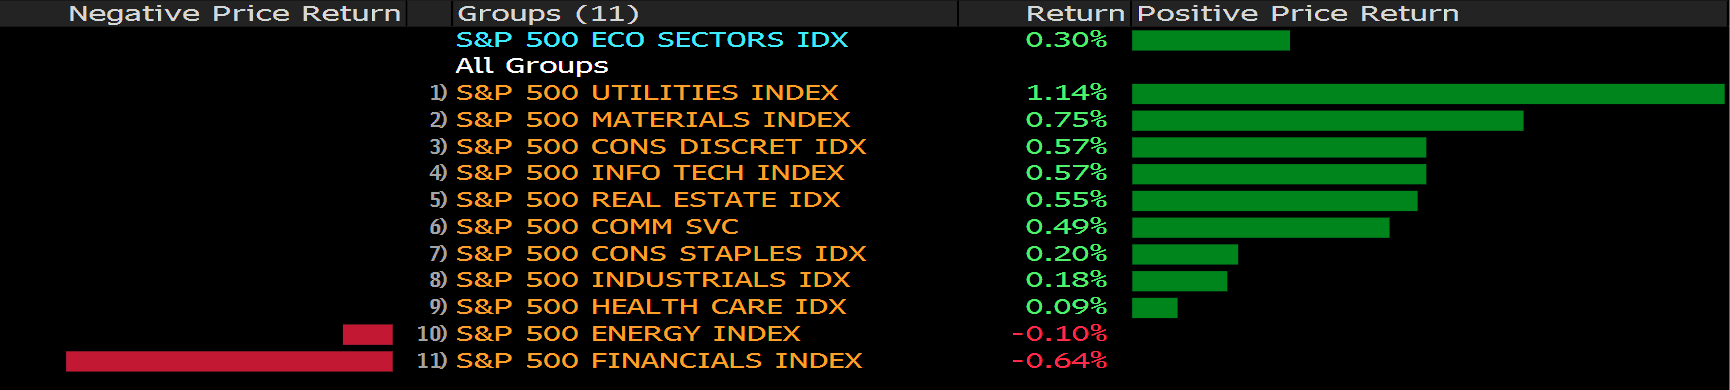
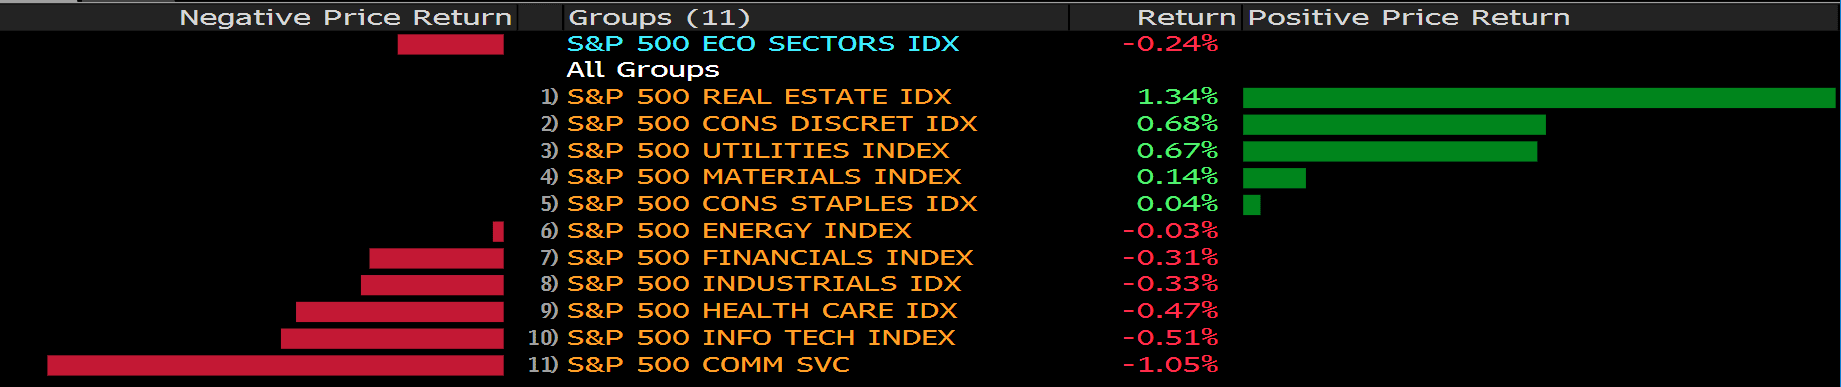
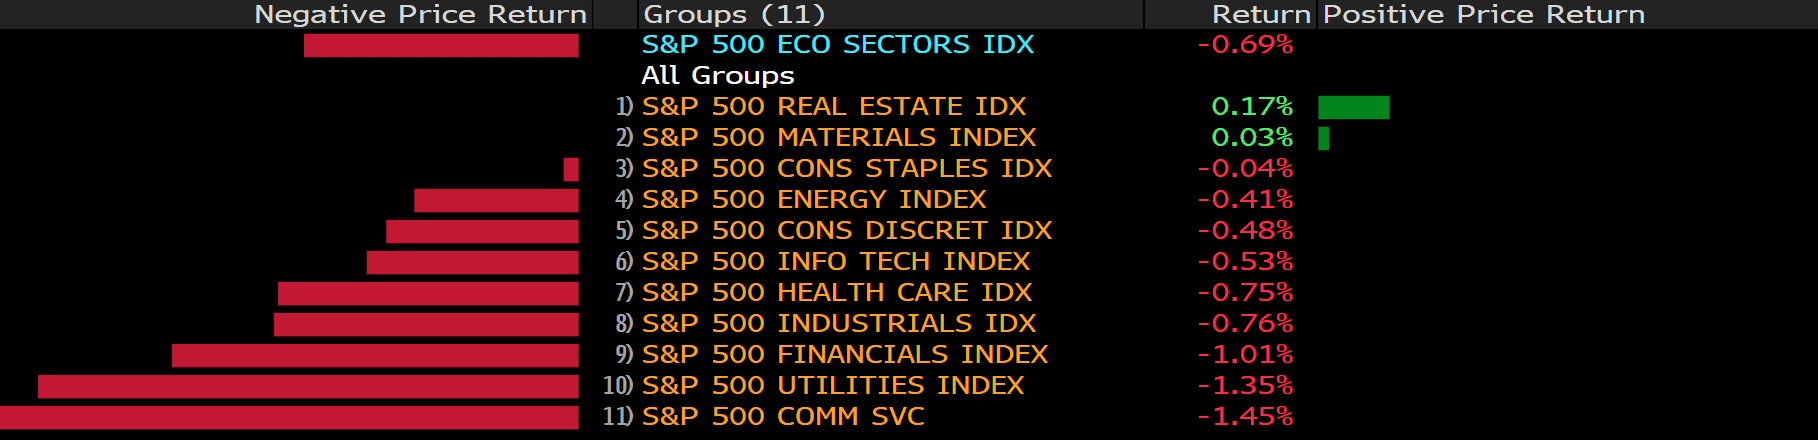
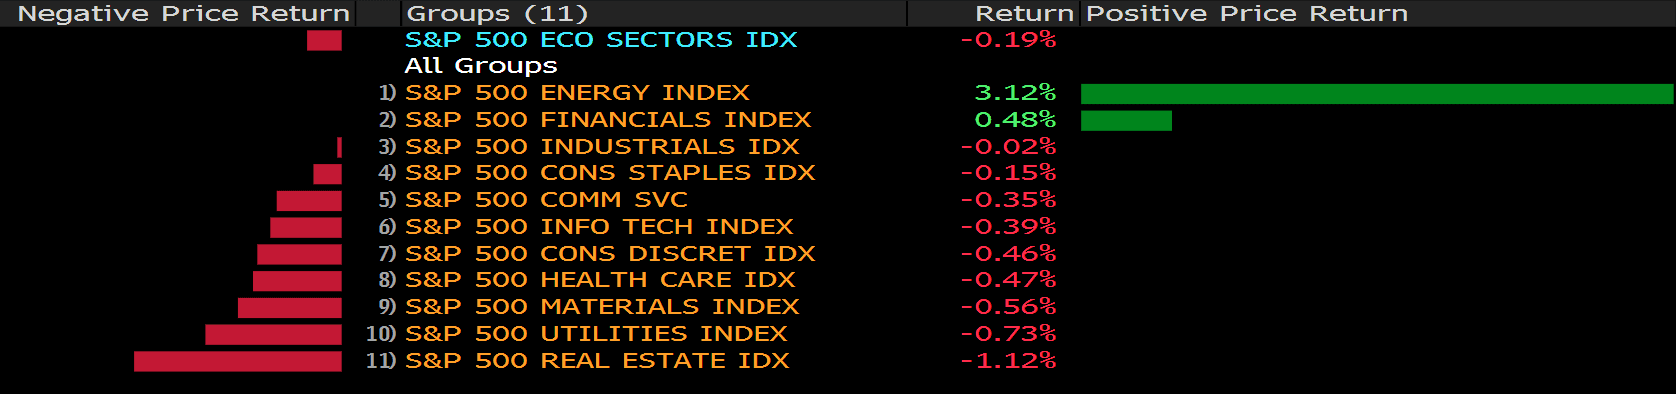
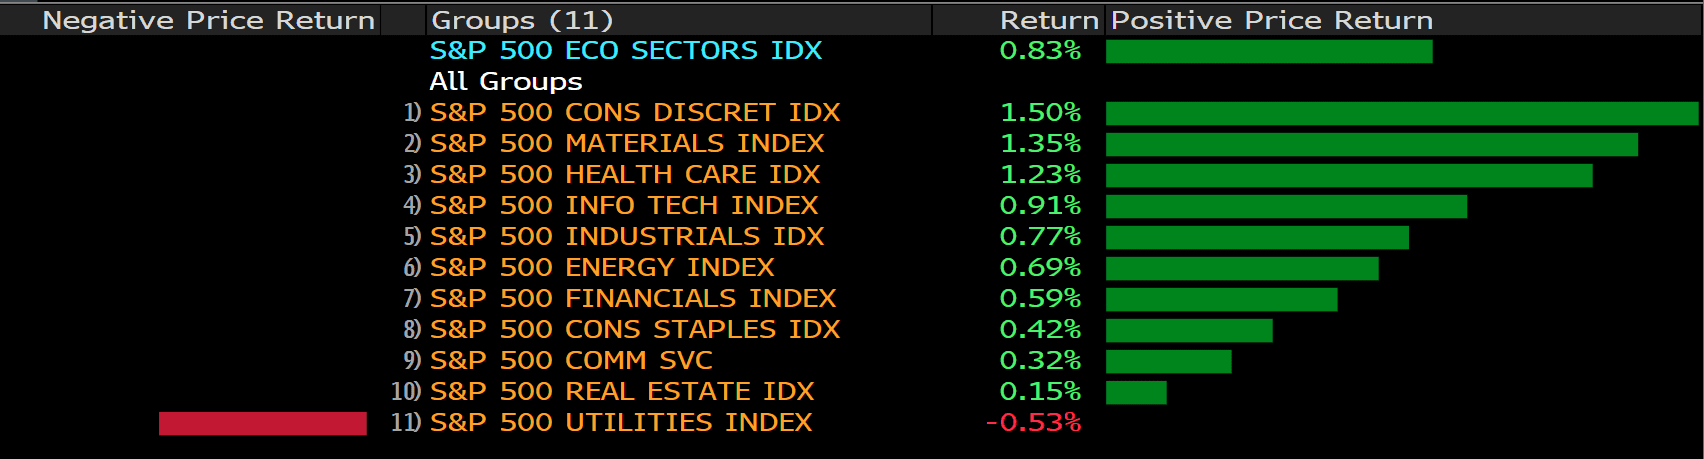
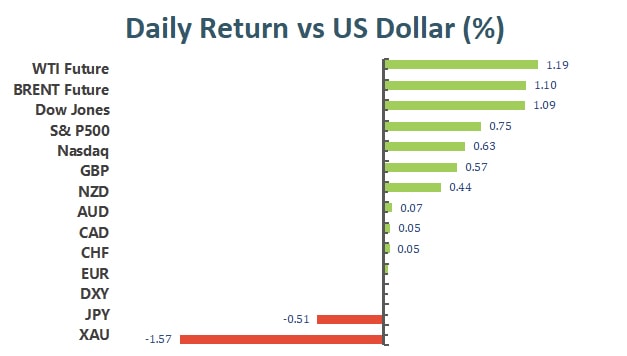
The broad U.S. equity market enjoyed another positive day on Friday to close out the week with positive gains. Strong 3rd quarter earnings and healthy consumer spending propelled stocks higher on Friday. The S&P 500 gained 0.7% to close at 4471.37, the Dow advanced 1.1% to 35294.76, and the Nasdaq gained 0.5% to close at 14897.34.
The financial sector reported healthy earnings for the third quarter. Goldman Sachs Group reported earnings of $5.38 billion for the third quarter, a 60% year over year gain; meanwhile, Morgan Stanley reported a 36%, year over year, earnings gain.
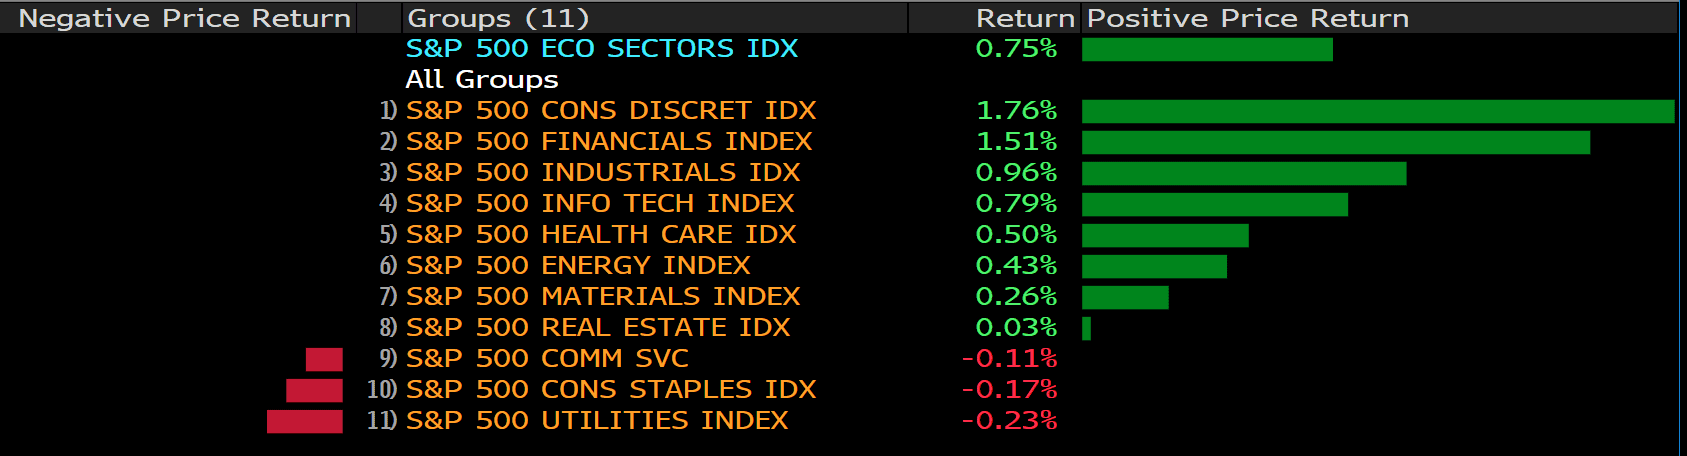
Retail sales for September increased 0.7%, beating estimates. Rising retail sales figures could ease some investors’ concerns over a slowing economy and inflation.
The U.S. 10 year treasury yield rose again on Friday, and the benchmark is currently sitting at 1.574%. Oil prices leaped further on Friday as demand for oil picks up as global governments begin to ease pandemic era travel restrictions. The U.S. will lift COVID-19 travel restrivtions for fully vaccinated foreigners effective Novemeber 8th. The Brent Crude future gained 1% to settle at $84.86 a barrel, and the WTI future gained 1.2% to settle at $82.28 a barrel.
Main Pairs Movement:
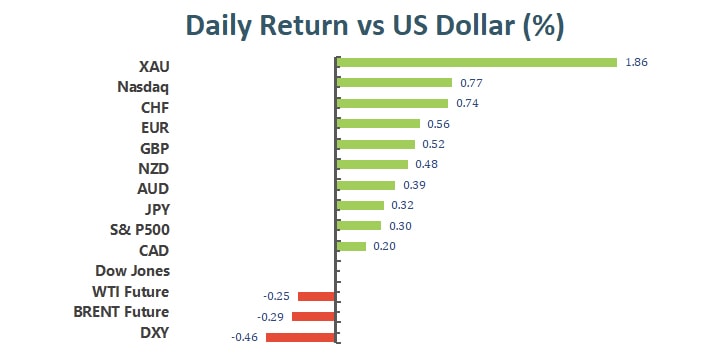
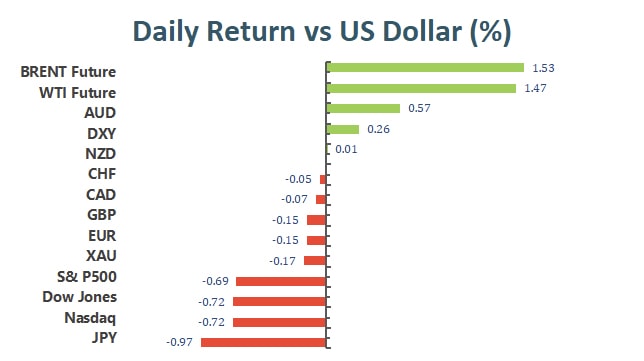
The impact of the surging US Treasury yields on the greenback was offset by the broader risk-on market sentiments, left the dollar index trading sideways on Friday. With the benchmark 10-year US Treasury bond yield holding above critical 1.5% handle, the dollar stays resilient in the early European session on Friday, but at the second half of the day, though the upbeat September Retail Sales report boosted the dollar a bit, the following Michigan Consumer Sentiment Index data.was underperformed and dragged the dollar index down the 94.00 threshold.
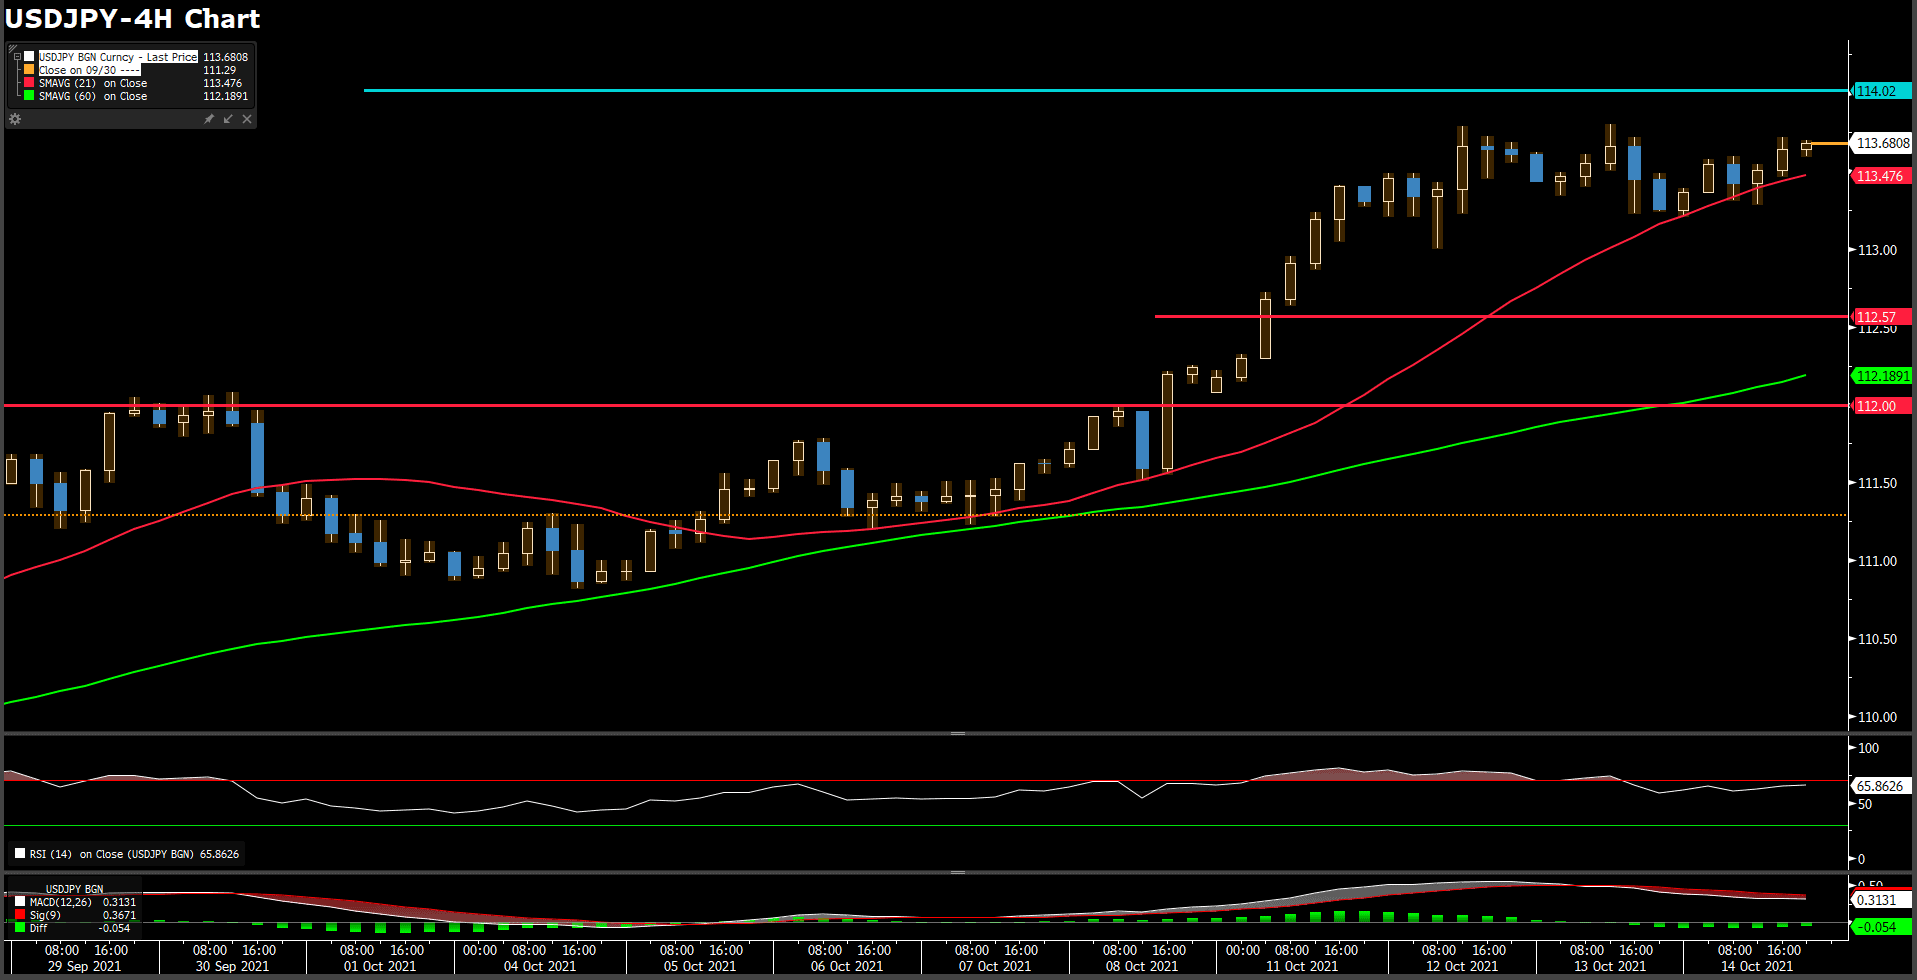
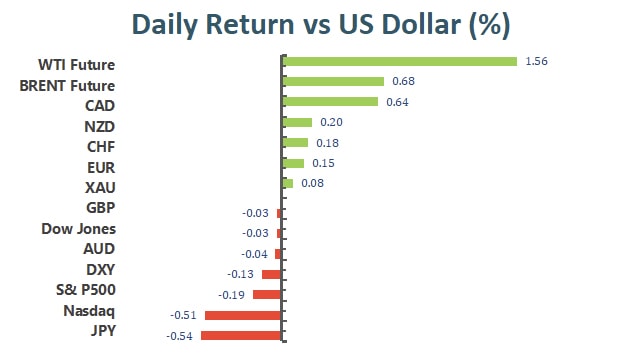
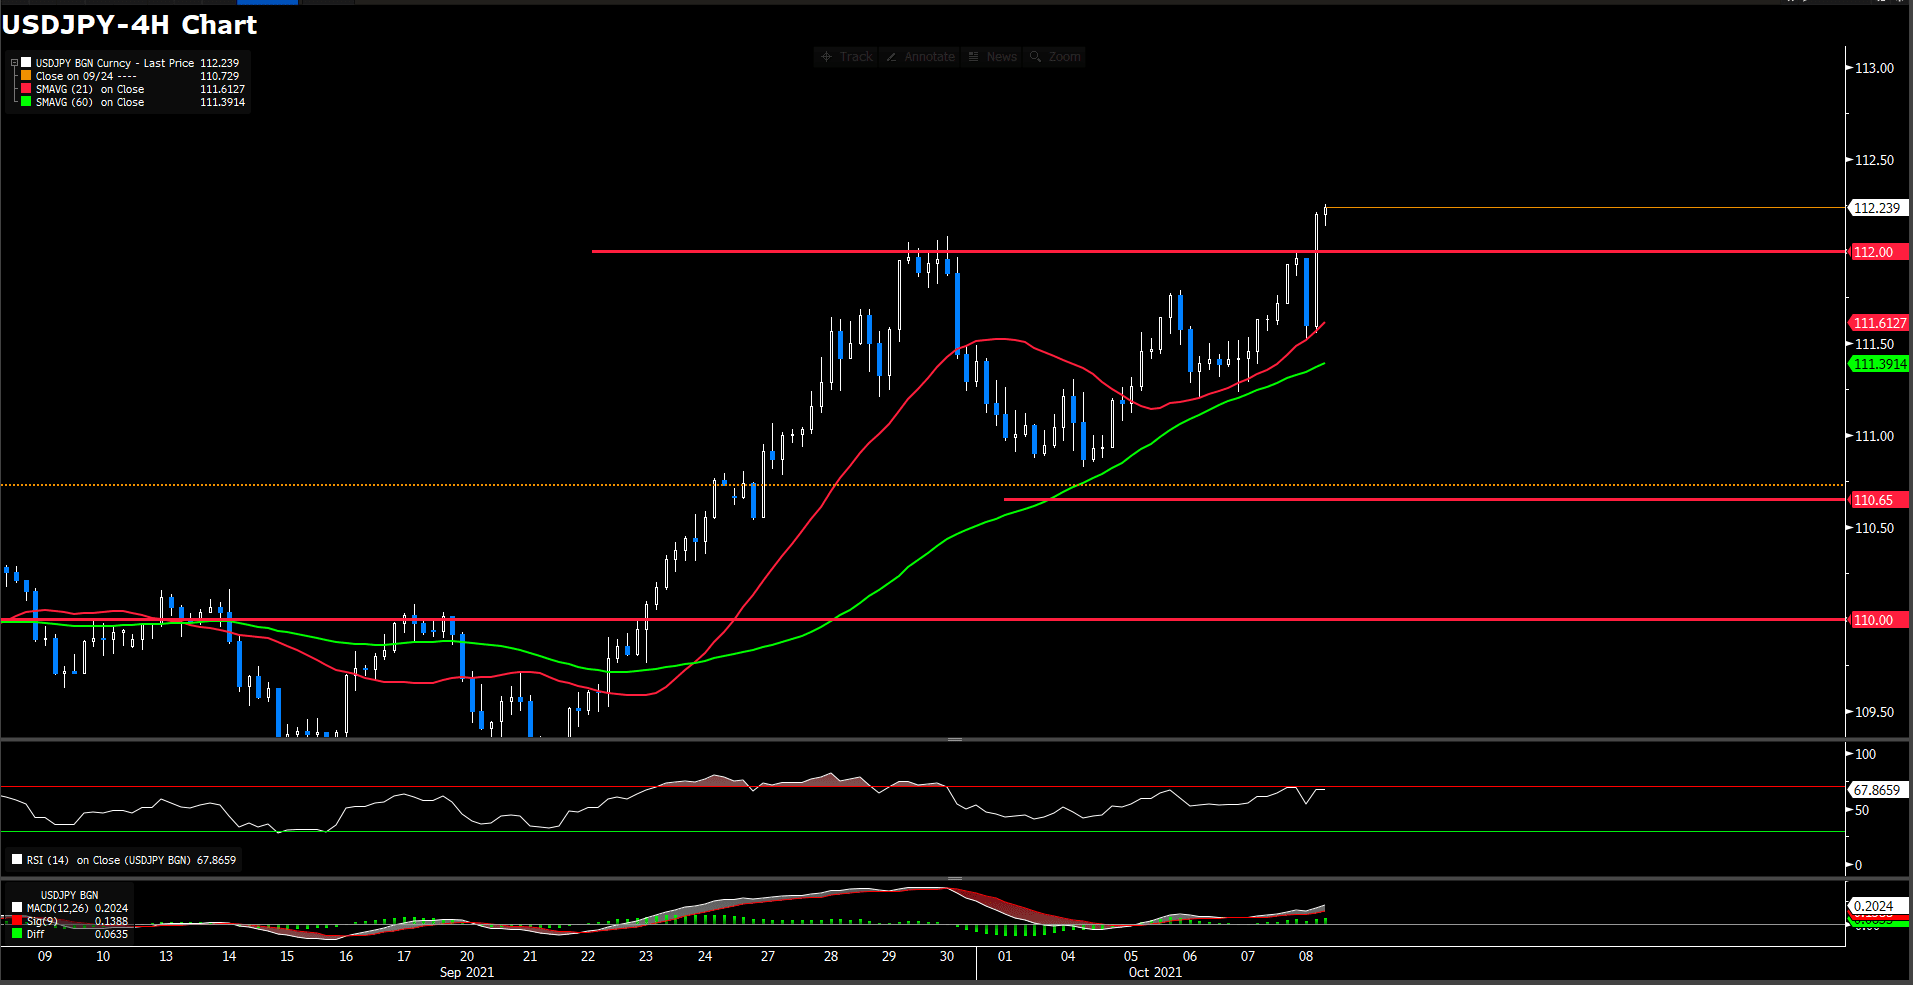
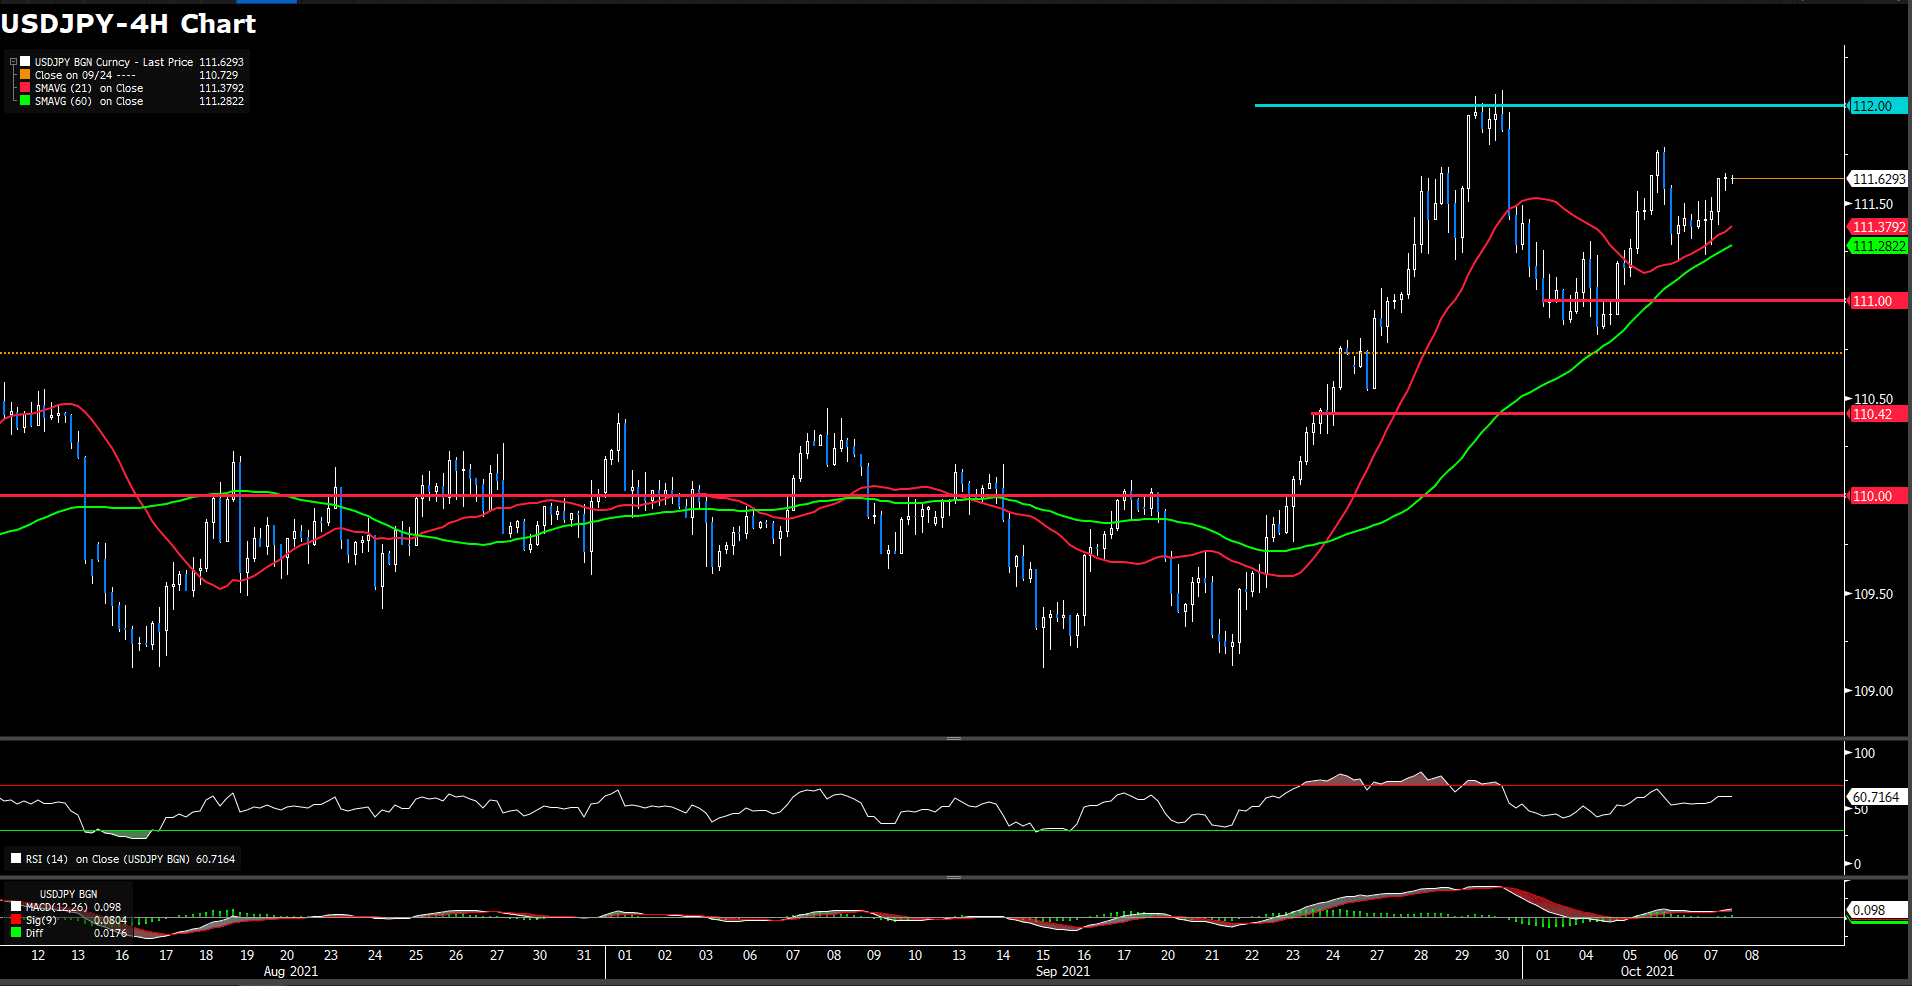
The EUR/USD pair is treading water on both sides of the 1.1600 level, unable to take advantage of a weaker US dollar. The sterling is the best performer among its main peers. Cable has rallied on Friday to break above 1.3750, reaching 1.3775 for the first time since mid-September. On the flip side, JPY is the worst. The USD/JPY pair surged over 0.5% during the day, now trading at 114.30. Commodity-linked currencies hovers around the familiar levels. Loonie settles at 1.2380 at the moment, and Aussie was last seen at 0.7418.
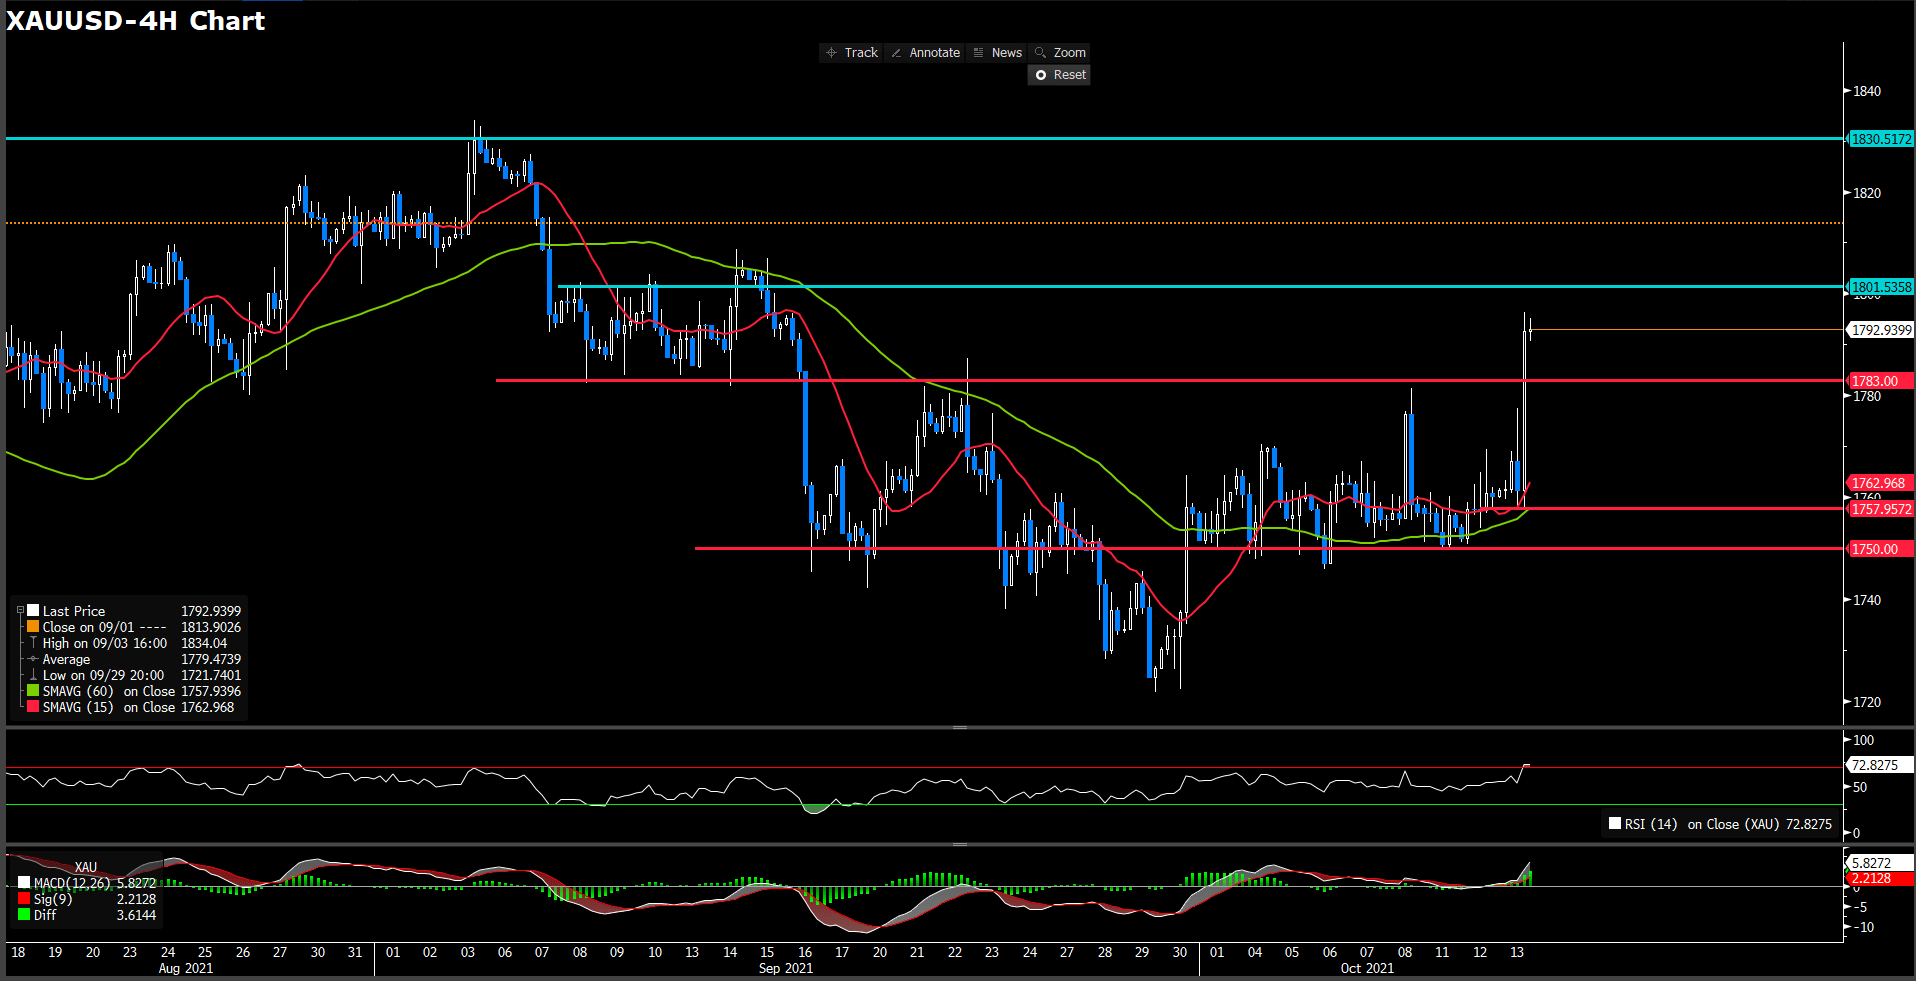
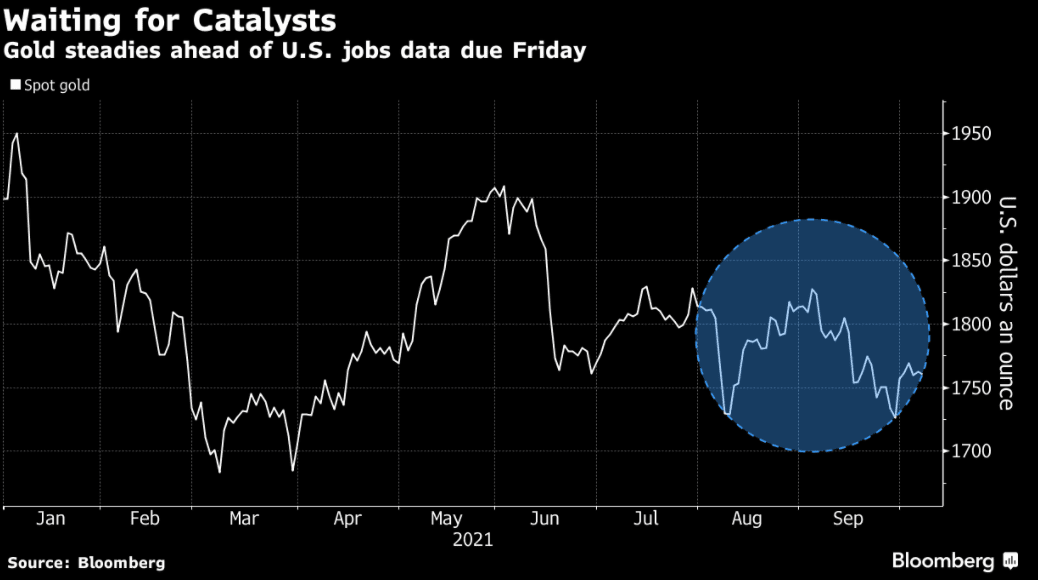
Gold lost most of its Thursday’s gains and retreated to $1767.61 a troy ounce. Crude oil prices extend further north to fresh highs. WTI trades at $82.10 as of writing, and Brent once breached $85.00 price level during the early European session, now settles around $84.70.
Technical Analysis:
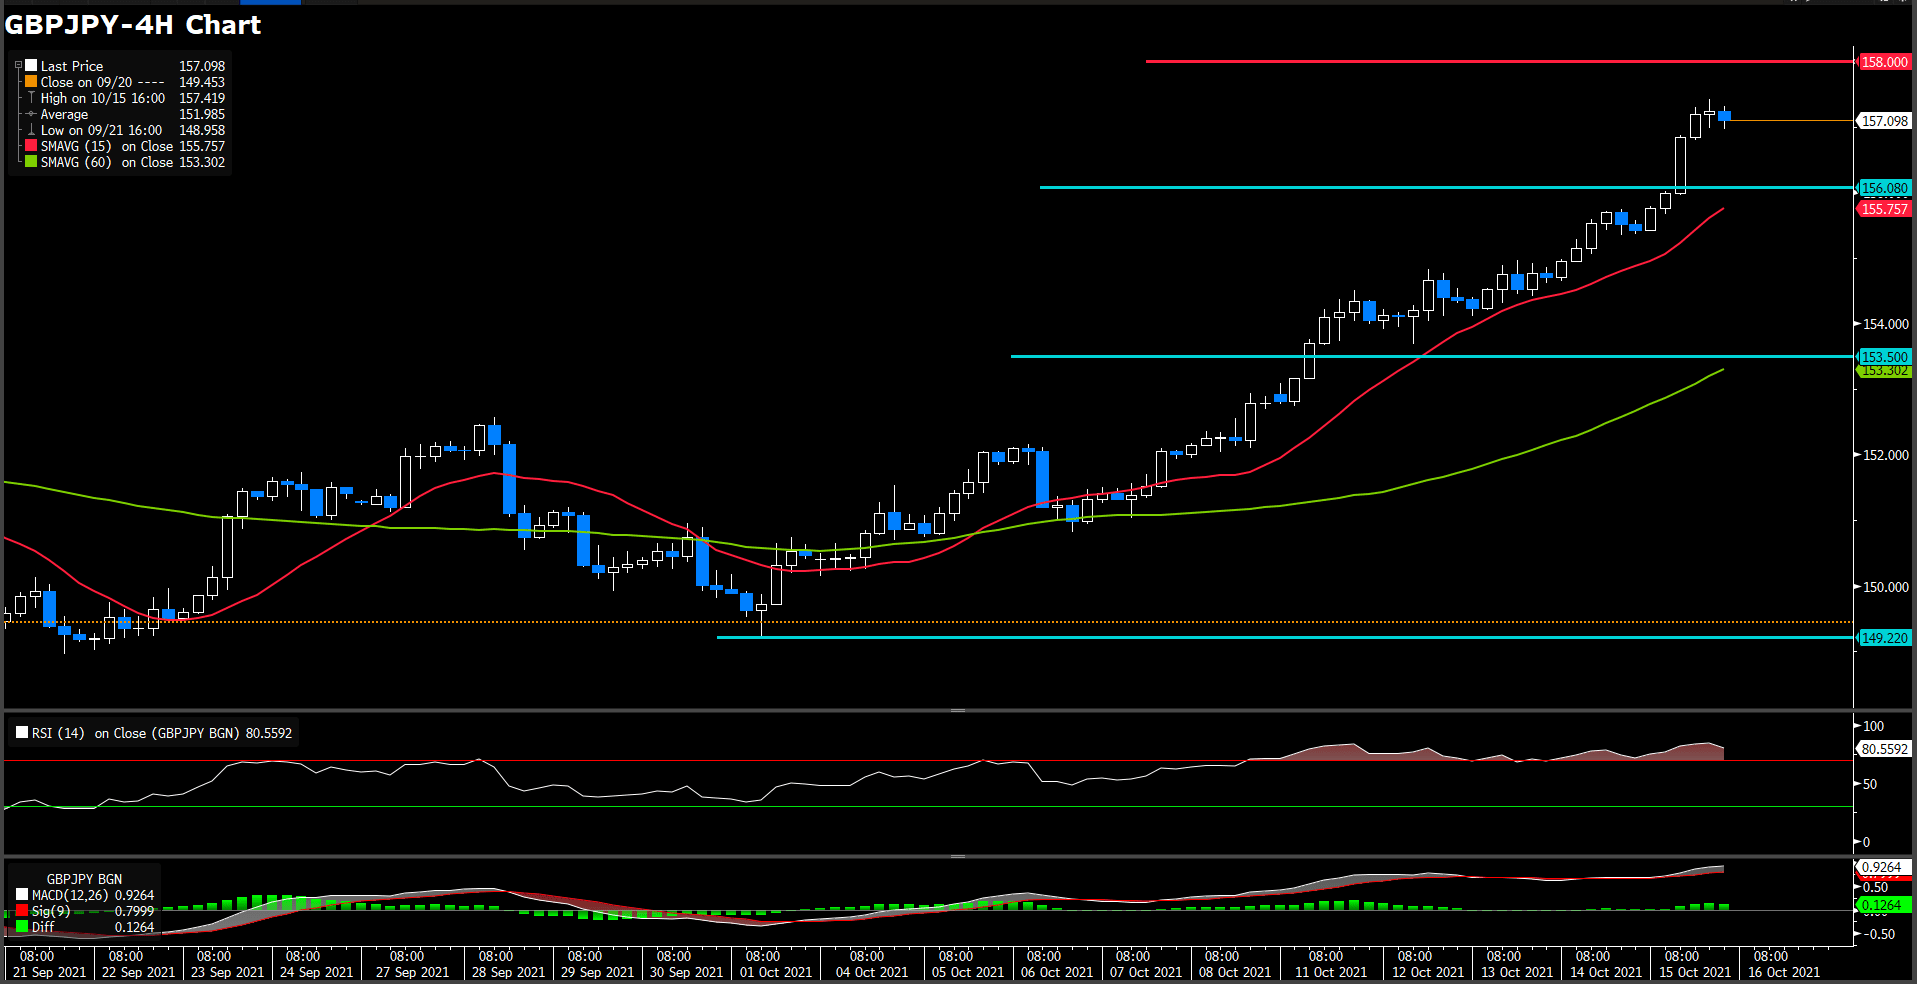
The GBP/JPY cross continued scaling higher through the first half of the European session and once surged to the highest level since June 2016. Bulls are now looking to build on the momentum further beyond the 157.00 round-figure mark.
The momentum took along some short-term trading stops placed near the previous yearly tops, around the 156.00 mark. This seemed to have prompted aggressive short-covering and further contributed to the strong bid surrounding the GBP/JPY cross. With the latest leg up, the cross has now rallied nearly 800 pips from monthly swing lows, around the 149.20 area.
Meanwhile, technical indicators on short-term charts are already flashing overbought conditions and warrant some caution for bullish traders. Hence, it will now be interesting to see if the GBP/JPY cross continues with its positive move or bulls opt to take some profits off the table heading into the weekend.
Resistance: 160.00, 163.90(July 2016 top)
Support: 156.08, 153.50, 149.22
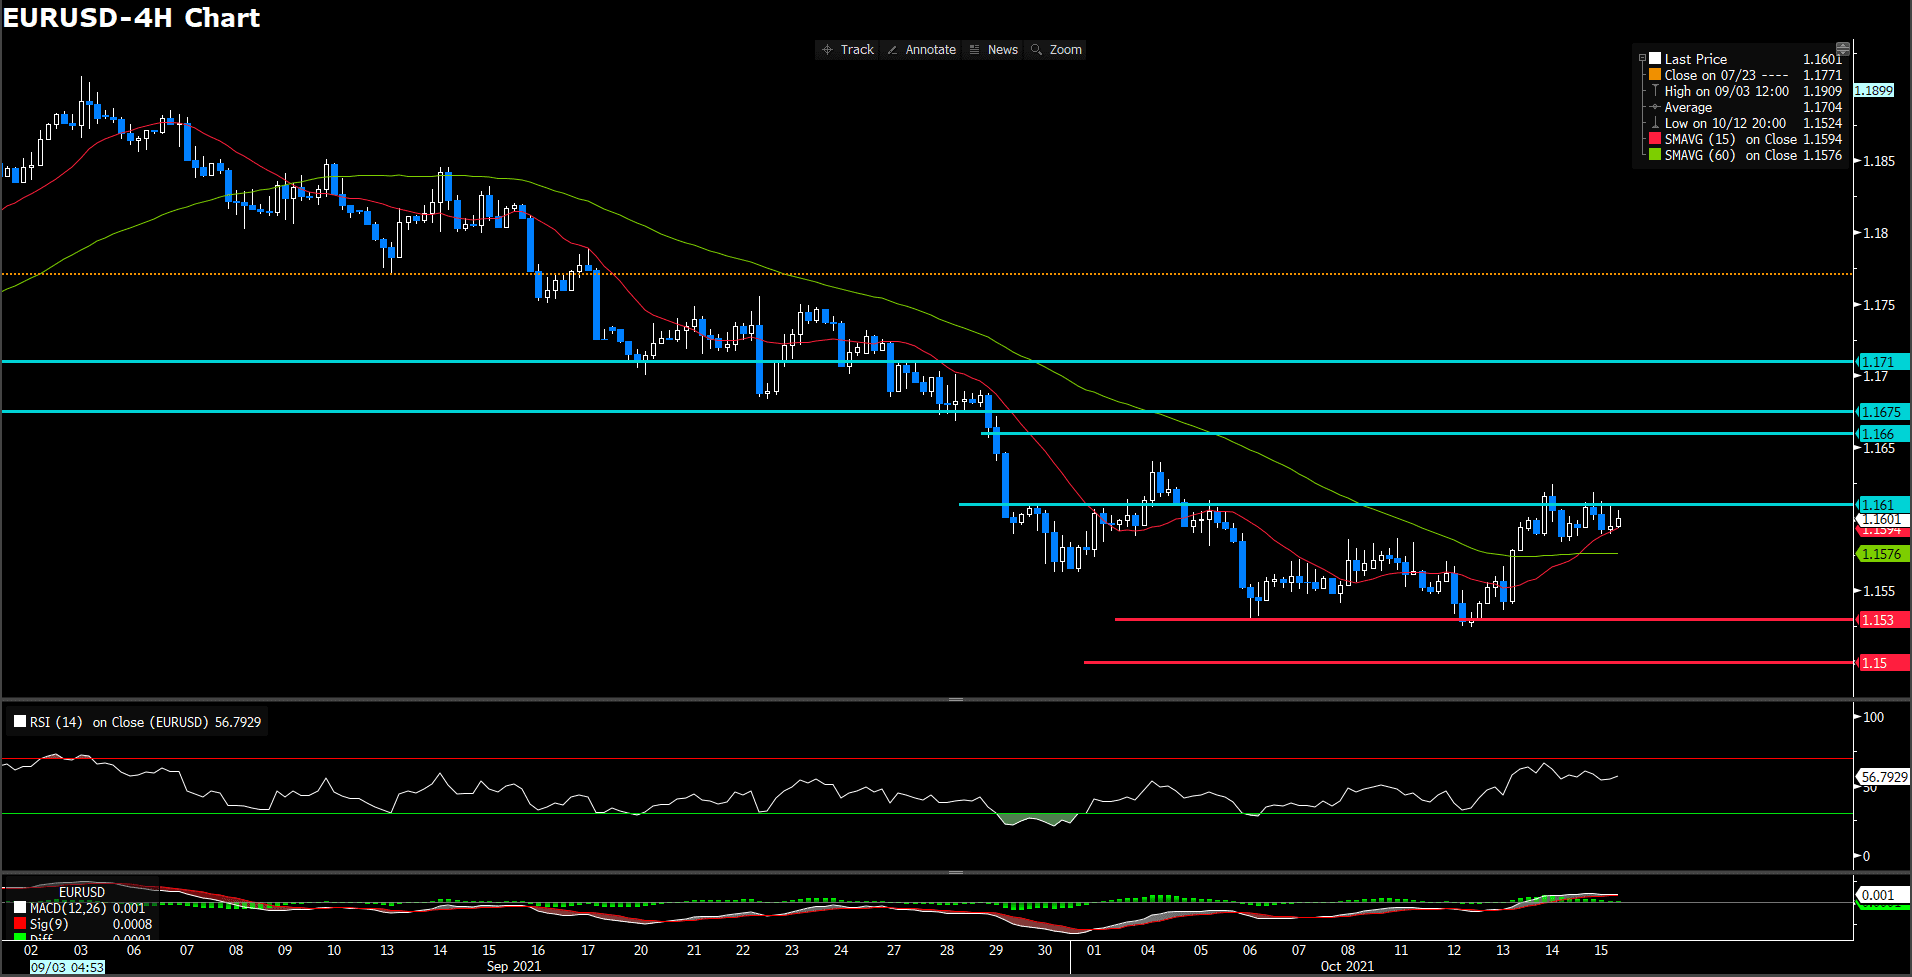
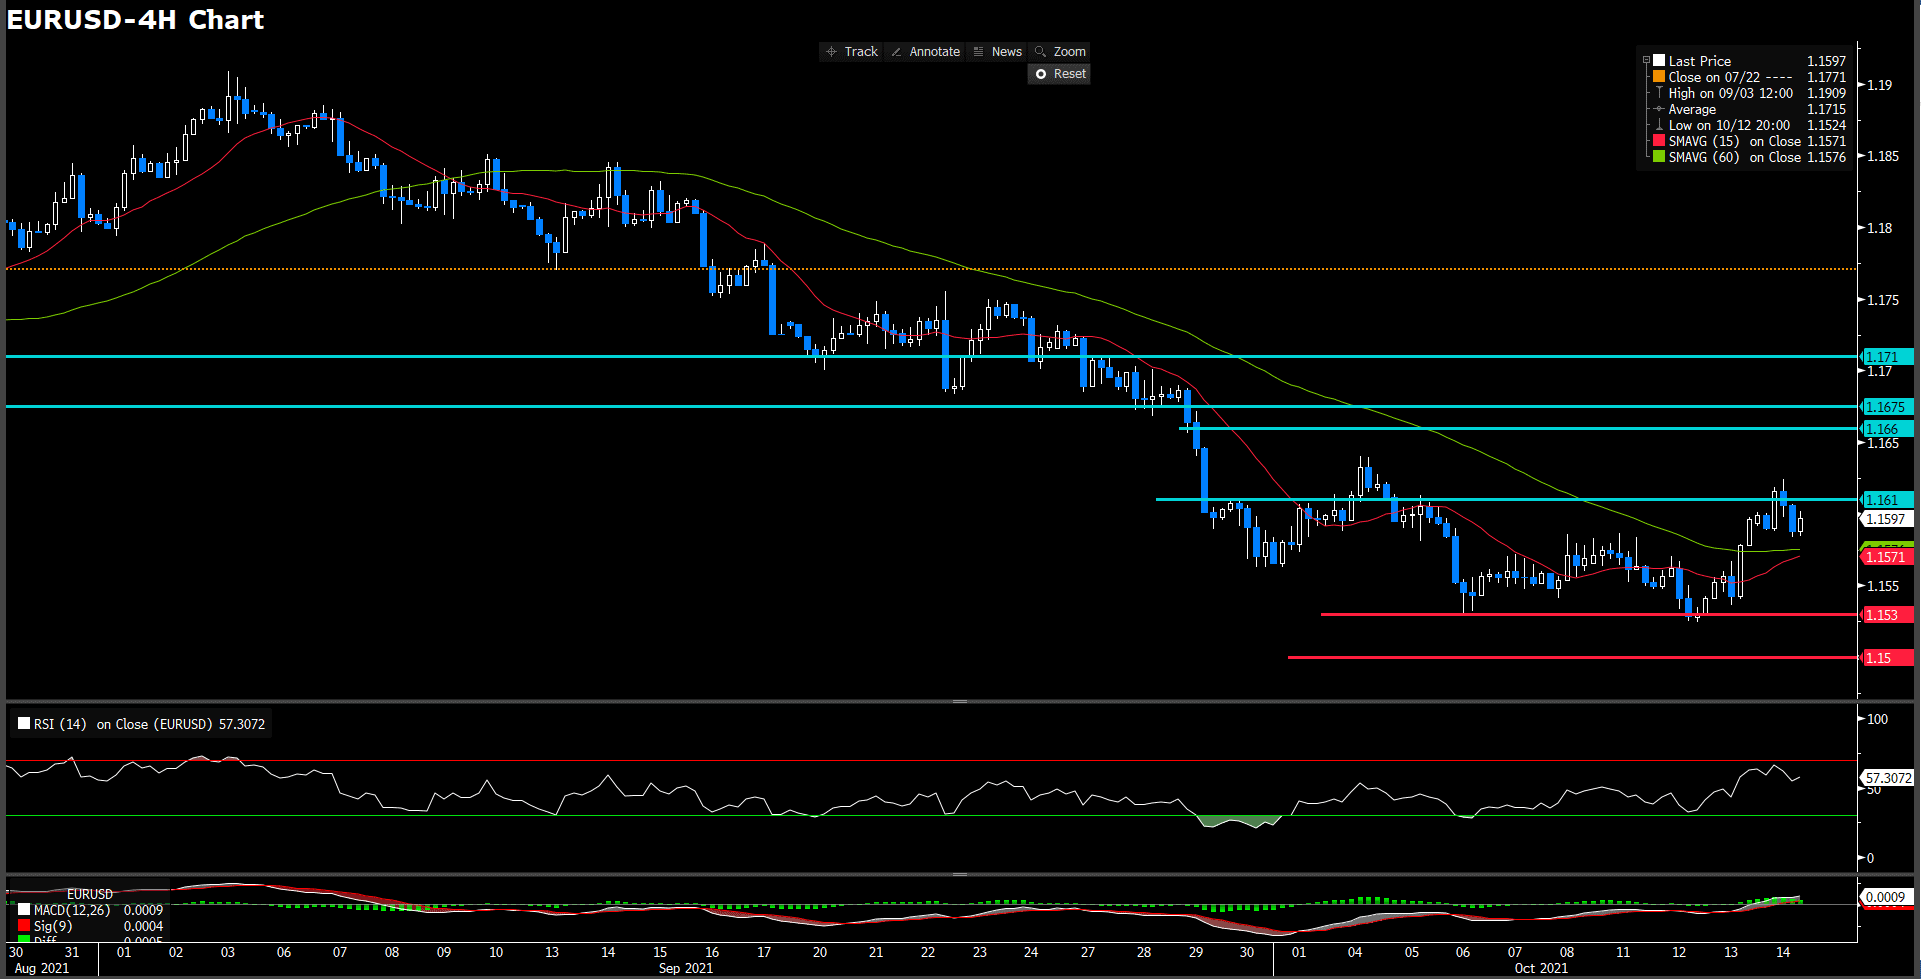
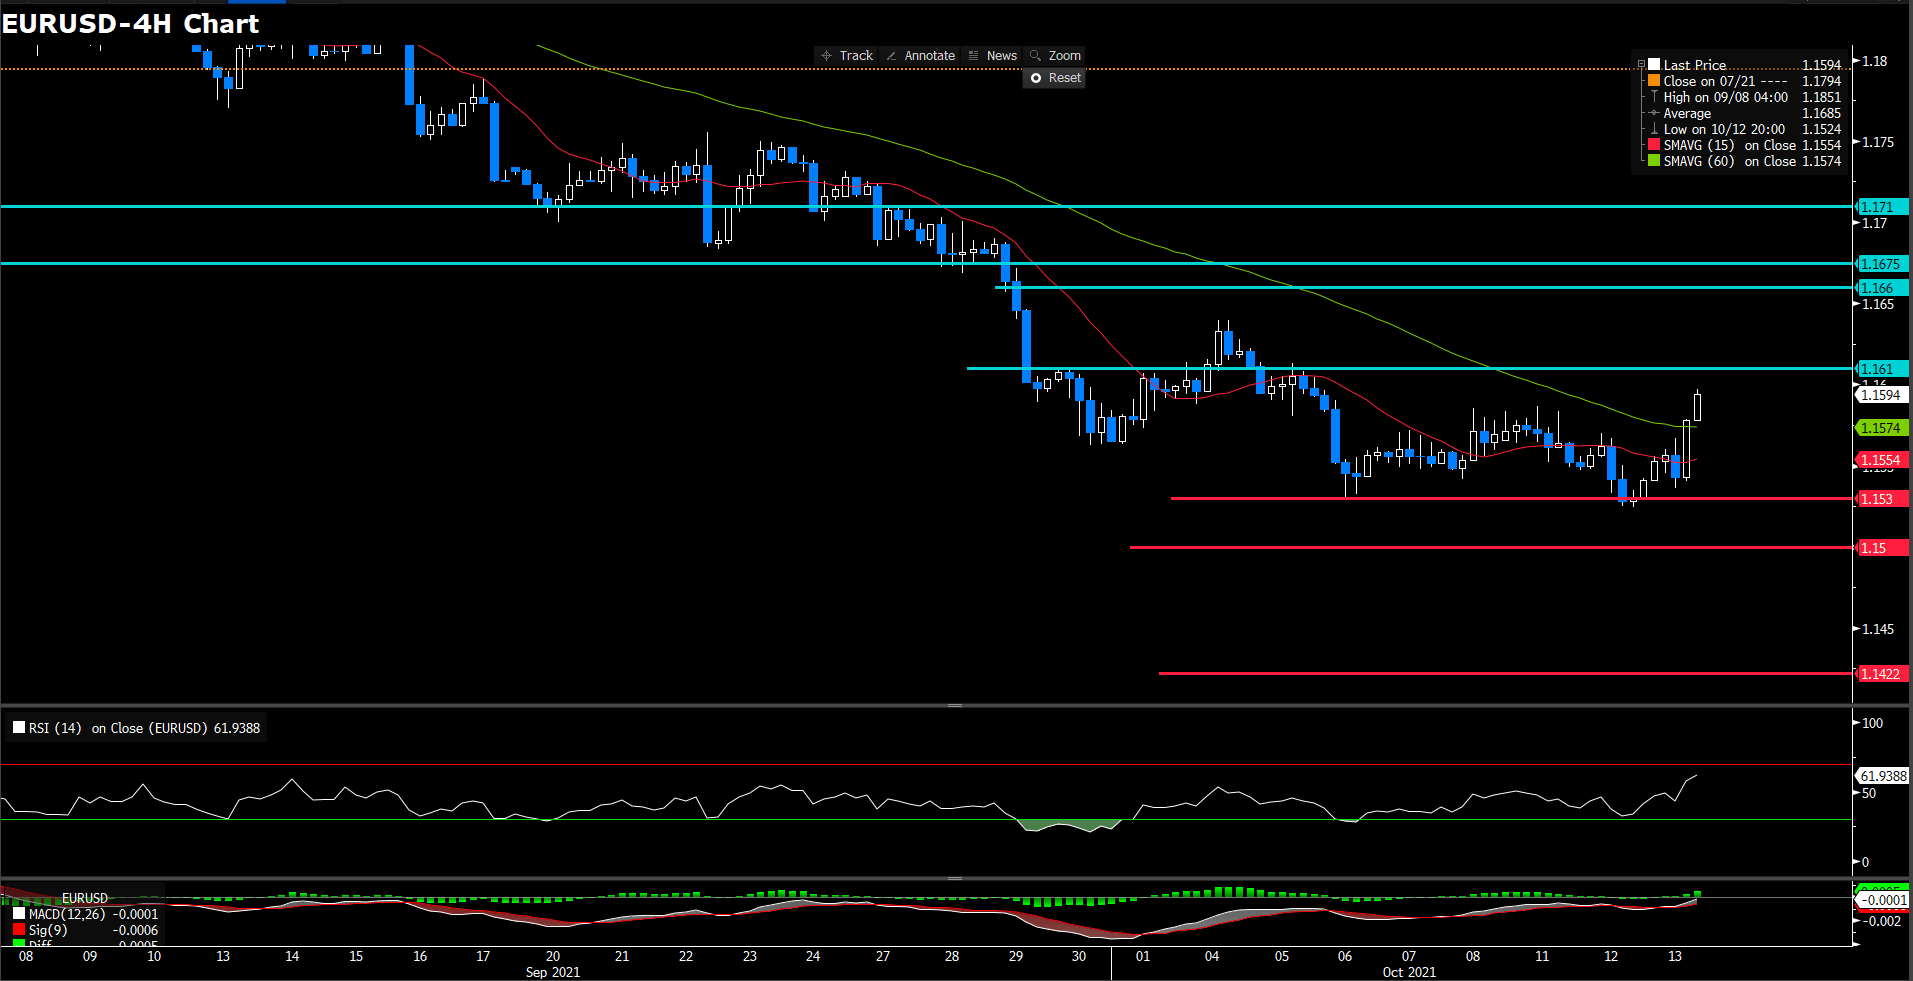
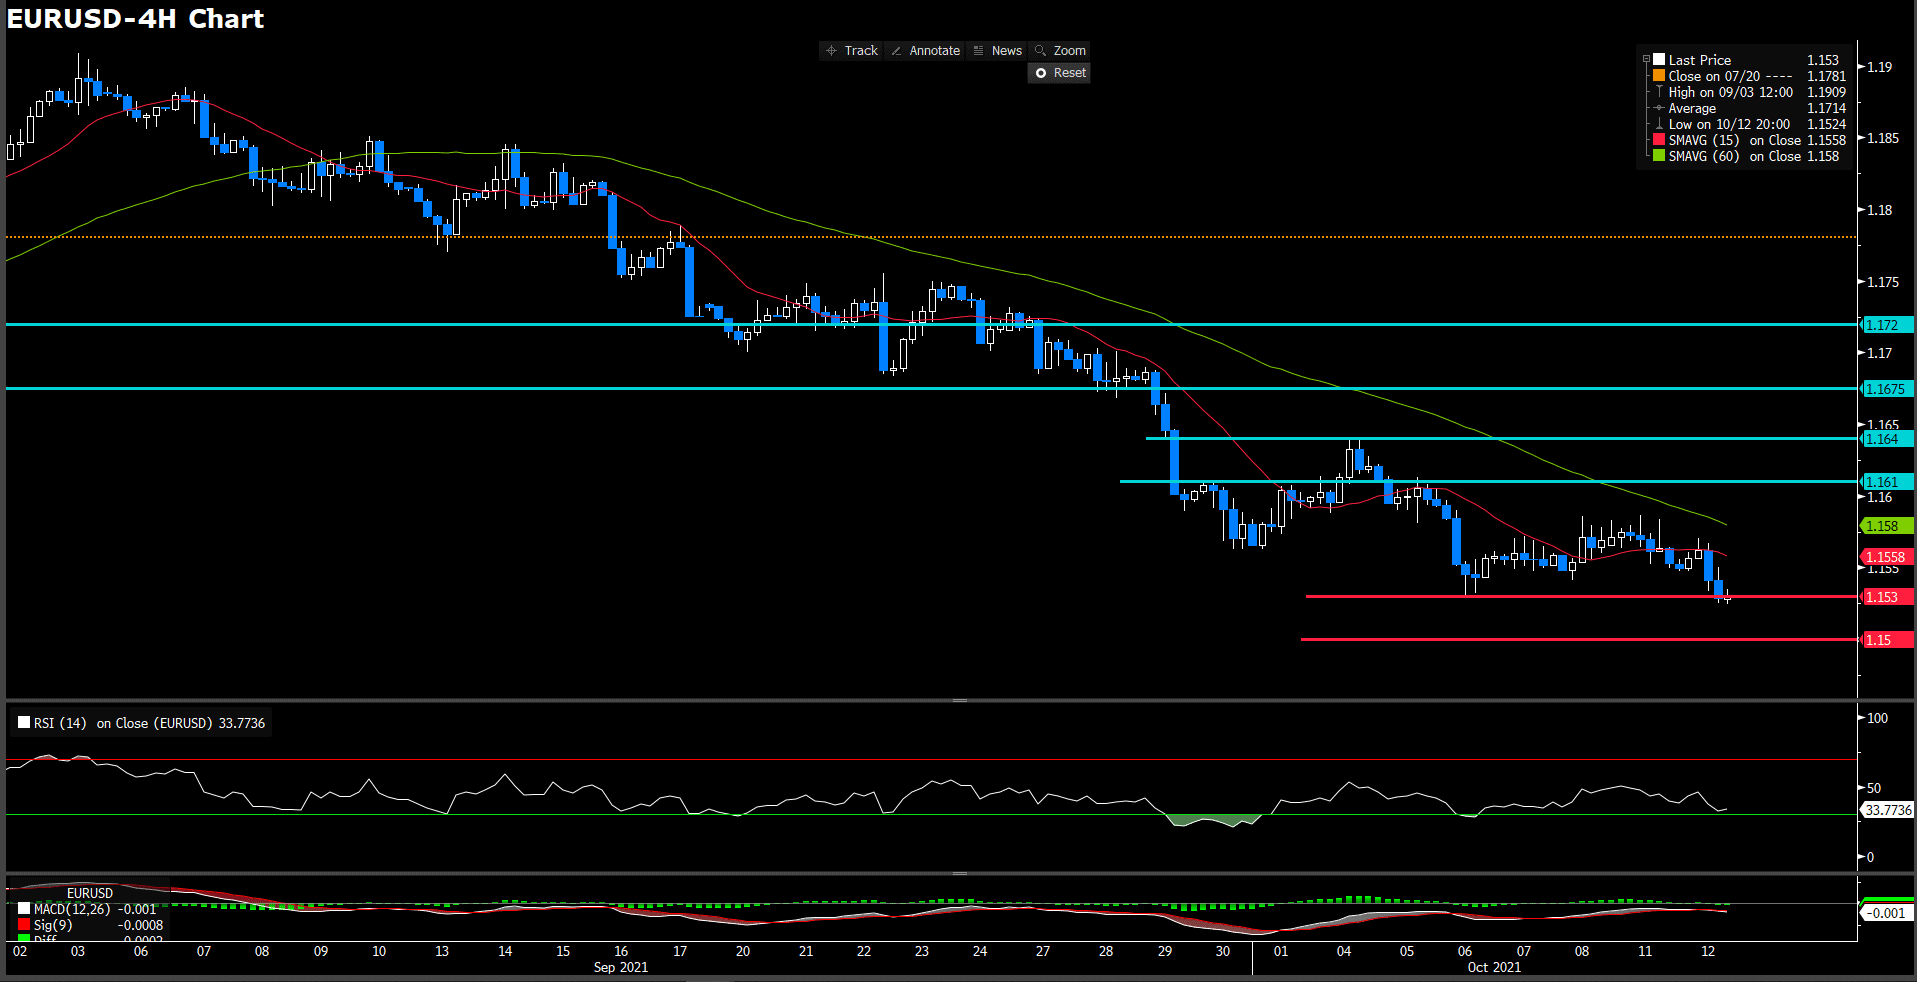
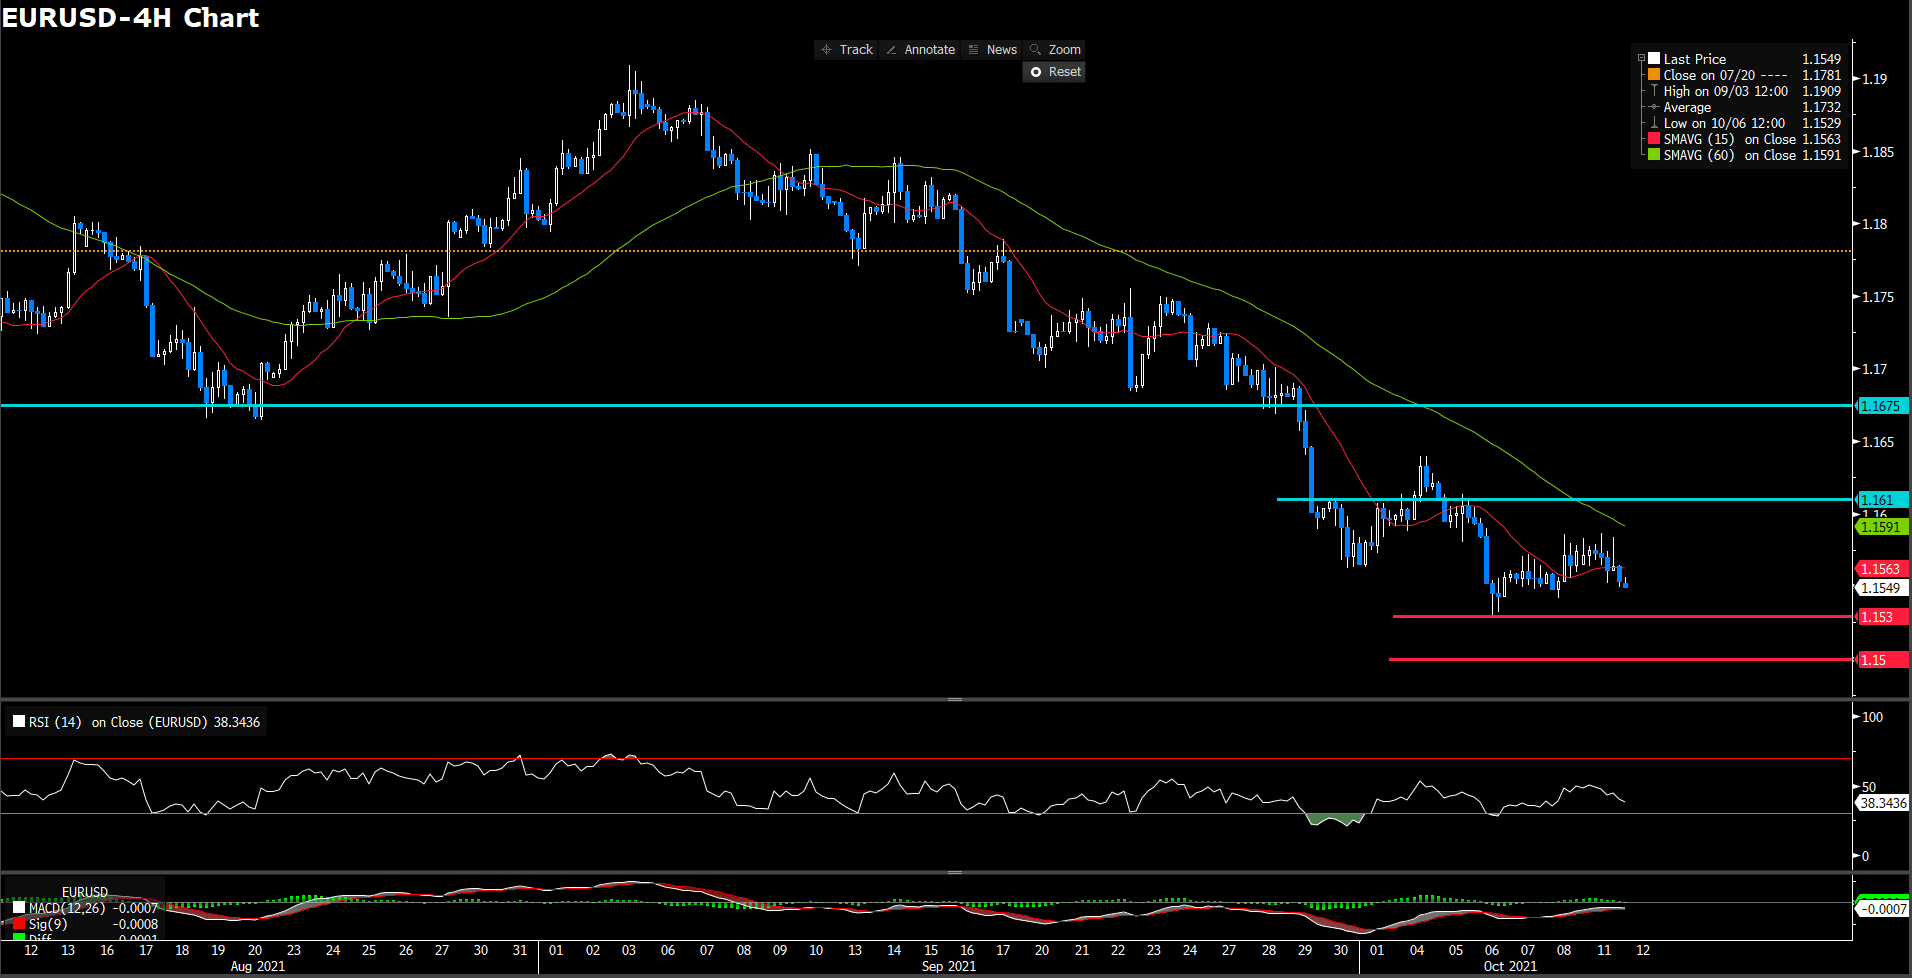
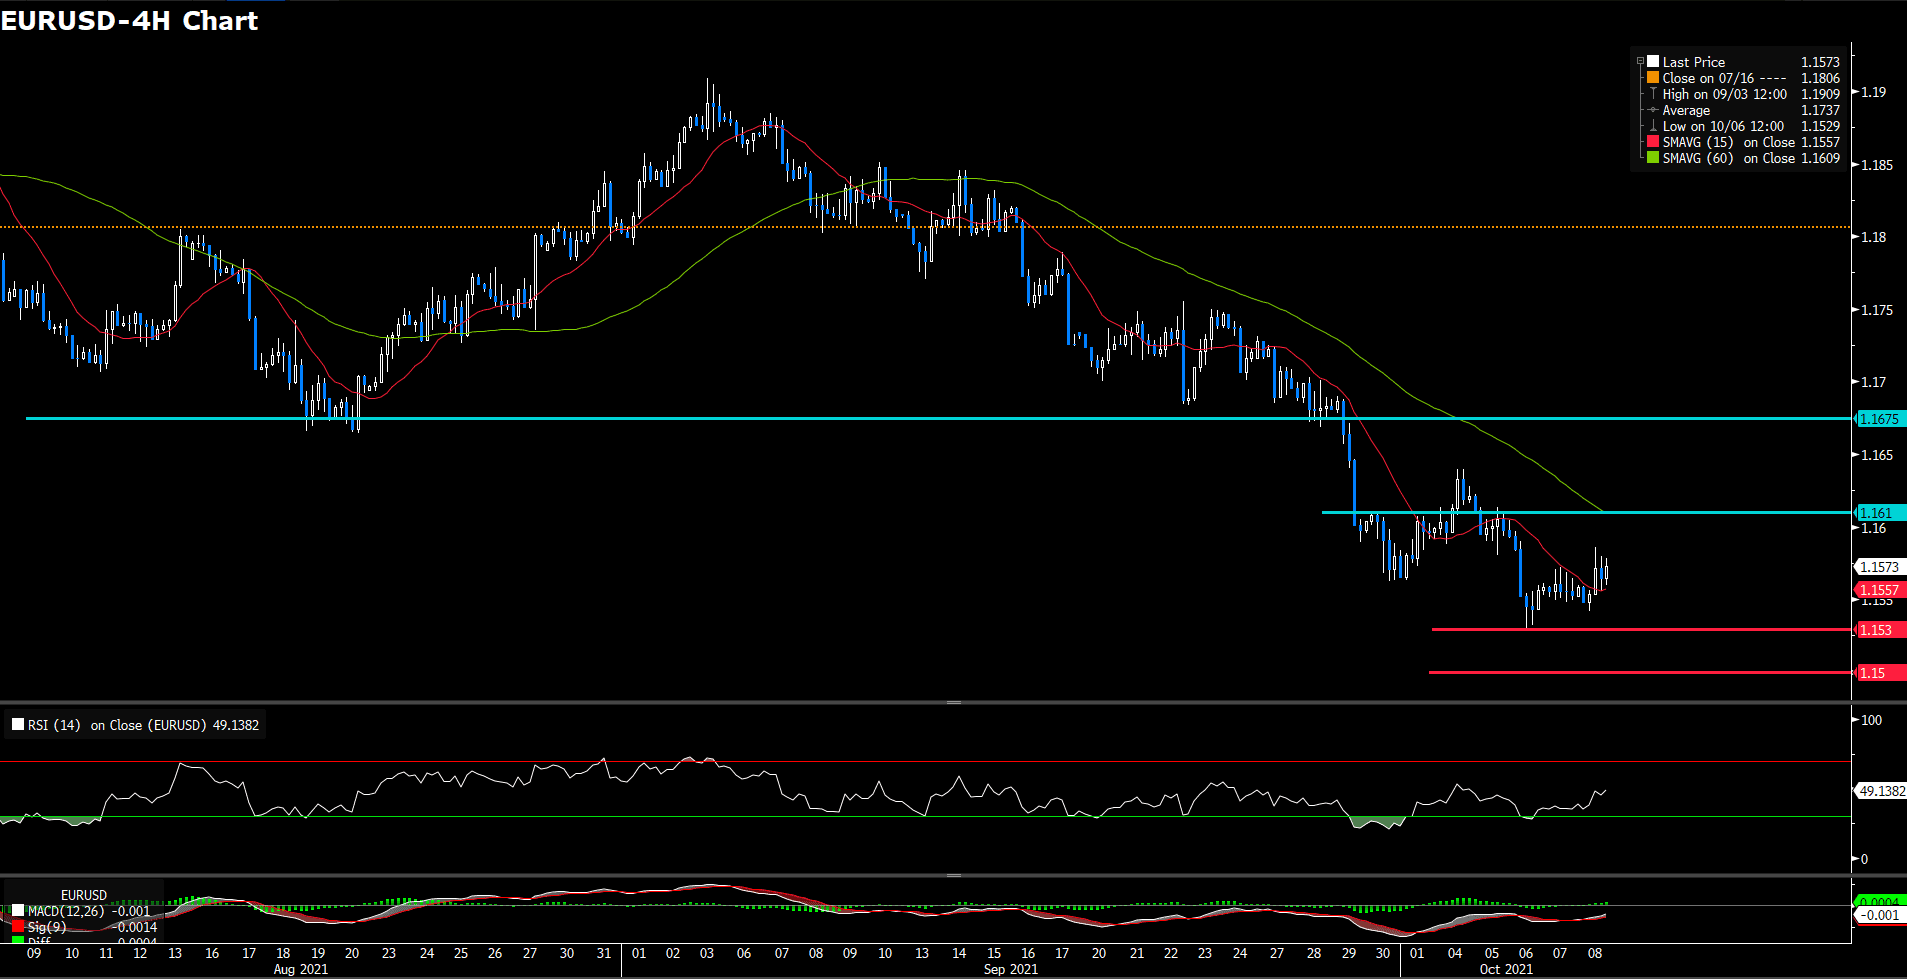
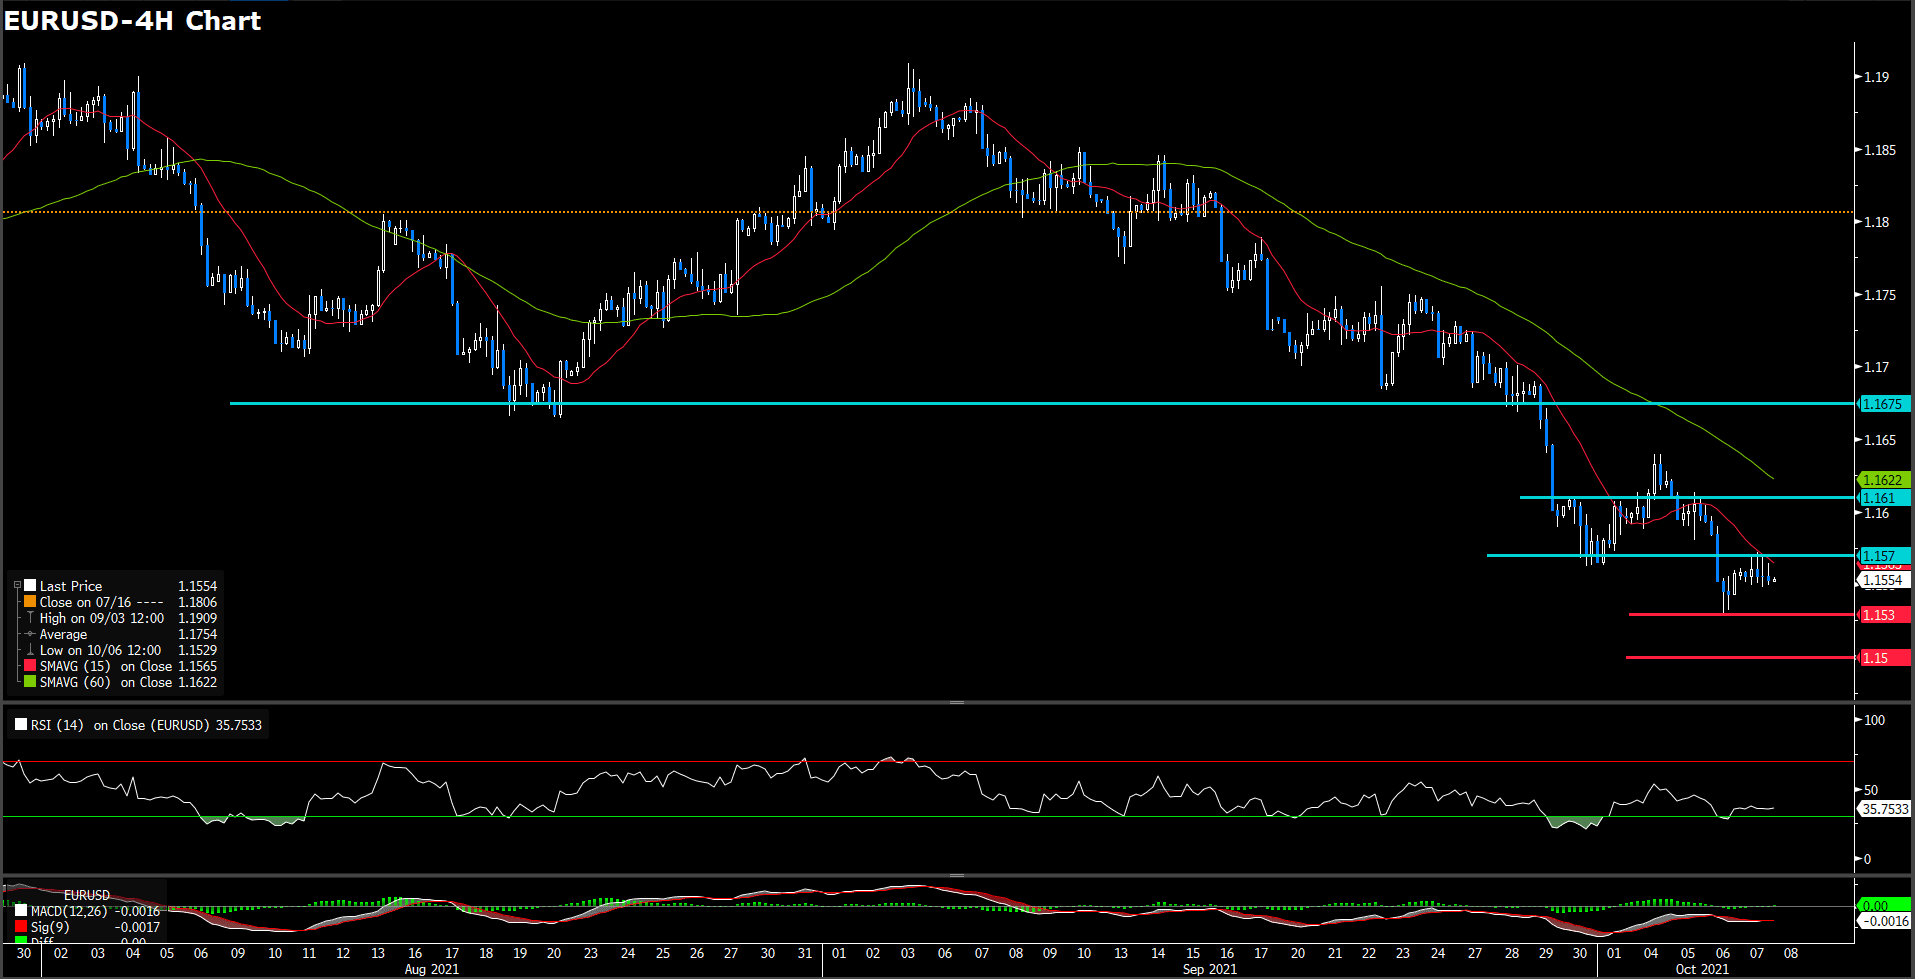
The euro keeps treading water on both sides of the 1.16 level, unable to take advantage of a weaker U.S. dollar. The common currency bounced up from year-to-date lows at 1.152 earlier this week but is missing follow through to post a significant recovery and remains hesitating between 1.158 and 1.162 for the second day in a row. The U.S. Treasury yields rally, another source of strength for the U.S. dollar, has lost steam this week.
On technical side, the RSI index floating a flat movement in day market and sitting at 57 figures, suggesting a slightly bullish movement in short term. On moving average aspect, 15-long indicator has turned it slope to positive way and 60-long became a flat movement after day market, moreover, two moving average indicator has golden cross in the day market.
In lights of two critical technical indicator are giving the euro fiber a positive signal. One thing left, the most important obstacle for the upside traction is 1.16 threshold. If it could penetrate 1.16 soild, then expect will heading to higher stage.
Resistance: 1.161, 1.166, 1.1675, 1.171
Support: 1.153, 1.15
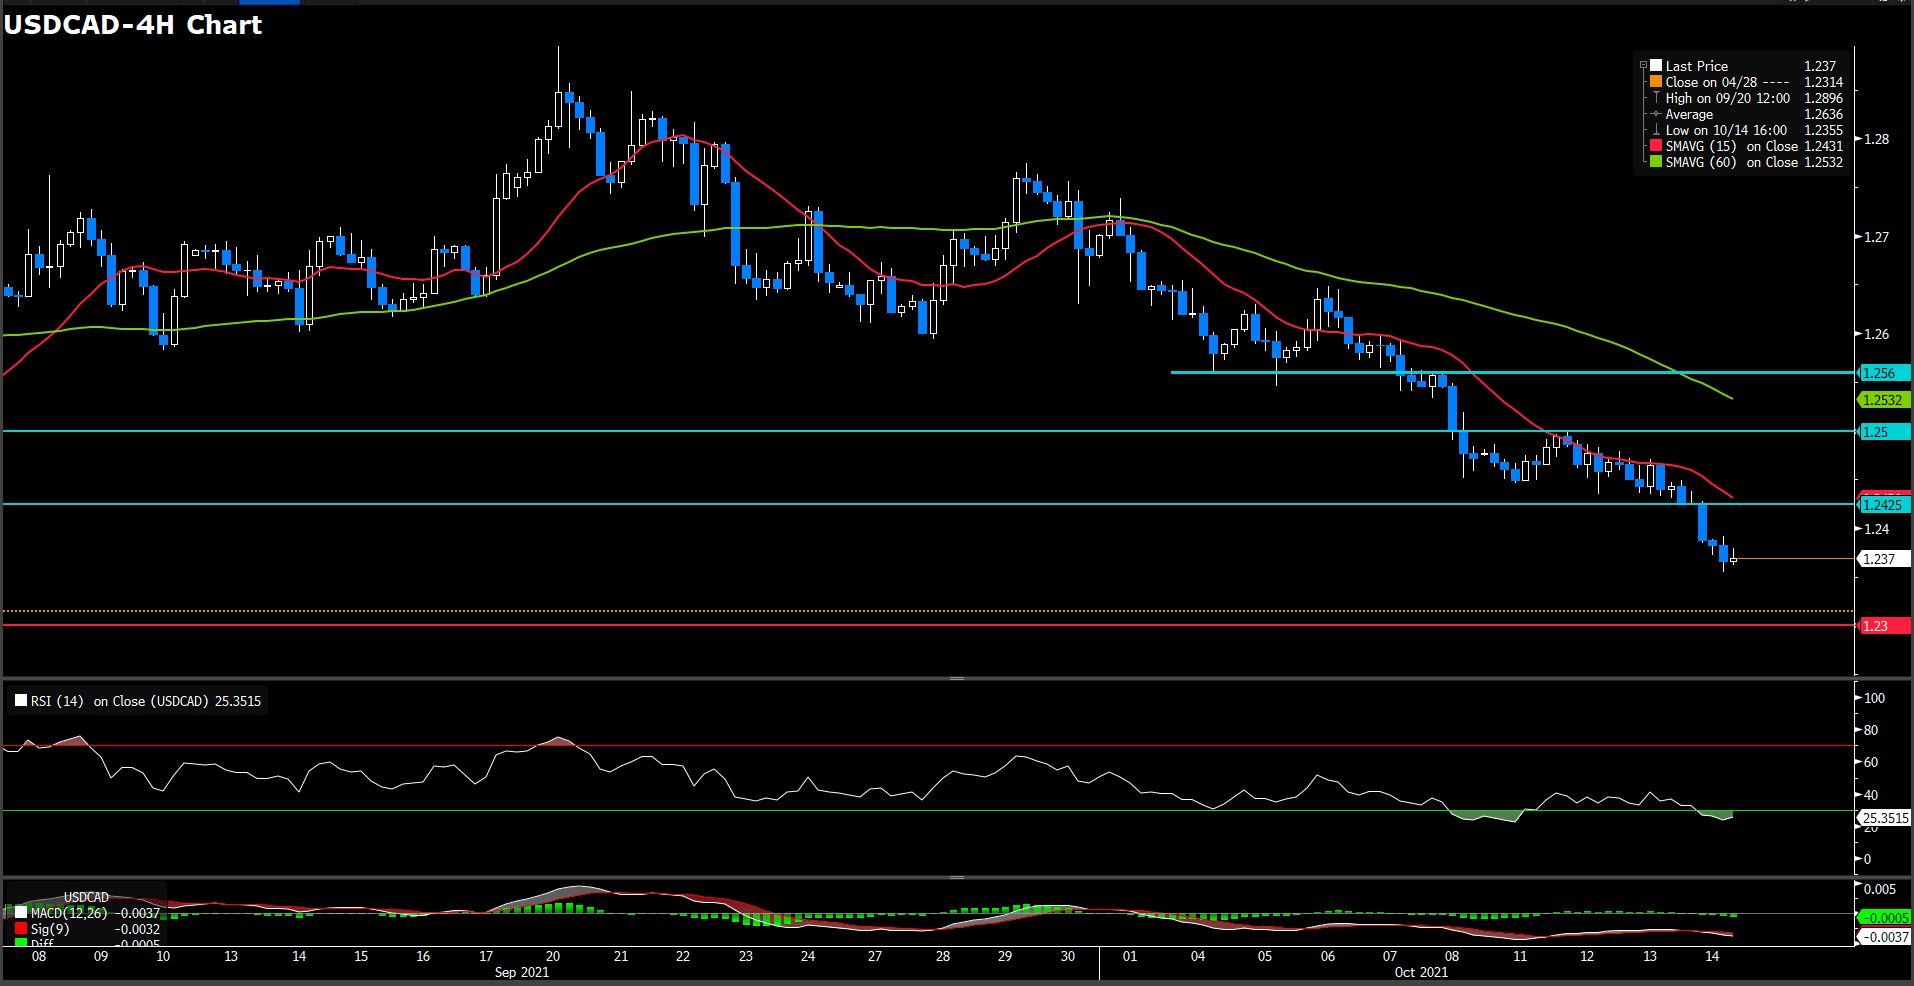
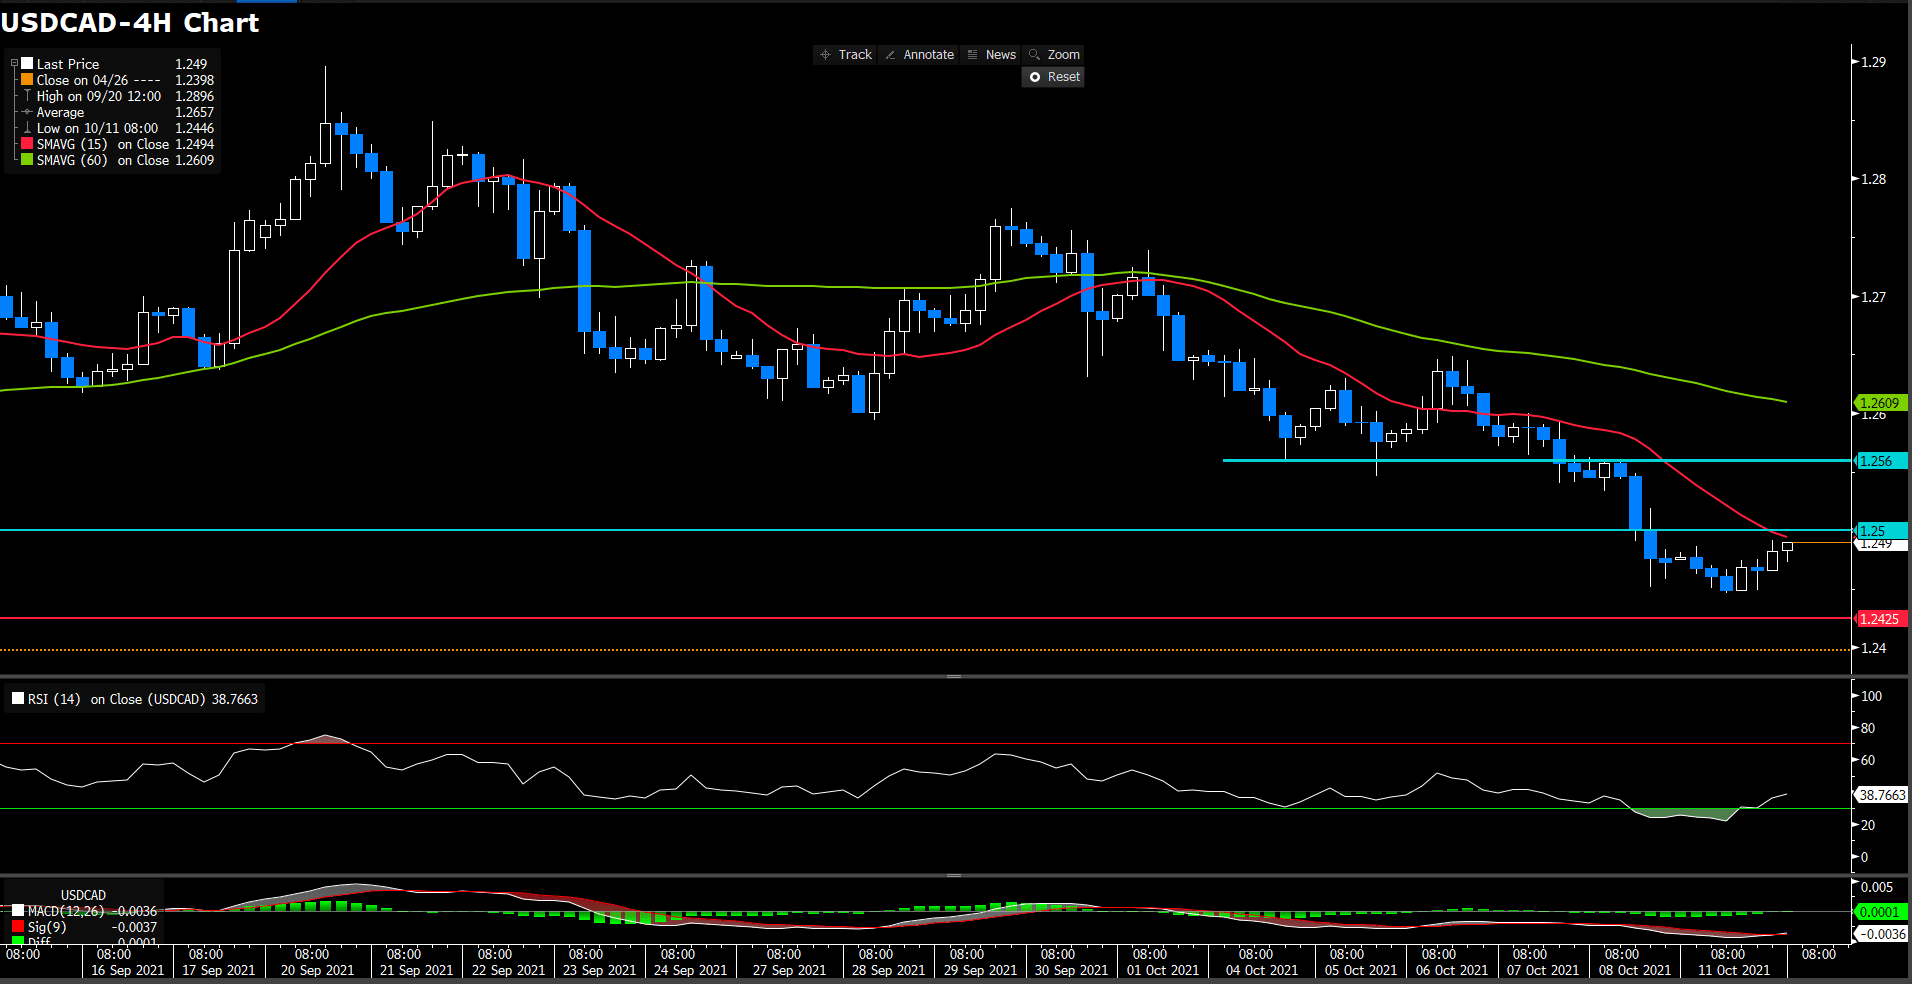
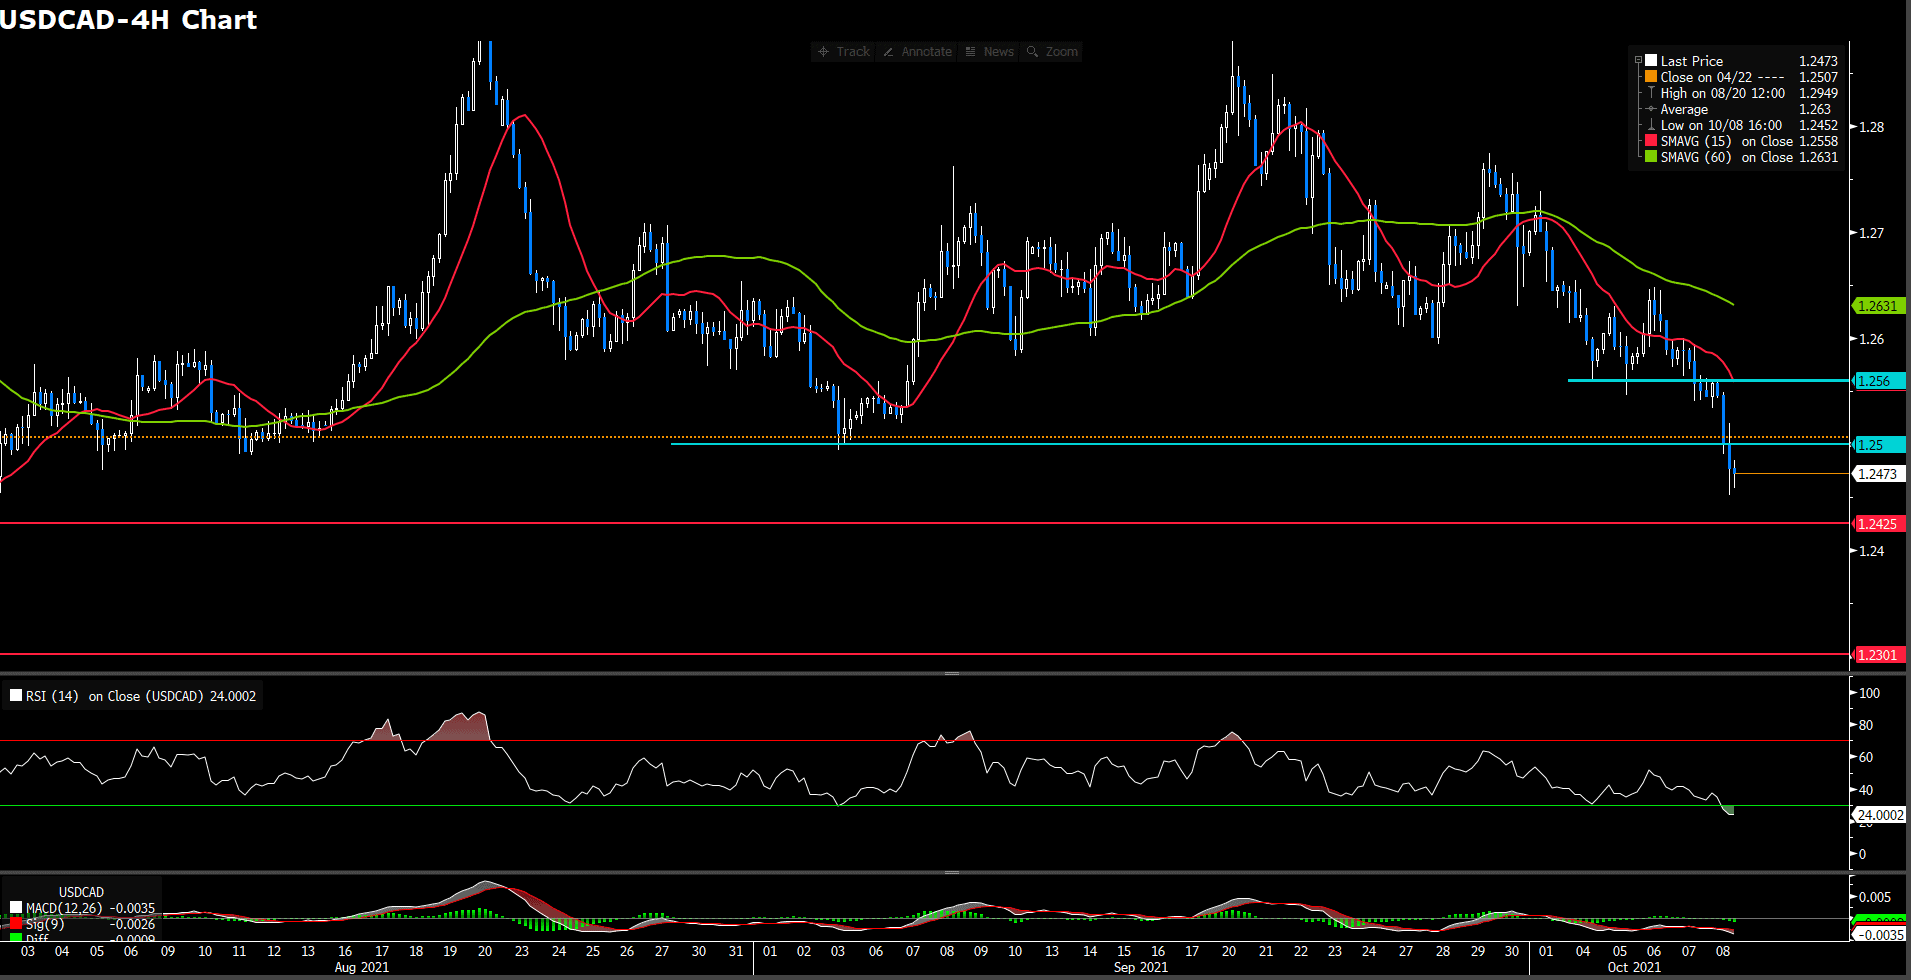
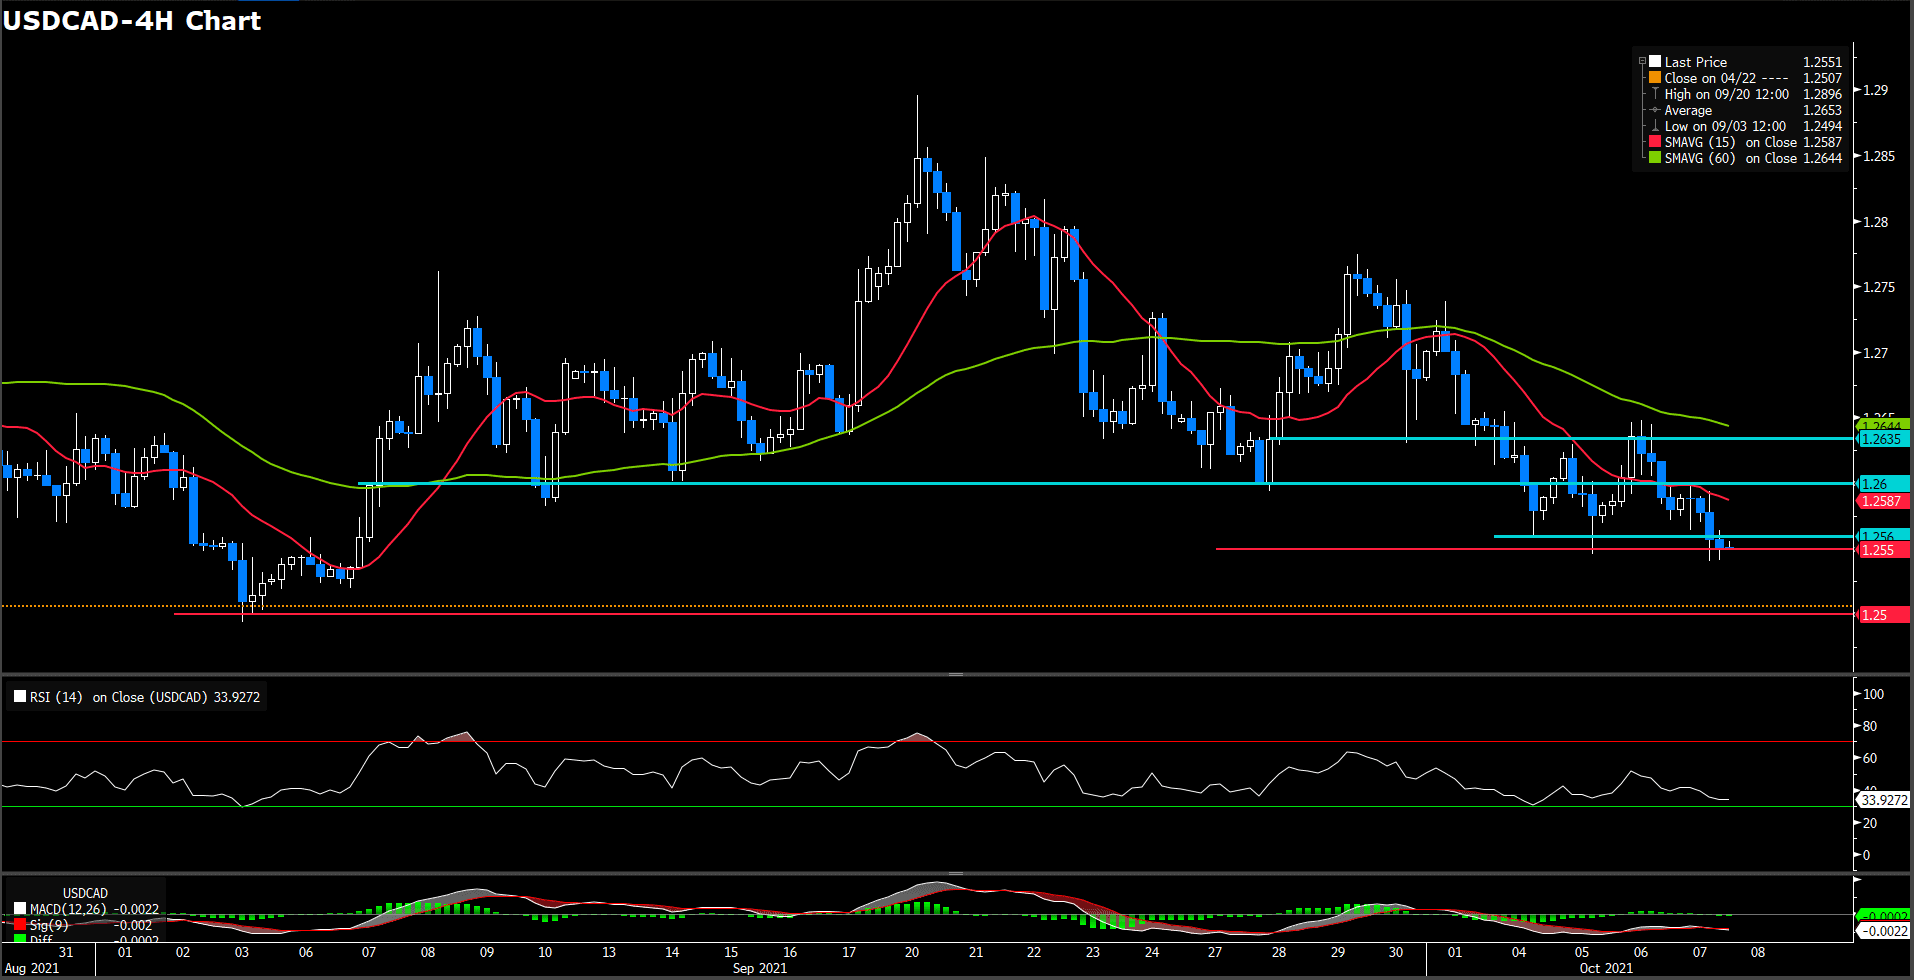
USDCAD (4 Hour Chart)
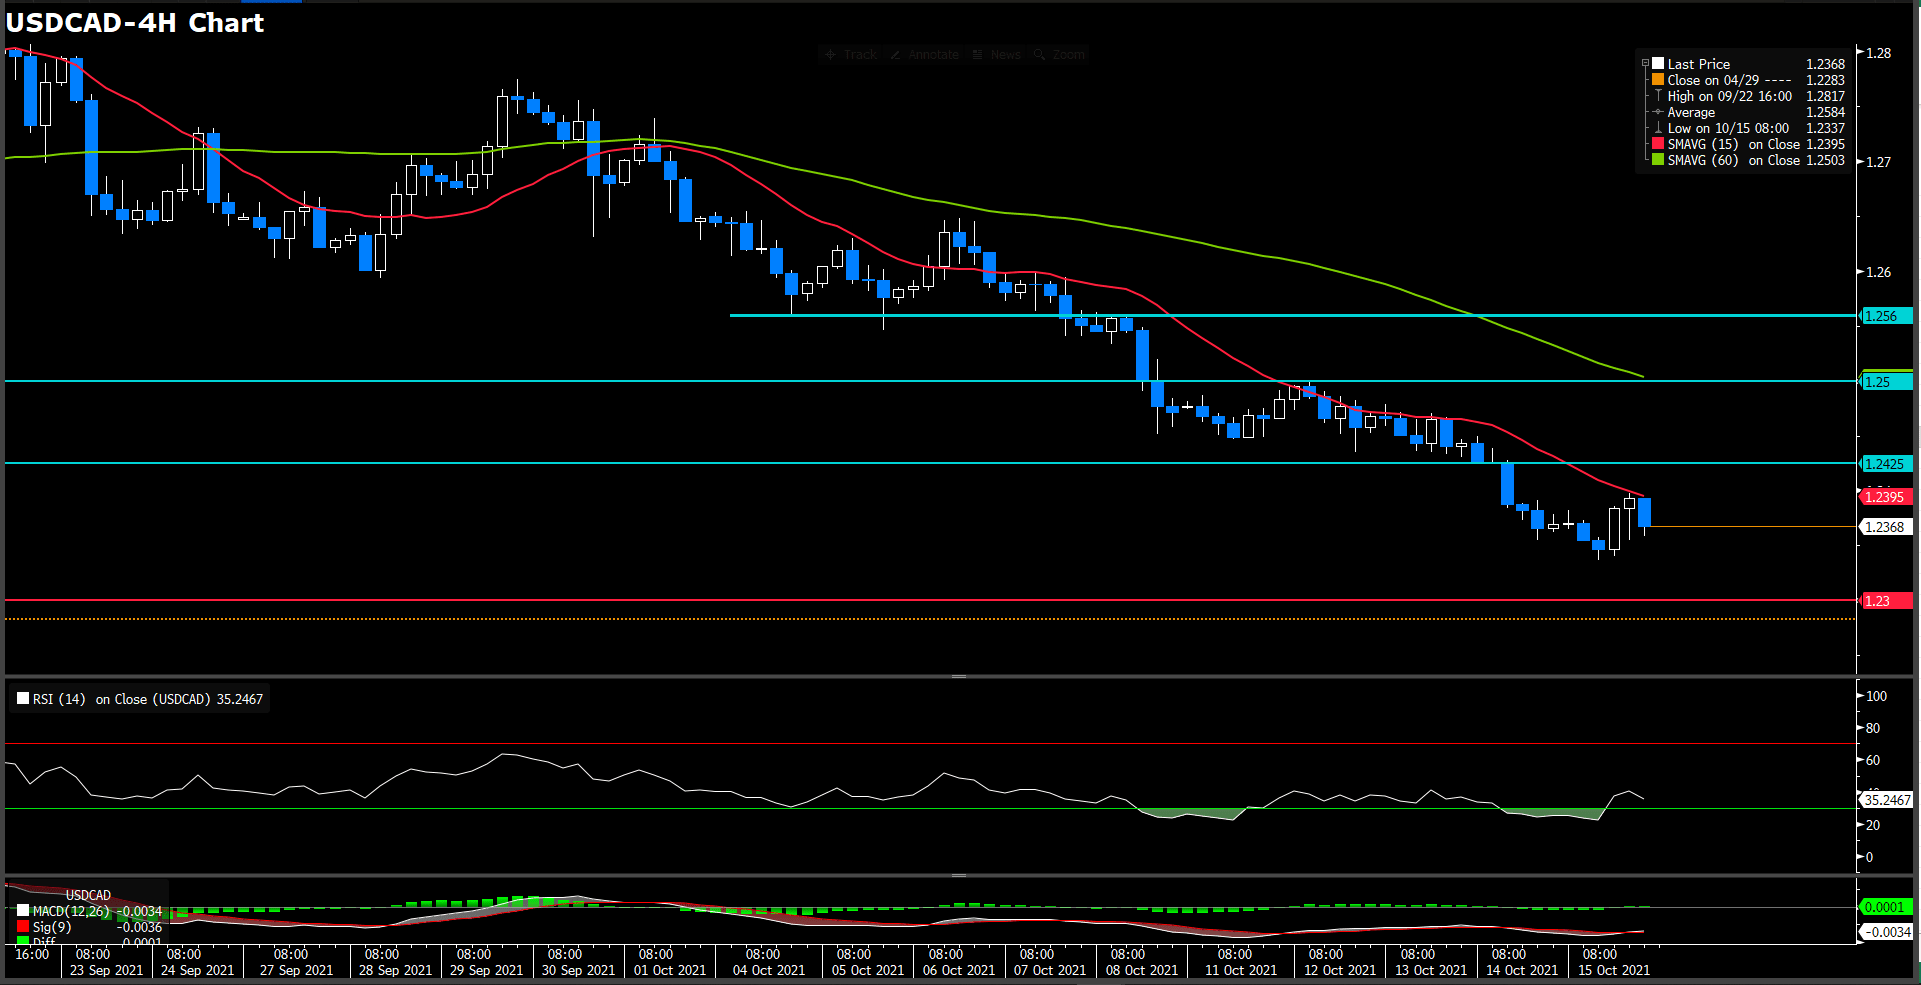
Loonie is advancing during the New York session, up 0.19%, trading at 1.2393 at the time of writing. An upbeat market sentiment sorrounds the market portrayed by U.S. equity indexes rising between 0.17% and 0.92%. WTI, the U.S. benchmark for crude oil, which significantly influences the Canadian dollar, is rising 0.61%, trades at $81.42, failing to lift the CAD. On Friday, the BOC Governor Tim Macklem warned that the faster pace of price increases may persist longer than expect and may slow the pace of Canada’s economic recovery, as global supply-chain issues weigh on the domestic economy.
From a technical perspective, RSI indicator rebound from over sought territory to 35 figures, still suggesting bearish momentum in short term. On moving average indicator, 15- and 60-long indicator still retaining downside movement.
Since loonie break through a critical support at 1.24 around, we expect next pivotal support level will be 1.23. On up side, psychological level at 1.25 still a pivotal resistance for short-term, 1.256 following.
Resistance: 1.2425, 1.25, 1.256
Support: 1.23
Economic Data
|
Currency |
Data |
Time (GMT + 8) |
Forecast |
||||
|
NZD |
CPI (QoQ)(Q3) |
05:45 |
1.4% |
||||
|
NZD |
CPI (YoY)(Q3) |
05:45 |
4.1% |
||||
|
CNY |
GDP (YoY)(Q3) |
10:00 |
5.2% |
||||
|
CNY |
Industrial Production (YoY)(Sep) |
10:00 |
4.5% |
||||
|
USD |
Industrial Production (MoM)(Sep) |
21:15 |
0.2% |
||||