Daily Market Analysis
Market Focus
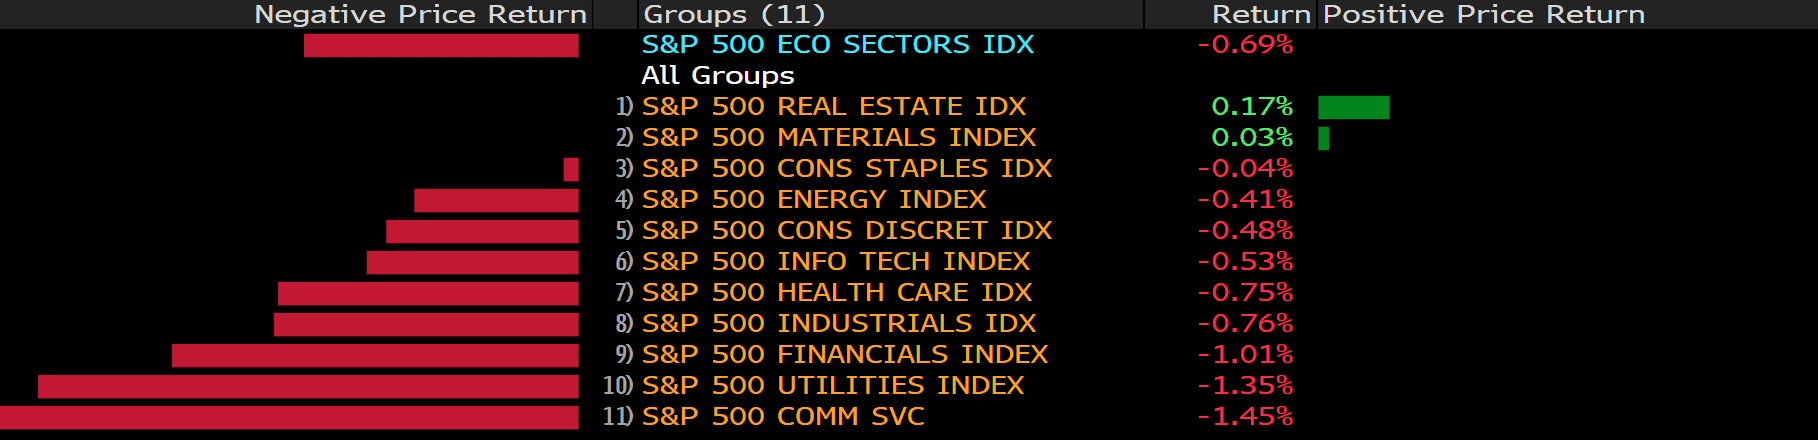
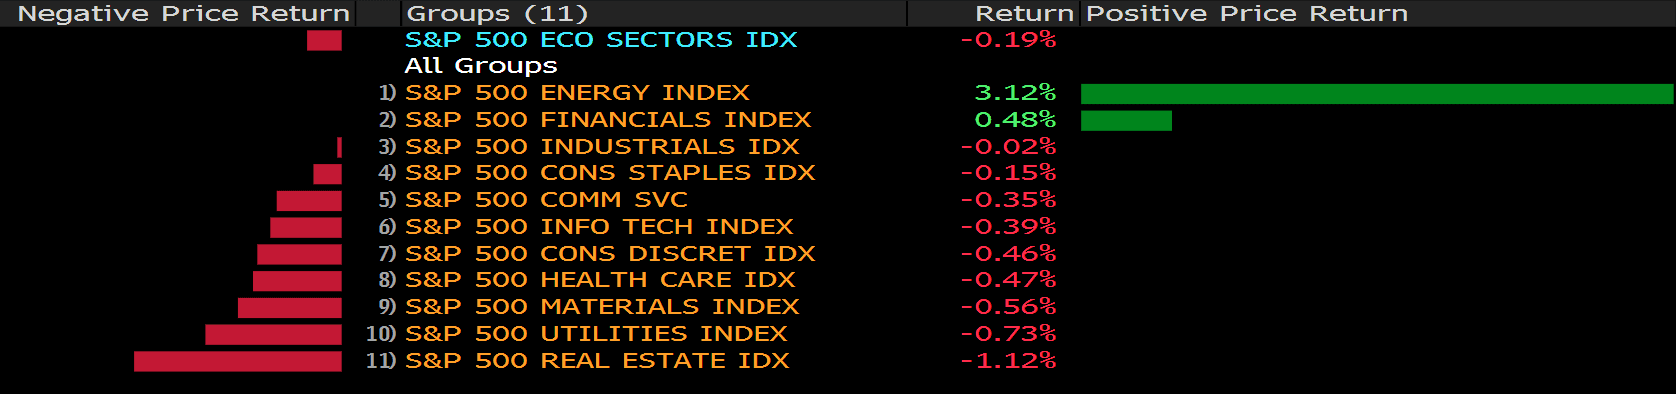
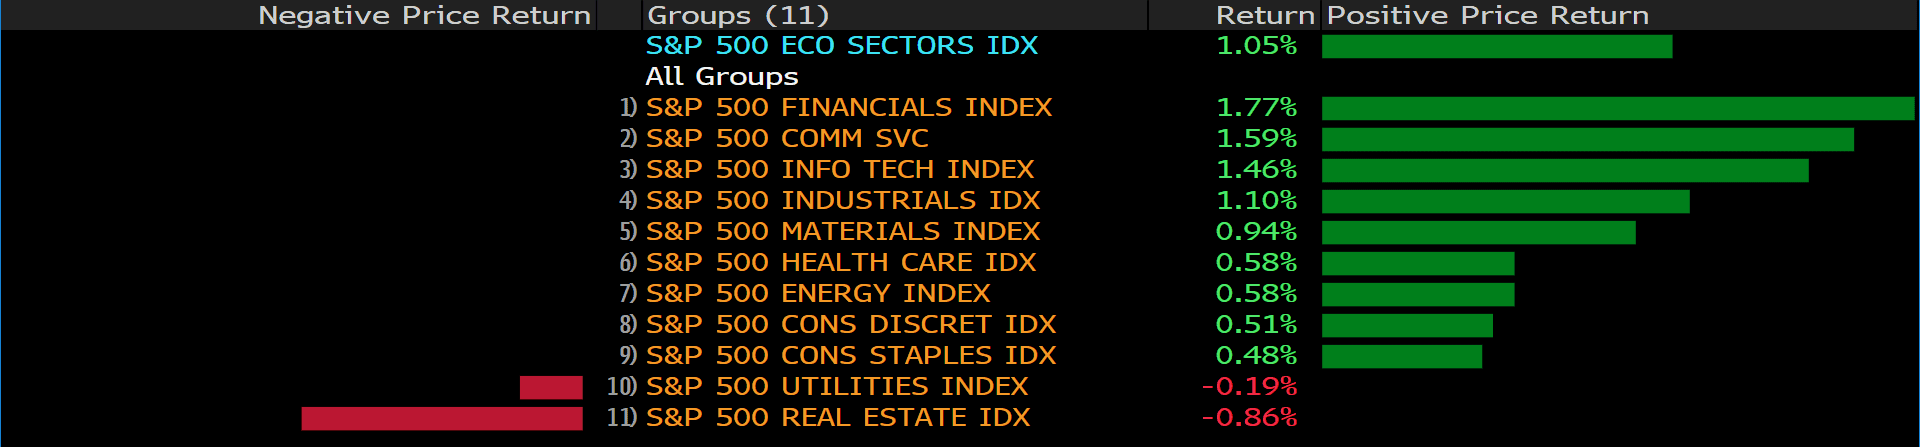
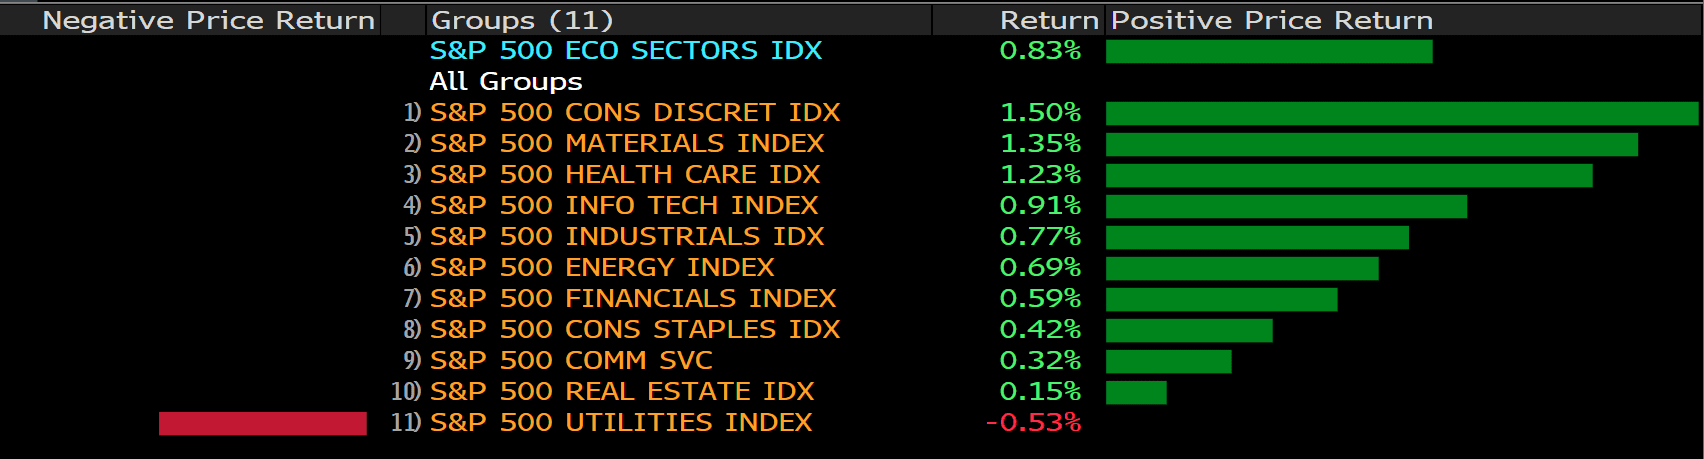
US markets rallied on Thursday as lawmakers finally reached a deal to increase the debt ceiling in the short- term. In short, the Dow Jones jumped roughly 1%; the Nasdaq rose 1.1% while the S&P climbed 0.8%. The majority of stocks turns upside as investors temporary relieve on the news of the US will avoid an unprecedented default for now. As of now, markets await on the release of non-farm payrolls, which are scheduled on Friday.
Asian market set to open higher as China markets are going to resume after a week- long holiday, known as the golden week. In China, markets are likely to concentrate on the debt woes in its property sector and Beijing’s updated regulation, taking steps to limit monopolistic behaviors.
Elsewhere, oil prices rebounded after the US mentioned it has no plan at the moment to increase the output in order to calm rising oil prices. In the meantime, iron ore price looks to wriggle as markets see the strength amid concerns that Chinese demand is evaporating.

Main Pairs Movement:
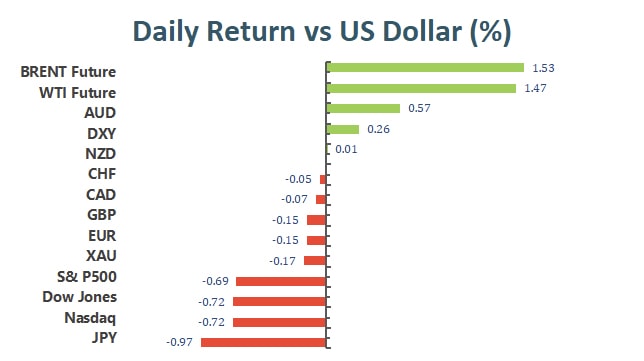
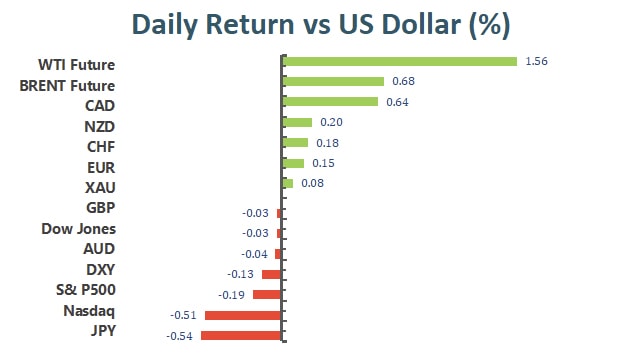
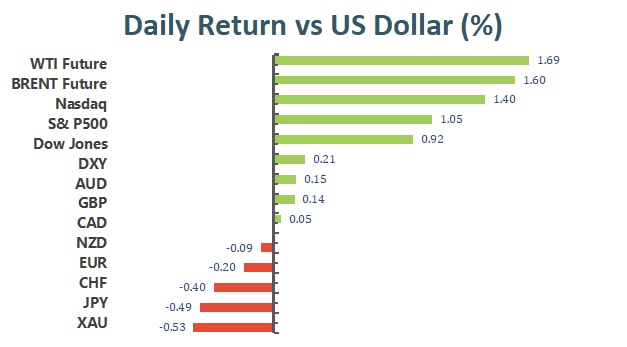
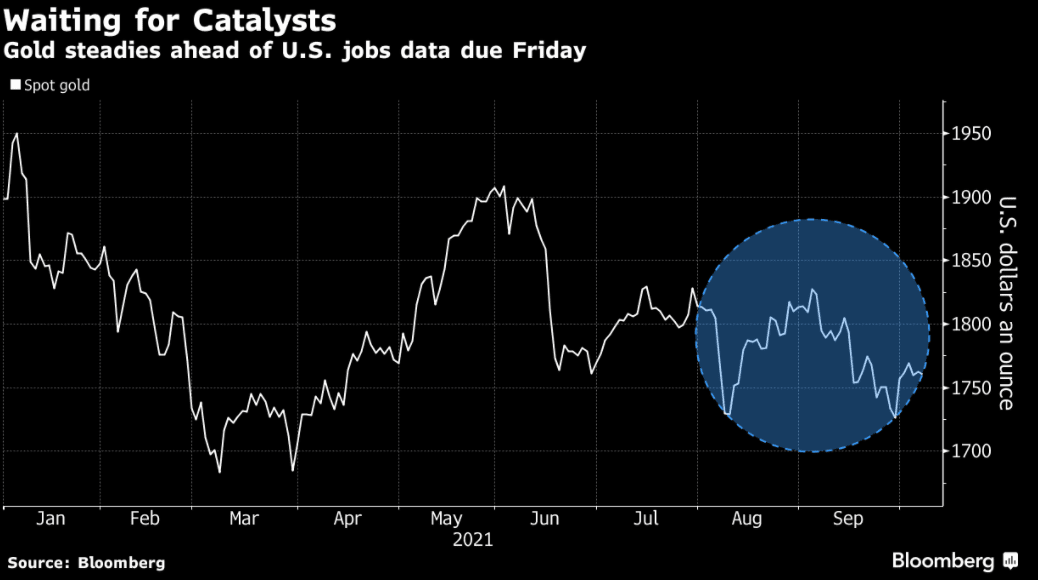
Gold slid on Thursday, down 0.43%, after the US economy looks to gradually recover according to the jobless data on Wednesday. With the ongoing improvement in the labor market, the US Fed is likely to pace up the reduction of its monetary support soon. The price of bullion is likely to undulate from Friday’s non- farm payrolls data. As of now, gold is waiting for catalysts to move up and down.
WTI crude oil held steadily high as the energy benchmark cheered for the upbeat market sentiment. Oil price got fueled by the US Energy Department suggested that there will be no consideration as of now to release and increase the national reserves, keeping the oil supply crunch on the table.
The Japanese Yen looks to undermined against the US dollar as the US bond yields rise, which potentially reduces the interest for the haven currency. By the end of the day, USDJPY closed with 111.607, 0.19% higer.
Technical Analysis:
USDJPY (4 hour Chart)
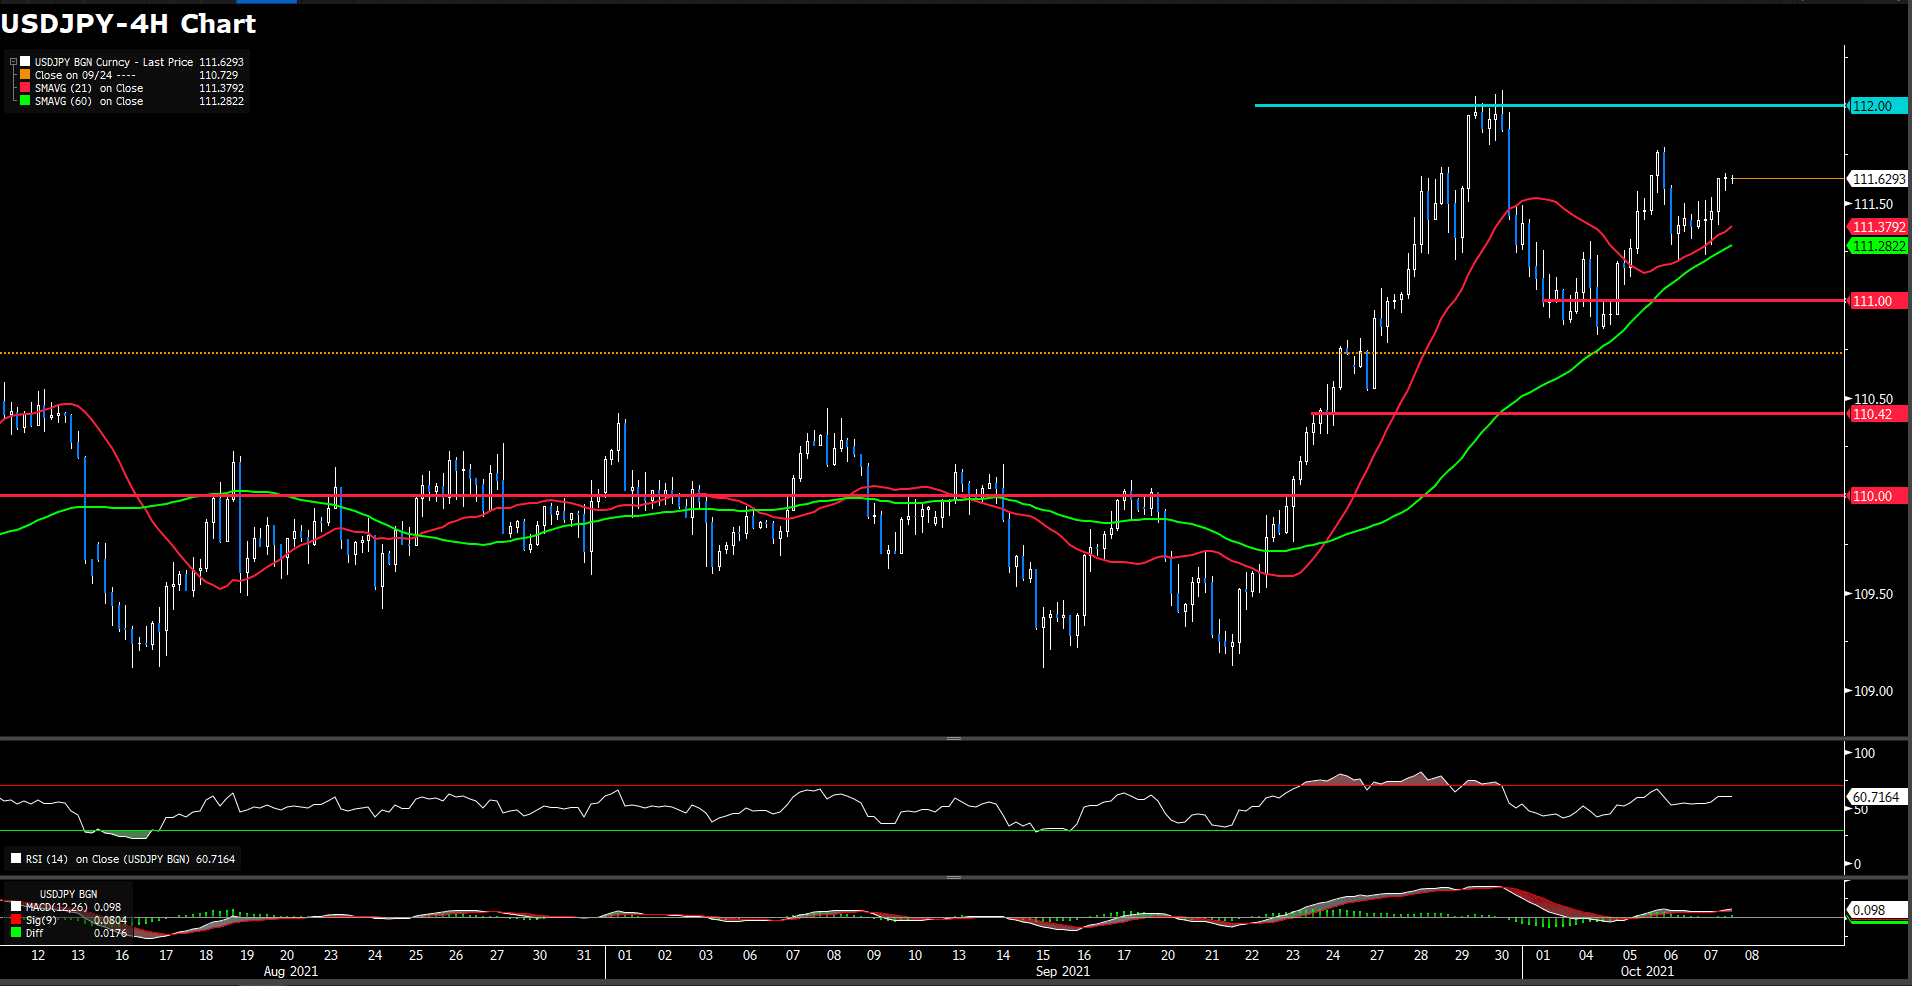
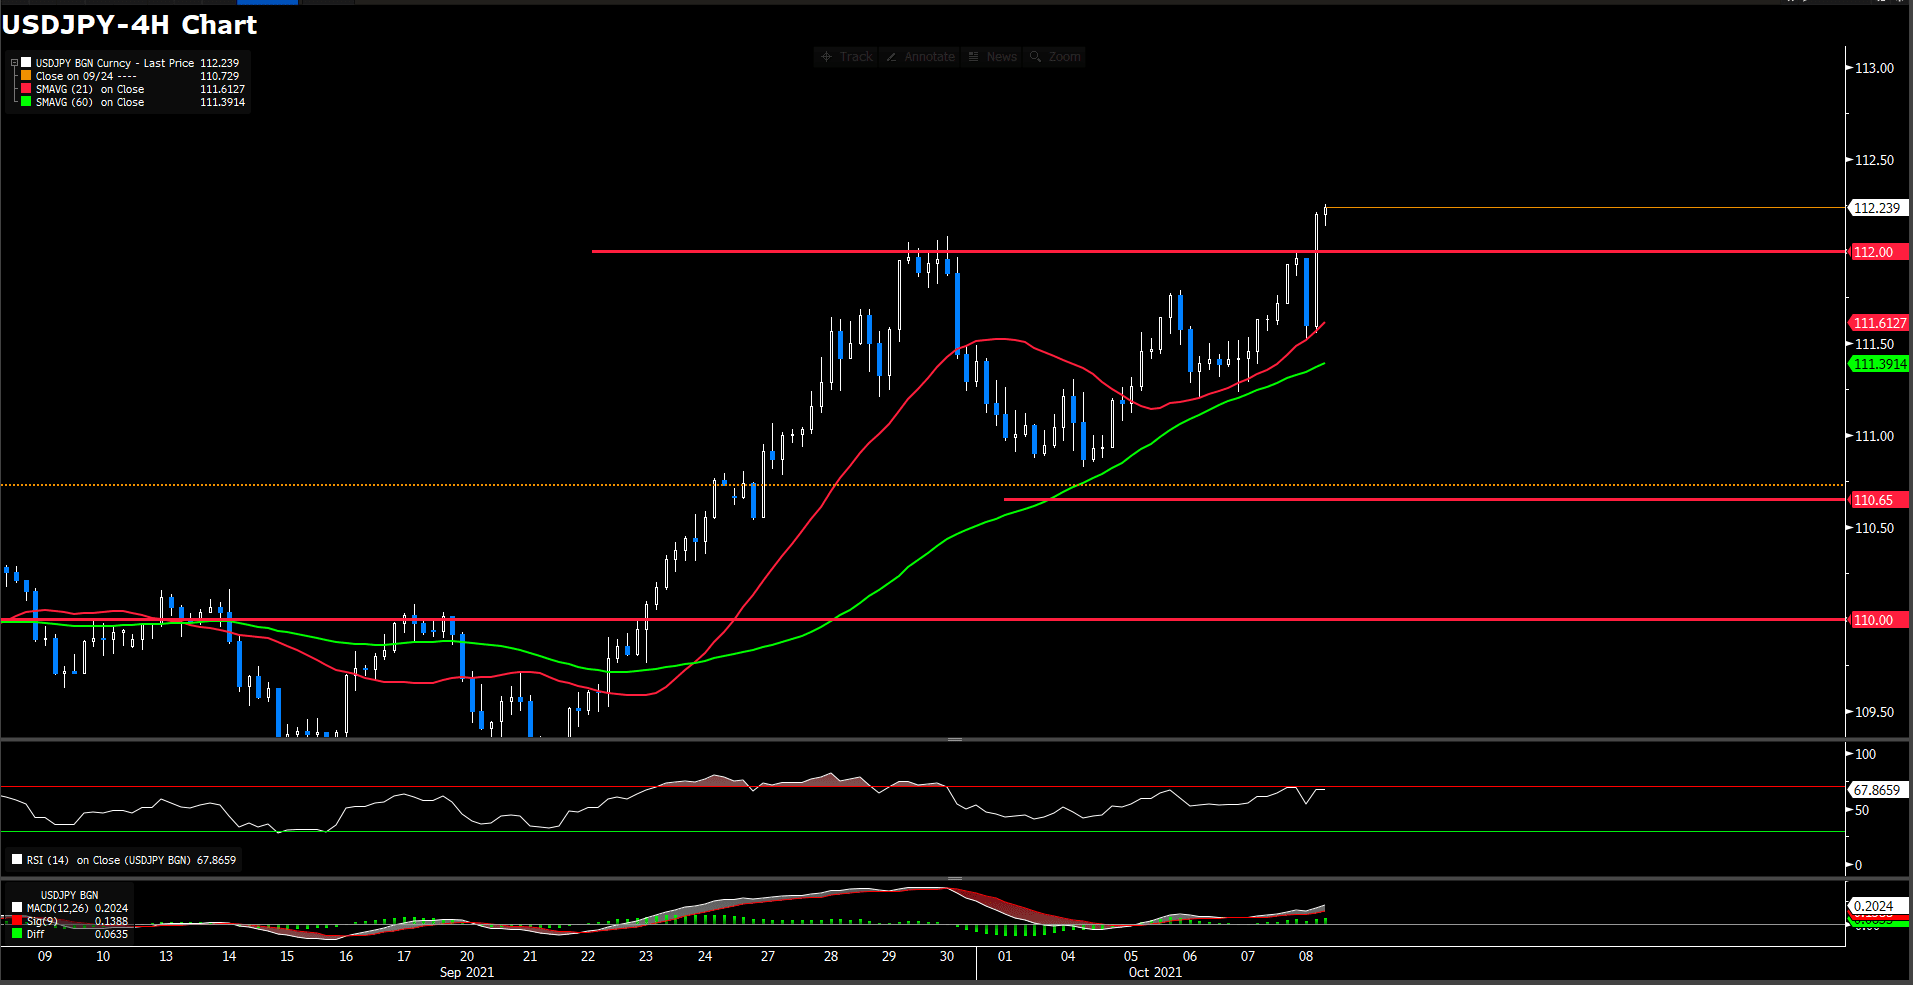
The USD/JPY pair recovered over 30 pips from the daily swing lows and climbed to fresh daily tops, last seen around the 111.60 region during the North American session.
A combination of factors assisted the USD/JPY pair to attract some dip-buying near the 111.20 region on Thursday. The risk-on impulse in the markets was seen as a key factor that undermined the safe-haven Japanese yen and extended some support to the major. This, along with a modest pickup in the US dollar demand, provided a modest lift.
For buyers to resume the attack to 112.00 and beyond, they would need a daily close above 111.50. In case of that outcome, the next supply zone would be 112.00; on the flip side, the first support level is 111.00, followed by the September 8 high at 110.42, then at 110.00.
The RSI indicator is at 62.50, modestly bullish, suggesting the consolidation of the pair may come to an end and the uptrend resumes.
Resistance: 112.00, 114.26 (Oct. 2018 high)
Support: 111.00, 110.42, 110.00
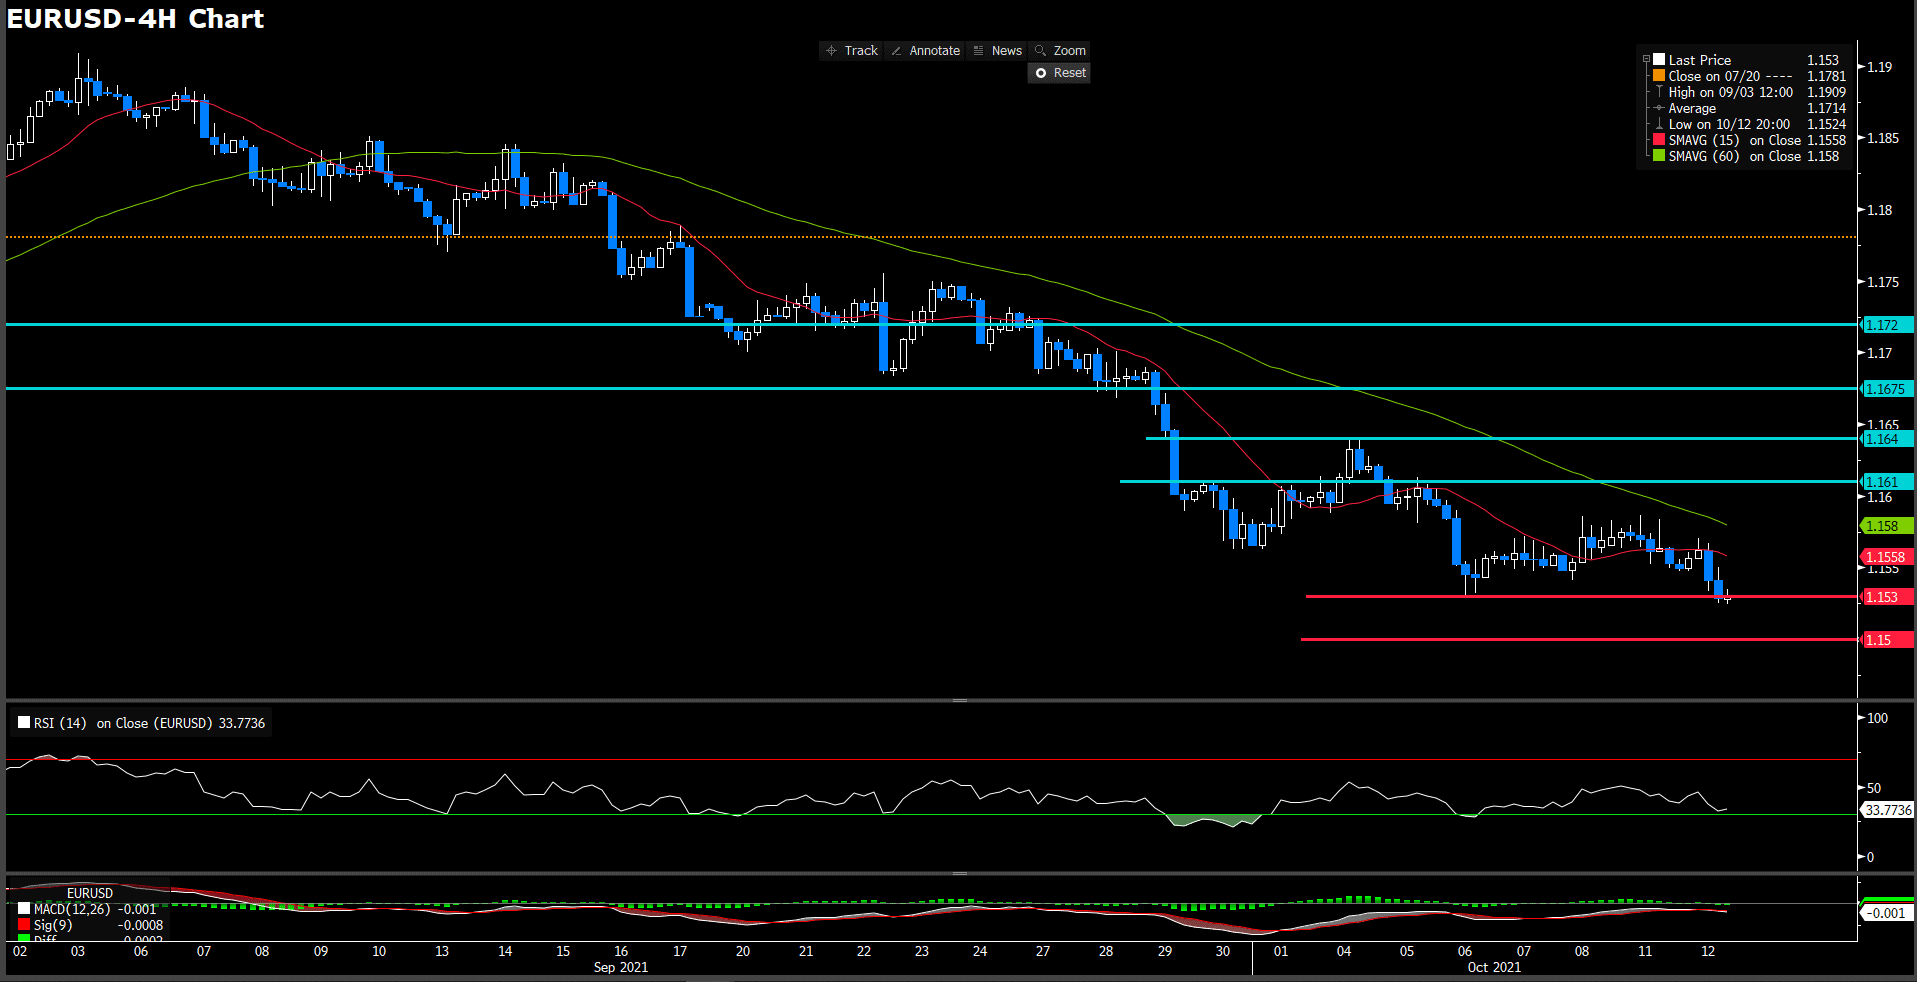
EURUSD (4 Hour Chart)
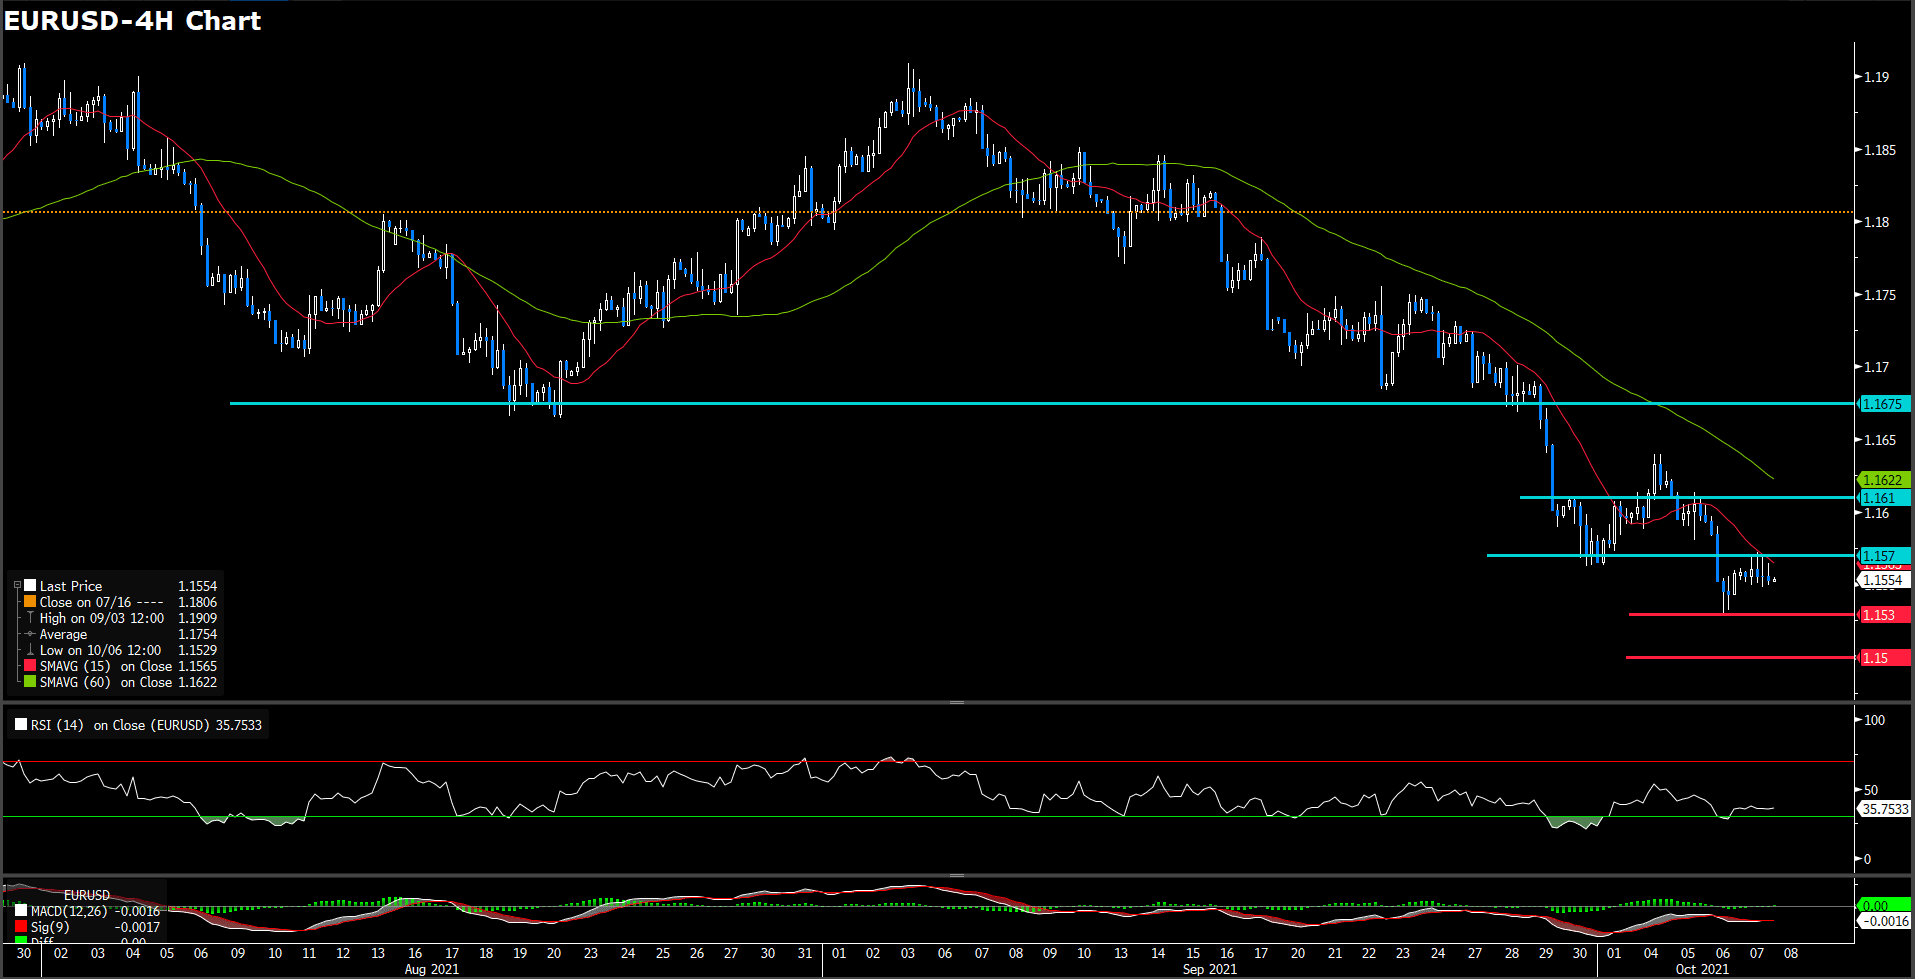
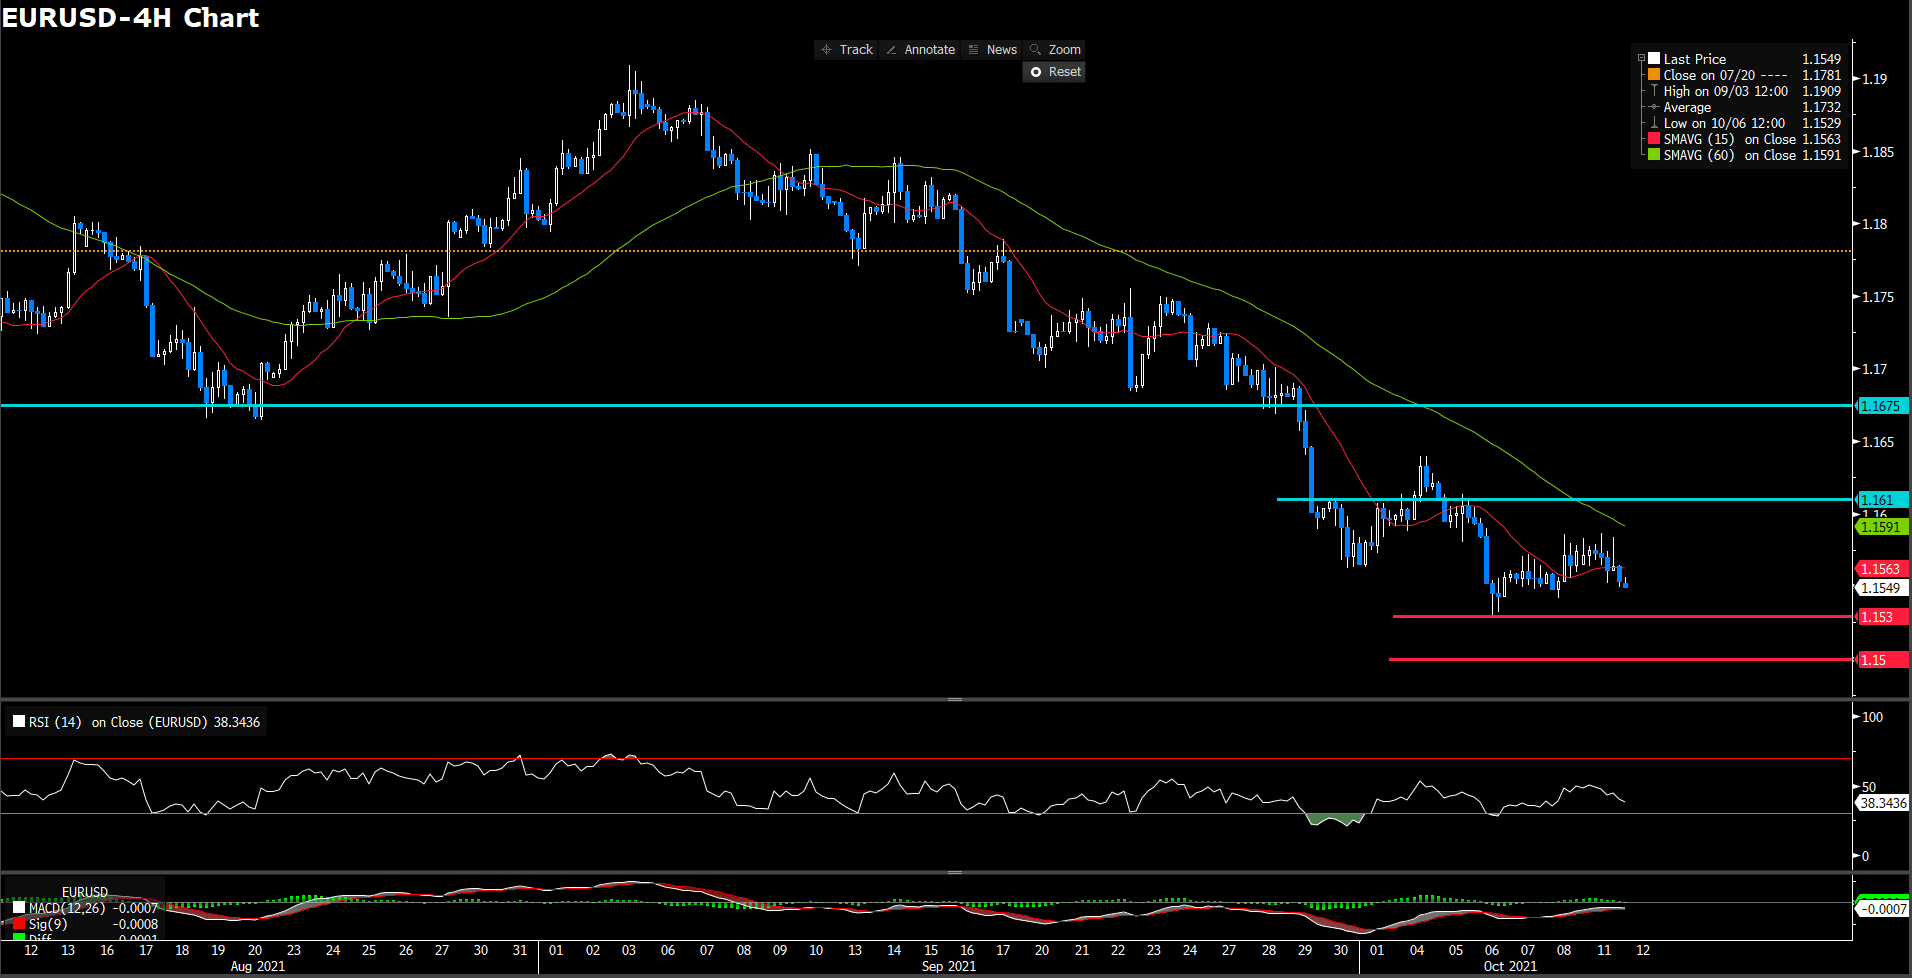
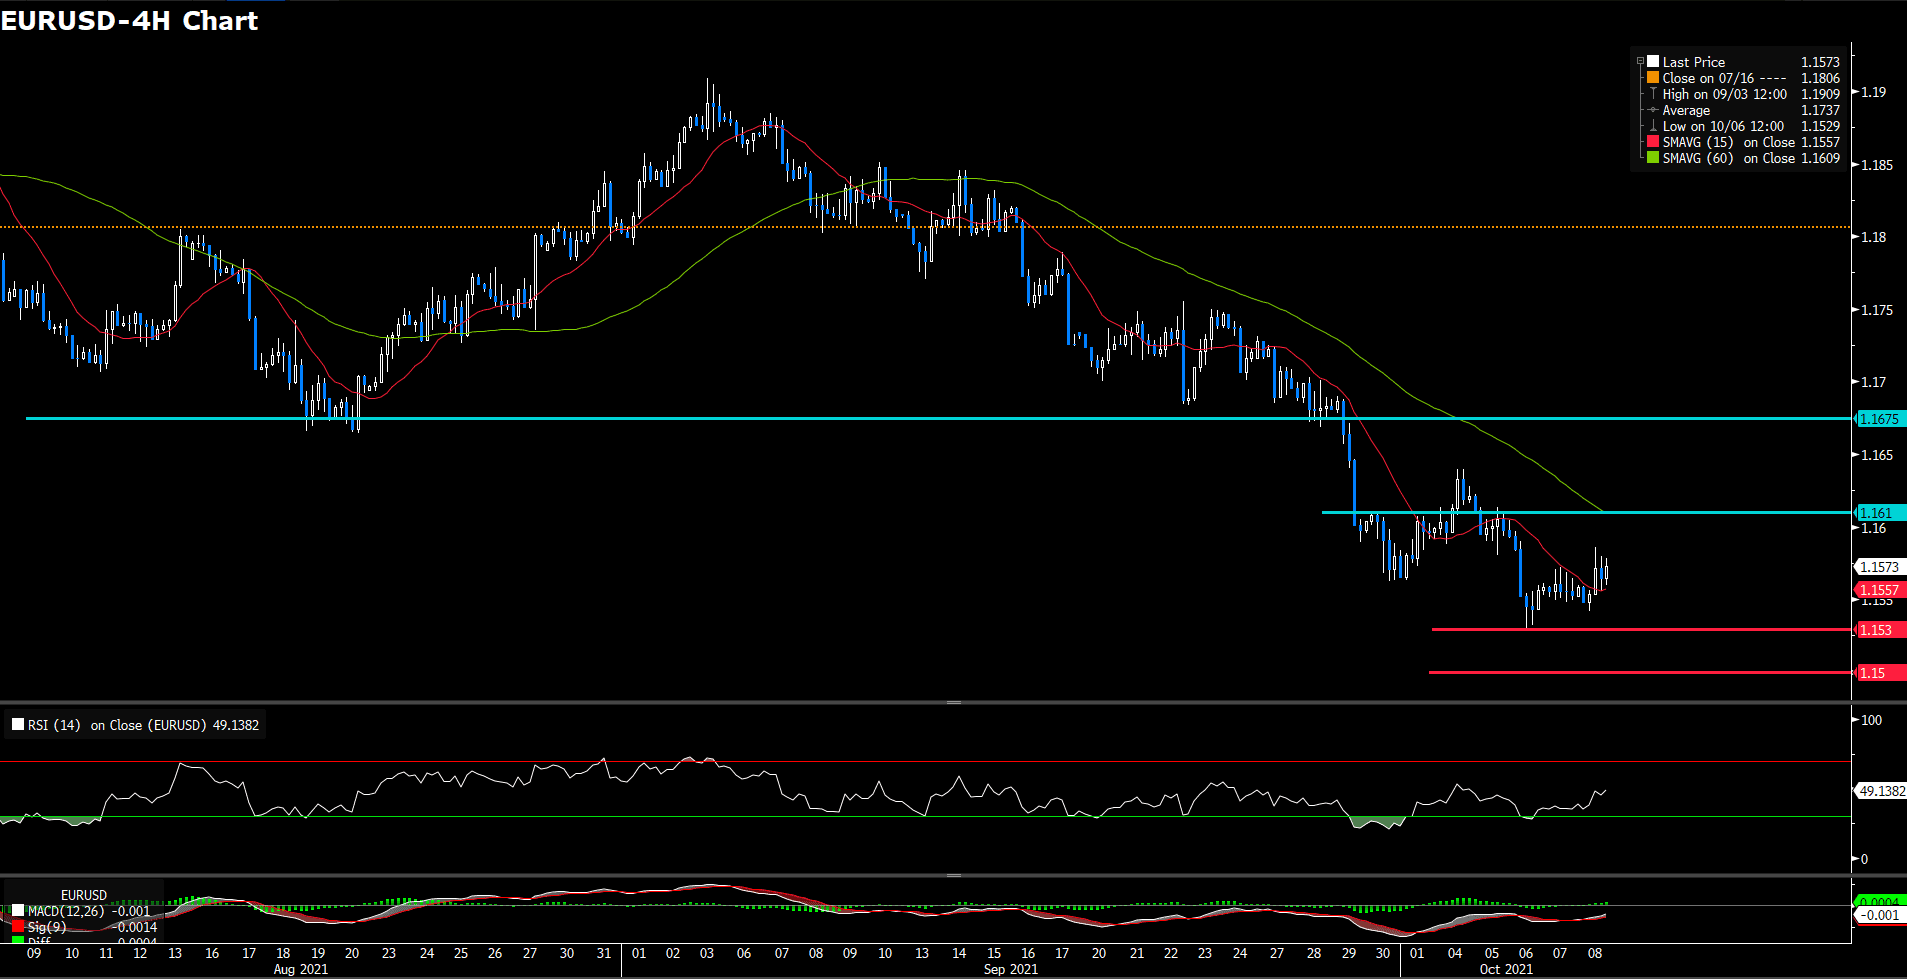
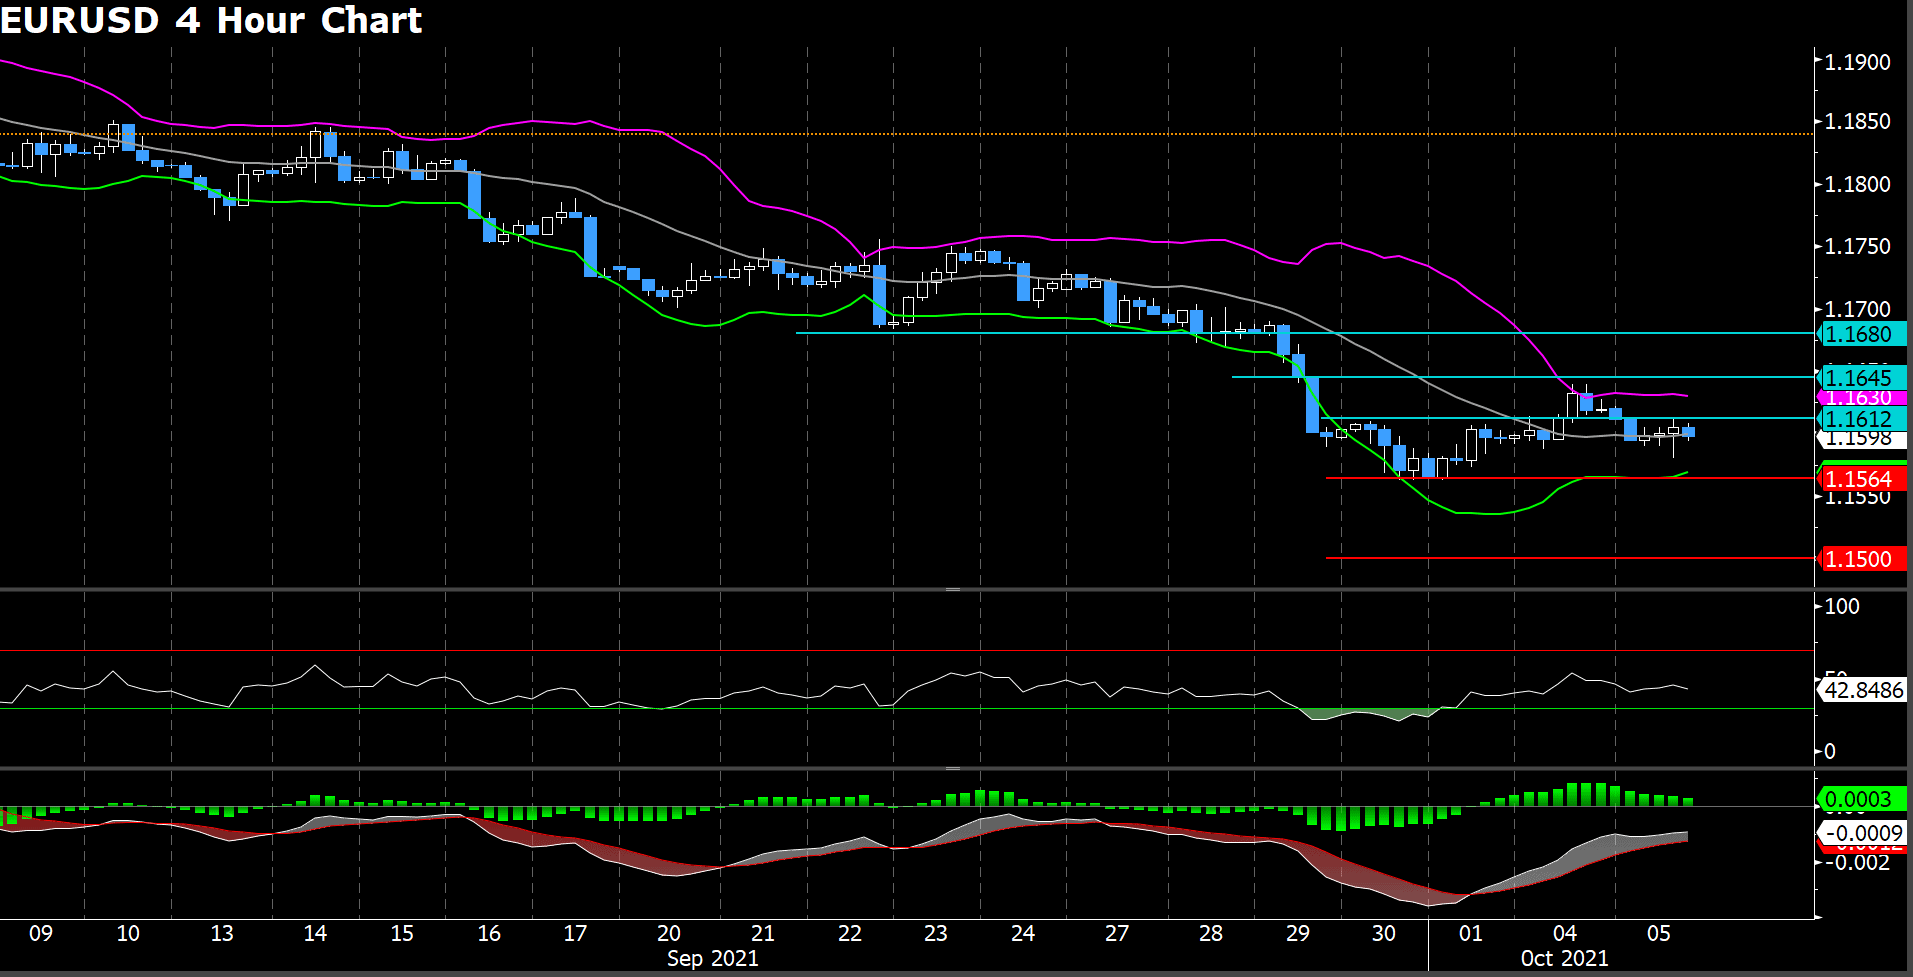
After two consecutive days of printing red, reacing a new yearly low at 1.1528, the pair is staging a comeback, is trading at 1.1564, modestly up 0.06% in the day market, during the New York session, at the time of writing. The market mood is turning to risk-on mode, portrayed by European stock indices finishing the day with hover between 1.17% and 2.14%. Meanwhile, major US stock indices rise more than 1%, during the day. The U.S. debt-limit increase solution, although short-term relieved market nervousness.
On the technical, RSi indicator pull back from over sought territory to 35 figure, however, still suggesting a bearish sentiment at current stage. On moving average side, 15- and 60-long indicator both retaining decending movement. On the other hand, MACD is holding 0 which lack of a movement suggestion.
On slip side, we expect the last time low, 1.153 level, will give pair a short-term support guidance. If break down the threshold, we foresee the downside support will eye on psychological level at 1.15
Resistance: 1.157, 1.161, 1.1675
Support: 1.153, 1.15
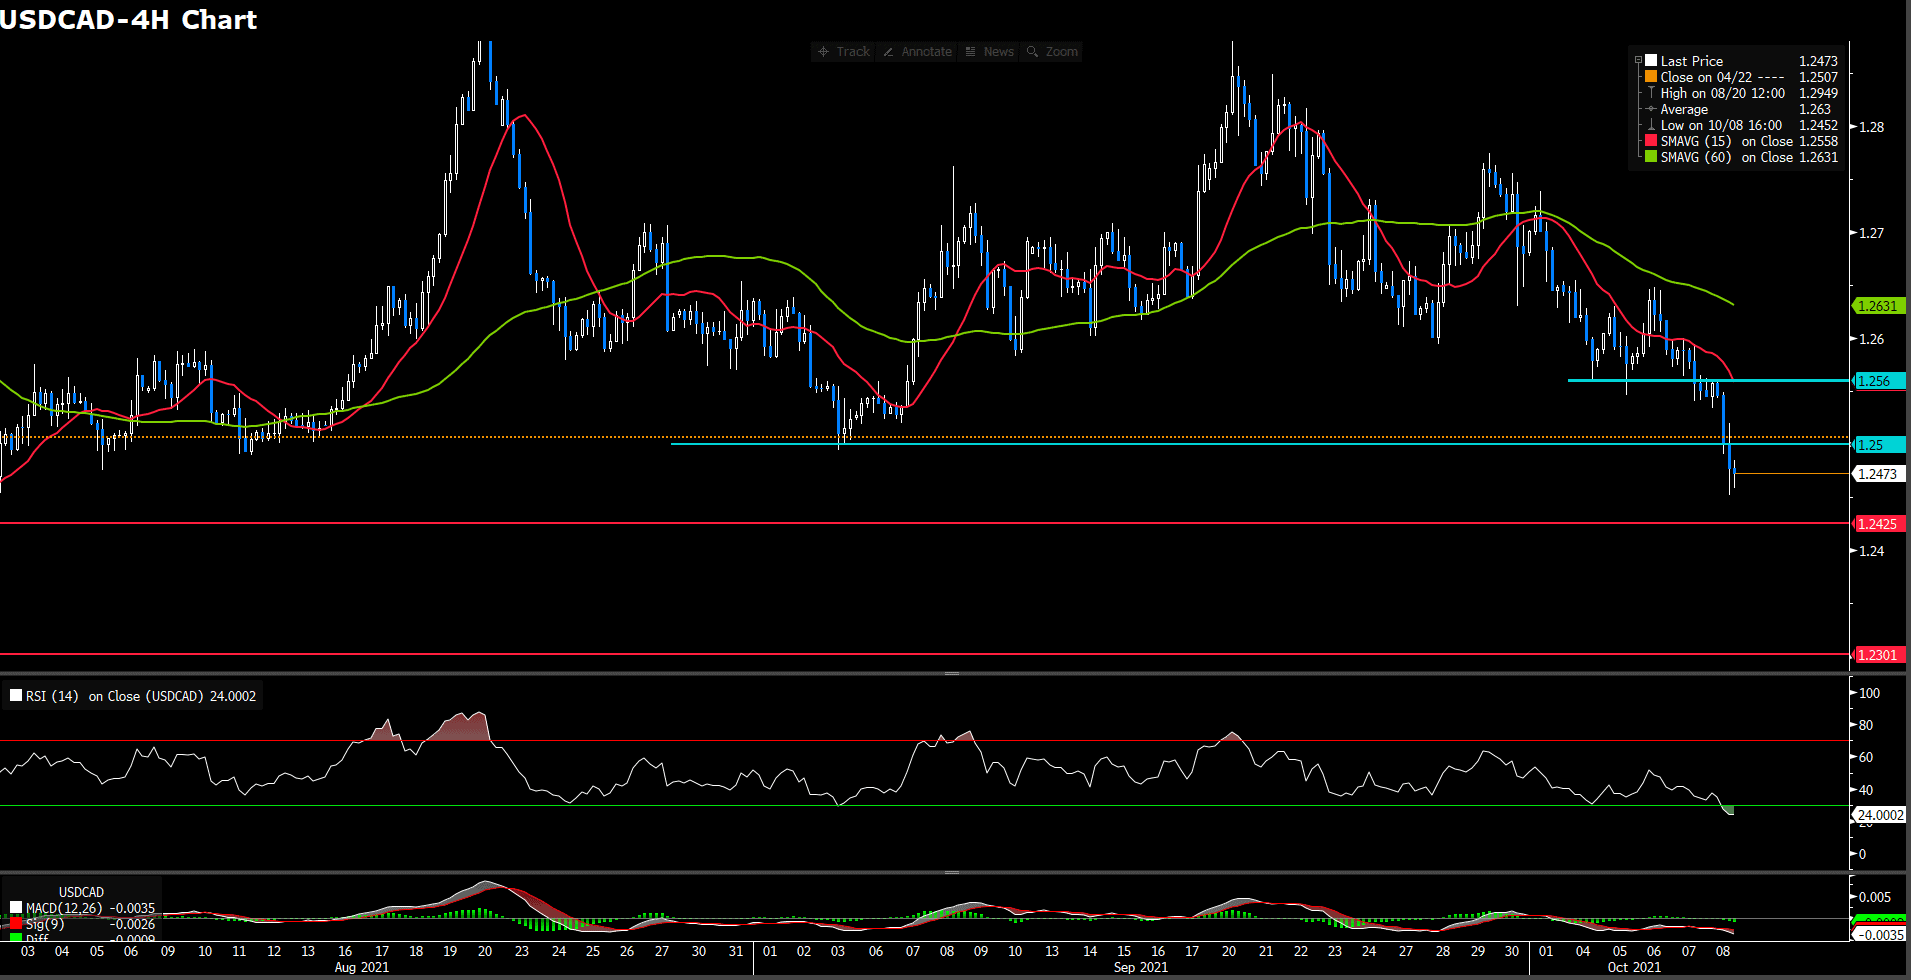
USDCAD (4 Hour Chart)
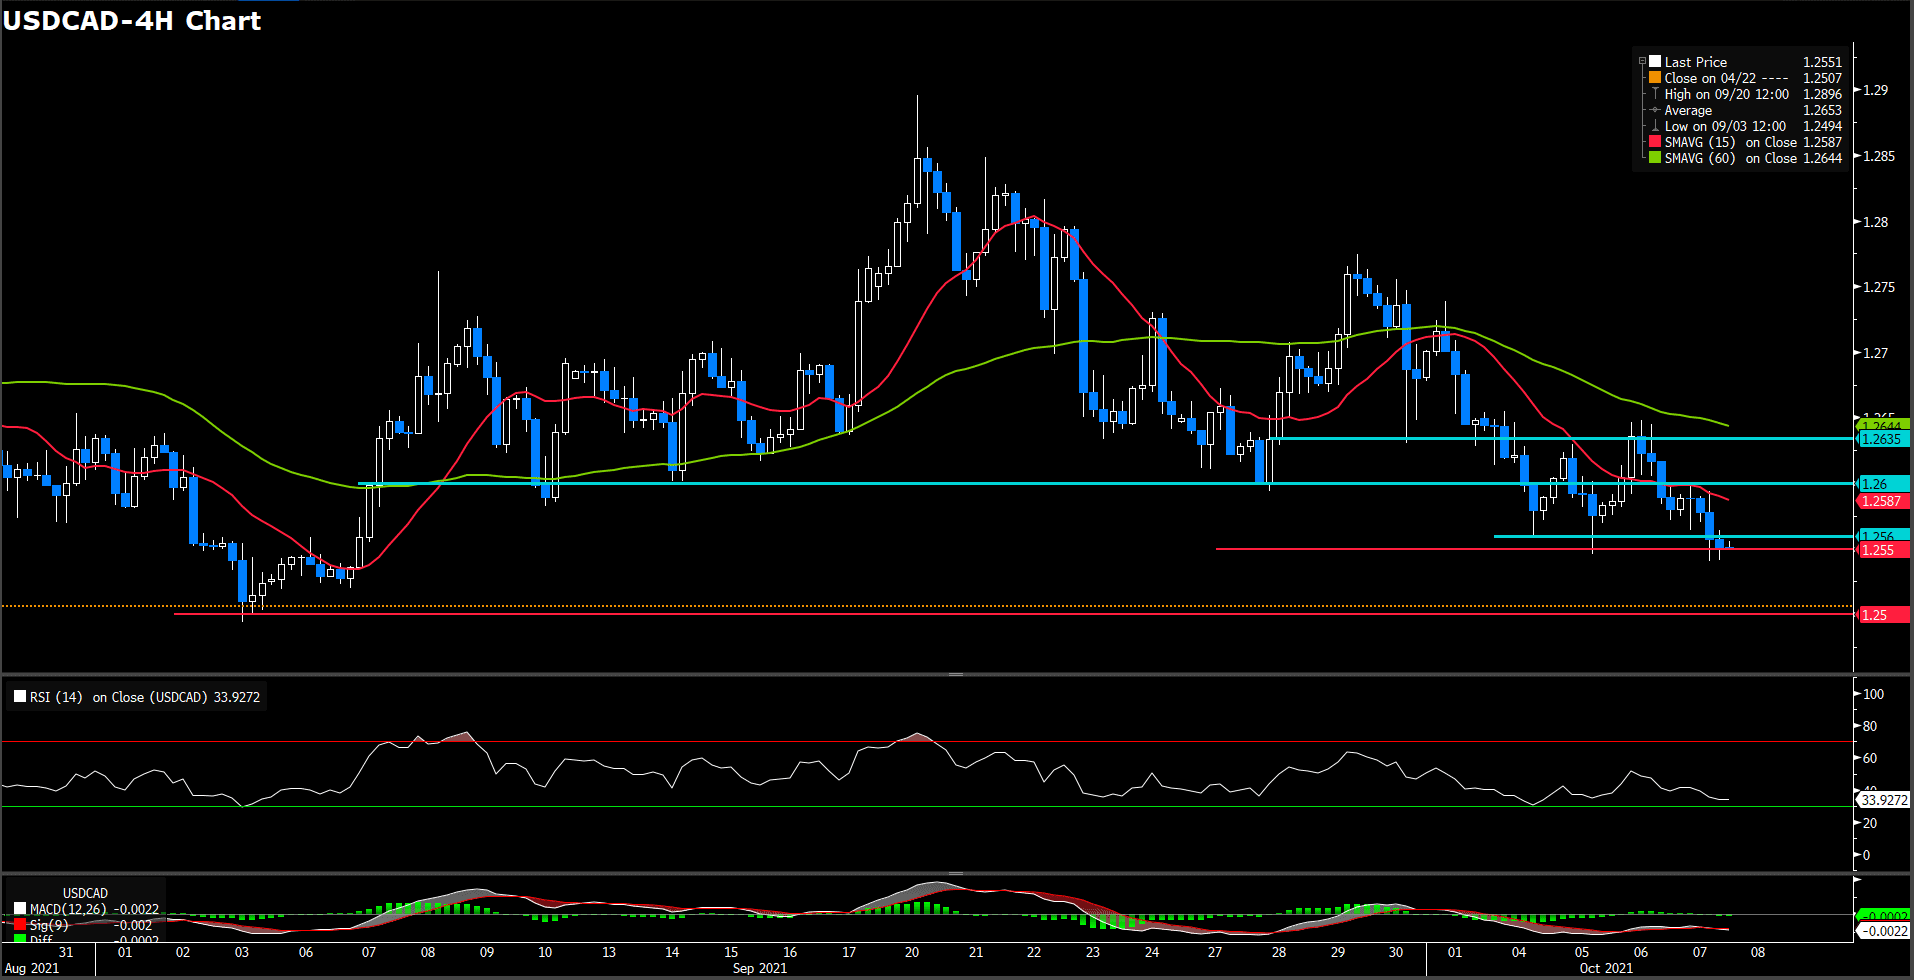
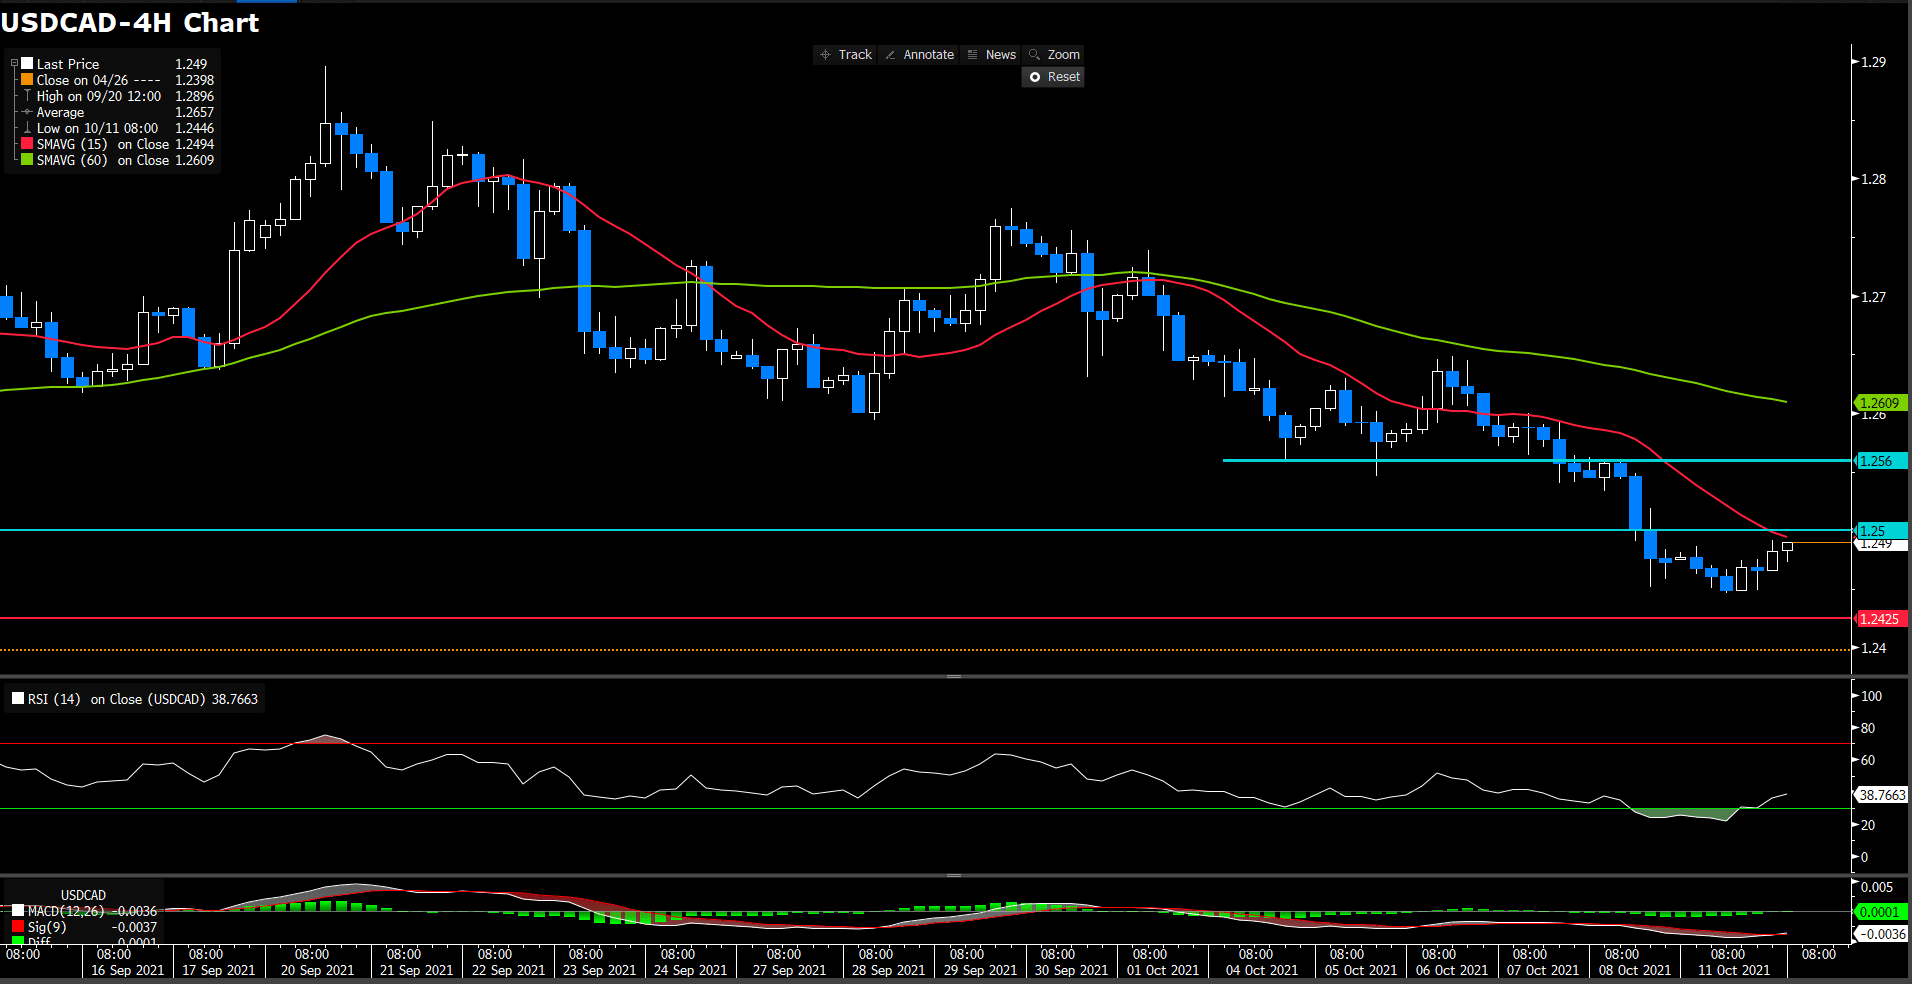
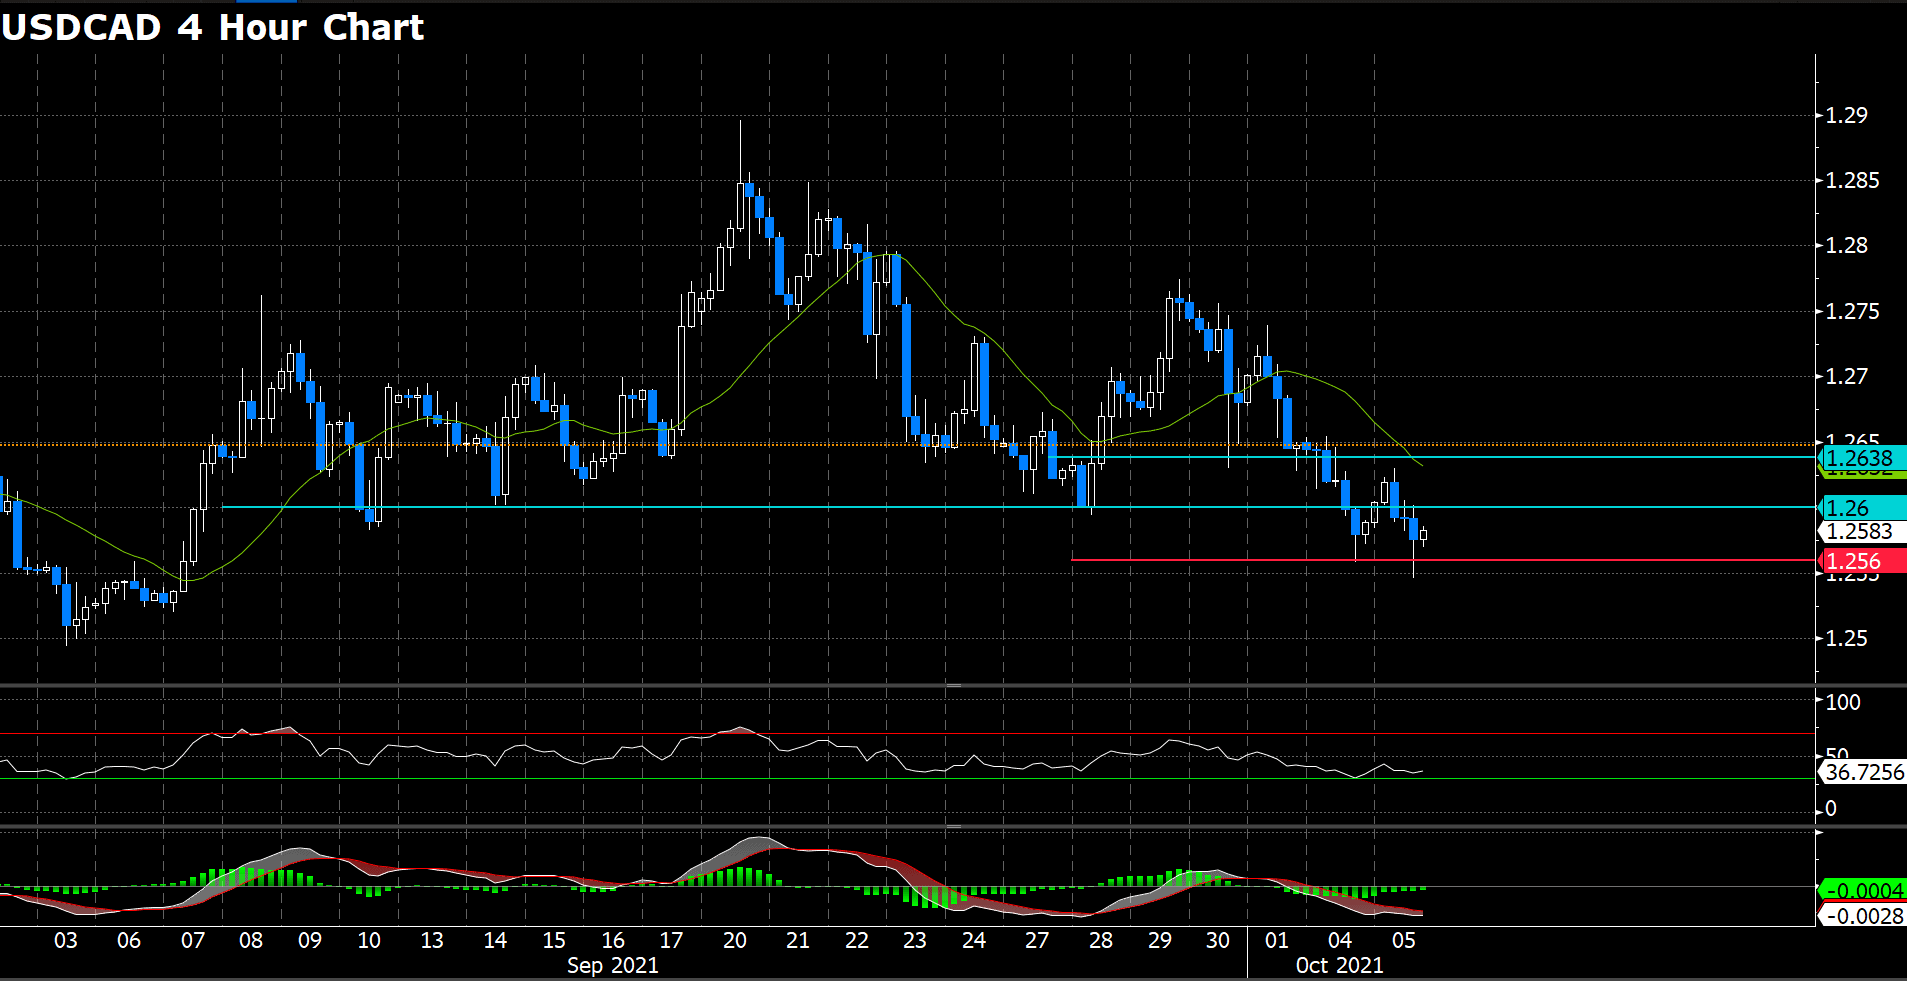
Loonie break below critical support of last day and once 1.254 in the day market where is the lowest level since Sept 7. It remains near the lows with a bearish intraday bias, favored by a wearker dollar and higher crude oil price. The U.S. dollar index is down 0.09%, sitting at 94.14. Furthermore, the U.S. 10 years T-bond benchmark note is advancing where sit at 1.565% as of writing, putting the breaks on the buck’s fall against major currencies. On political side, the President of Russia, offered an increase of the natural gas supplies for Europe to deal with over spike in energy price.
From a technical perspective, RSI index fell to 34 figure, consecutive suggesting a bearish momentum ahead. On MACD side, indicator turn into negative territory, suggesting a downside movement.
For the slip way, we expecting effectively support will between 1.255 and 1.256. Moreover, if market slip below 1.255, we see next support will be 1.25. On up way, the first resistance will be psychological level at 1.26
Resistance: 1.256, 1.26, 1.2635
Support: 1.255, 1.25
Economic Data
|
Currency
|
Data
|
Time (GMT + 8)
|
Forecast
|
|
USD
|
Nonfarm Payrolls (Sep)
|
20:30
|
500 K
|
|
USD
|
Unemployment Rate (Sep)
|
20:30
|
5.1%
|
|
CAD
|
Employment Change (Sep)
|
20:30
|
65K
|
|
|
|
|
|
|
|
|
|
|
|
|
|
|
|
|
|
|
|
|
|
|
|
|
|
|
|
|
|
|
|
|
|
|
|
|
|
|
|
|