Market Focus
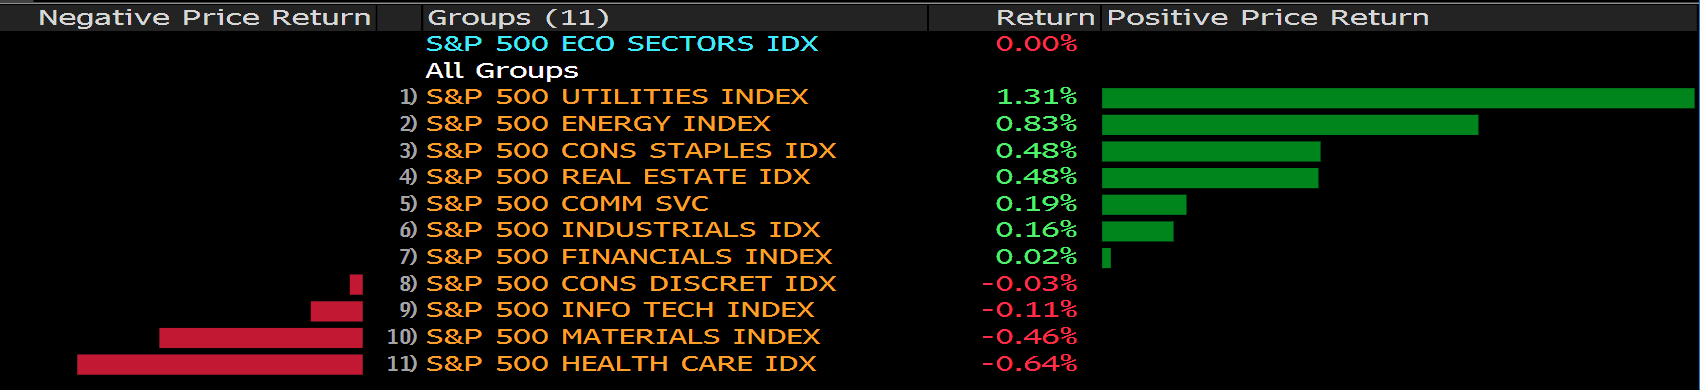
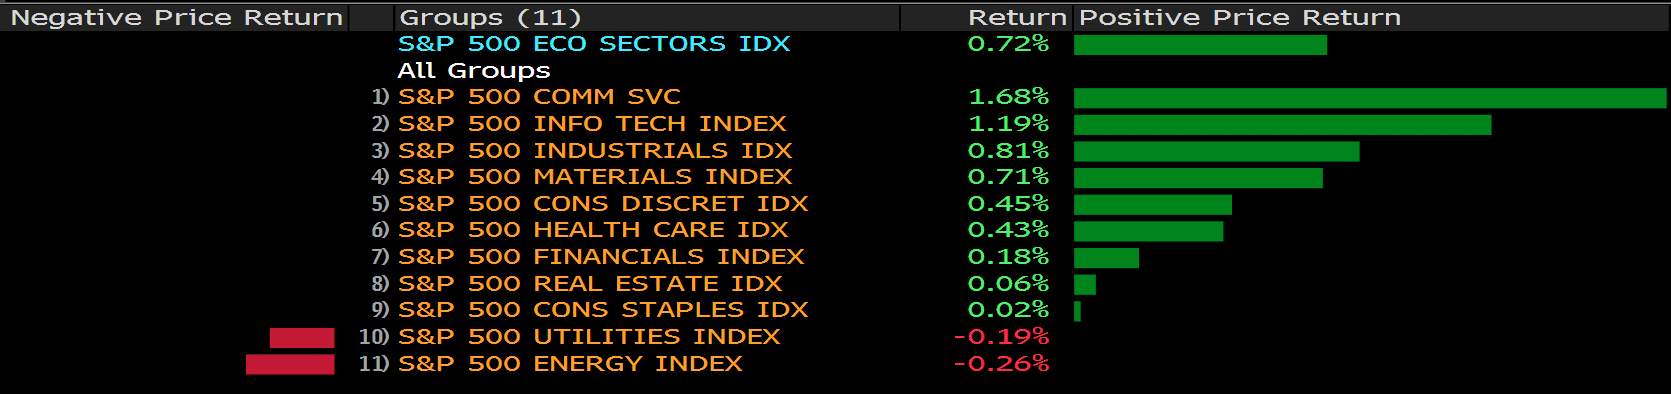
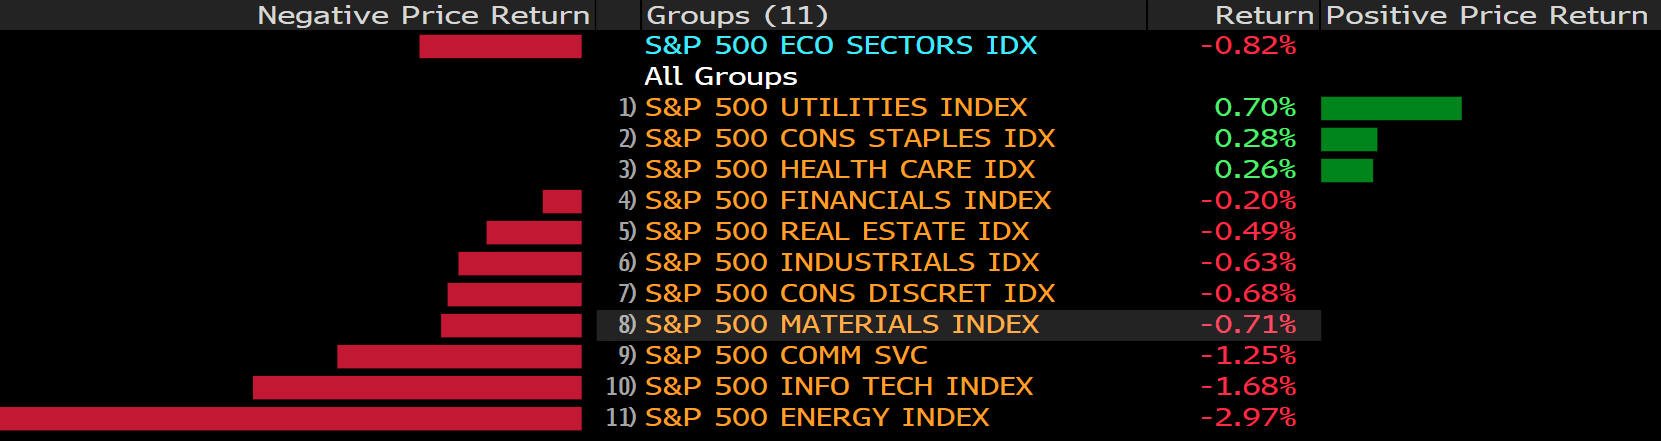
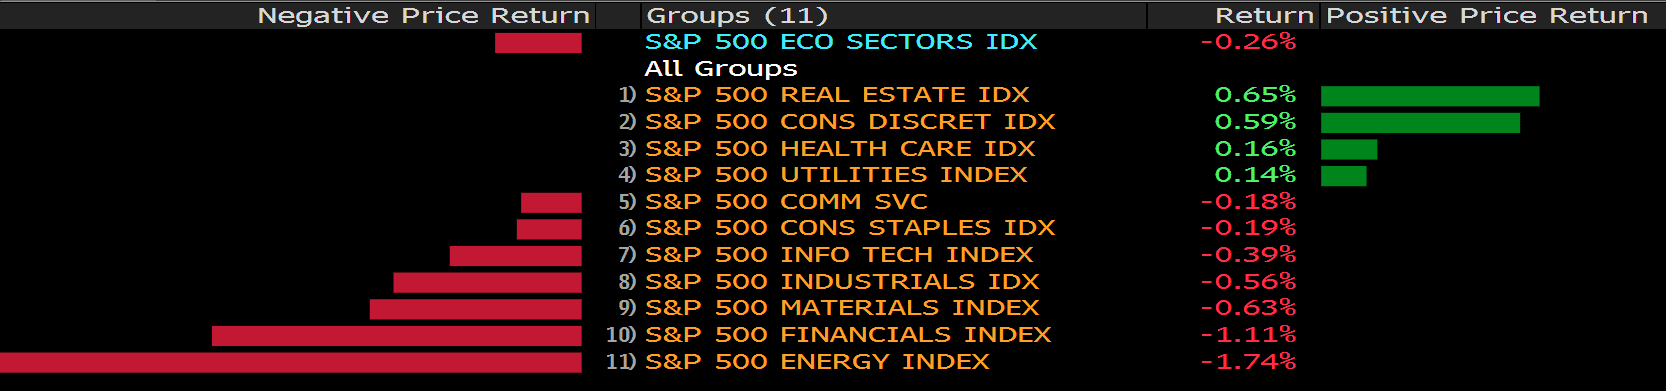
Equities retreated on concern that inflation could weigh on the global economic rebound, pushing central banks to raise interest rates sooner than expected.
Traders took some risk off the table as data signaled house builders are struggling to break ground on projects amid high materials prices and ongoing labor shortages. Target Corp. sank after warning that cost pressures are creeping up, stoking fears they will dent profits at retailers. In late trading, Cisco Systems Inc., the biggest maker of computer networking equipment, slumped on a lackluster revenue forecast, hurt by a shortage of components that’s making it difficult to keep up with demand.
(The data mentioned below is provided by Bloomberg)
Private equity firms are pulling money out of their companies at a breakneck pace, thanks to investors that are pouring money into loan funds to get protection from inflation.
Companies this year have borrowed or are planning to borrow more than $88 billion in the U.S. leveraged loan market to fund dividend payments to their private equity owners. That’s the most for a year since at least 2013 when Bloomberg began compiling the data, which includes loans whose proceeds are in part for dividend payments but also go toward uses like refinancing debt.
Private equity firms are reaping the benefits, using the intense demand for loans to pile even more borrowings onto the heavily-indebted companies they own. KKR & Co.’s Internet Brands, whose assets include the WebMD medical advice website, is borrowing $4.8 billion to refinance debt and to pay a dividend of around $1 billion, according to a report by Moody’s Investors Service.
Main Pairs Movement:
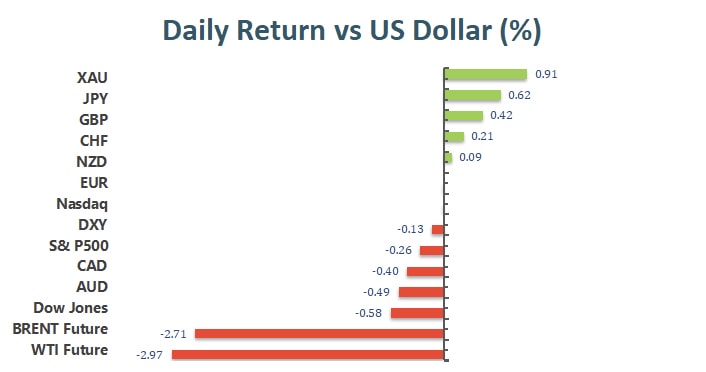
The greenback’s recent hike seemed to run out of gas on Wednesday, with the dollar index falling back to the 95.80s by the end of the New York session having printed fresh 16-month highs at 96.26 in early Asia trade. The White House said a final decision on the Fed chair nominee would be made before Thanksgiving (11/25).
Mixed US housing data failed to spur the greenback higher as positive retail sales, regional Fed manufacturing survey and Consumer Price inflation data did in recent sessions. US yields pulled back a little, with the 10-year benchmark dropping 2bps back to 1.60%, somewhat eroding dollar’s rate advantage.
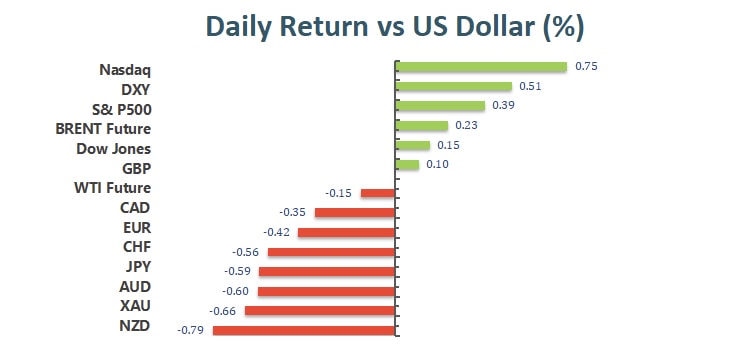
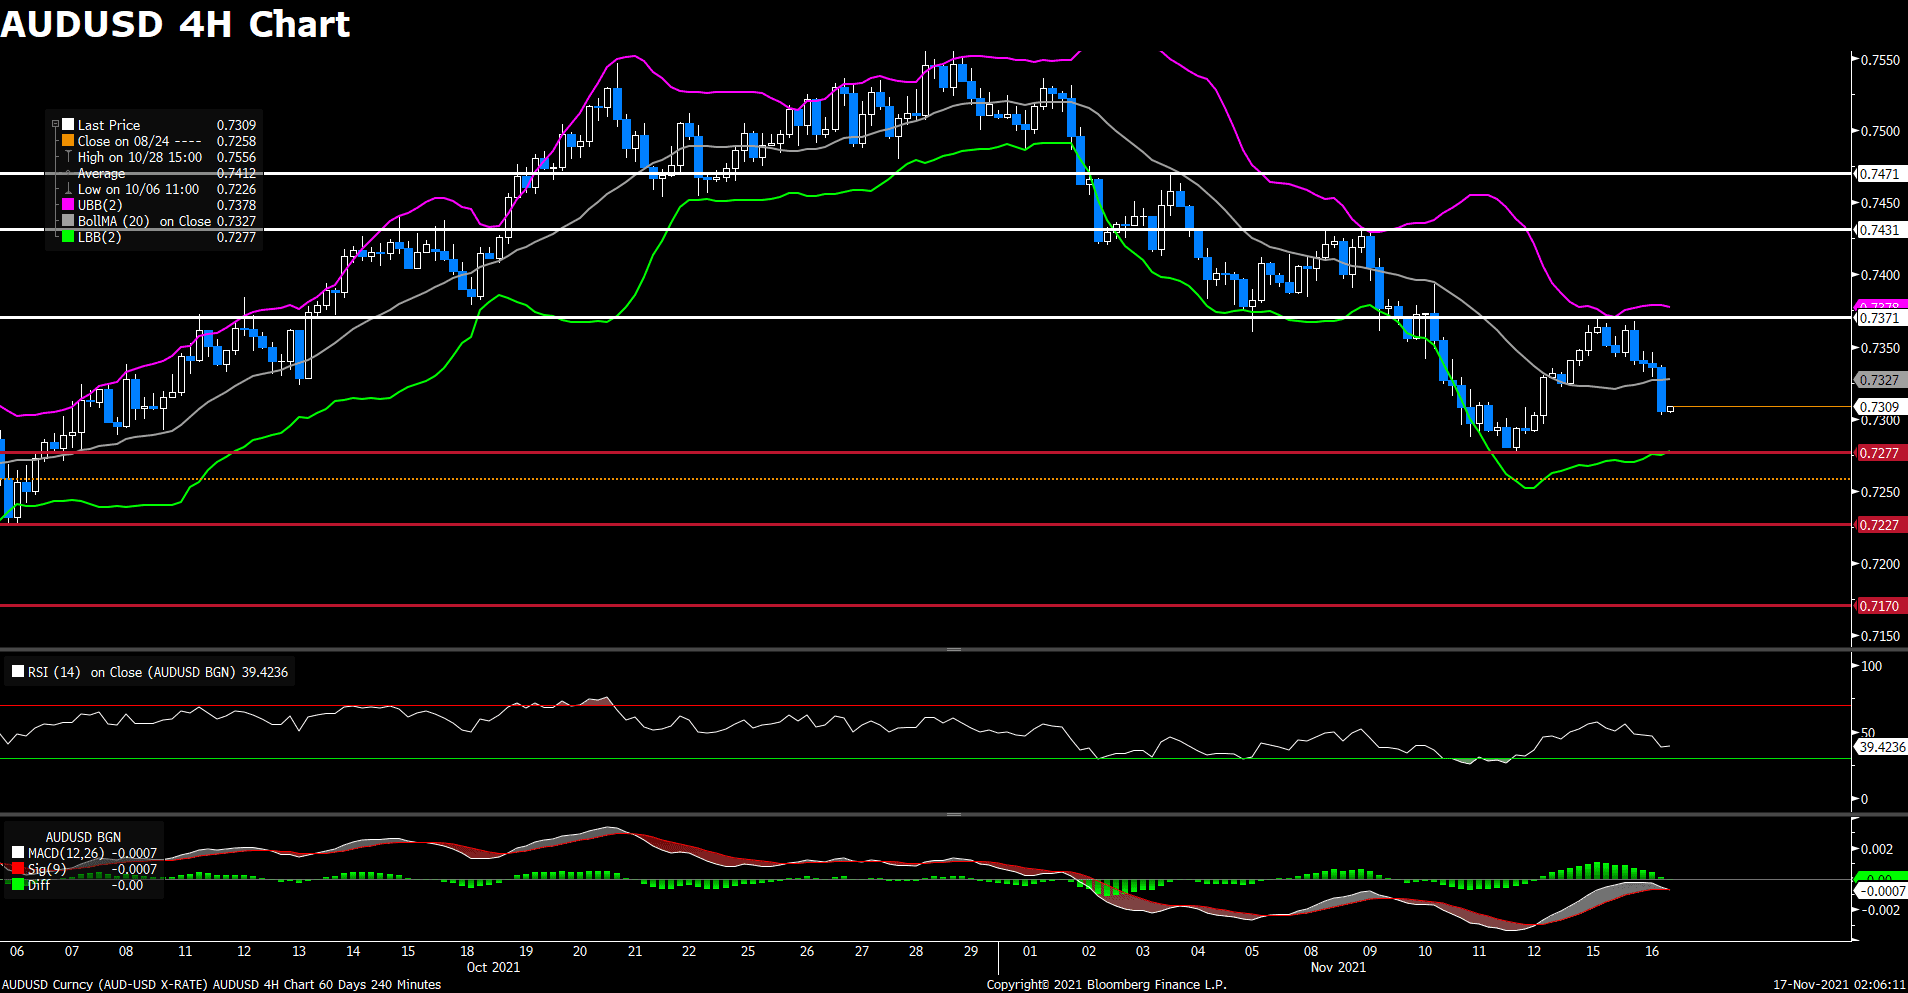
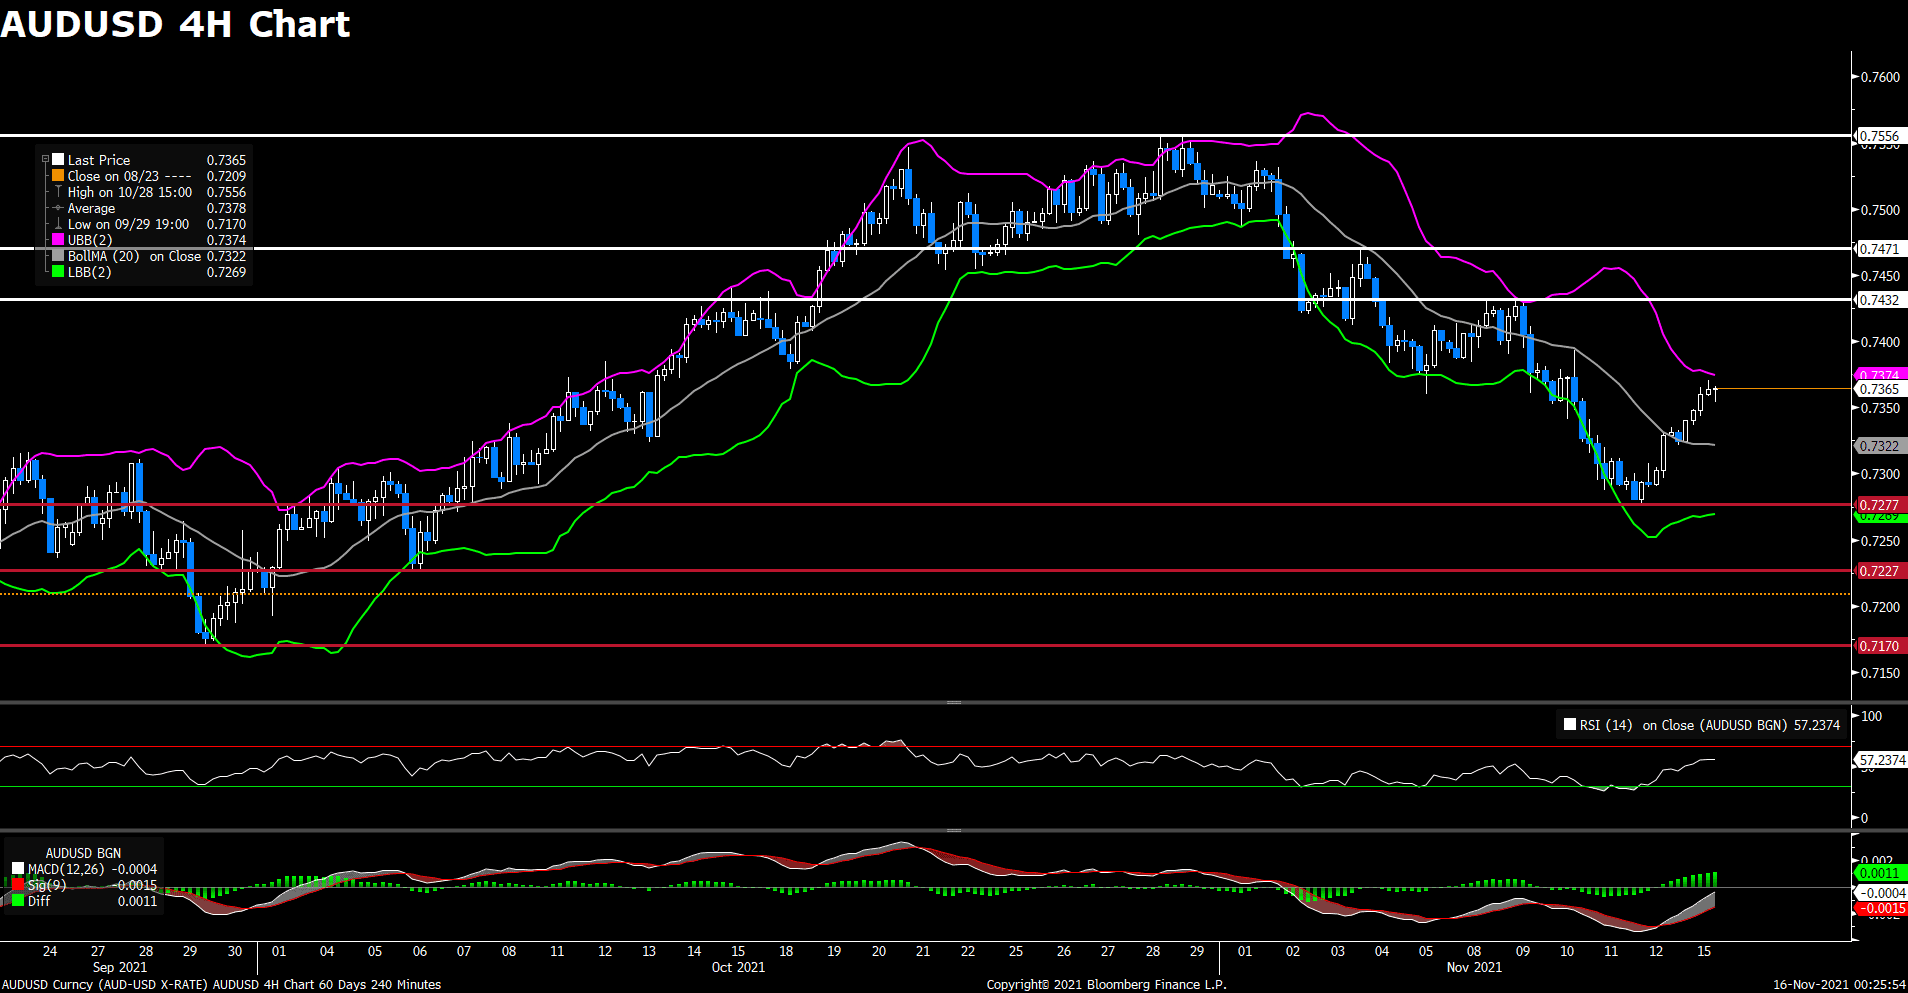
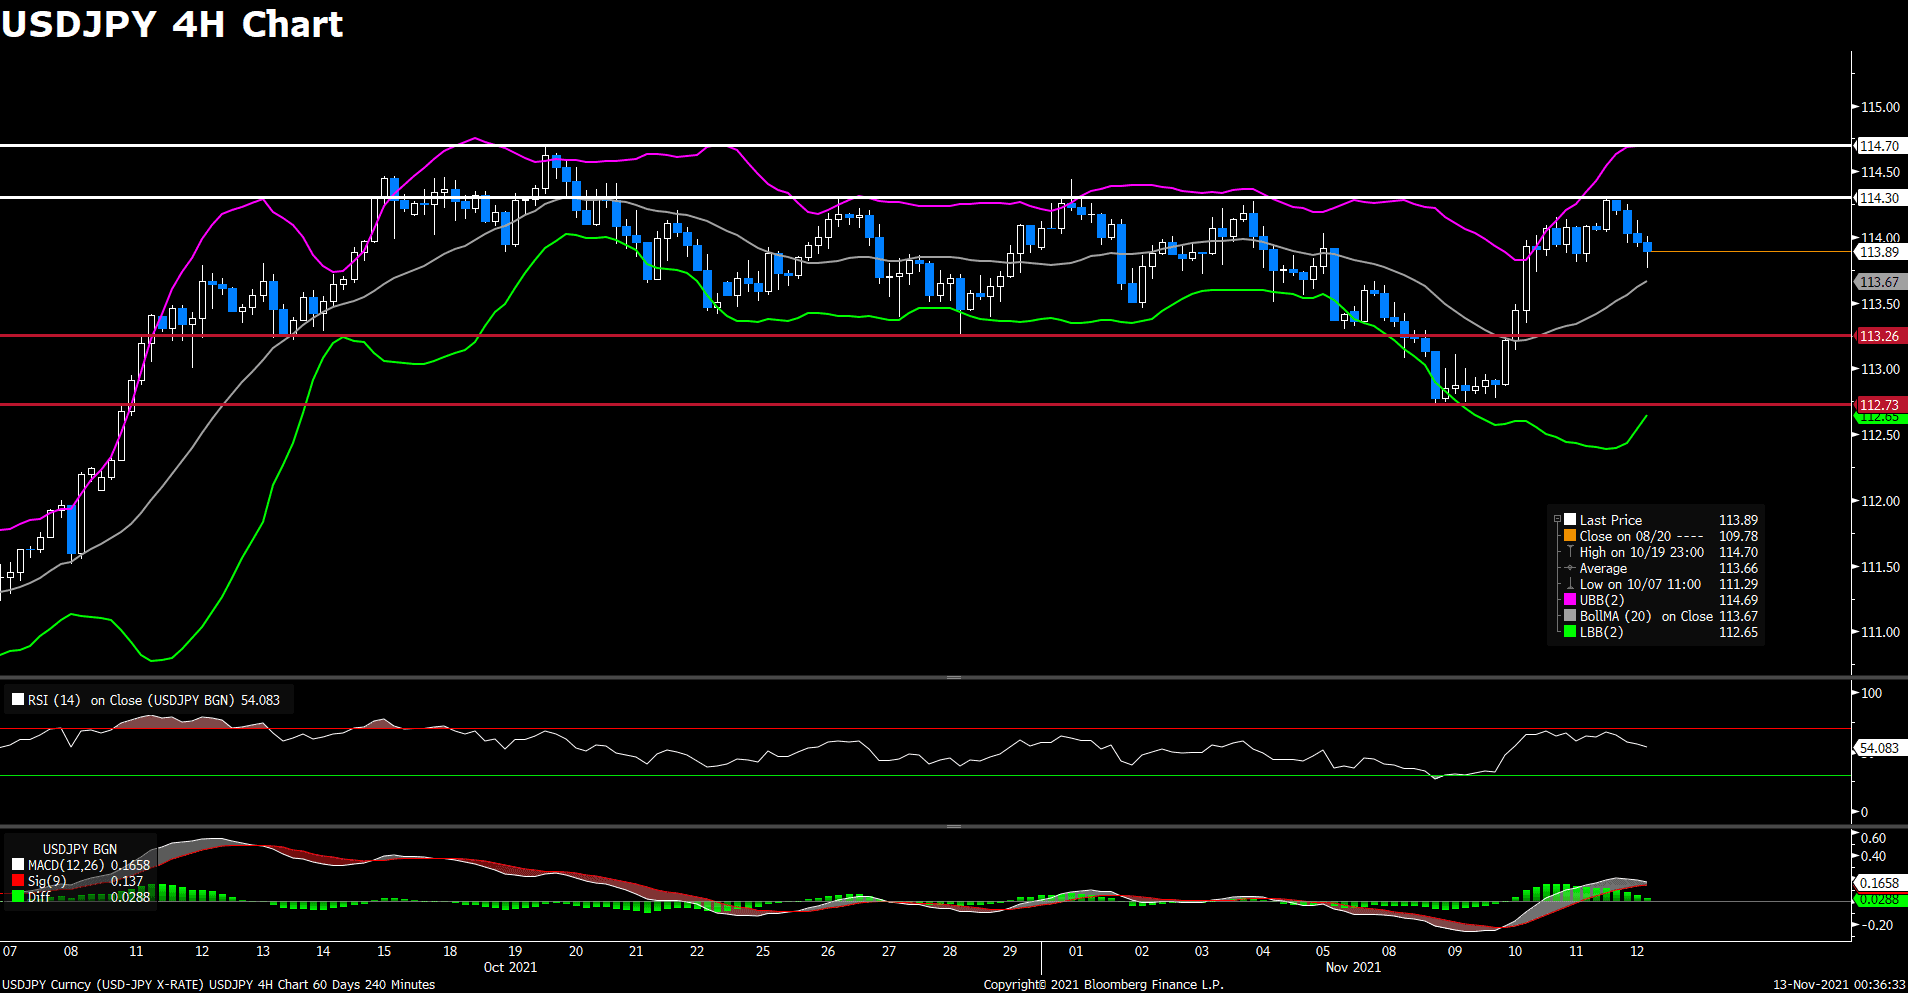
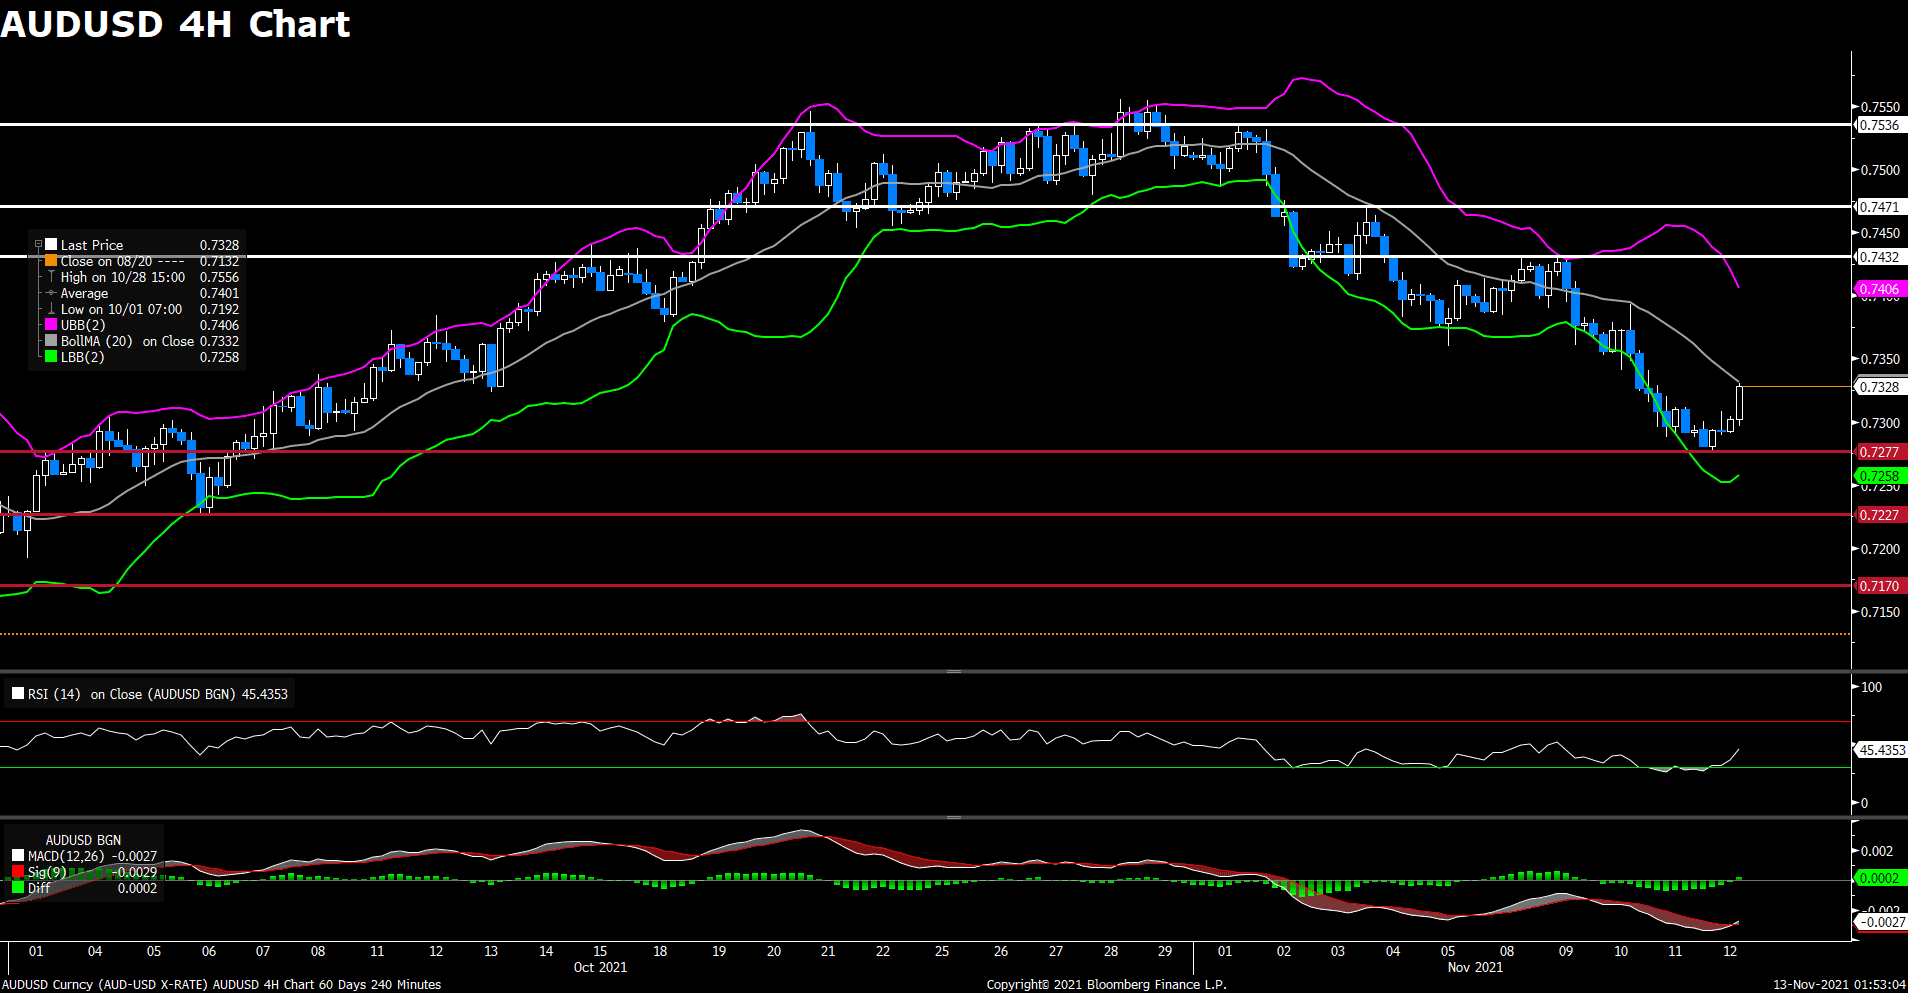
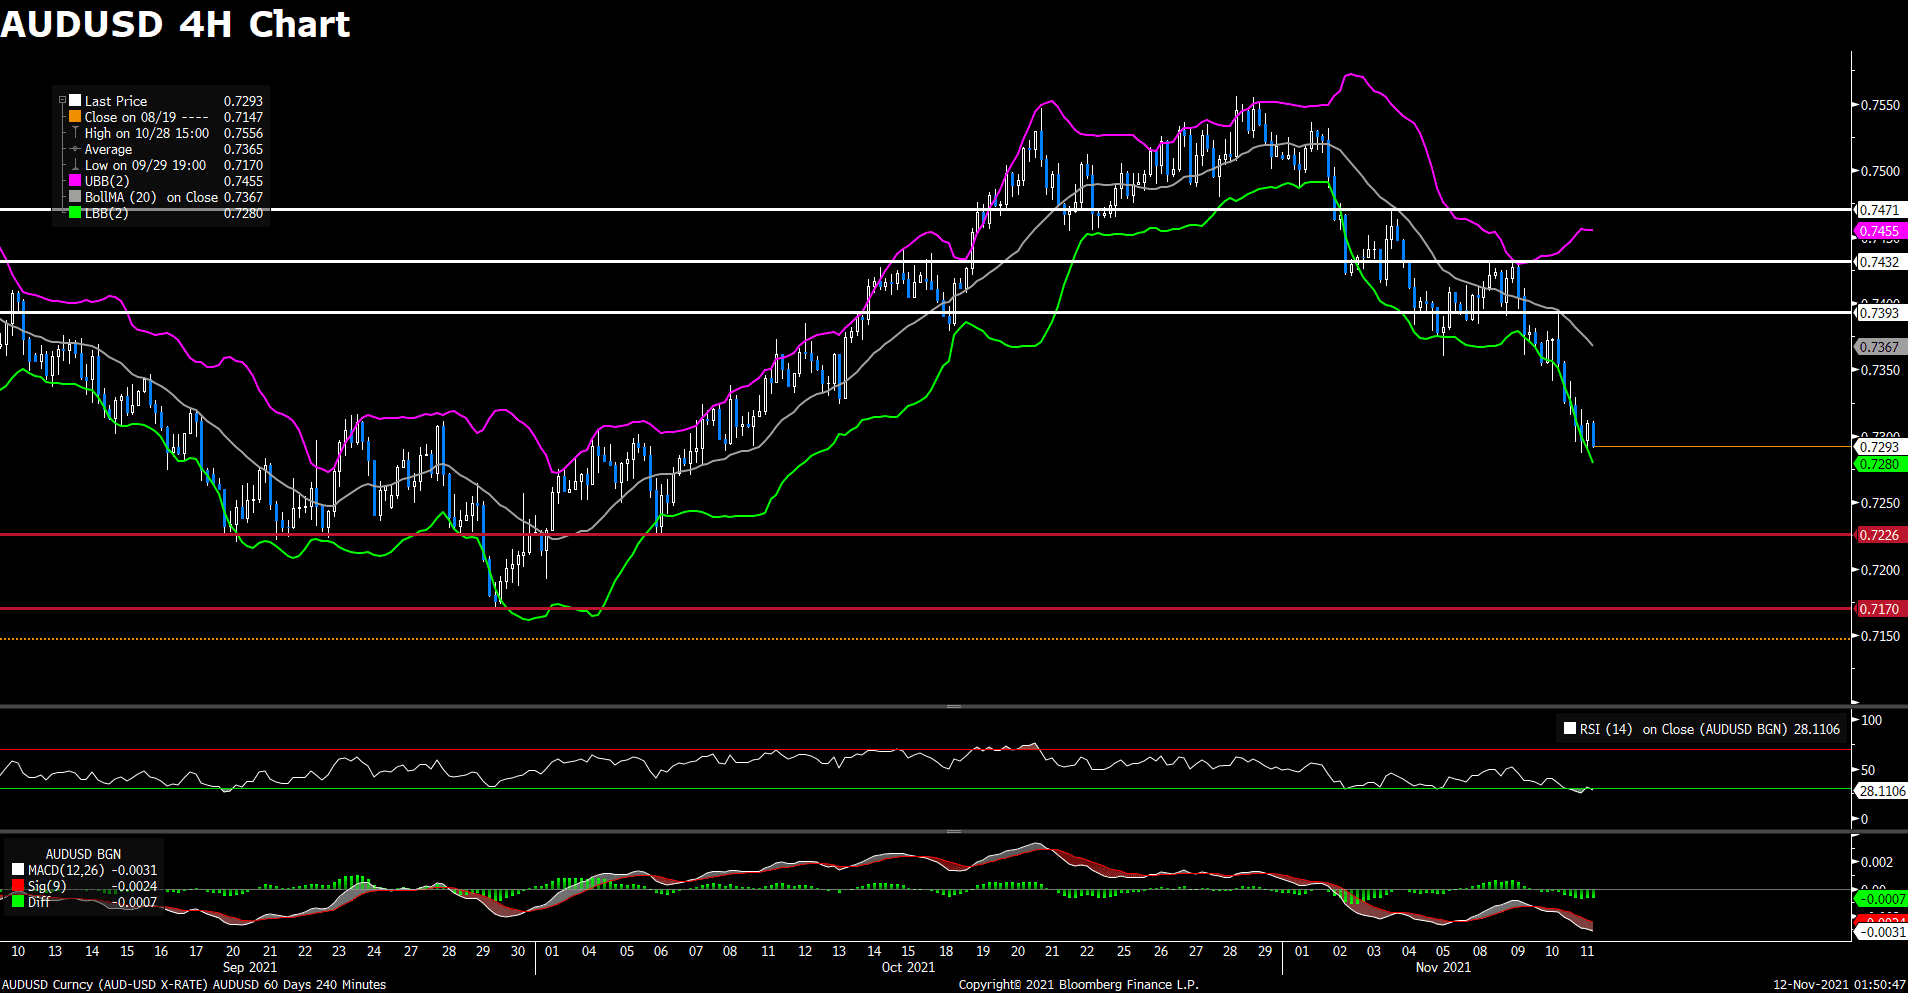
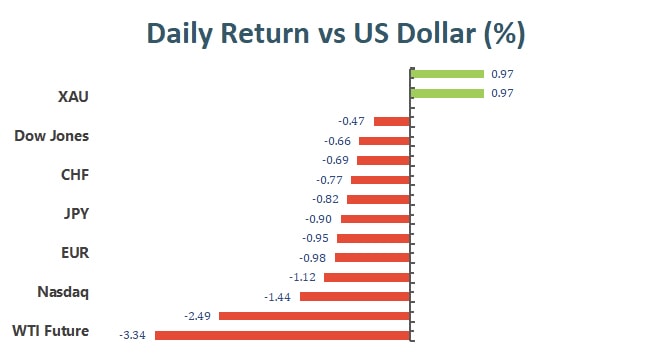
Most of the major currencies added value against the US dollar. Among all, the JPY was the best performer, as USD/JPY rallied 0.6% amid the US/Japan rate differentials tightened. On the flip side, the AUD/USD down 0.5%. RBA’s dovish stance starts to cap the Australian dollar as the inflationary pressure drives most major central banks to a tighter monetary policy.
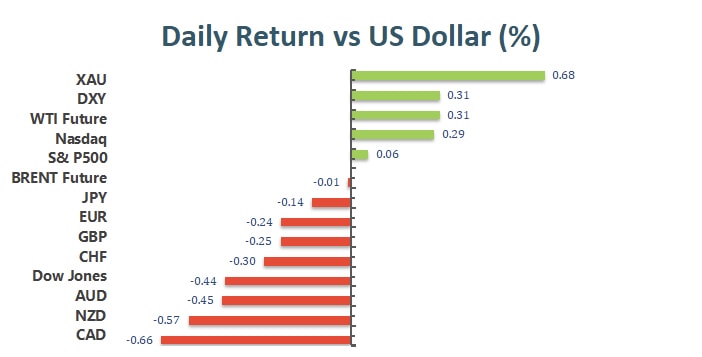
Gold closed in green for another day after the two-day correction at the start of the week. Refreshed inflation fears help boost the yellow metal and analysts set up goal up to $1910/ounce. Crude oil prices, however, were smashed on Wednesday, with WTI dropped 3% to $78.20, and Brent declined 2.6% to $80.20.
Technical Analysis:
EURUSD (4- Hour Chart)
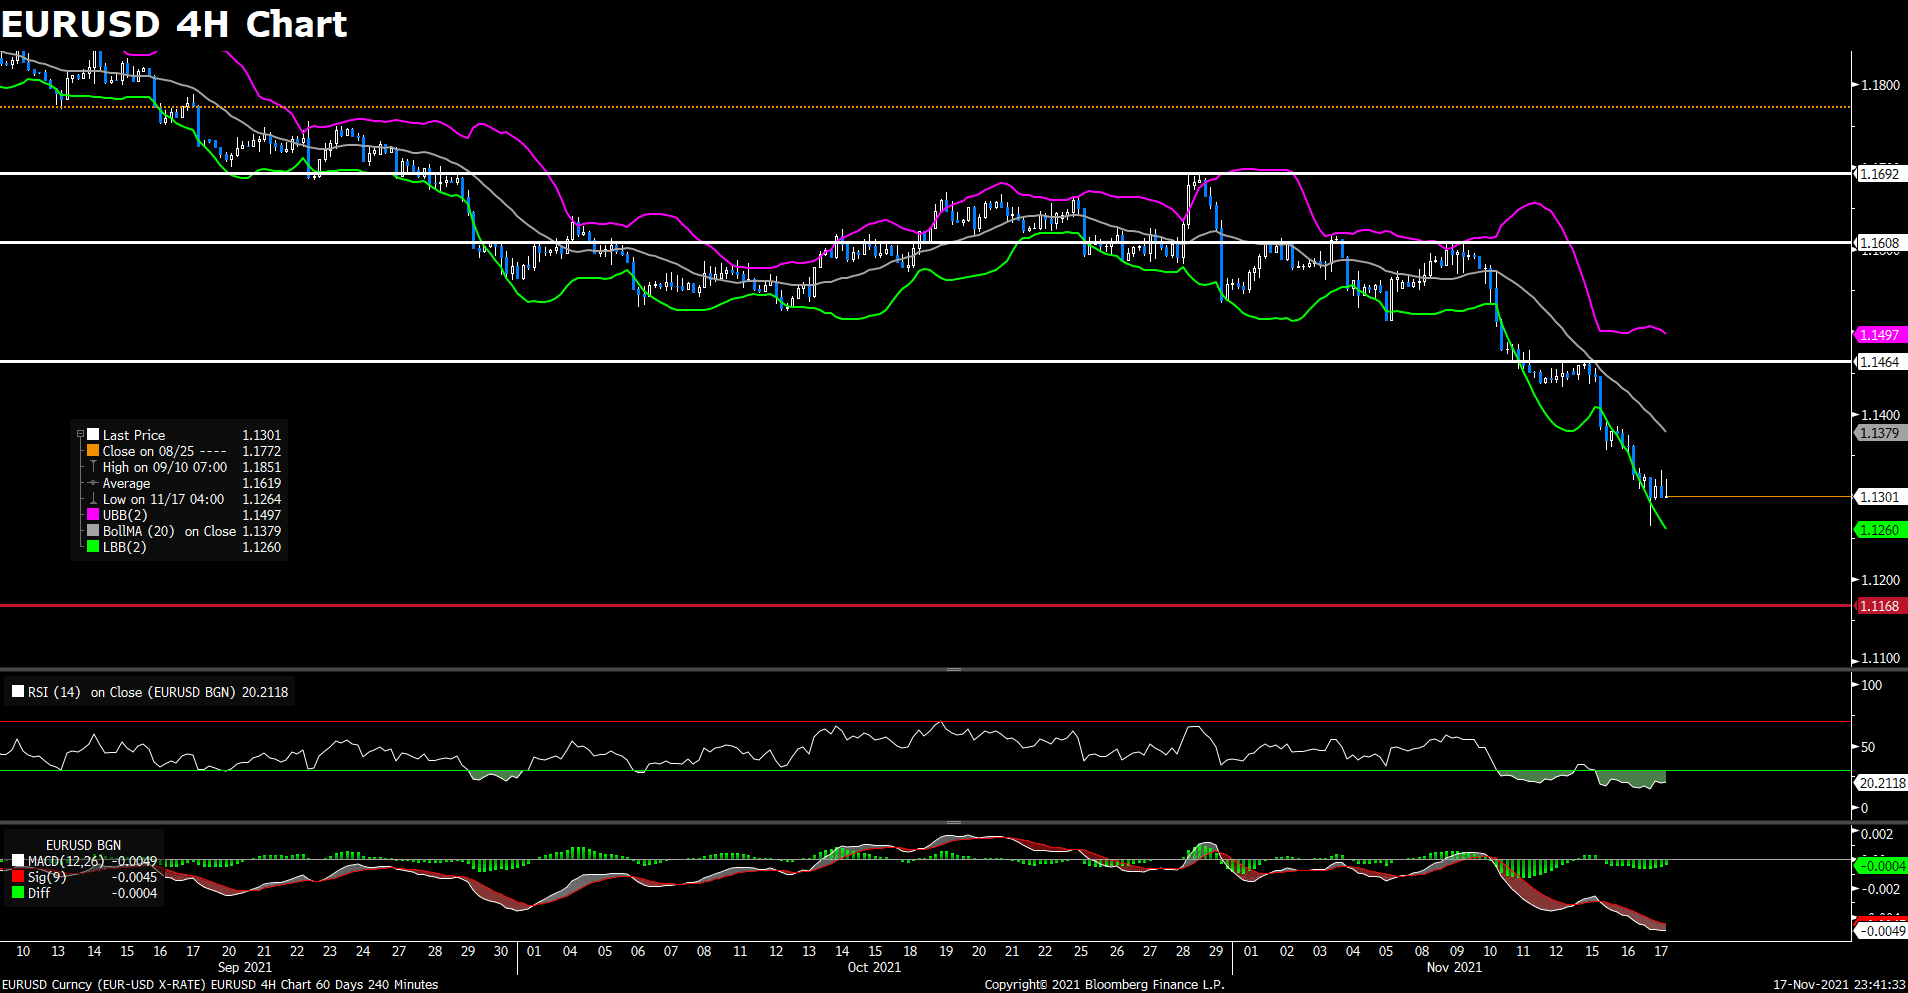
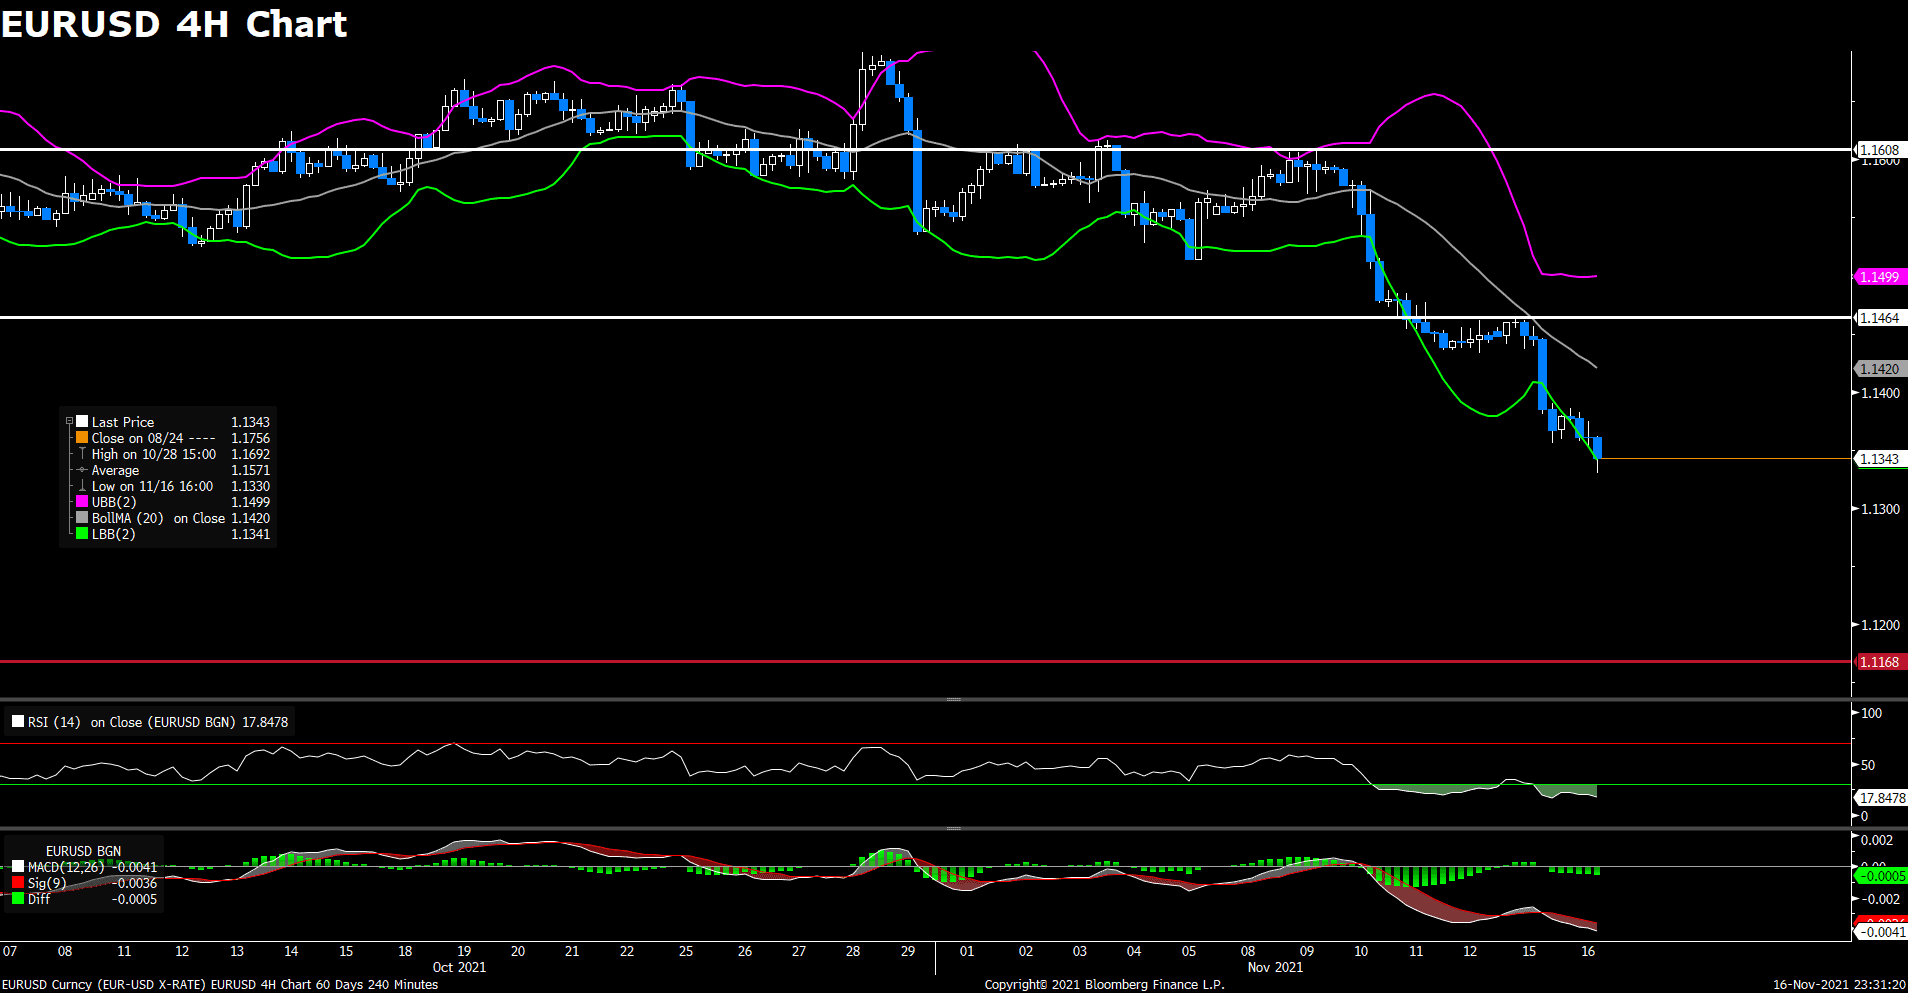
Following yesterday’s slide to 1.132 area, the pair EUR/USD continued to stay in negative territory on Wednesday. The pair tumbled further and touched new 2021 lows near 1.126 level in mid-Asian session, but then rebounded back above 1.132 to pared its intraday losses. The previous sharp pullback in the pair was mainly due to US dollar strength, as the upbeat Retail Sales data and rising US Treasury bond yields on inflation fears both acted as a tailwind for the greenback. In Eurozone, CPI report showed that inflation arrives at 4.1% YoY in October, which is the same as market expectations. Earlier in the day, ECB president Christine Lagarde said that tightening monetary policy to ease inflation could suppress the eurozone’s recovery, and the dovish comments dragged the pair lower.
For technical aspect, RSI indicator 23 figures as of writing, suggesting that the pair is in oversold zone, a trend reversal could be possible. For the MACD indicator, the MACD is now sitting below the signal line, which also indicates a possible downward trend for the pair. Looking at the Bollinger Bands, the price moves alongside the lower band, therefore the bearish momentum is likely to persist. In conclusion, we think market will be bearish as the pair still remain under pressure, and a test of the 1.1168 support is likely.
Resistance: 1.1464, 1.1608, 1.1692
Support: 1.1168, 1.0871
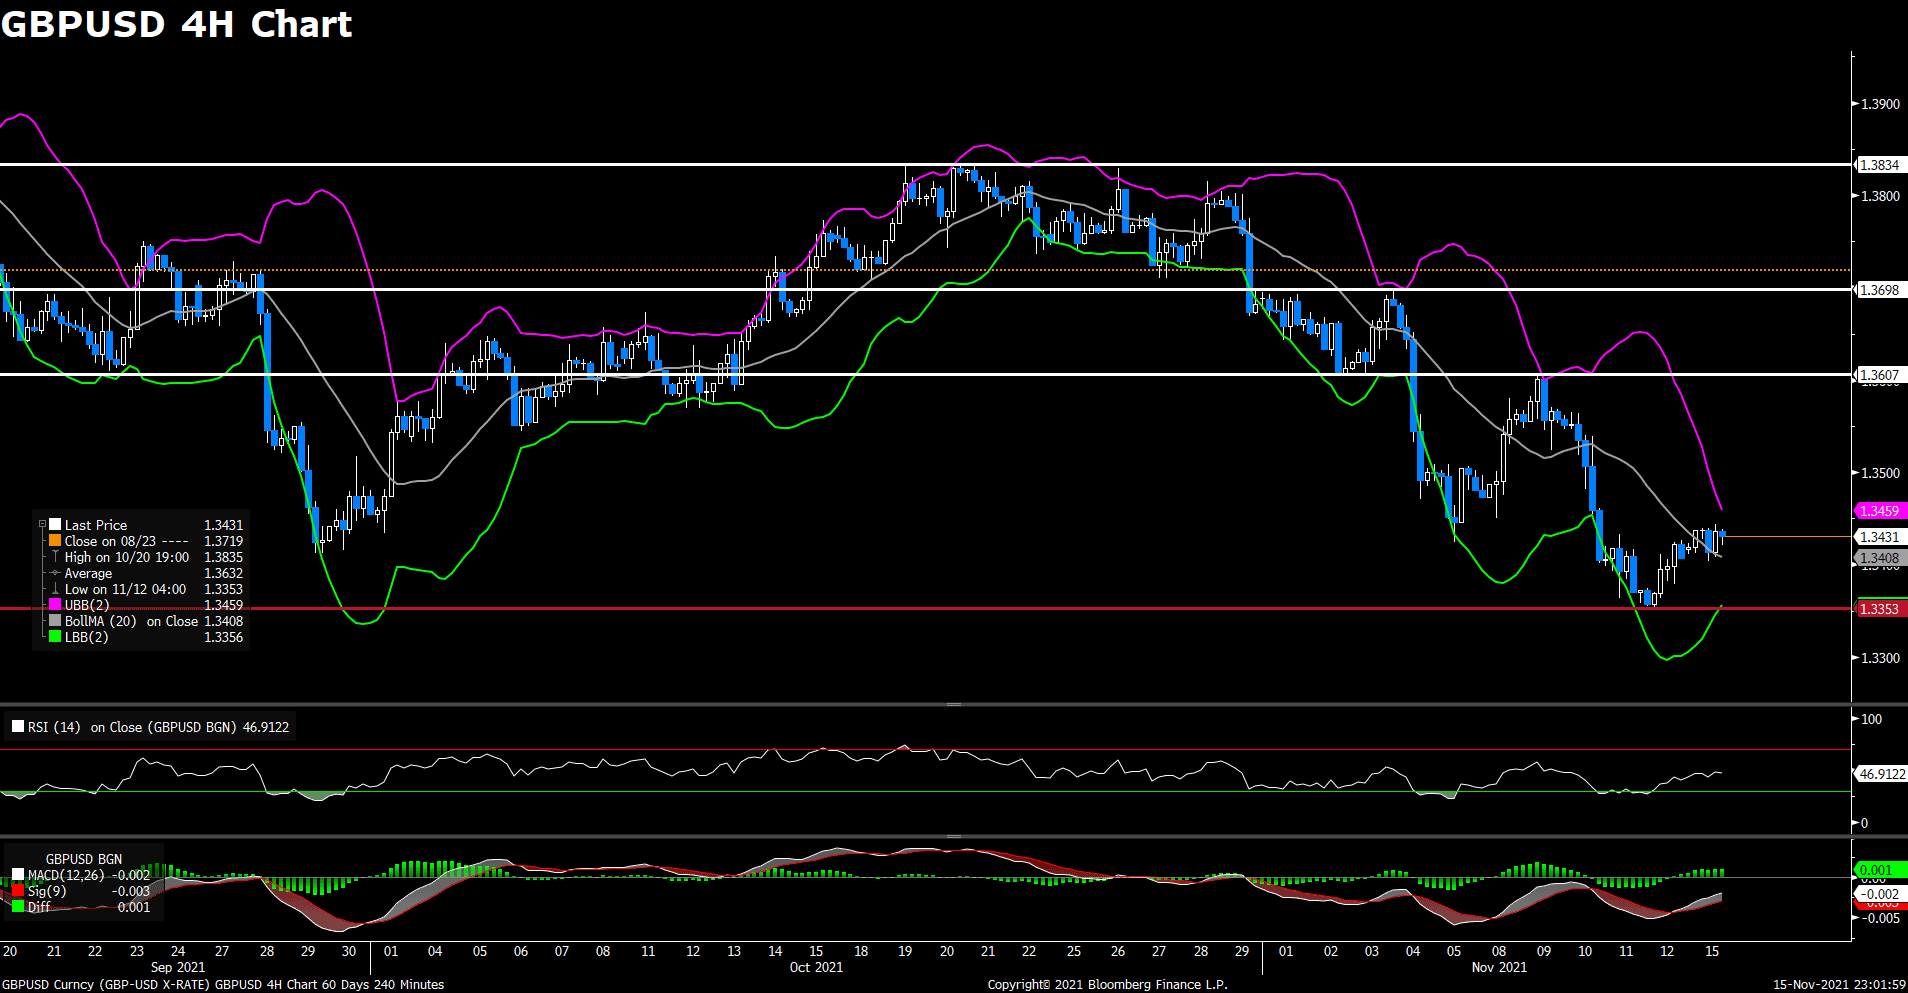
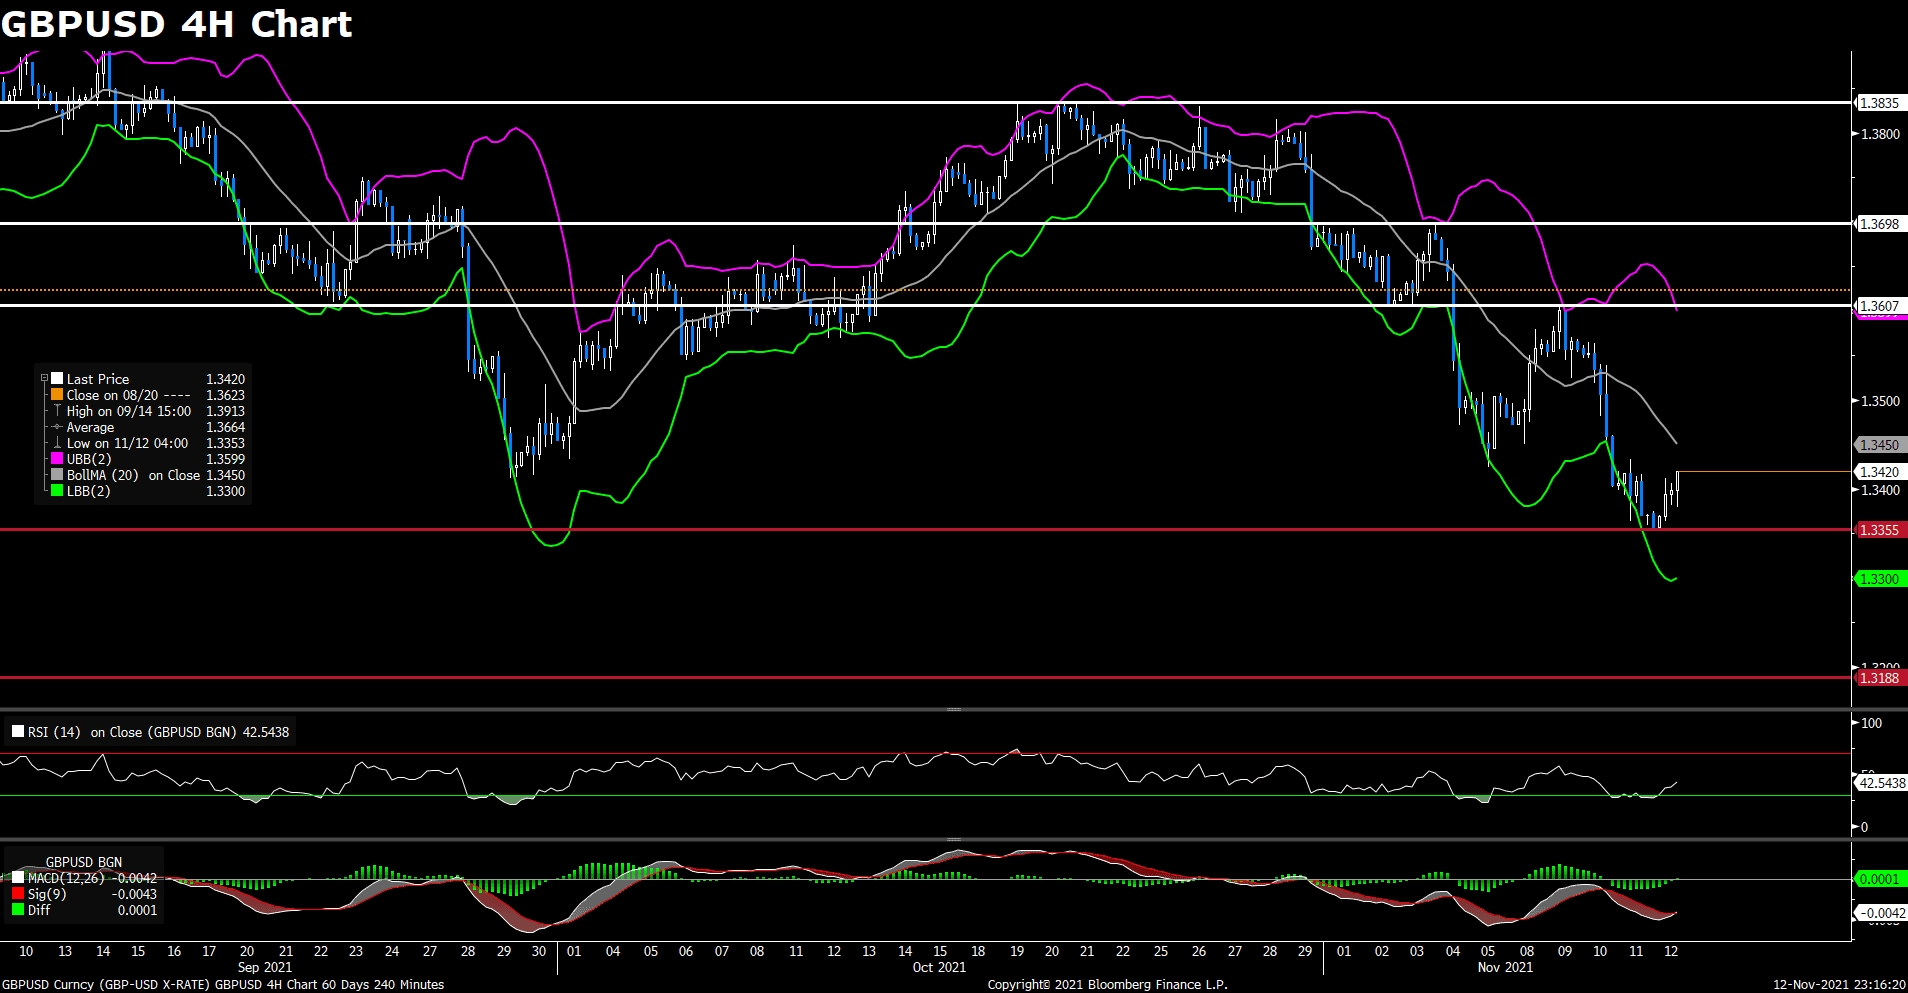
GBPUSD (4- Hour Chart)
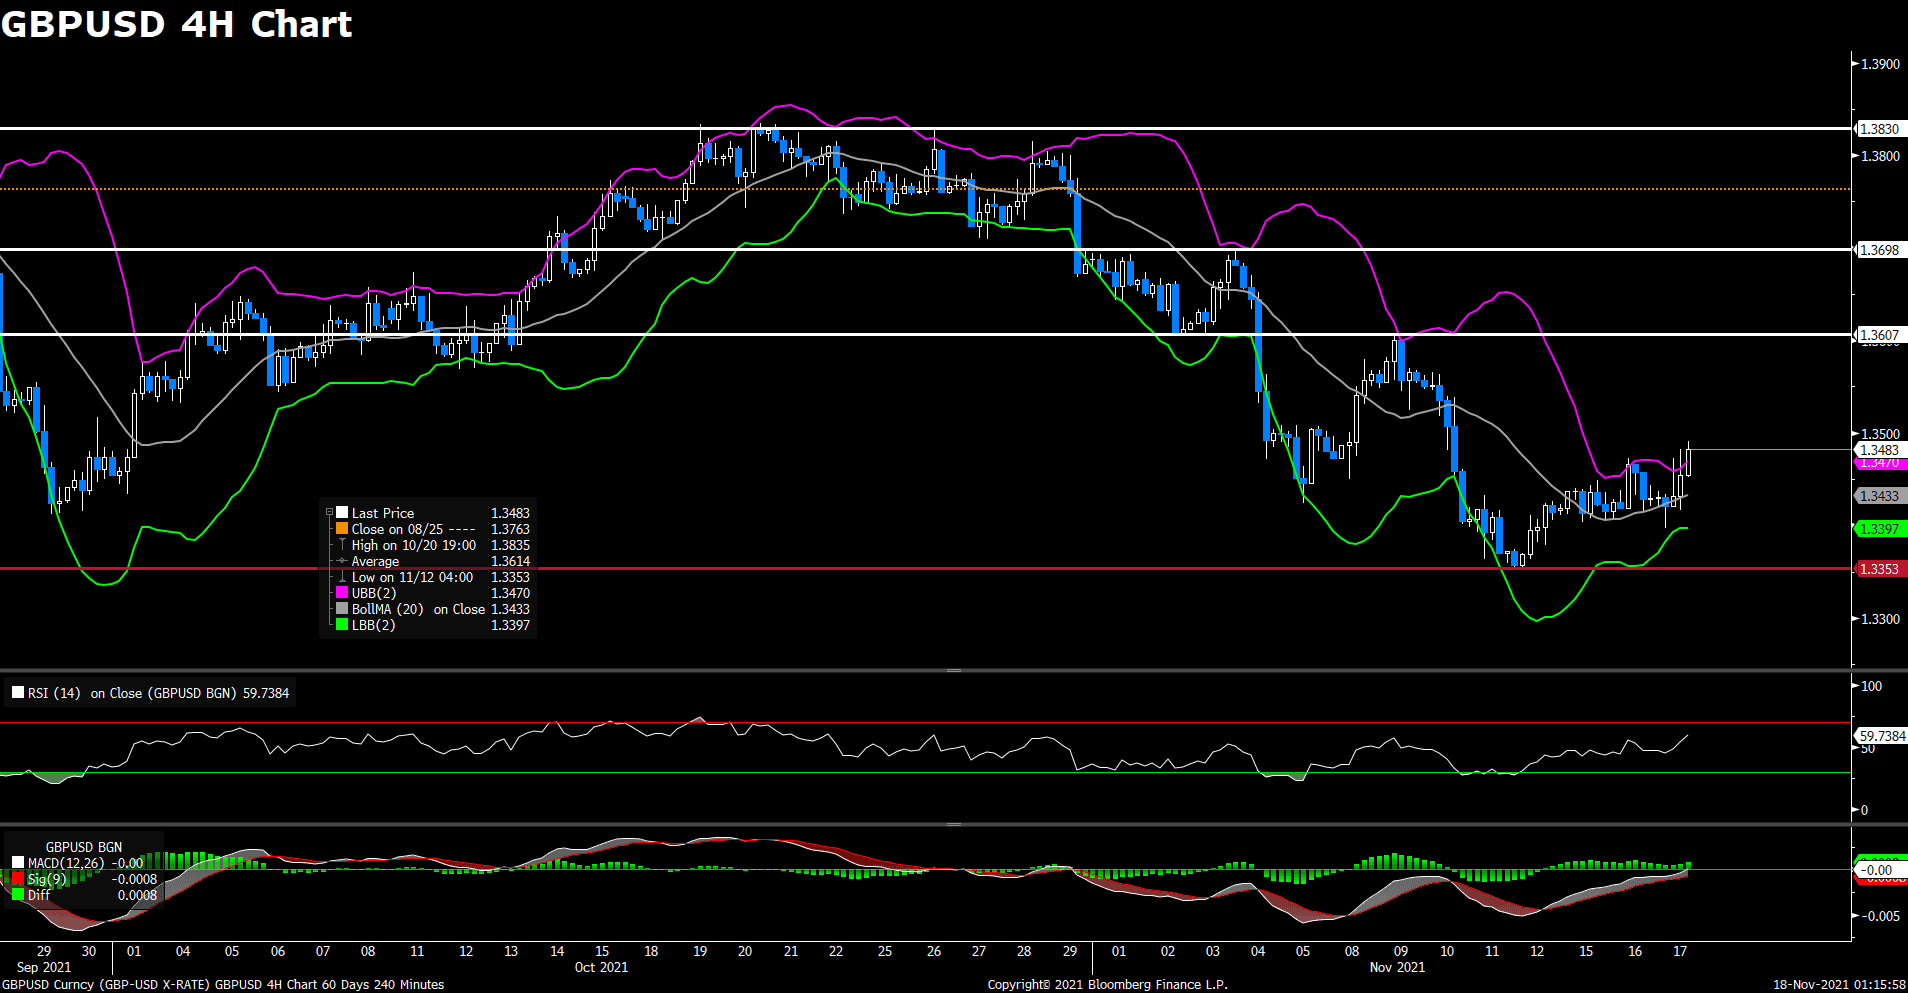
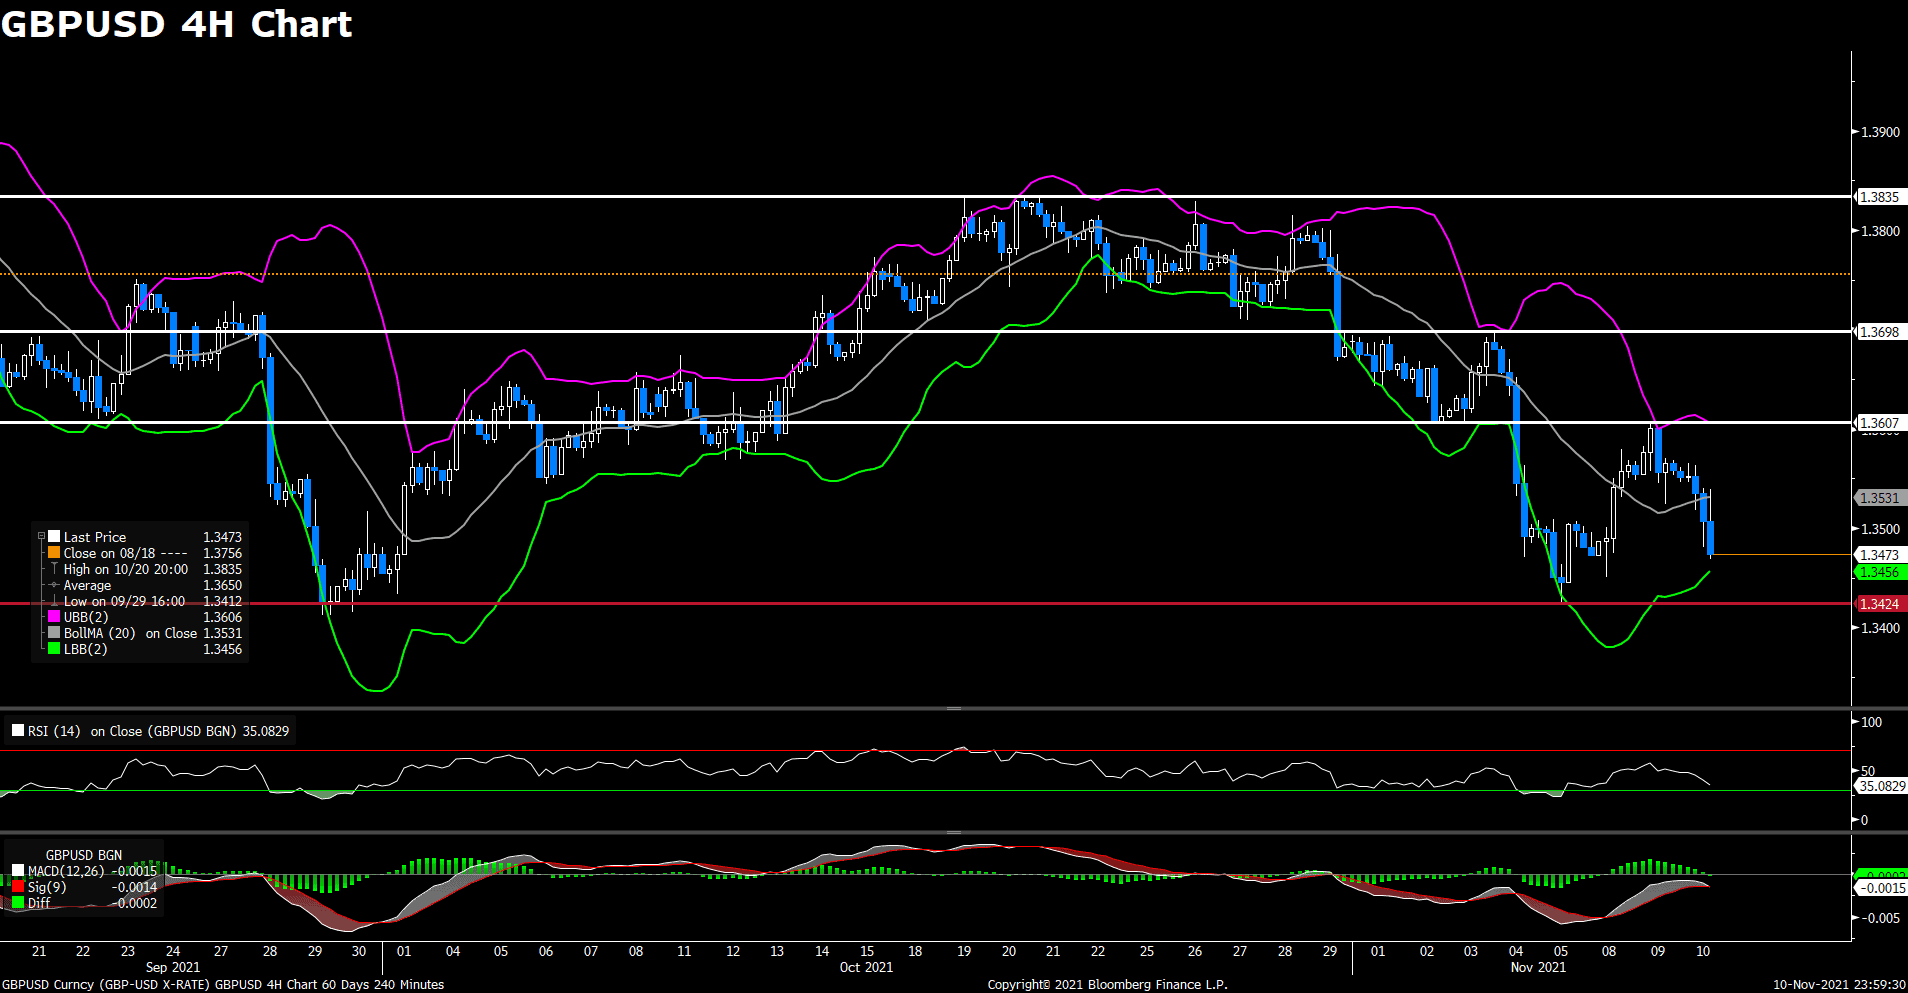
The pair GBP/USD advanced on Wednesday, continuing to recover from yearly lows that touched last week. The pair preserved its bullish momentum and reached a fresh daily top near 1.349 area in early American session. The cable was last seen trading at 1.3485, rising 0.42% on a daily basis. Recent buying witnessed in GBP/USD pair arise from hotter-than-expected UK CPI report, which showed that consumer prices surged to 4.2% in October with the fastest pace since December 2011. The stronger data underpinned the GBP/USD pair and enhanced expectations for an early rate hike by BoE. However, the prospects for an early policy tightening by the Fed might cap the upside for the pair.
For technical aspect, RSI indicator 59 figures as of writing, suggesting bull movement ahead. Looking at the MACD indicator, the increasing positive histogram also indicates a possible upward trend for the pair. As for the Bollinger Bands, the price is moving out of the upper band, therefore a strong trend continuation could be expected. In conclusion, we think market will be bullish as the pair is heading to re-test the 1.3607 resistance. The bullish tone could be intensified if the pair break above that resistance.
Resistance: 1.3607, 1.3698, 1.3830
Support: 1.3353
USDCAD (4- Hour Chart)
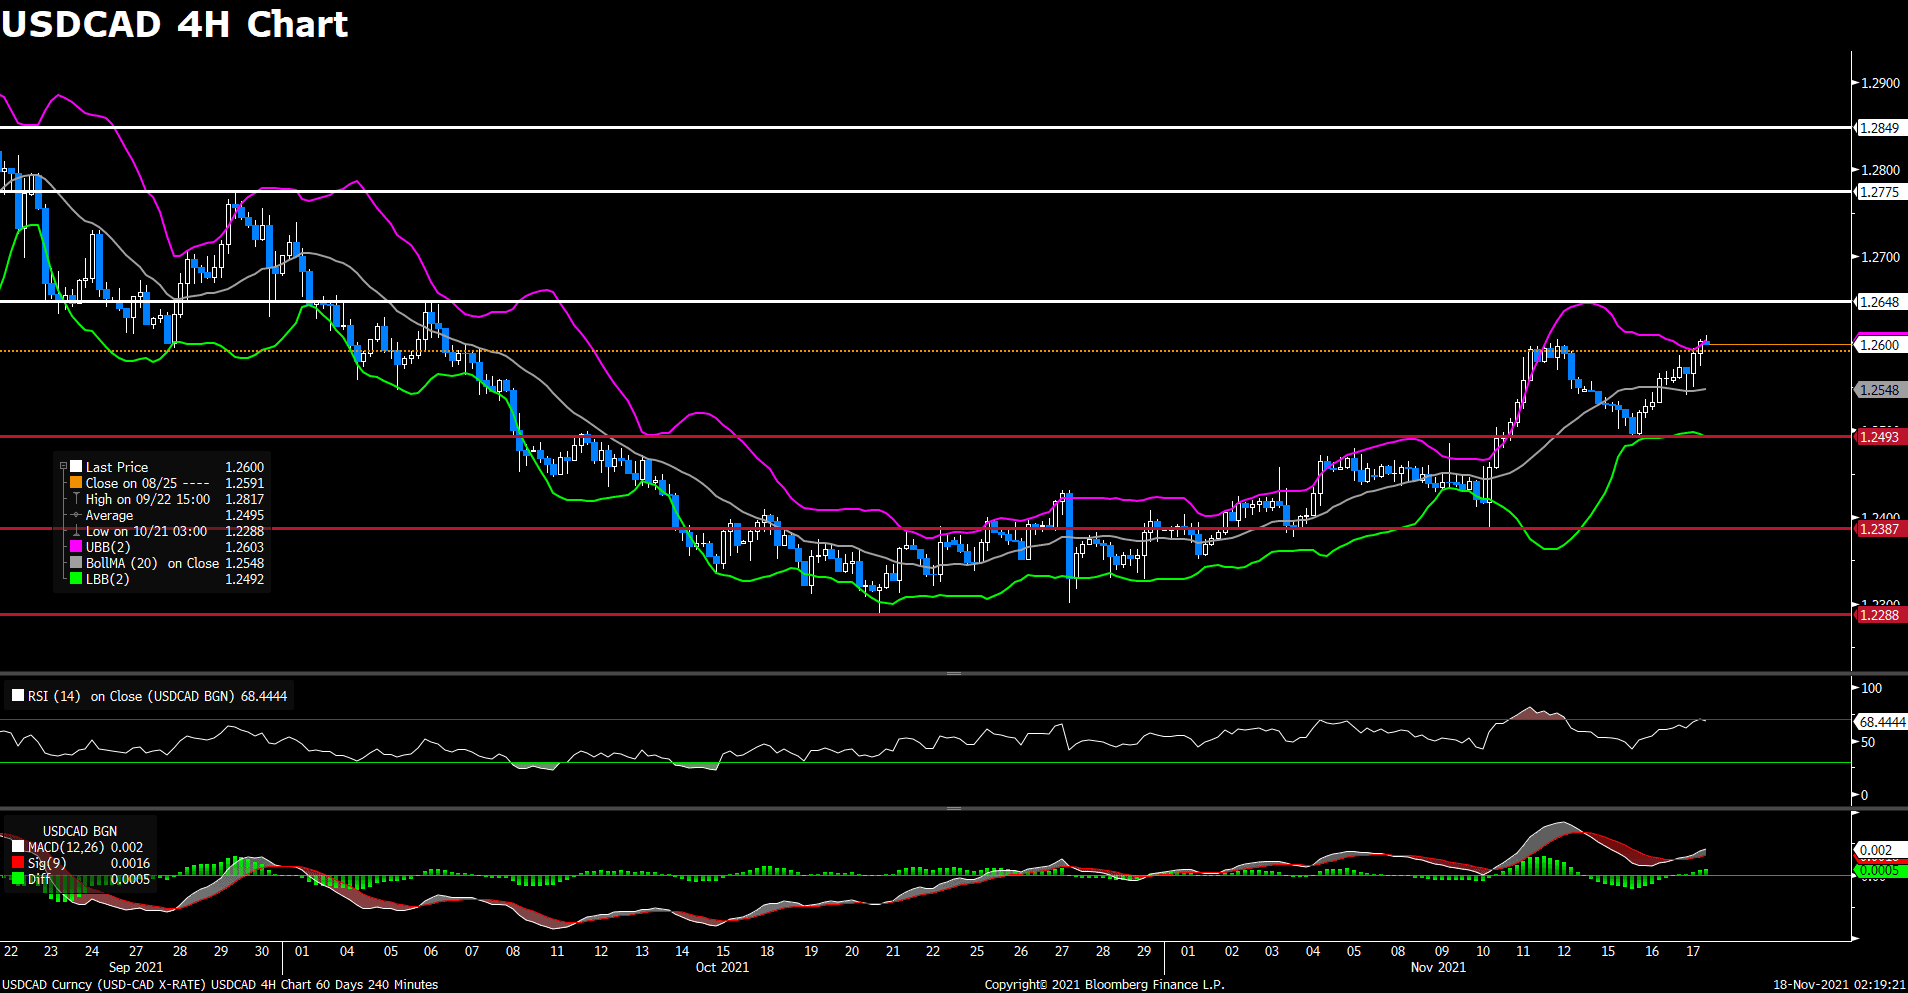
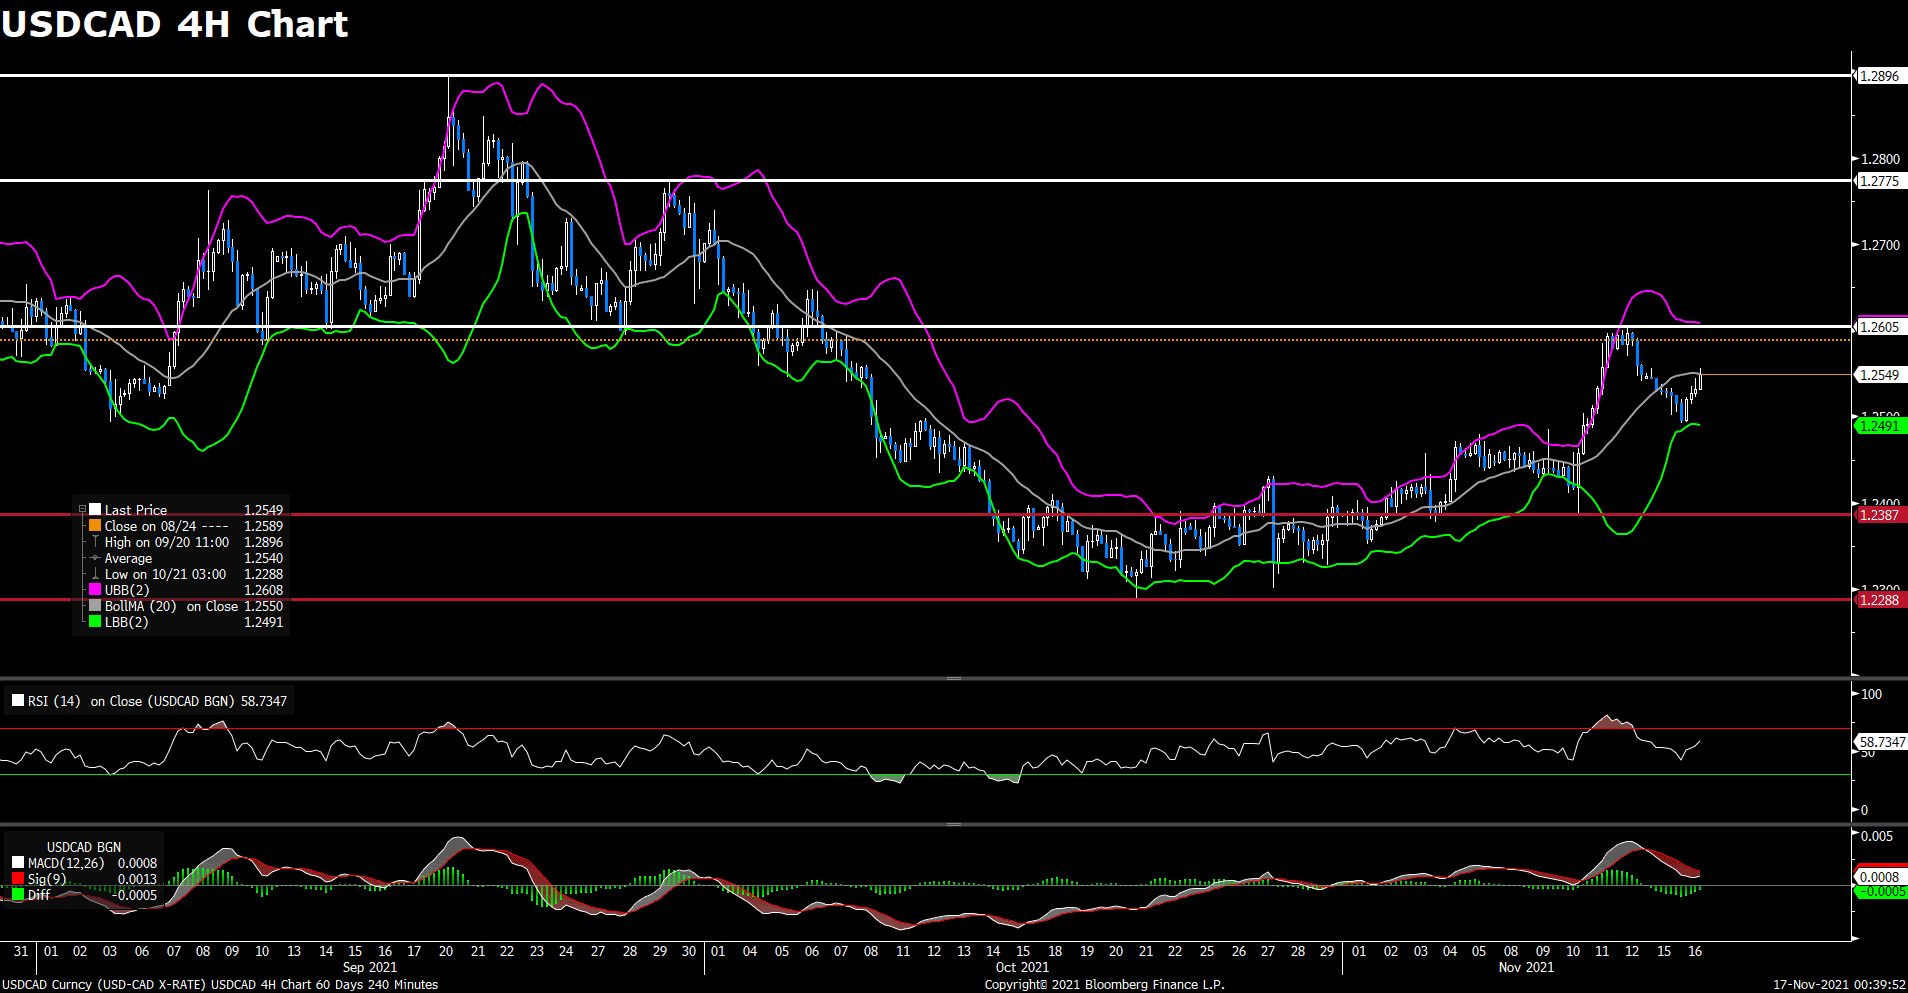
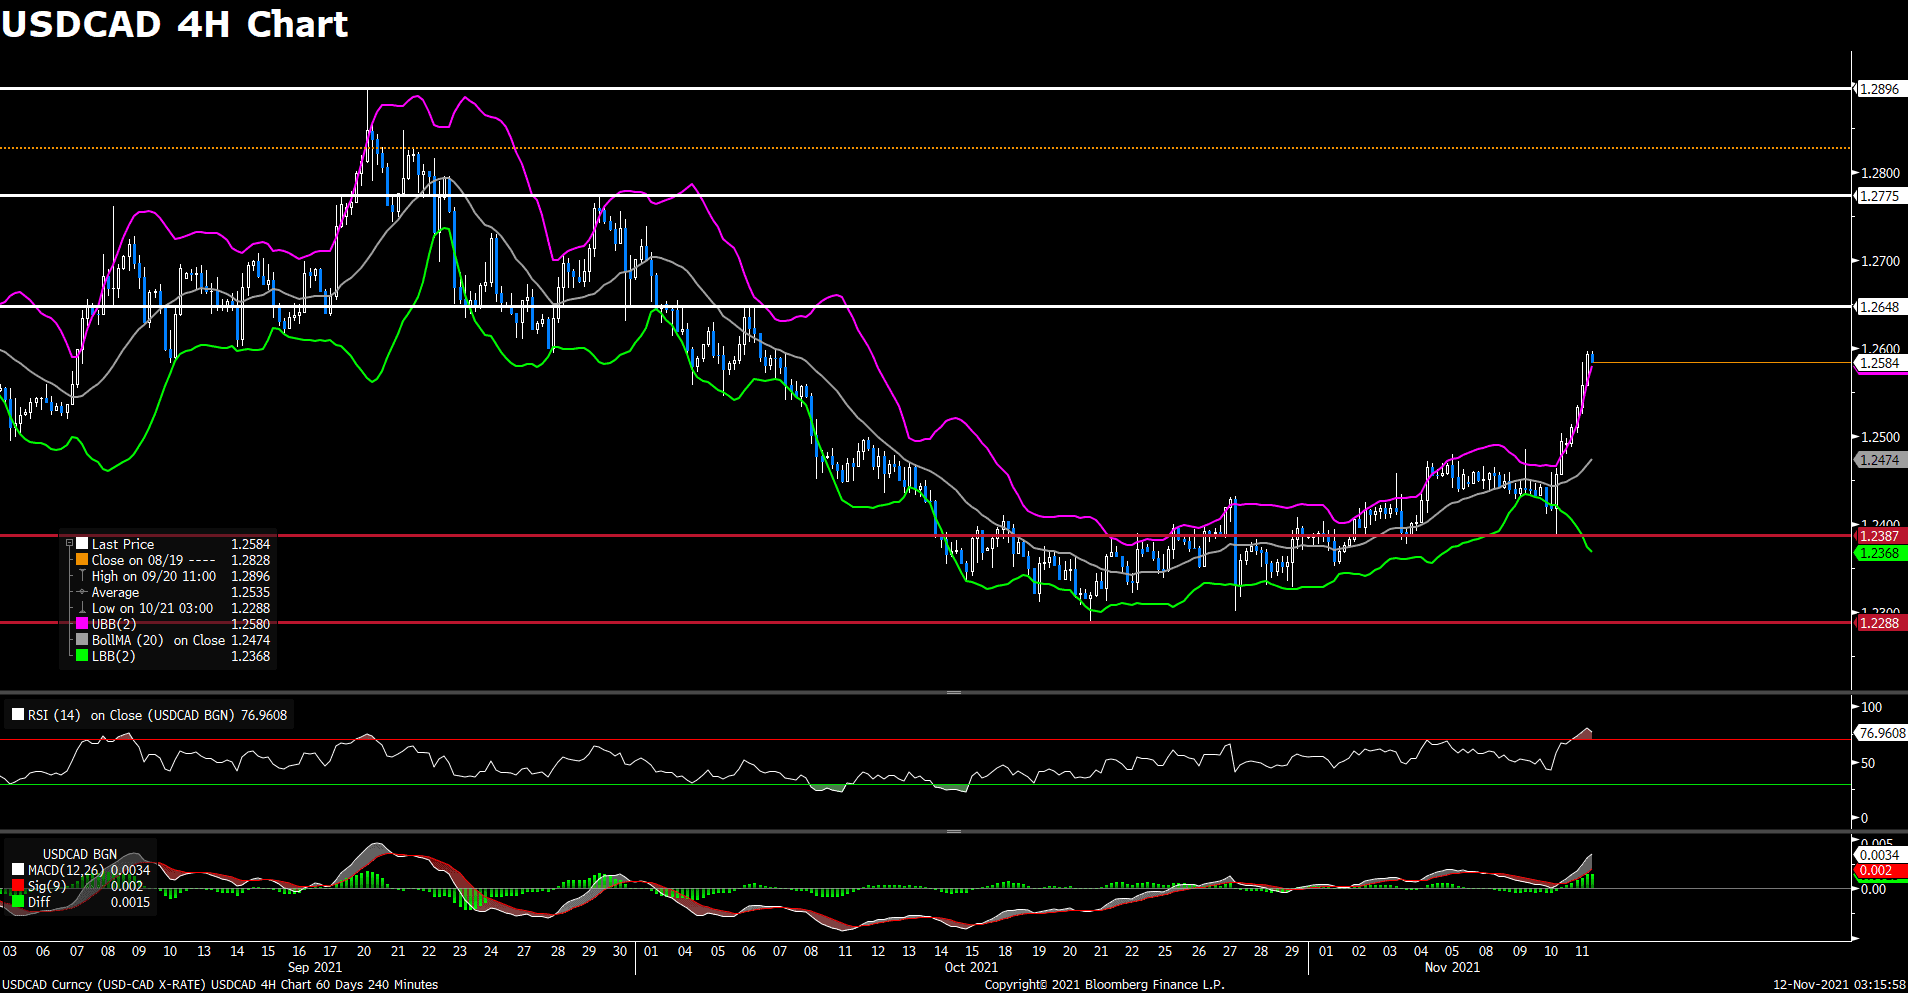
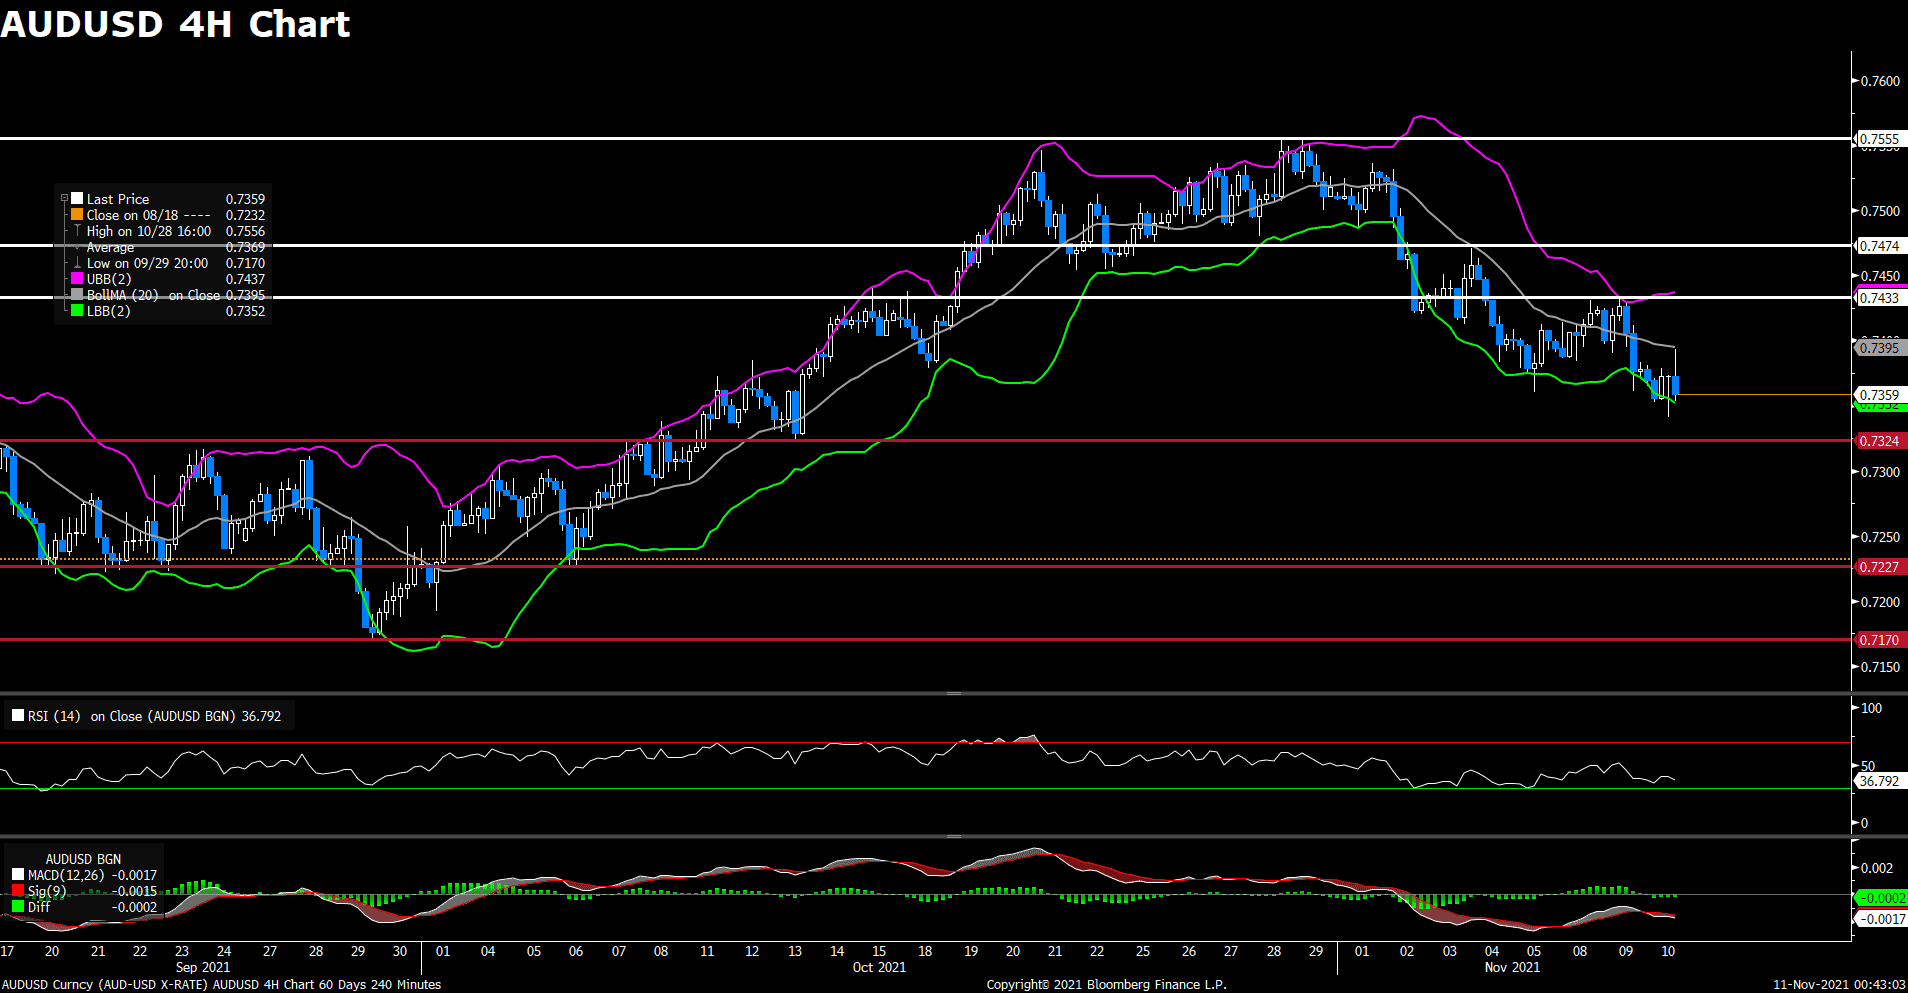
Following previous day’s rebound from 1.250 area, the pair USD/CAD continued to climb further on Wednesday. The pair edged lower and touched a daily low in early European session, but started to see heavy buying entering American trading hours. Now USD/CAD pair is flirting with 1.260 level, currently rising 0.32% on a daily basis. Falling crude oil prices weighed heavily on the commodity-linked loonie and acted as a tailwind for the pair, as WTI dropped to fresh daily lows despite a positive inventory report. The surging oil demand might encourage the Biden administration to release crude oil reserves.
For technical aspect, RSI indicator 71 figures as of writing, suggesting that the pair is in overbought zone, a trend reversal could be possible. Looking at the MACD indicator, the MACD is now sitting above the signal line, which also indicates a possible upward trend for the pair. As for the Bollinger Bands, the price is moving out of the upper band, therefore a strong trend continuation could be expected. In conclusion, we think market will be bullish since the pair has rose above the previous 1.2605 support..
Resistance: 1.2648, 1.2775, 1.2849
Support: 1.2493, 1.2387, 1.2288
Economic Data
|
Currency
|
Data
|
Time (GMT + 8)
|
Forecast
|
|
USD
|
Initial Jobless Claims
|
21:30
|
260K
|
|
USD
|
Philadelphia Fed Manufacturing Index (Nov)
|
21:30
|
24.0
|
|
|
|
|
|
|
|
|
|
|
|
|
|
|
|
|
|
|
|
|
|
|
|
|
|
|
|
|
|
|
|
|
|
|
|
|
|
|
|
|
|
|
|
|