Market Focus
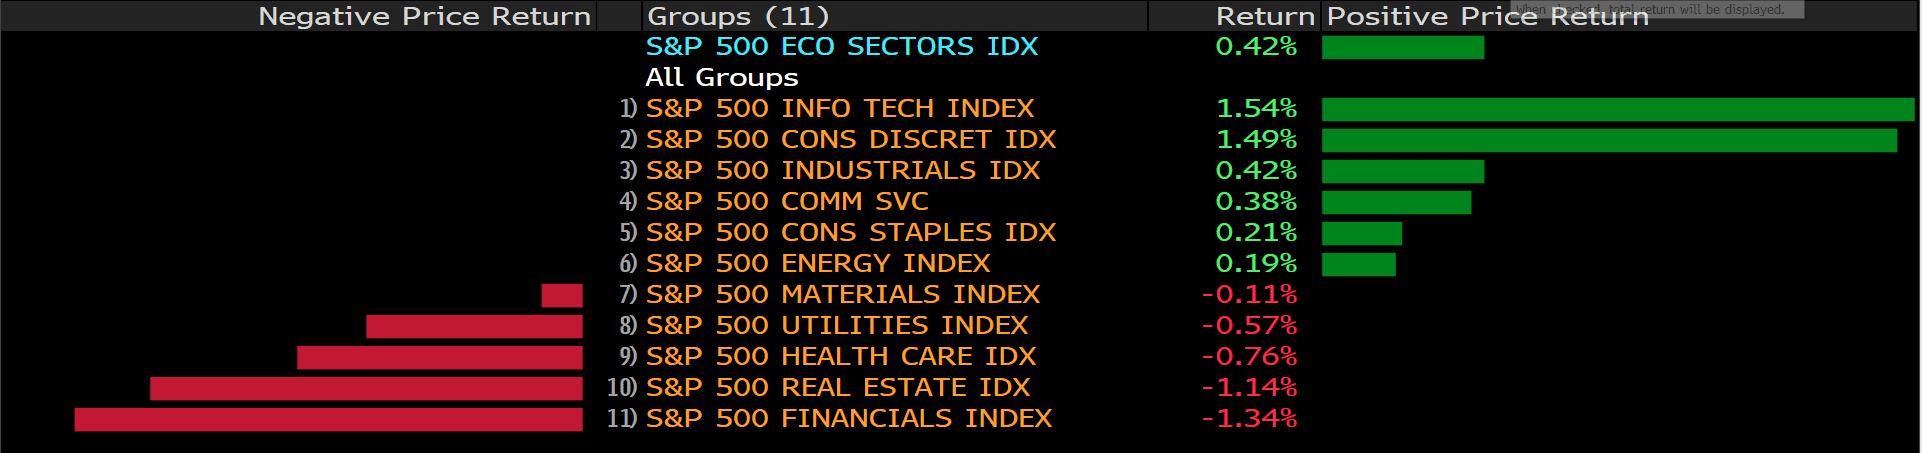
US stocks have continued to fall in the past trading day and have been weak since the market opened. After the US consumer price inflation report in October was much hotter than expected, inflation concerns led to massive sell-offs. The data shows that the overall CPI rose 6.2% YoY and 0.9% MoM, much higher than expected, while the core CPI rose 4.6% YoY and 0.6% MoM, which was also much higher than expected. The YoY growth rate of CPI was the highest since 1990, while the YoY growth rate of core CPI was the highest since the early 1990s. The worst inflation since 1990 has forced investors to believe more that the Fed will have to raise short-term interest rates faster from historical lows. This, in turn, made U.S. Treasury yields their biggest increase in months. Higher yields tend to hurt high-growth stocks, with the S&P 500, Dow Jones Industrial Average and Nasdaq all falling.
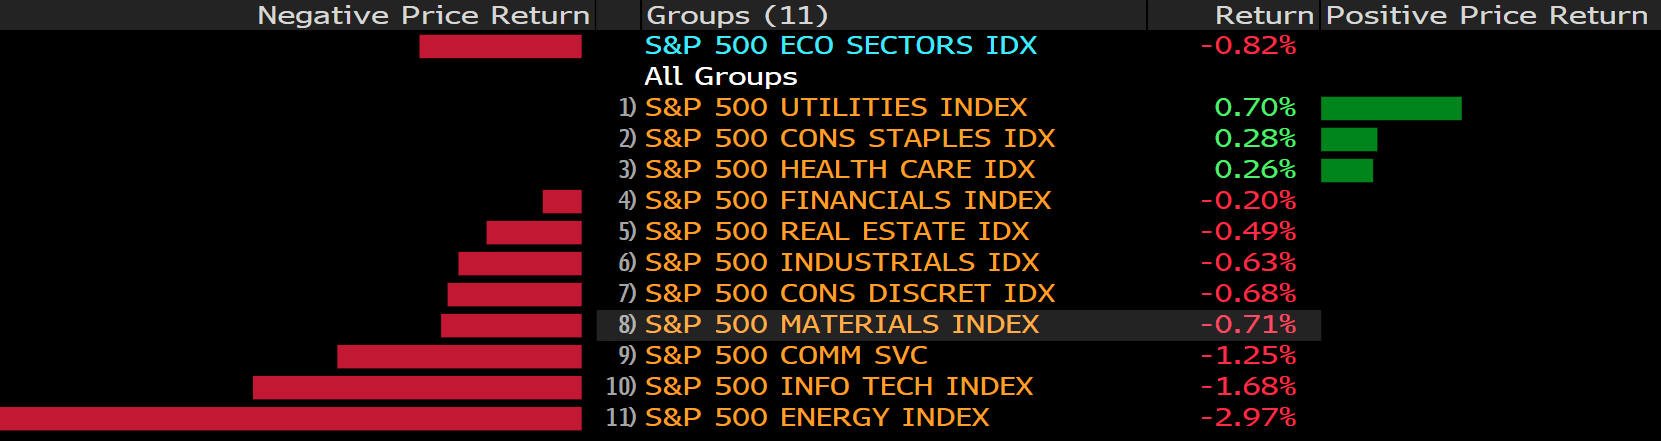
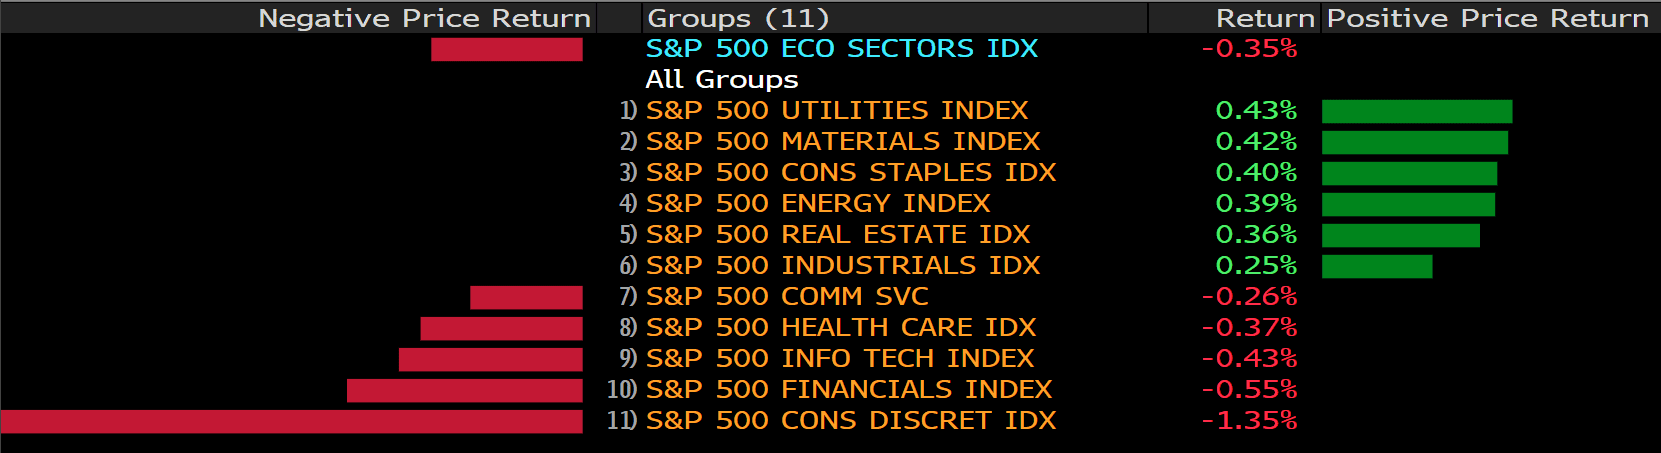
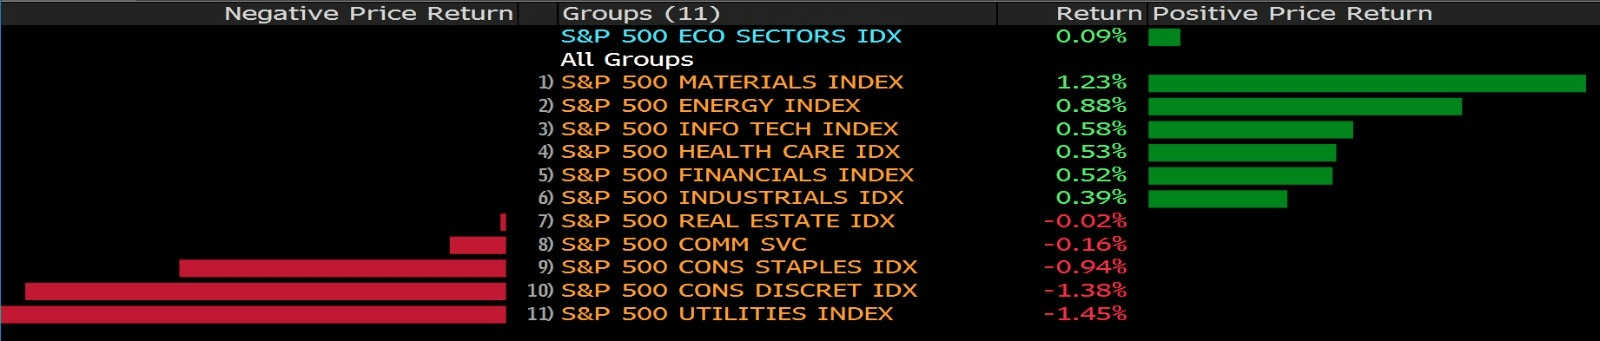
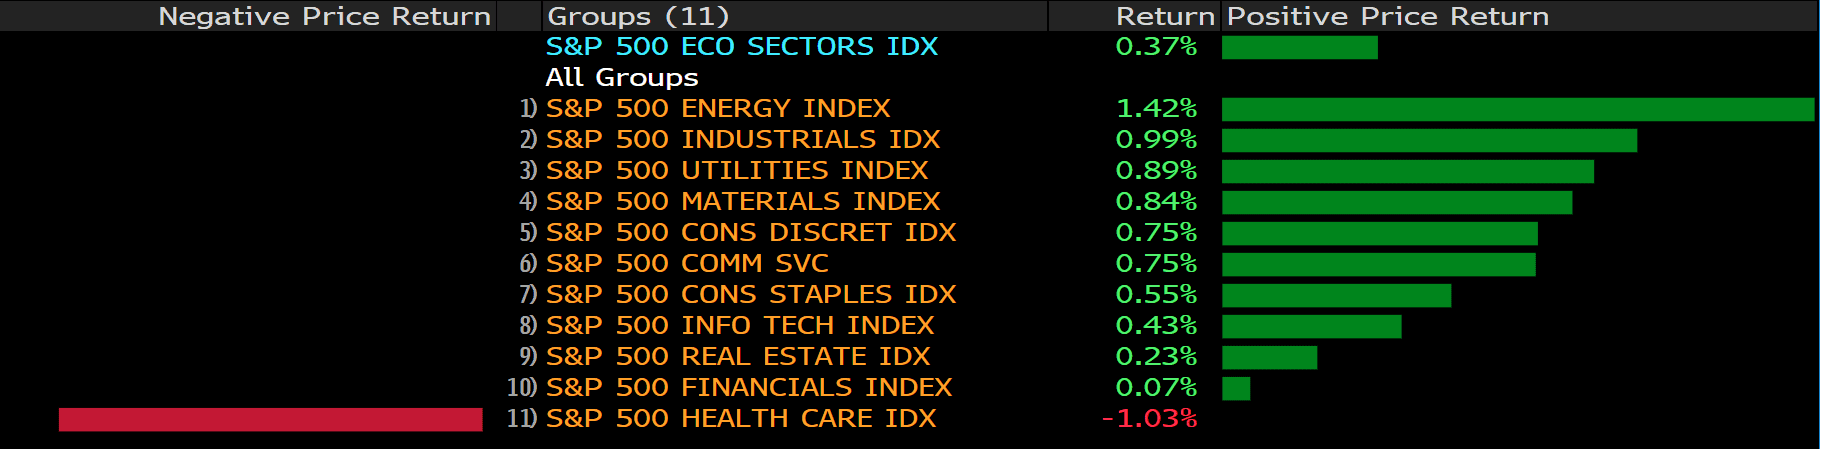
After the market closed, the S&P 500 fell 0.8% to 4,646.71, the Dow Jones Industrial Average fell 0.7% to 36,079.94 and the Nasdaq fell 1.7% to 15,622.71. Energy stocks were one of the sectors with the largest decline in the S&P 500. Coterra Energy, Occidental Petroleum, Hess, Diamondback Energy and Halliburton all fell about 5%.
Main Pairs Movement:
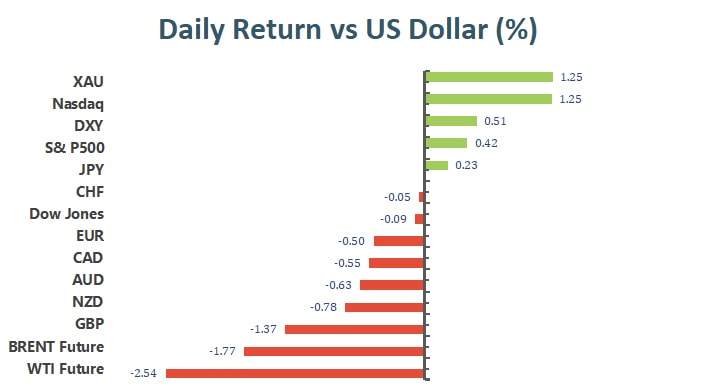
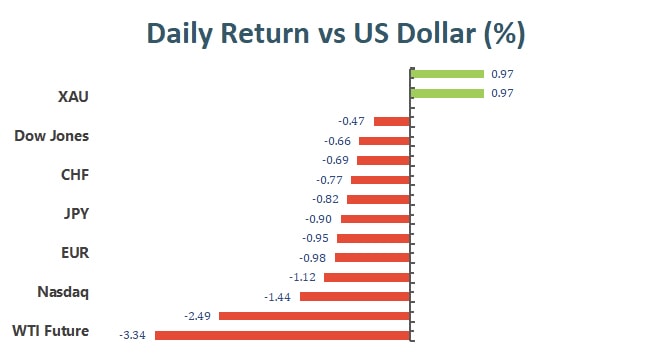
The consumer price index surged to its highest level in 30 years in October, rising by 6.2% YoY, leading to soaring yields and falling stock markets, reflecting increased concerns about further tightening policies.
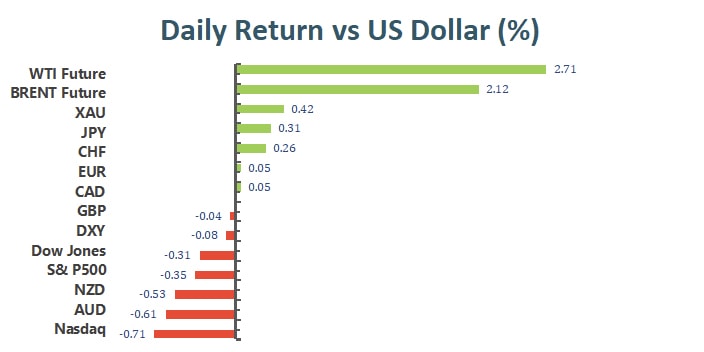
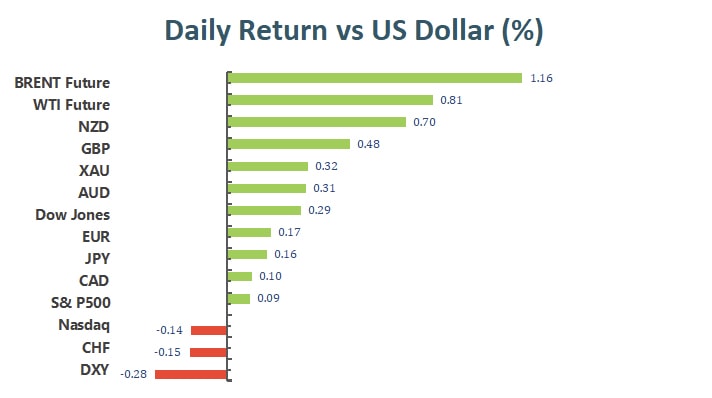
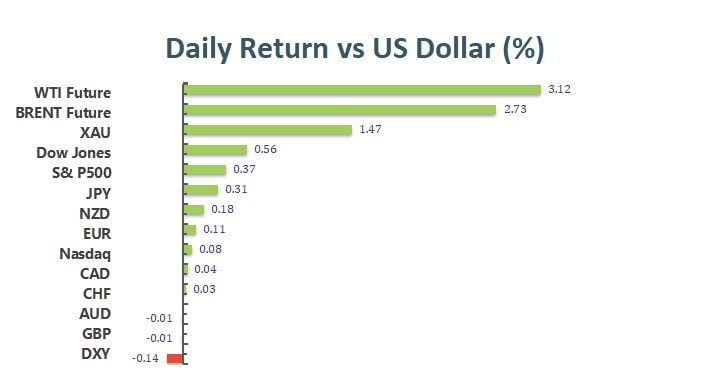
In such a state of high inflation, U.S. Treasury bond yields have soared, the U.S. dollar has risen, and gold has skyrocketed because of risk aversion. Hence, the market expects that the Fed will need to accelerate its bond scale reduction in the face of long-term inflation and currently market participants expect the Fed to raise interest rates in June 2022.
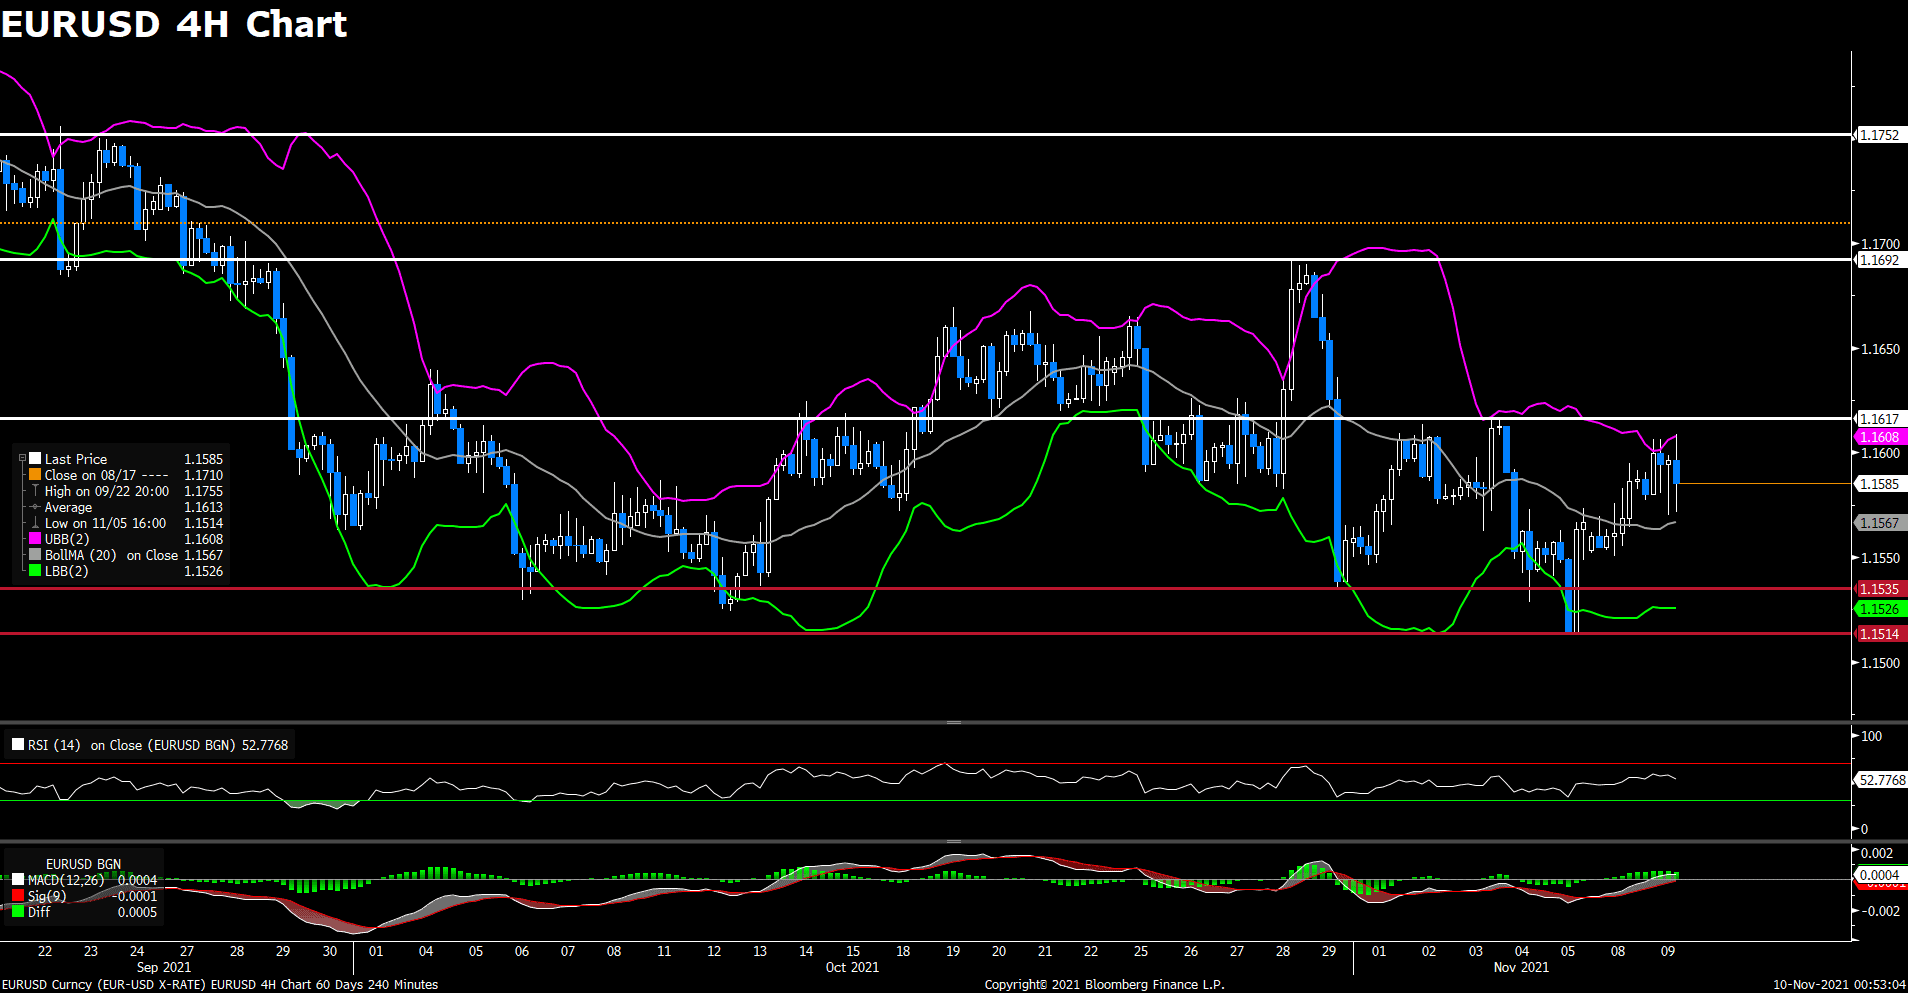
As the soaring of the greenback, most of the rival currencies fell against the U.S. dollar. At the time of writing, the EUR/USD settled below 1.1500, its lowest since July 2020, and stay around the level of 1.4864, and the GPB/USD near the level of 1.34178, which also below its support level.
XAU/USD hit a recent high of $1,868.61 and then retreated. It is currently at $1,852.33 per ounce, which is still on an upward trend.
Technical Analysis:
GBPUSD (4- Hour Chart)
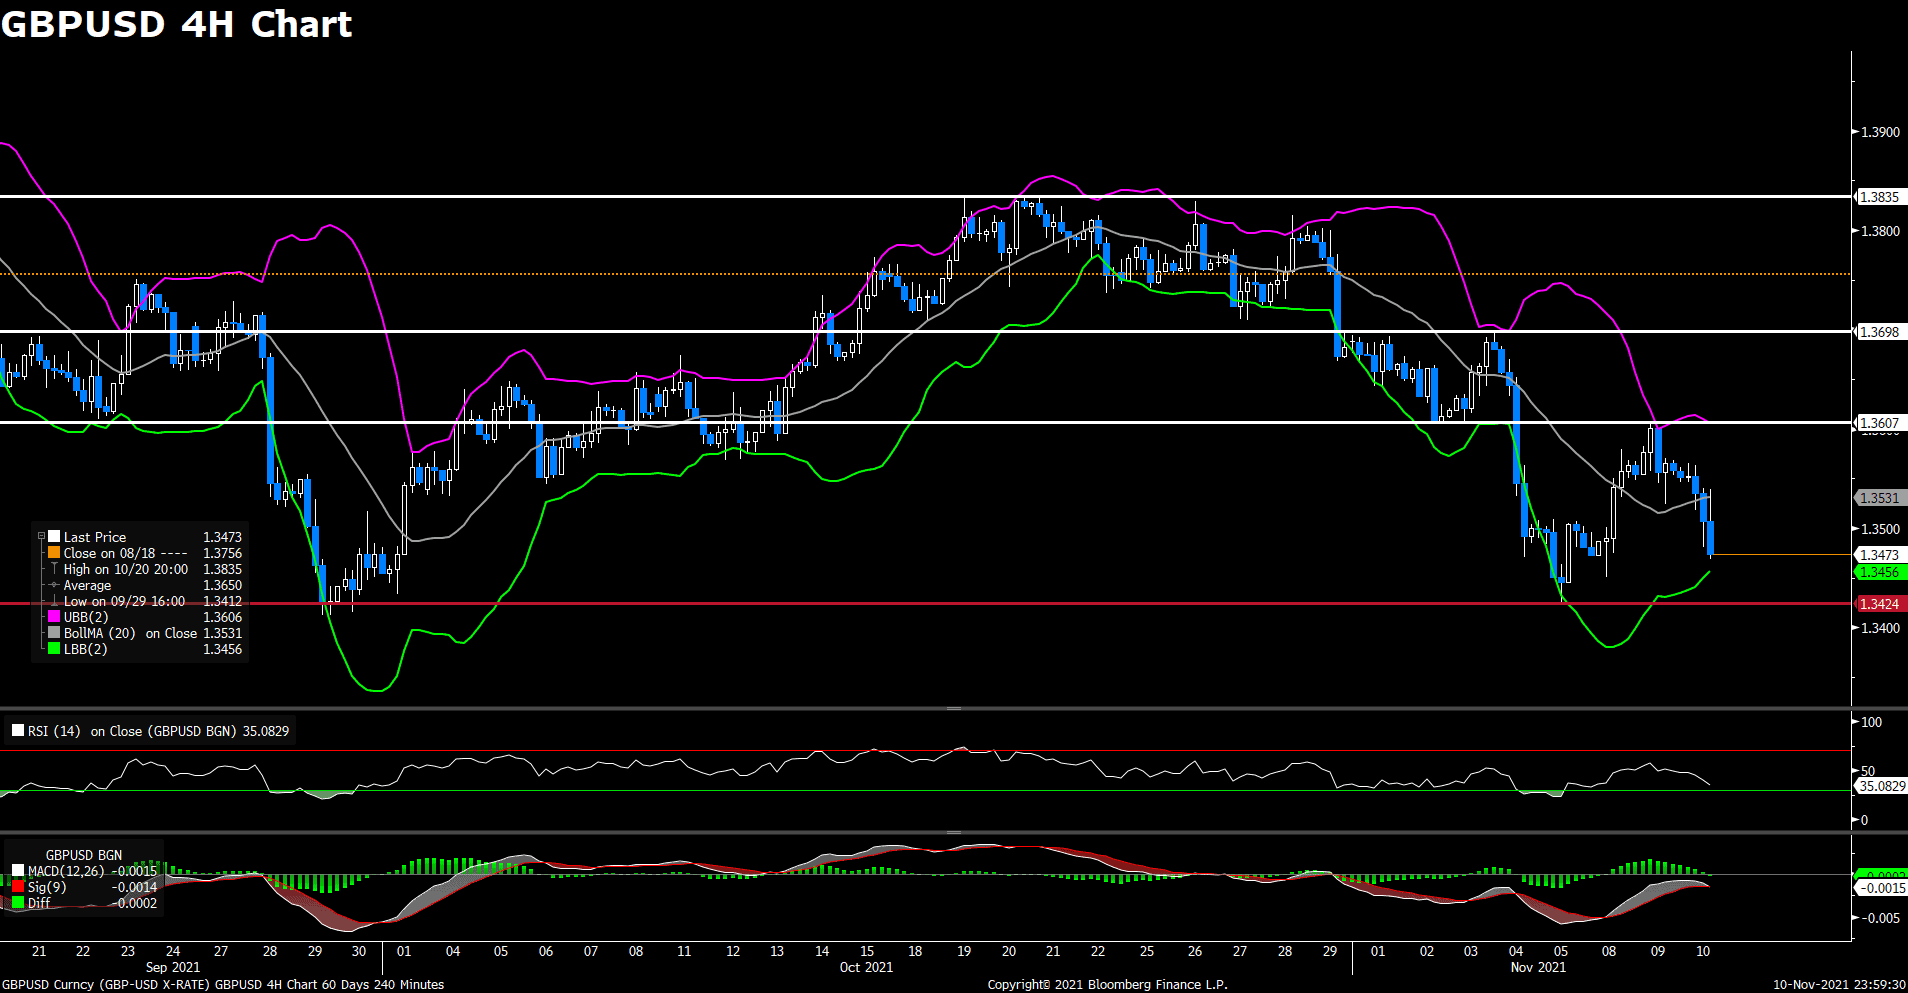
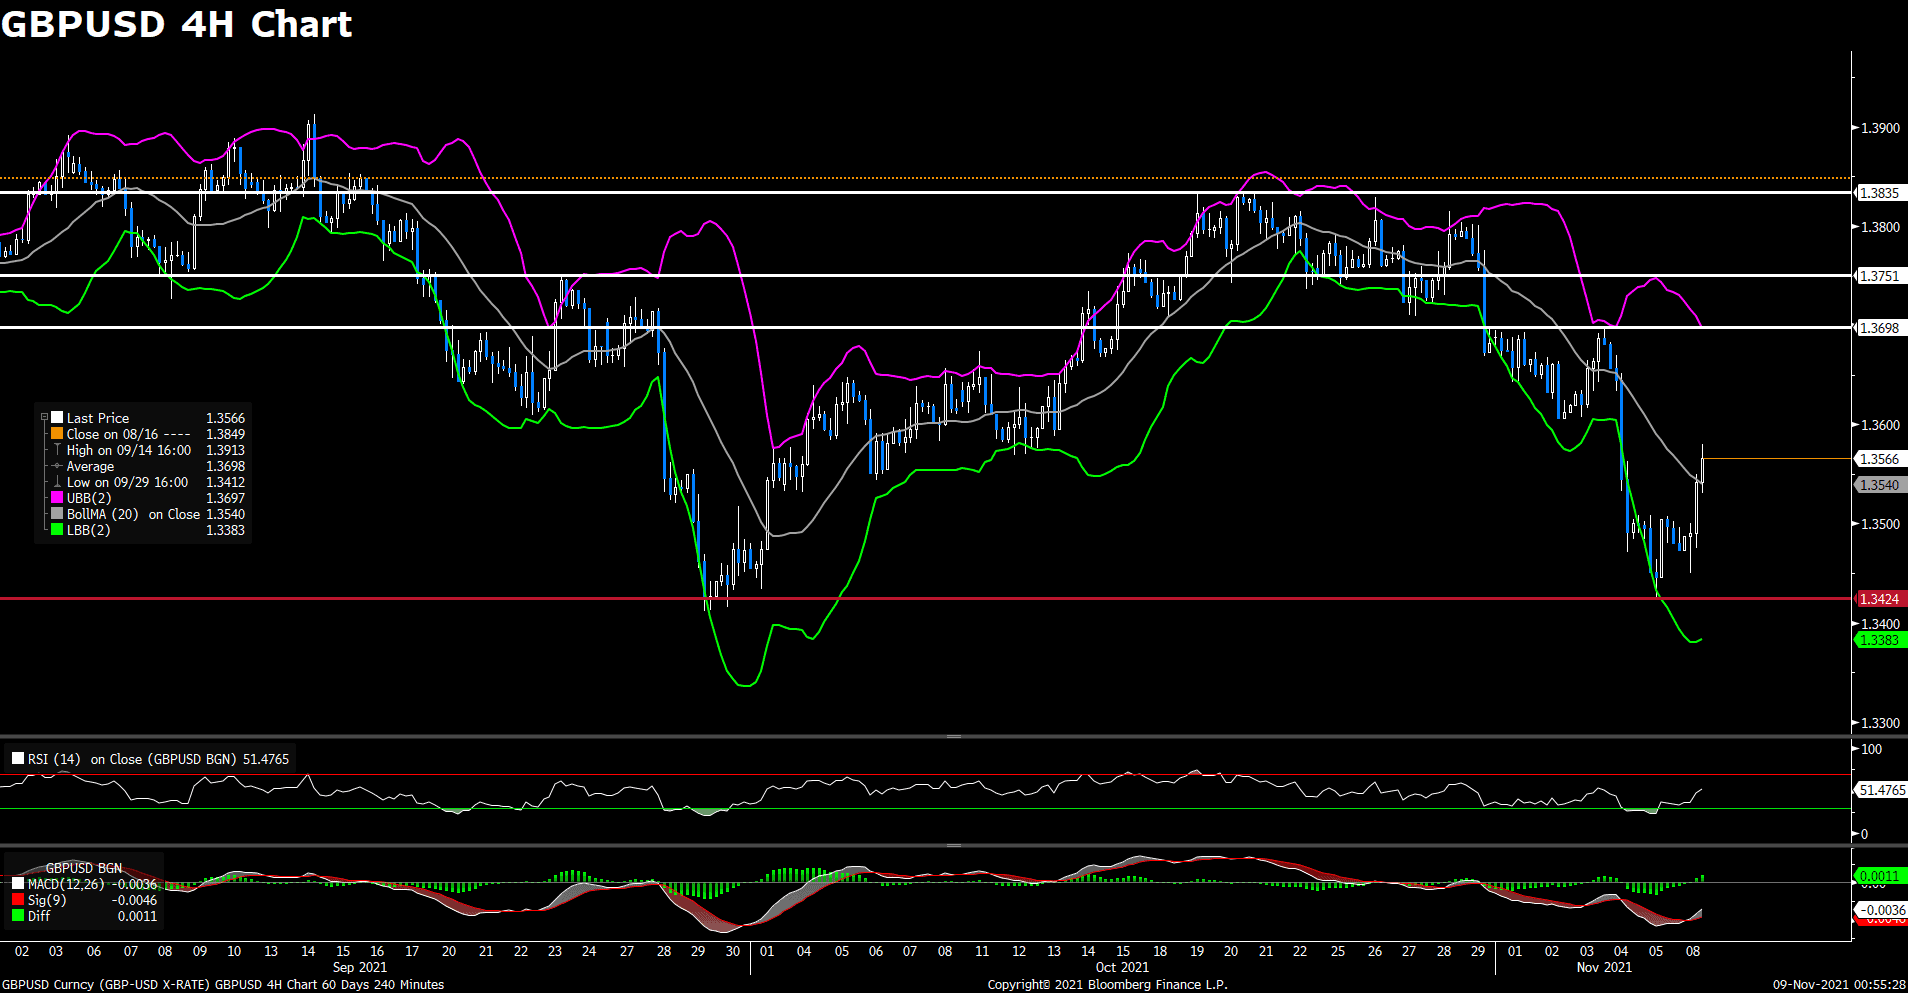
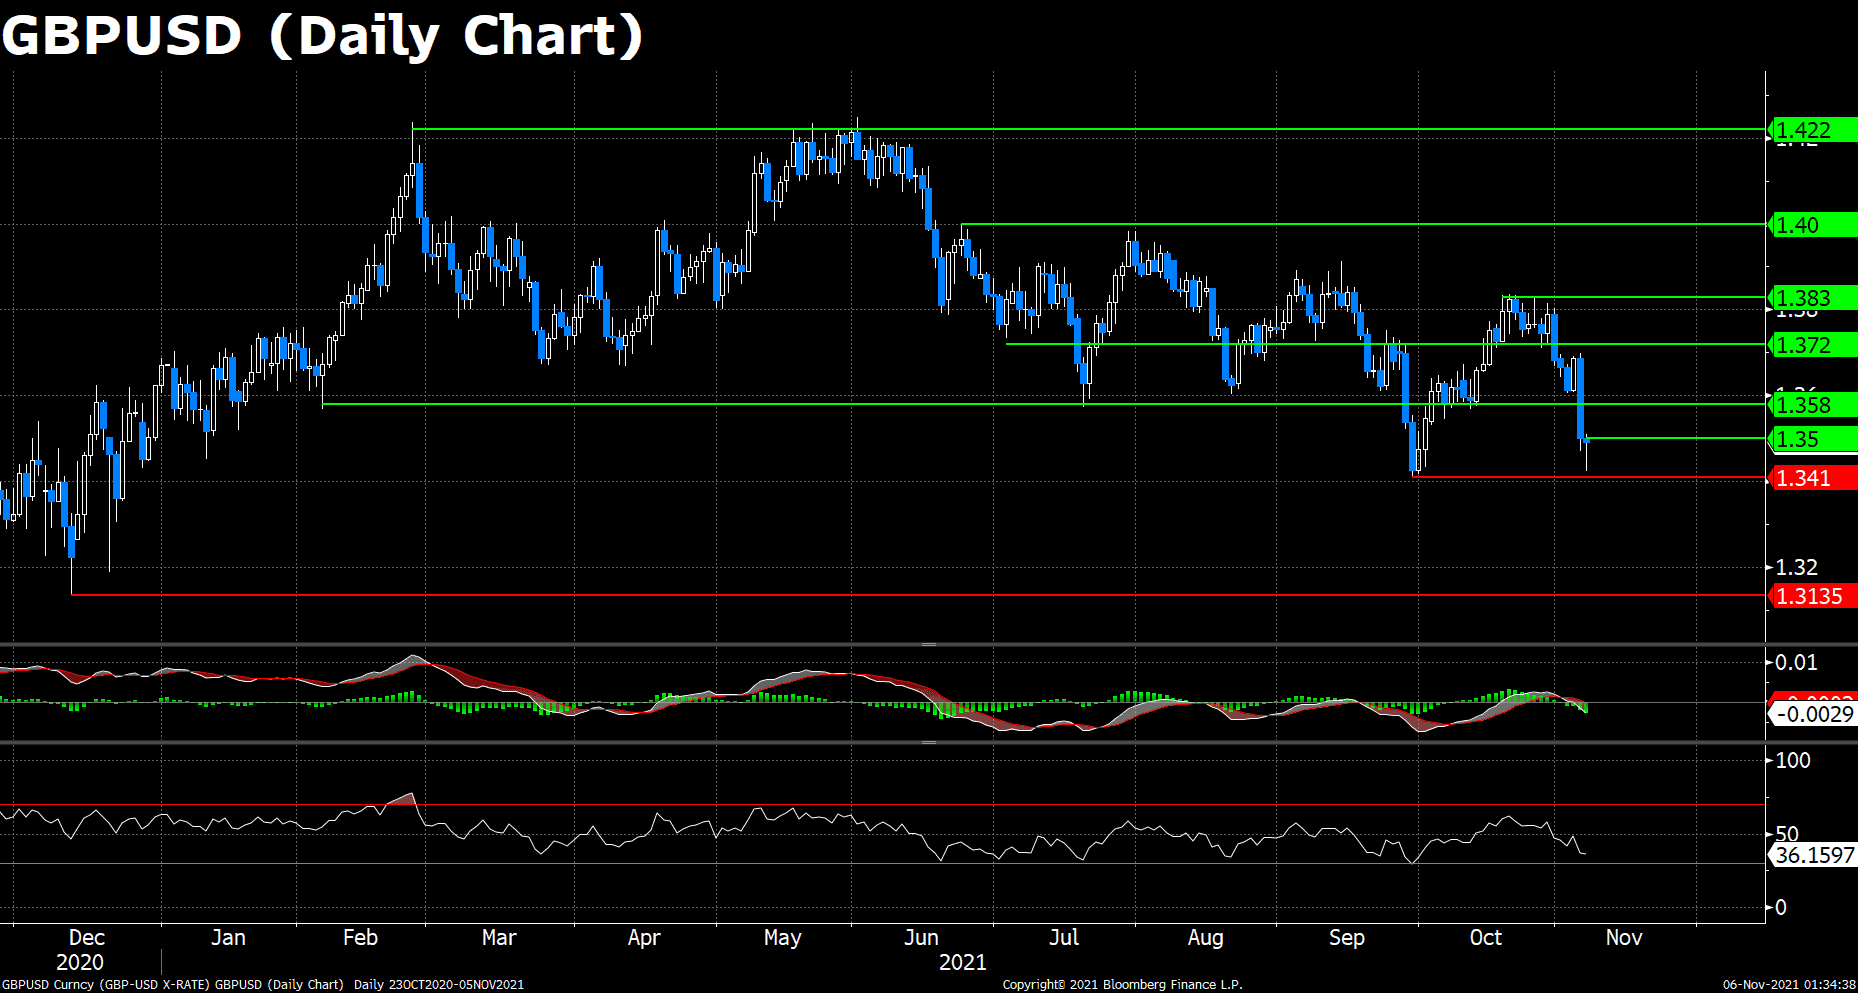
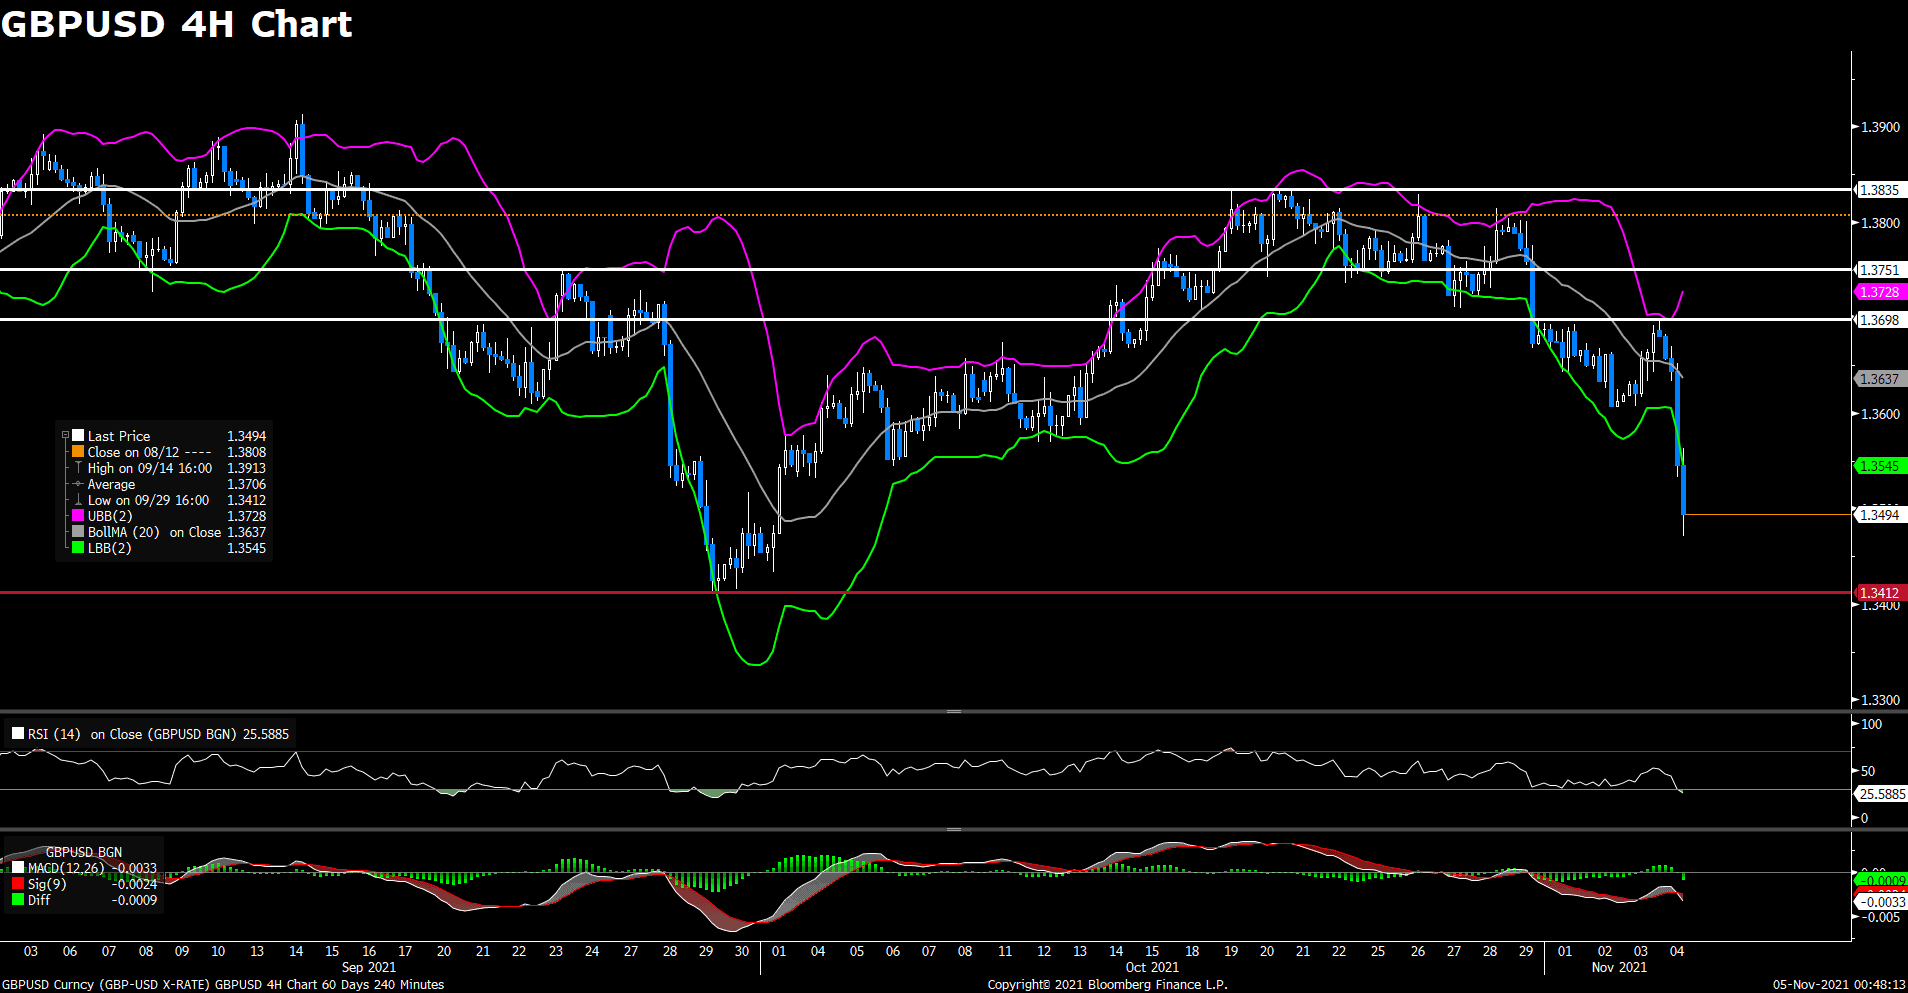
The pair GBP/USD declined on Wednesday, surrounding by heavy selling amid stronger US dollar across the board. The pair was trading in consolidation in early Asian session, but bear started to take over during European session. The US CPI data showed that the headline CPI rose 0.9% MoM in October and the yearly rate accelerated to the most since 1990 at 6.2%. Therefore, the hotter-than-expected US CPI underpinned the greenback as it reinforced speculations about an early policy tightening by the Fed. In the UK, dovish BoE and Brexit concerns keep weighing on the GBP/USD pair.
For technical aspect, RSI indicator 34 figures as of writing, suggesting bear movement ahead. For the MACD indicator, a death cross showed on the histogram, indicating a possible downward trend for the pair. If we take a look at the Bollinger Bands, the price crossed above the moving average after touching the higher band, therefore the lower band becomes the loss target. In conclusion, we think market will be bearish as the pair is heading to test the 1.3424 support. If the support line doesn’t hold, additional losses could be expected.
Resistance: 1.3607, 1.3698, 1.3835
Support: 1.3424
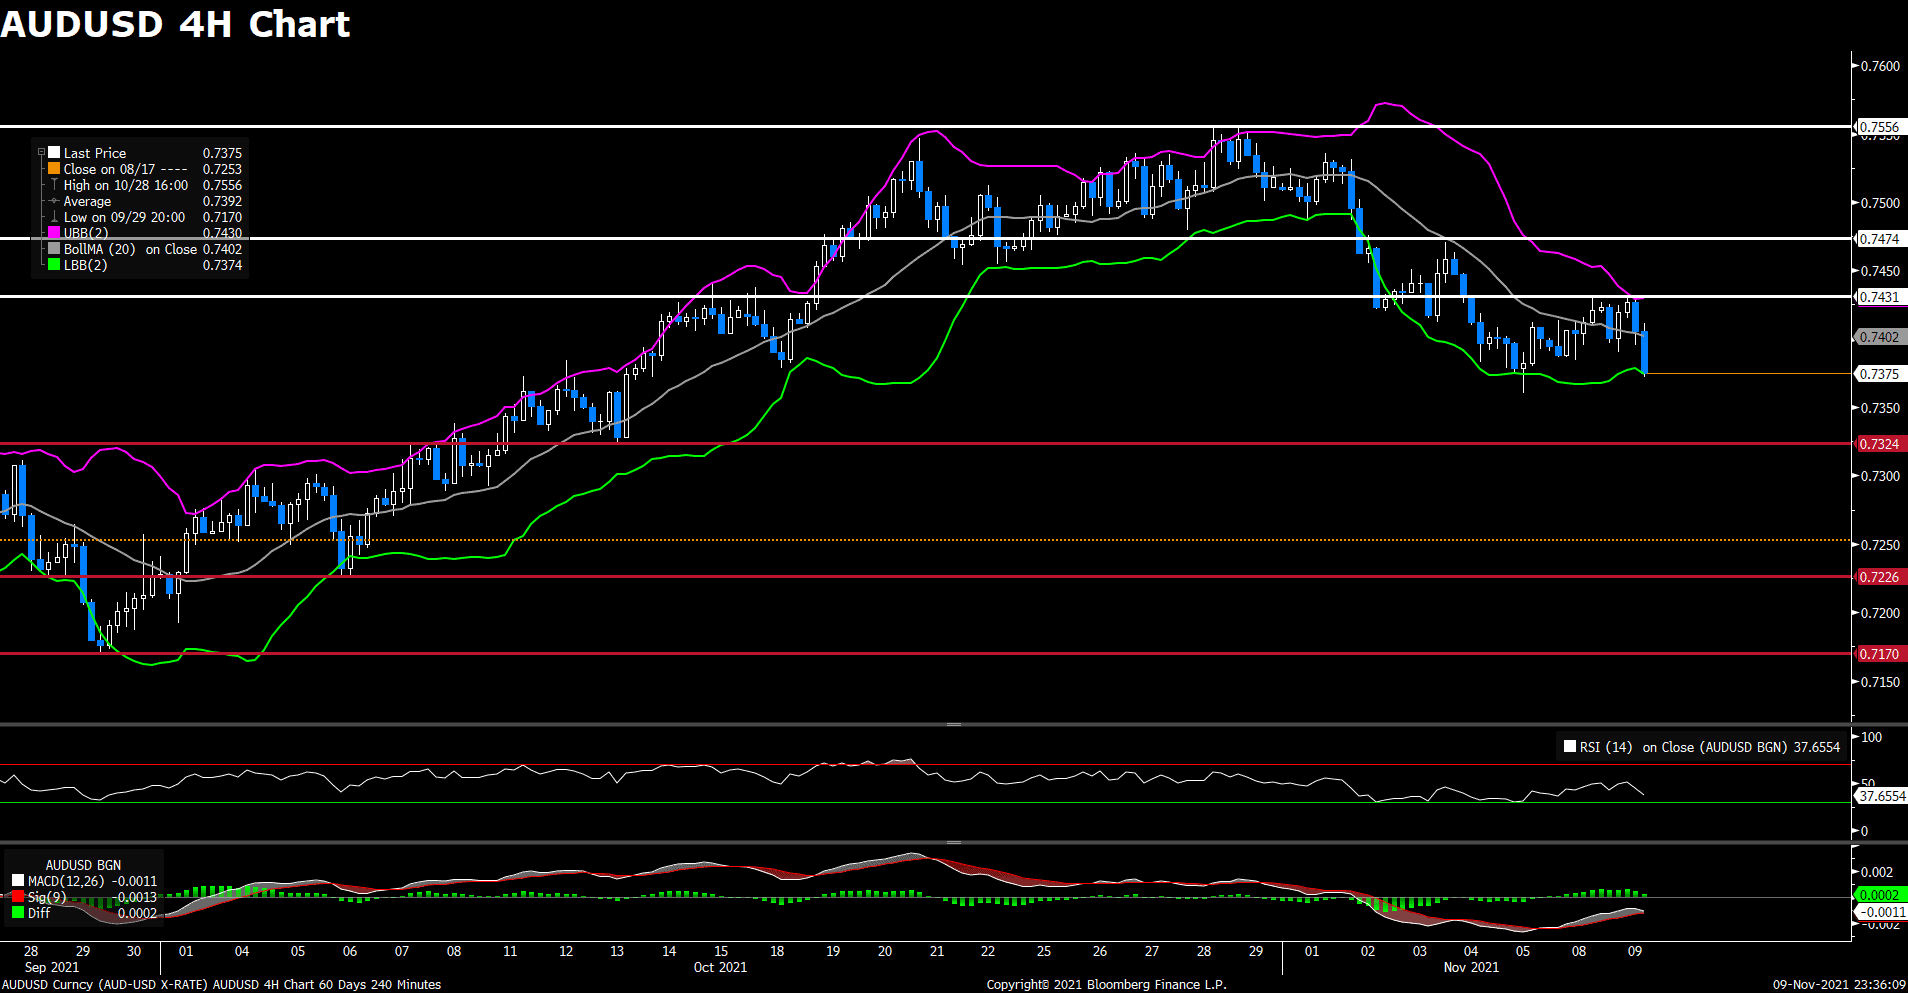
AUDUSD (4- Hour Chart)
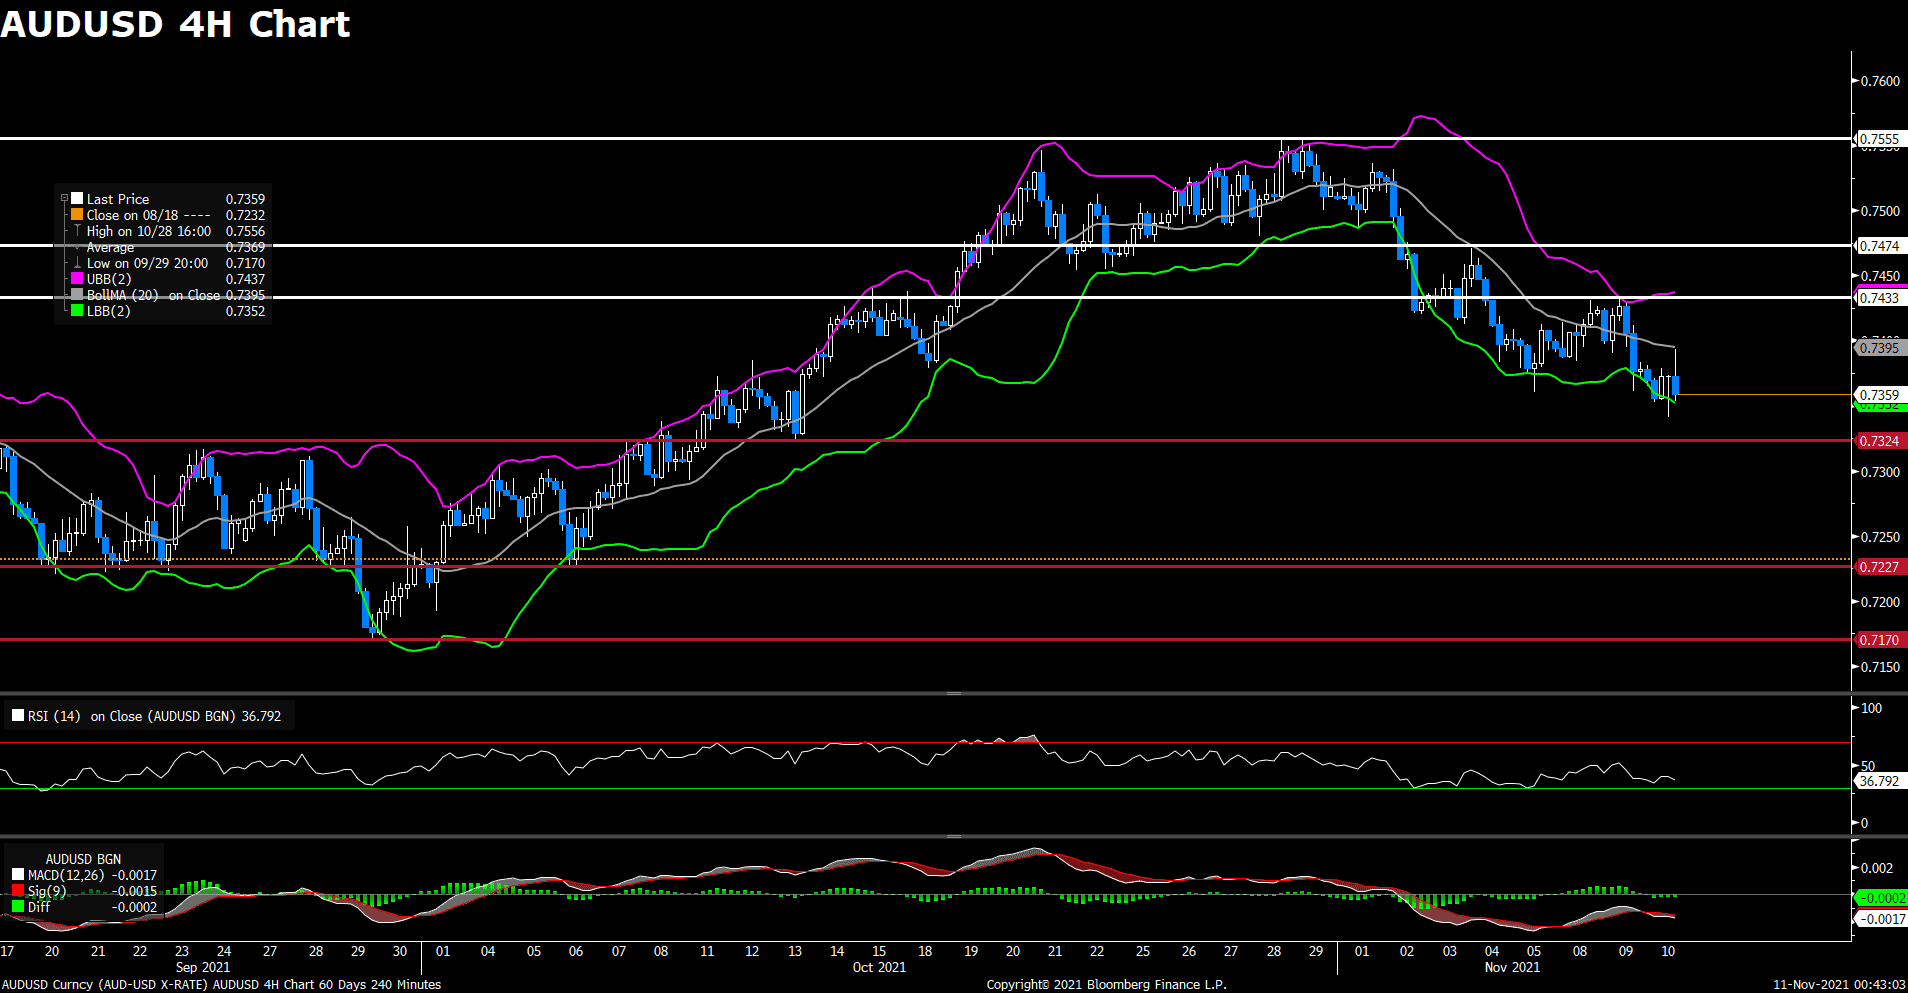
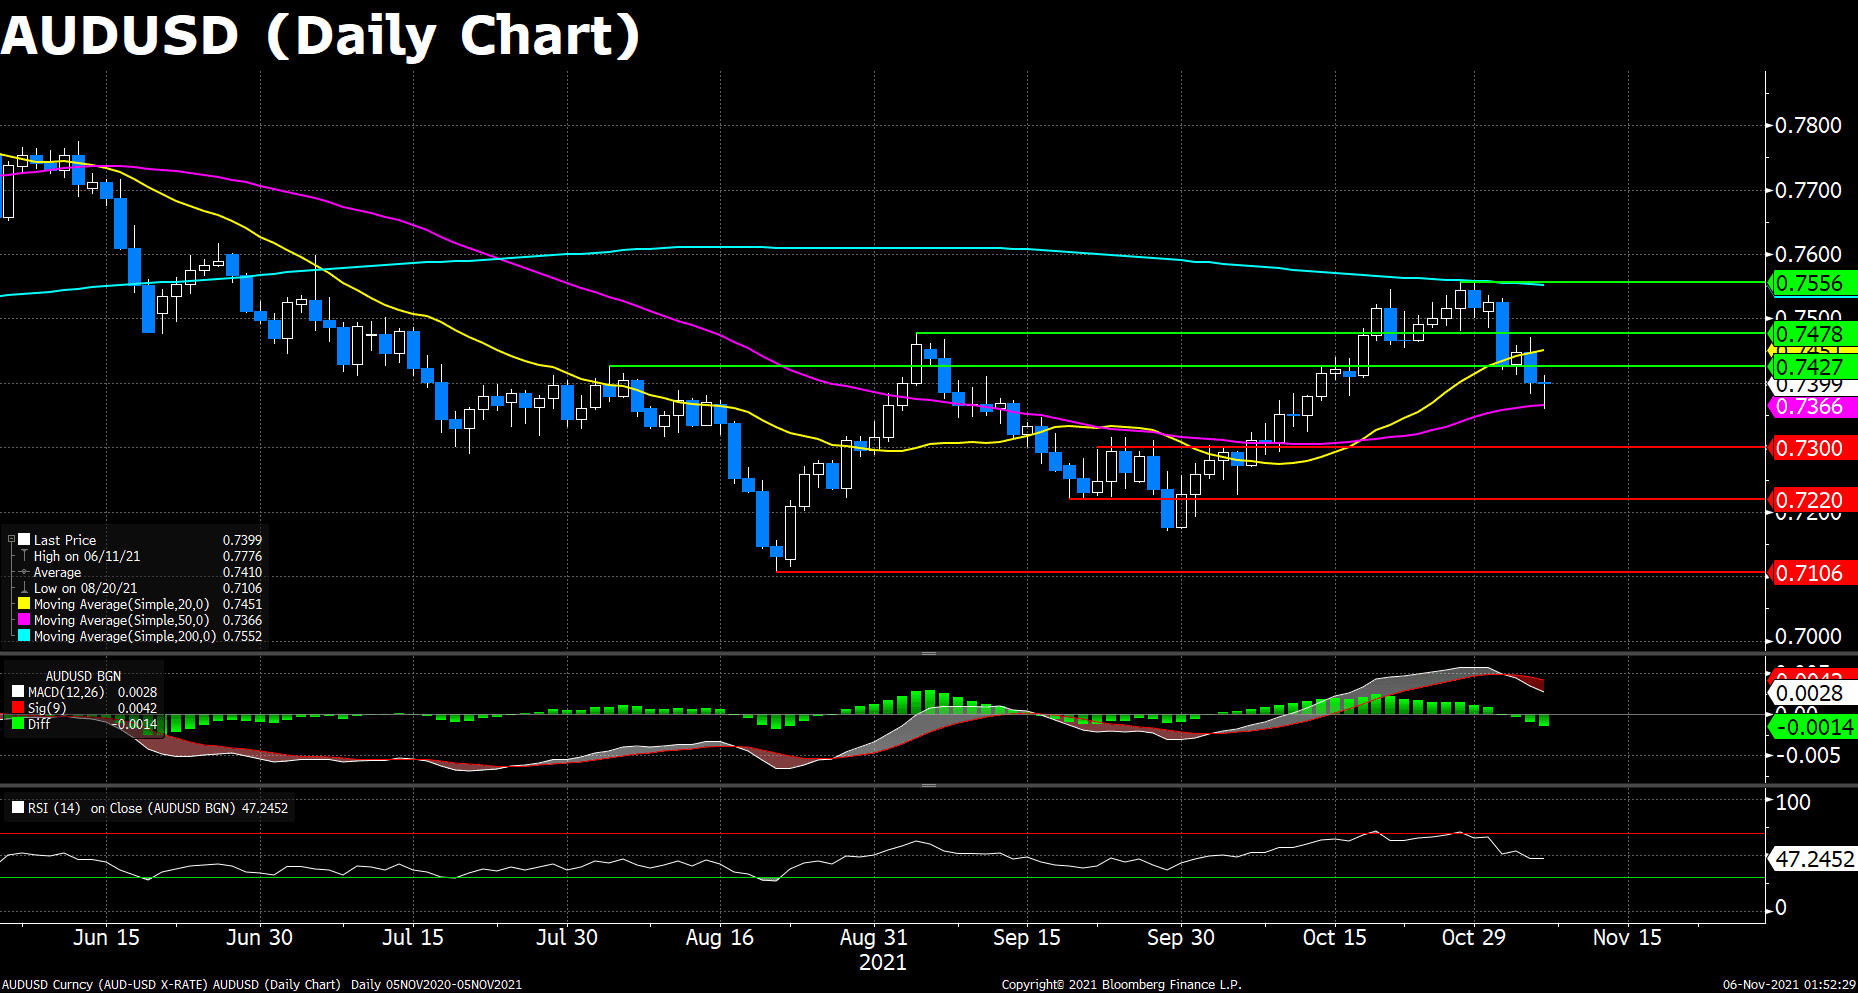
Following previous day’s heavy losses, the pair AUD/USD stay in the negative territory for the second day on Wednesday, currently losing 0.18% on a daily basis. The pair witnessed fresh buying after the releasing of the US CPI data, but then quickly reversed its intraday gains and dropped to monthly low. The hotter-than-expected US consumer report underpinned the US dollar and put some selling pressure on the pair, as the headline CPI rose 0.9% in October, which is the largest advance in four month. The data added to concerns about high inflation and acted as a tailwind for the US Treasury bond yields. Investors now await the release of the Australian jobs report tomorrow.
For technical aspect, RSI indicator 37 figures as of writing, suggesting bear movement ahead . As for the MACD indicator, The MACD is now sitting below the signal line, which also indicates a possible downward trend for the pair. Looking at the Bollinger Bands, the price moves alongside the lower band, therefore the bearish momentum is likely to persist. In conclusion, we think market will be bearish as the pair failed to break the 0.7433 resistance and now heading to test the 0.7324 support.
Resistance: 0.7433, 0.7474, 0.7555
Support: 0.7324, 0.7227, 0.7170
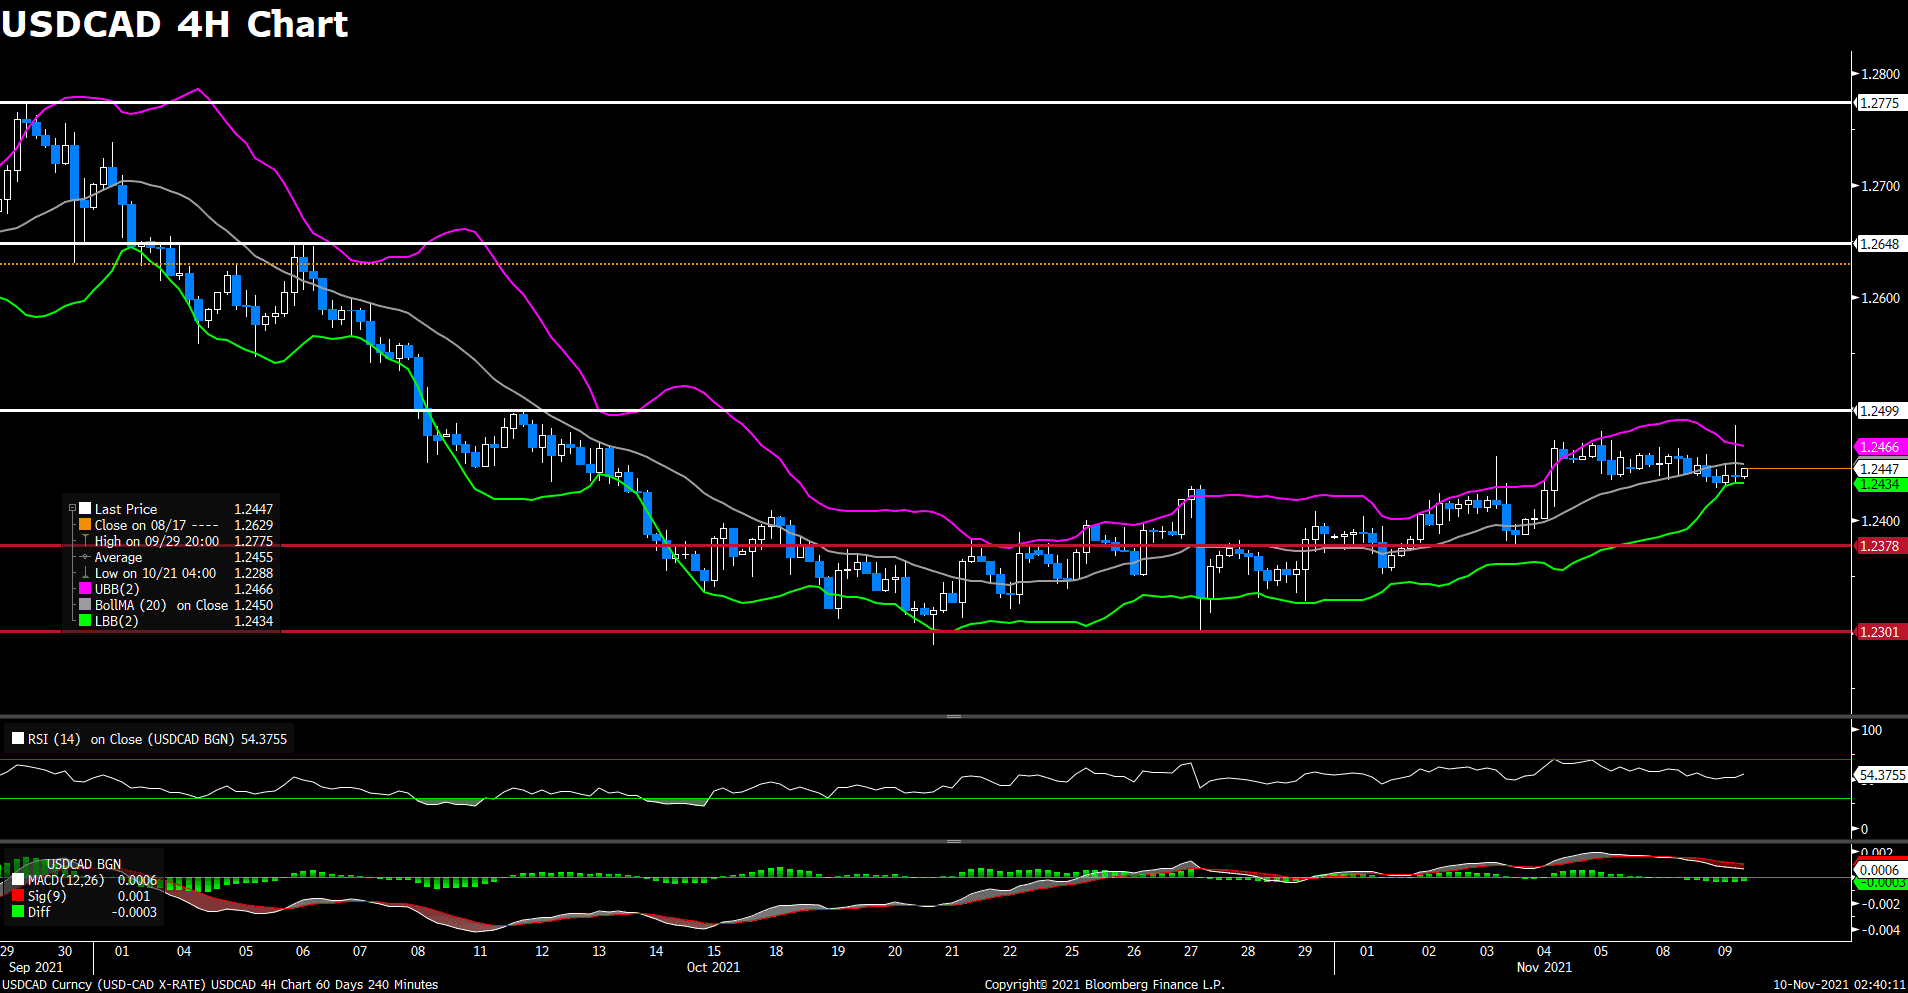
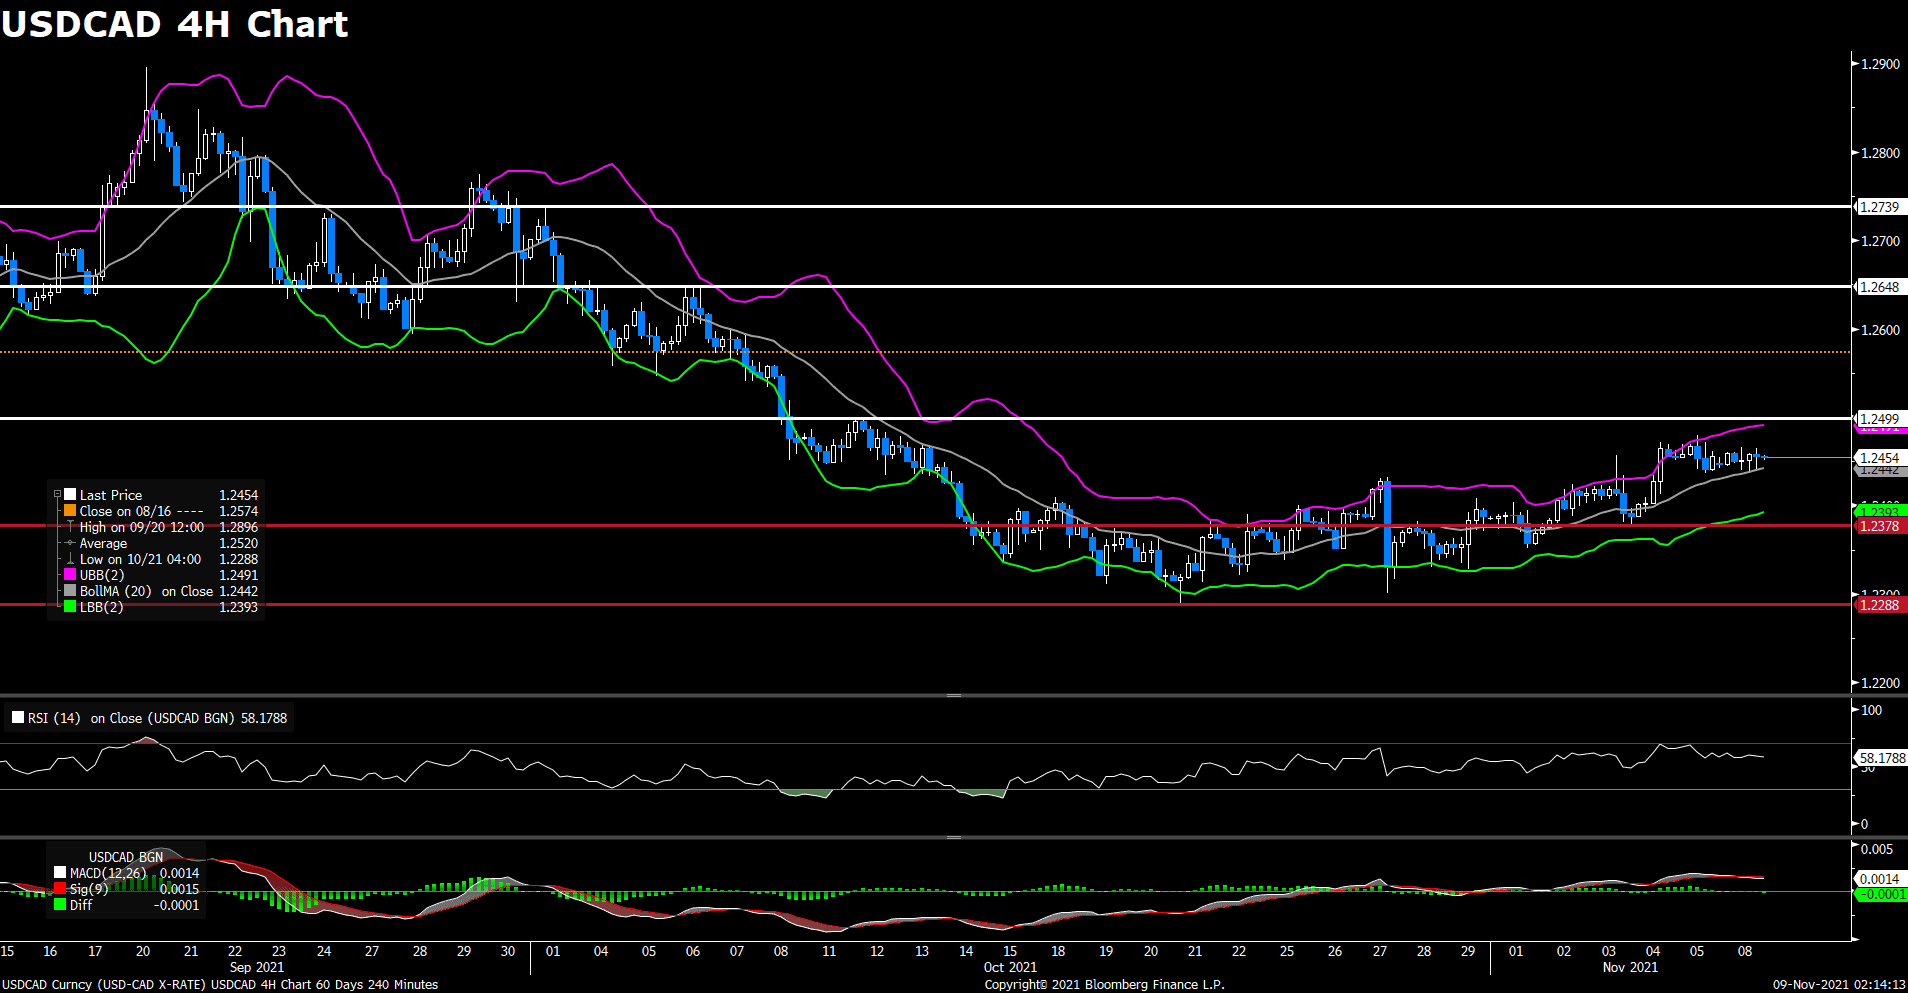
USDCAD (4- Hour Chart)
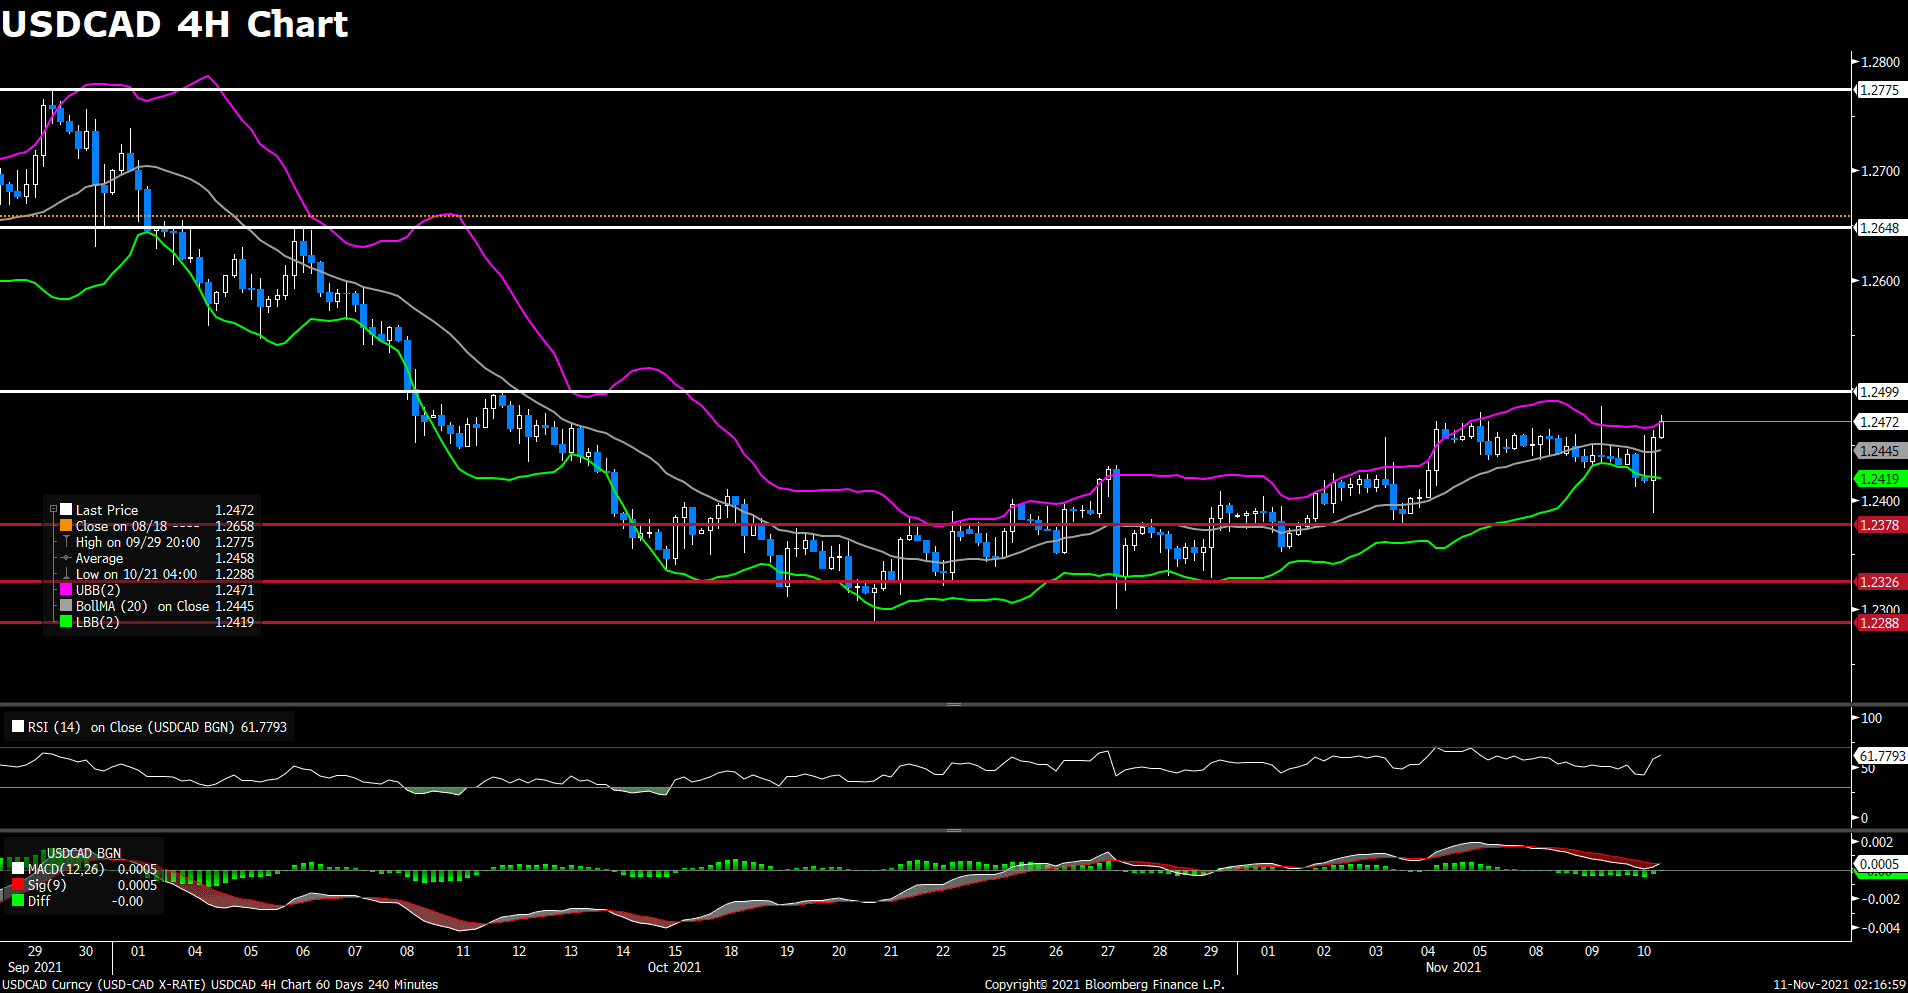
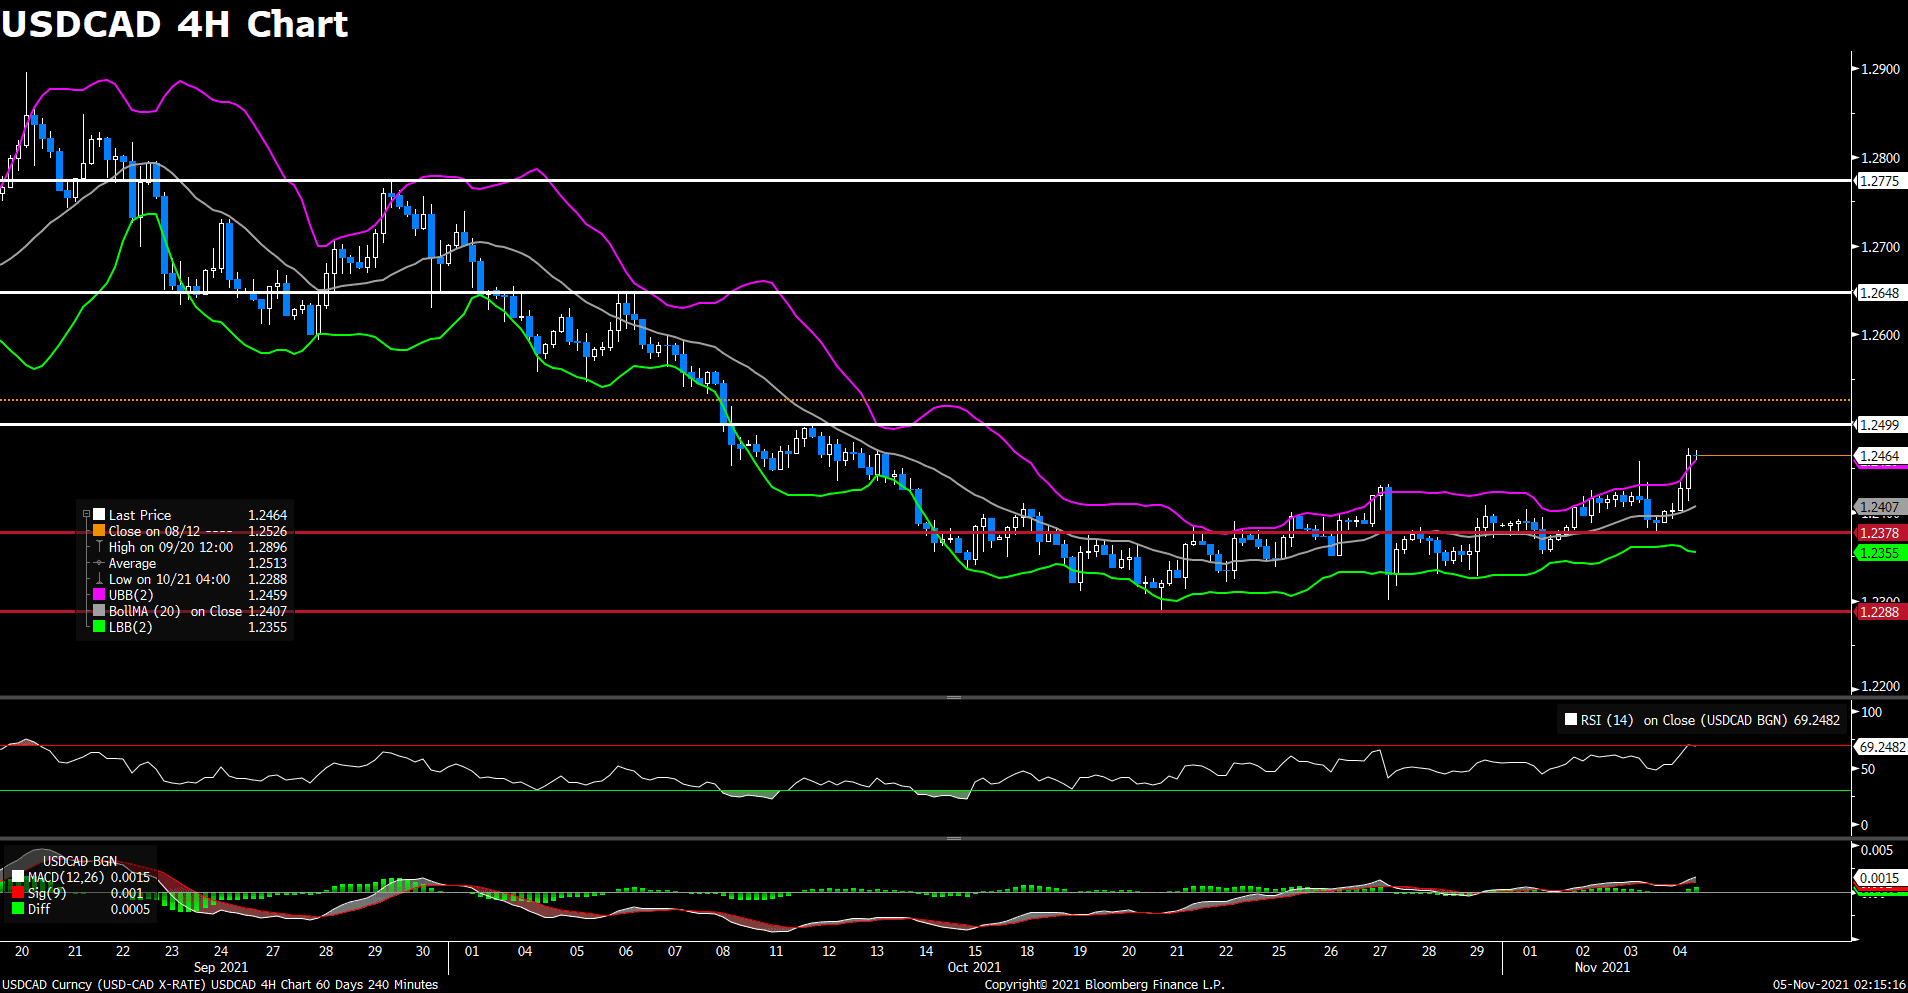
The pair USD/CAD advanced on Wednesday amid US dollar strength, touching a fresh daily top at the time of writing. Despite dropping to a six-day low after the US CPI report, the pair rebounded back above 1.245 level as the DXY index regain upside momentum. On top of that, falling crude oil prices weighed on the Loonie after the latest official weekly US crude oil inventory report released. The report showed that crude oil stocks had risen by just over 1M barrels last week. But crude oil’s near-term prospects should remain bullish given the fact that global oil demand is recovering to pre-pandemic levels.
For technical aspect, RSI indicator 60 figures as of writing, suggesting bull movement ahead. Looking at the MACD indicator, a golden cross is forming in the histogram, which indicates a bull market. As for the Bollinger Bands, the price is moving out of the bands so a strong trend continuation can be expected. In conclusion, we think market will be bullish as the pair may try to re-test the 1.2499 resistance, a recovery above 1.2499 should strengthen the positive tone.
Resistance: 1.2499, 1.2648, 1.2775
Support: 1.2378, 1.2326, 1.2288
Economic Data
|
Currency
|
Data
|
Time (GMT + 8)
|
Forecast
|
|
AUD
|
Employment Change (Oct)
|
08:30
|
50K
|
|
GBP
|
GDP (QoQ) (Q3)
|
15:00
|
1.5%
|
|
GBP
|
GDP (YoY) (Q3)
|
15:00
|
6.8%
|
|
GBP
|
Manufacturing Production (MoM) (Sep)
|
15:00
|
0.2%
|
|
EUR
|
ECB Forecast
|
18:00
|
|
|
|
|
|
|
|
|
|
|
|
|
|
|
|
|
|
|
|
|
|
|
|
|
|
|
|
|
|
|
|
|
|