US equities were up on Monday due to the strength of technology and mega caps stocks. The S&P 500 gained 0.78 percent, while the Nasdaq 100 gained 1.54 percent and the Dow Jones Industrial Average gained 0.33 percent.
The US bond market is a source of concern since current conditions are particularly concerning for the long-term growth of the US economy. The 5-year US bond yield is currently slightly higher than the 30-year yield, with the 5-year yield at 2.56 percent and the 30-year yield at 2.55 percent.

However, when compared to rates between 2- and 10- years, the current situation is still better; however, crossing between 5- and 30-year yields can be an early warning of a future recession in the long term.
Rising inflation rates due to high energy prices, supply chain disruptions, and the prospect of an economic downturn due to the conflict in Eastern Europe are the key causes of the inverted yield curve, as well as the Fed’s proactive stance.
The impact of an inverted yield curve may cause investors to stockpile cash again, putting pressure on the US stock market in the future.
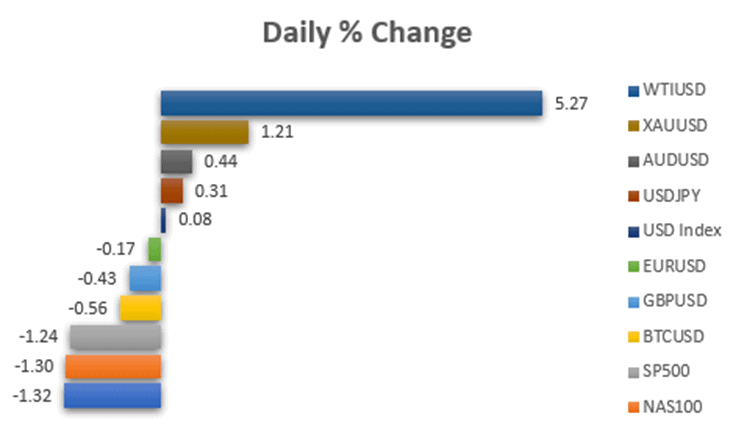
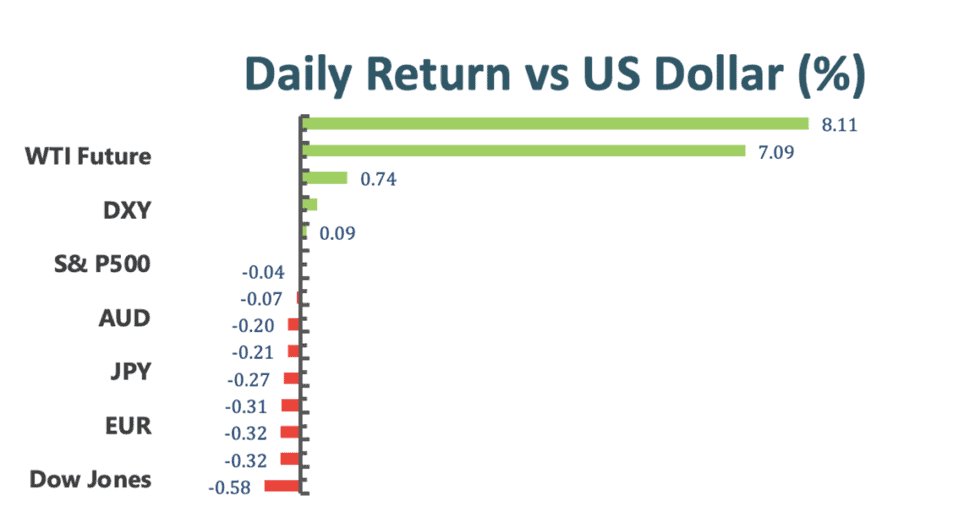
Main Pairs Movement
The TSLA jumped as much as 2.38 percent in response to plans to seek shareholder approval for procedures that would allow for another stock split.
AAPL continued to rise until the tenth day, setting a record for the longest period since 2010, with a 1.75 percent gain.
The US dollar (WTI) plummeted as much as 6.68 percent as the virus spread across China, the world’s largest crude oil importer.
Because of the sustained negative feeling toward the yen, the USDJPY rose as much as 1.54 percent.
The biggest performer was BTCUSD, which gained 3.90 percent due to the market’s perception of adverse global economic prospects, particularly in the United States.
Technical Analysis
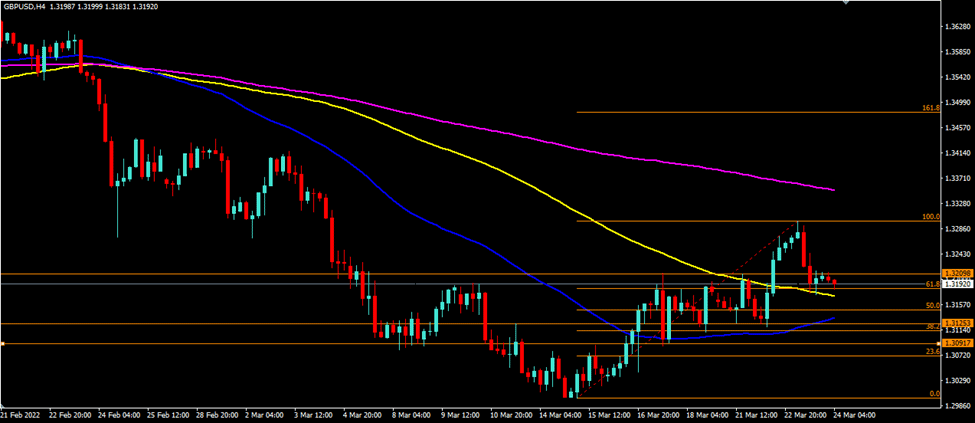
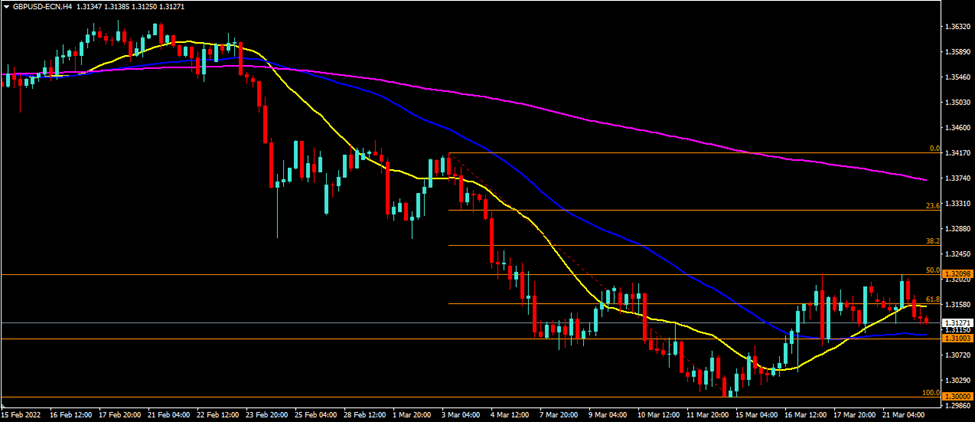
GBPUSD (4-Hour Chart)

The lowering cable broke through our support region at 1.3125-1.3150 but became somewhat rejected around 1.3080. It is now expected that the cable will move in the range of 1.3080 – 1.3126, with a possible breakout. A breach of the 1.3126 level indicates that the probable resistance is 1.3188, while a break below 1.3080 indicates that the cable is heading to the support area of 1.3000 – 1.3020. The cable is trading below its 50-day, 100-day, and 200-day simple moving averages (SMAs) on the four-hour chart.
Resistance: 1.3126, 1.3188
Support: 1.3080, area (1.3000 – 1.3020)
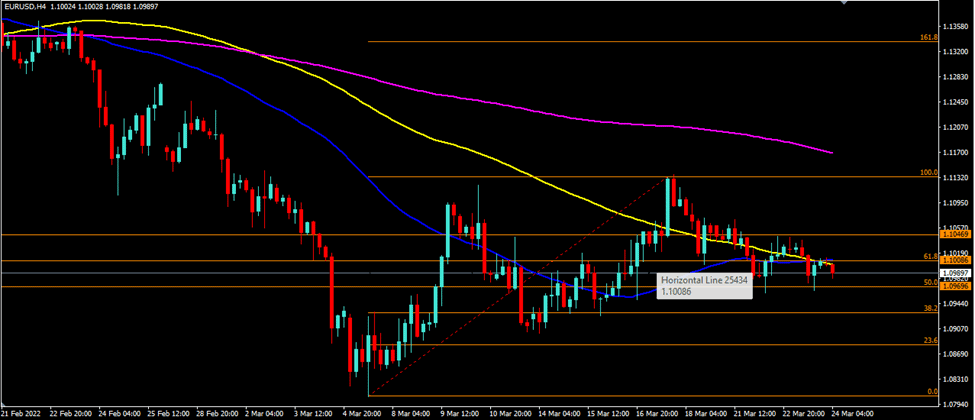
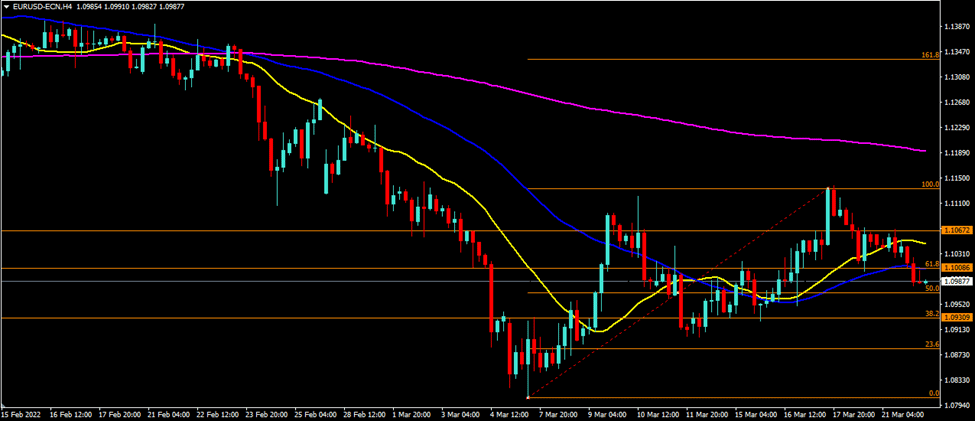
EURUSD (4-Hour Chart)

On Monday, the EURUSD was flat, hovering around the 1.0969 level. At the time of writing, the EURUSD is attempting to break through the 100-day Simple Moving Average (SMA). Immediate resistance is still at 1.1008 and 1.1046, while support is at 1.0925 and 1.0899. On the four-hour chart, EURUSD is now trading below its 50-day and 200-day simple moving averages (SMAs) while attempting to break above the 100-day SMA.
Resistance: 1.1008. 1.1046
Support: 1.0925, 1.0899
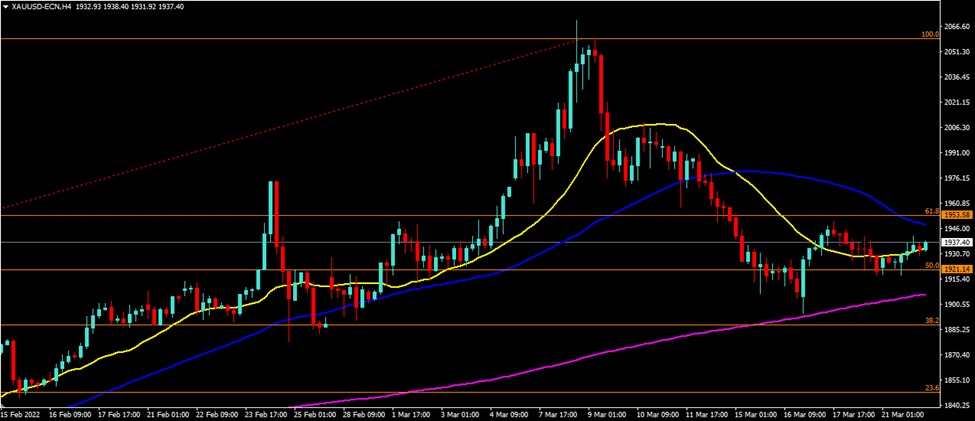
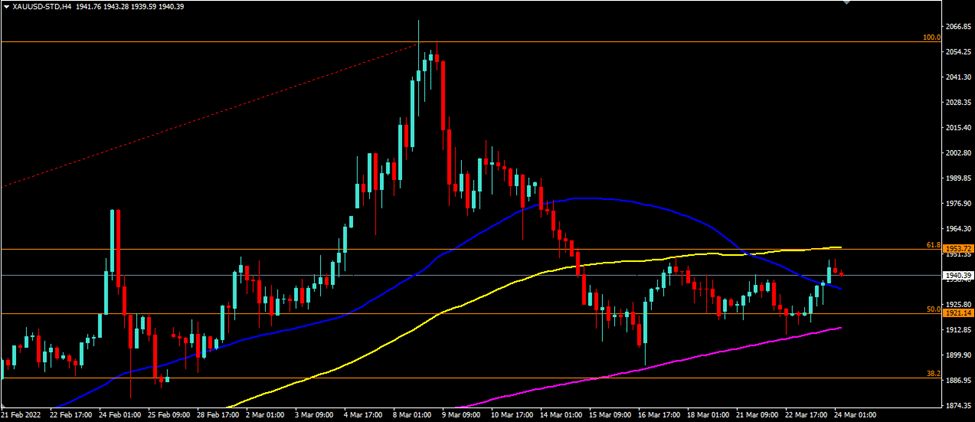
XAUUSD (4-Hour Chart)

XAUUSD fell more on Monday, approaching our support level of $1921. Currently, the level of $1921 can sustain the weakening of the XAUUSD, but more weakness is still possible given the state of the crisis between Russia and Ukraine, which has begun to diminish. XAUUSD is projected to trade in a range of $1921 to $1936 for the foreseeable future until one of the levels is breached. If it breaks above $1936, the next resistance levels are at $1948 and $1964, while a breach below $1921 will continue to support levels of $1910 and $1893. On the four-hour chart, XAUUSD is now trading below its 50-day and 100-day simple moving averages but slightly above its 200-day SMA.
Resistance: area $1936, $1948, $1964
Support: $1921, $1910, $1893